USDOT Region V Regional University Transportation Center Final Report IL IN WI MN MI OH NEXTRANS Projects No. 141OSUY2.1 and No. 172OSUY2.2 RESEARCH, EDUCATION AND OUTREACH FROM CAMPUS TRANSIT LABORATORY And CAMPUS TRANSIT LABORATORY: INFRASTRUCTURE FOR RESEARCH, EDUCATION, AND OUTREACH By Mark R. McCord, Principal Investigator Professor of Civil, Environmental, and Geodetic Engineering The Ohio State University [email protected]and Rabi G. Mishalani, Principal Investigator Professor of Civil, Environmental, and Geodetic Engineering The Ohio State University [email protected]Report Submission Date: March 13, 2018
Partial funding for this research was provided by the NEXTRANS Center, Purdue University under Grant No. DTRT12-G-UTC05 of the U.S. Department of Transportation, Office of the Assistant Secretary for Research and Technology (OST-R), University Transportation Centers Program. Additional funding was provided by The Ohio State University (OSU) including the College of Engineering and Transportation and Traffic Management.
The authors are grateful to OSU’s Transportation and Traffic Management for its support of the OSU Campus Transit Lab (CTL) and Elizabeth Kelley-Snoke, Tom Holman, Timothy Smith, and Sean Roberts for their efforts in supporting the development and continued maintenance of the CTL, which resulted in the availability of the data used in this project.
The contents of this report reflect the views of the authors, who are responsible for the facts and the accuracy of the information presented herein. This document is disseminated under the sponsorship of the Department of Transportation, University Transportation Centers Program, in the interest of information exchange. The U.S. Government assumes no liability for the contents or use thereof.
3
TABLE OF CONTENTS
1. INTRODUCTION …………………………………………………………………………….. 4
2. OUTREACH AND DISSEMINATION ……………………………………………………... 13
3. RESEARCH ACTIVITIES ………………………………………………………………….. 20
FIGURE 1: The Ohio State University Campus Area Bus Service (CABS) route map for the academic year 2013-2014 ……………………………………………………………………….. 5
LIST OF TABLES
TABLE 1.2-1: Summary of numbers of bus trips and passengers sampled using an OBS procedure to collect OD flow information by academic term and route; CLS: Campus Loop South, CLN: Campus Loop North, NE: North Express, CC: Central Connector, ER: East Residential, MC: Medical Center ………………………………………………………………............................... 6 TABLE 1.2-2: Summary of numbers of bus trips and passengers sampled using mobile device Wi-Fi scanner during Autumn 2013 and Spring 2014 by route and time-of-day; CLS: Campus Loop South, CC: Central Connector ………………………………………………………………….. 11
TABLE 1.2-3: Summary of numbers of bus trips and passengers sampled to collect APC and AVL data by academic term and route; CLS: Campus Loop South, CLN: Campus Loop North, NE: North Express, ER: East Residential, BV: Buckeye Village, CC: Central Connector …………. 11
4
1. INTRODUCTION
1.1 Background
Increased use of public transportation services is an effective means of achieving sustainable transportation in cities around the world. To increase the use of public transportation under resource constraints, it is important to improve the understanding of public transportation supply characteristics and demand behavior and make use of this understanding to improve service planning, design, and operations functions. Analyzing and interpreting in situ public transportation conditions that are readily accessible and observable can greatly improve this understanding.
Project investigators previously worked with The Ohio State University (OSU) Campus Area Bus Service (CABS) and a private technology provider to equip the CABS network with state-of-the-art sensing, communications, and passenger information systems that are presently used to provide real-time bus arrival information to CABS users and ridership and location information to CABS operators and planners. In addition to being used for service planning, design, and operations, automatic vehicle location (AVL) and automatic passenger count (APC) data are downloaded nightly and archived by project investigators. The investigators couple these high-resolution and extensive data with manually collected field data (using a variety of techniques) and data obtained from web-based surveys for research, education, and outreach.
The physical and data infrastructure and the strong partnership between service providers and project investigators, which developed over many years, have led to the establishment of the OSU Campus Transit Lab (CTL), a unique living lab that supports multiple internally and externally funded activities (CTL, 2017). This project is devoted to continued general data collection and targeted outreach, research, and educational activities designed to take advantage of existing CTL infrastructure and to sustain and to expand the infrastructure.
1.2 Data Acquisition
The CTL investigators continued regular manual and automatic data collection to form databases for present and future research, outreach, and educational activities. Figure 1.2-1 shows the CABS system map for the academic year occurring during the timeframe of this project.
5
FIGURE 1: The Ohio State University Campus Area Bus Service (CABS) route map for the academic year 2013-2014
Using an onboard survey (OBS) procedure presented in McCord et al. (2010), undergraduate and graduate students continued to board CABS buses to collect direct observations of passenger origin-destination (OD) flows on four CABS routes. Table 1.2-1 summarizes the numbers of bus trips and passengers sampled during this project to collect OD flow information.
237 E. 17th Ave. OSU Vets
5:30
AM
-7:0
0PM
WKDYS AFTER 7PM
WKDYS AFTER 7PM - OVN/WKEND
OVERNIGHTS/WEEKENDS
30Cannon & 12th Ave.
112 Chittenden Ave.
215 King & Michigan Ave.
216 Neil & 8th Ave.
51RPAC Plaza
61Neil & 17th Ave.
56Mason Hall
5317th & College Rd.
59Stillman Hall54 Arps Hall
58Koffolt Lab
60Physics Research
37 Doan Hall
52 University Hall
14 Blankenship Hall
44Ohio Union43
27 Veterinary Medical Building
26
22Drake Perf. & Event Ctr. 23 Mid Towers
77 Buckeye Village North
76 Buckeye Village South
79Olentangy & Borror Dr.
78Woody Hayes Athletic Center
74Buckeye Lot 5
75Buckeye Lot Loop
72 Book Depository
71 Service Annex
70 Fisher Commons
73 Kenny & Ackerman Rd.
90 Archer HouseOVERNIGHT/WEEKENDS ONLY
57 Knowlton Hall
55Blackburn House
36
119Clinton St.
127Chittenden Ave.
12515th Ave.
12417th Ave.
12319th Ave.
122Lane Ave.
121Oakland Ave.
120Maynard Ave.
12613th Ave.
113 13th Ave.
114 15th Ave.
115 17th Ave.
116 Lane Ave.
117 Northwood Ave.
118 Maynard Ave.
45 Honors House
42 Hale Hall
33Hamilton Hall
40 Neil & 10th Ave.
41 Mack Hall
34 9th/Meiling Hall
32 Med Ctr & 9th Ave.
35
31 Med Ctr & Cannon Dr.
128
111 11th & Indianola Ave.110 11th & High St.
129
13 Carmack 1
10 Bevis Hall
12Carmack 4
94
Carmack 5
95
211Neil & 7th Ave.
212Neil & 5th Ave.2135th & Michigan Ave.
80Ackerman Complex
210
21
24St. John Arena25
20 Ag Campus
91Taylor TowerOVERNIGHT/WEEKENDS ONLY
92Watts HallOVERNIGHT/WEEKENDS ONLY
81Ackerman & Olentangy
11Carmack Corner
2013-2014SERVICE HOURS AND FREQUENCIES
NE NORTH EXPRESSHOURS OF OPERATION AM MID PM LATE OVNWEEKDAY 7 a.m. - 7 p.m. — 05 — — —WEEKEND NO SERVICE — — — — —BREAK NO SERVICE — — — — —SUMMER NO SERVICE — — — — —
CLS CAMPUS LOOP SOUTHHOURS OF OPERATION AM MID PM LATE OVNWEEKDAY 5:30 a.m. - Midnight 30 09 11 15 —WEEKEND NO SERVICE — — — — —BREAK 5:30 a.m. - 7 p.m. 30 15 — — —SUMMER 5:30 a.m. - 7 p.m. 30 11 — — —
CC CENTRAL CONNECTORHOURS OF OPERATION AM MID PM LATE OVNWEEKDAY 7 a.m. - 7 p.m. — 12 — — —WEEKEND NO SERVICE — — — — —BREAK NO SERVICE — — — — —SUMMER NO SERVICE — — — — —
ER EAST RESIDENTIALHOURS OF OPERATION AM MID PM LATE OVNWEEKDAY (M-TR) 7 a.m. - Midnight — 09 30 30 —WEEKDAY (FRI) 7 a.m. - 2 a.m. — 09 30 30 30x
MC MED CENTER EXPRESSHOURS OF OPERATION AM MID PM LATE OVNWEEKDAY 5:30 a.m. - Midnight 10 10 15 20 —WEEKEND NO SERVICE — — — — —BREAK 5:30 a.m. - Midnight 10 10 15 20 —SUMMER 5:30 a.m. - Midnight 10 10 15 20 —
CLN CAMPUS LOOP NORTHHOURS OF OPERATION AM MID PM LATE OVNWEEKDAY ALL TIMES 30 09 11 15 30**
WEEKEND ALL TIMES 30 15 15 15 30**
BREAK 7 a.m. - 7 p.m. — 15 — — —SUMMER* 7 a.m. - 7 p.m. — 11 — — —**Due to a driver break, service will deviate from advertised intervals between 1 - 2 a.m. and between 4 – 5 a.m.
Campus Area Bus Service will not operate during the following 2013-2014 holidays: Thanksgiving (November 28-29, 2013), Christmas (December 24-25, 2013), New Year’s Day (January 1, 2014), Memorial Day (May 26, 2014) and Independence Day (July 4, 2014). CABS will run weekend service on all other holidays.
Information current as of 8/23/13. Subject to change without notice. Updates posted at ttm.osu.edu.
FREQUENCY KEYAM = 5:30 a.m. – 7 a.m.
MID = 7 a.m. – 7 p.m.
PM = 7 p.m. – 10 p.m.
LATE = 10 p.m. – Midnight
OVN = Midnight – 5:30 a.m. xOnly until 2 a.m. for ER
*Campus Area Bus Service will not operate weekend service during the summer.
REAL TIME ARRIVAL INFORMATION
Real-time arrival and route information is available at trip.osu.edu, by texting OSUTRIP*[bus stop#] (i.e. OSUTRIP*10) to 41411 or via OSU Mobile for iOS or Android.
MAP LEGENDBus Stop Name & NumberText OSUTRIP *[bus stop #] (i.e. OSUTRIP*10) to 41411 to receive bus stop arrival times
Bus Stop Location(points to side of street that bus stop is located on)
Bus Stop Serviced on Both Sides of the Street
Bus Stop with Limited Service
CABS/COTA Transfer Stops
Bus Route Direction
Bus Route
Part Time Alignment
51RPAC Plaza
61Neil & 17th Ave.
56Mason Hall
5317th & College Rd.
59Stillman Hall54 Arps Hall
58Koffolt Lab
60Physics Research
52 University Hall
57 Knowlton Hall
55Blackburn House
92Watts HallOVERNIGHT/WEEKENDS ONLY
51RPAC Plaza
61Neil & 17th Ave.
56Mason Hall
5317th & College Rd.
59Stillman Hall54 Arps Hall
58Koffolt Lab
60Physics Research
52 University Hall
57 Knowlton Hall
55Blackburn House
92Watts HallOVERNIGHT/WEEKENDS ONLY
SEE INSET MAP
6
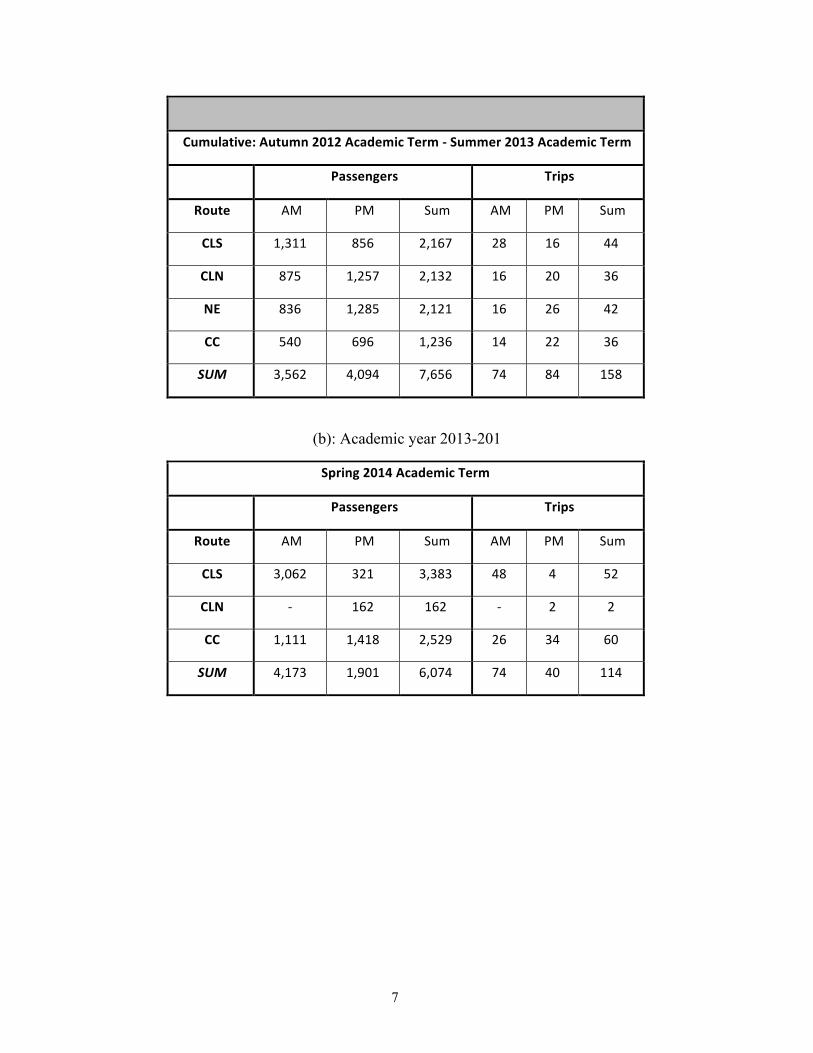
TABLE 1.2-1: Summary of numbers of bus trips and passengers sampled using an OBS procedure to collect OD flow information by academic term and route; CLS: Campus Loop
South, CLN: Campus Loop North, NE: North Express, CC: Central Connector, ER: East Residential, MC: Medical Center
The direct OD flow data, as well as less quantitative observations made by data collectors who were inserted into regular bus operations, are used to validate passenger OD estimation methodologies, to provide information to CABS managers for service planning, design, and operations, and to generate topics for research and outreach studies. During the timeframe of this project, CTL investigators collected direct OD passenger flow observations and aggregated the observations into matrices summarizing OD passenger flow probabilities by academic term, route, and time-of-day period (morning or afternoon).
CTL investigators also collected new passenger OD flow related data previously not collected as part of CTL. Specifically, a mobile device Wi-Fi signal scanner configured for a different project was used on this project to collect mobile device Wi-Fi signal data during by carrying the scanner on CABS buses while conducting the OBS. Table 1.2-2 summarizes the number of bus trips and number of detected passengers where Wi-Fi signals have been collected by route and time-of-day during Autumn 2013 and Spring 2014 semesters.
11
TABLE 1.2-2: Summary of numbers of bus trips and passengers sampled using mobile device Wi-Fi scanner during Autumn 2013 and Spring 2014 by route and time-of-day; CLS:
CTL investigators also continued to obtain and archive the APC and AVL data automatically downloaded from the buses on a nightly basis. A summary of the numbers of bus trips and passengers for which APC information was obtained is shown in Table 1.2-3. High resolution AVL data were also collected for these six CABS routes on a total of approximately 71,000 bus trips.
TABLE 1.2-3: Summary of numbers of bus trips and passengers sampled to collect APC and AVL data by academic term and route; CLS: Campus Loop South, CLN: Campus Loop
North, NE: North Express, ER: East Residential, BV: Buckeye Village, CC: Central Connector
(a): Academic year 2012-2013
Term Autumn2012 Spring2013Route Trips Passengers Trips Passengers
Estimated OD flow matrices for various routes, terms, and time-of-day periods are
produced from these data as needed. The APC and AVL data are used for a variety of outreach investigations that arise on a one-time basis. In addition, the data are processed on a regular basis to support ongoing research and development investigations and course-based educational activities. Investigations and activities conducted for this project are discussed in the following sections.
1.3 Report Overview
This report documents the research, outreach, and educational activities conducted within the context of the OSU CTL based on recently and previously manually and automatically collected data. Section 2 details various outreach activities between the CTL investigators and
13
TTM and CABS staff and managers and in one instance between the CTL investigators and Washington Metro. This section also lists technical presentations, papers, and theses written as a result of CTL activities. Section 3 summarizes the various research activities conducted in the CTL within the scope of this project. The data collected and processed by CTL investigators are used to support and develop modules, assignments, and exam questions for use in undergraduate and graduate courses. These educational activities are described in Section 4. Finally, the outreach, research, and educational activities are summarized in Section 5.
2. OUTREACH AND DISSEMINATION
2.1 Night Service Ridership on the East Residential Route
The East Residential bus route connects an off-campus, mostly residential neighborhood east of the OSU campus to and from the main campus. It also serves a commercial area that students often frequent for night-life activities. In spring 2013, there was discussion at the university level related to cutting service on Friday and Saturday nights to save operating costs. The question was whether the ridership to and from campus during the Friday and Saturday night hours was too low to warrant continued service. Transportation and Traffic Management (TTM) management asked us to provide ridership statistics on Friday and Saturday nights as quantitative input to the policy assessment on the desirability of cutting the service. From our long-standing relationship with TTM, TTM administrators were familiar with our ability to process APC data collected on CABS buses. We used our already developed codes to determine ridership statistics from our regularly collected APC data and provided summaries of these statistics to TTM for their deliberations with the University. (The ultimate decision was to retain the weekend night service.)
2.2 Campus Planning
OSU administrators undertook a multi-year, long-range planning effort to determine revised physical infrastructure, transportation services, and parking policy at the university. Because of the recognition of the CTL outreach and research activities, the two project investigators were asked to serve on a transportation group that met with the consultant on several occasions to provide input and feedback to proposed ideas. The consultant became aware of our ability to estimate bus passenger movements around campus from APC data, and we were asked to provide bus route level passenger origin-destination (OD) flows for the major routes by time-of-day period. We again used our already developed codes and regularly collected data to produce these estimates, summarized the results in an easy-to-interpret format (multiple tabs in an Excel document with “read me” text), and delivered the results to the consultant in January 2014.
2.3 CABS Ridership
The OSU CTL research team has acquired a long-standing experience processing raw APC data collected on CABS buses. As a result, the team developed techniques to detect and errors in the APC data and methods to correct for many of these errors rather than outright deleting records where errors are suspected. Under certain conditions the APC errors, if left undetected and uncorrected, result in gross misrepresentations of ridership volumes and patterns when the off-the-shelf ridership software are used. On several occasions during this project, TTM and CABS staff had difficulties with the commercial software it uses to produce ridership numbers and suspected erroneous ridership reports based on their understanding of the travel patterns on campus. TTM
14
staff asked our team to investigate the presence of errors. The result of this exercise lead to the development of APC error detection and correction tools that could be ready applied to independently produce ridership results. More specifically, we used are regularly collected APC data to produce estimates of system ridership and of ridership by bus route and delivered these estimates to TTM for their analysis, reporting, and presentation purposes. Beginning in summer 2016, we began using the regularly collected APC data to summarize boarding and alighting volumes in a “pivot table” format. We designed the pivot tables so that the user could quickly analyze boarding and alighting data by route, time-of-day, and stop. On a monthly basis, we produced the tables and sent them to TTM, who found them useful for quickly conducting spatial-temporal ridership investigations, which they could not readily do with their existing commercial software and reports.
2.4 Campus Sustainability
In the summer of 2015, The Ohio State University’s President and Provost’s Council on Sustainability formed a university-wide committee to develop goals to enhance its reputation as a “world leader in developing durable solutions to the pressing challenges of sustainability and in evolving a culture of sustainability through collaborative teaching, pioneering research, comprehensive outreach, and innovative operations, practices, and policies.” Because of the recognition of the CTL in developing innovative approaches to transit-based research, education, and outreach, one of the project investigators was asked to be a member of the small group of individuals, including the director of TTM, representing campus transportation when developing “resource stewardship” goals. The goals established, which can be found at https://www.osu.edu/assets/pdf/sustainability/sustainabilitygoals.pdf, were accepted by the university in November 2015.
2.5 Campus Bike-sharing
The Transportation and Traffic Management (TTM) office that operates CABS on campus was requested to take on the management of the operations of the bike-sharing service acquired for the OSU campus more than two years ago. Given the success of the CTL in research, education, and outreach, TTM and university leadership solicited the engagement of the CTL research team to advise on matters that relate to the data management, storage, and sharing for the purpose of supporting outreach activities and eventually research and education. Following data quality concerns, the data management aspect of the effort was temporarily put on hold. The effort is now continuing in the form of developing a blueprint for implementation.
2.6 Washington Metro Bus Ridership Reporting and OD Flow Estimation Documentation
Washington Metro uses the same APC technology and ridership reporting software used for CABS. Comparing the ridership results the CTL team produced independently from raw CABS APC data (see section 2.3 above) to those produced by the off-the-shelf reporting software led to the identification of the limitations of the software. In light of Washington Metro’s bus transit service planning and design team members suspecting similar problems with their ridership reports, the CTL research team provided Washington Metro with the comparisons carried on for CABS and the identified limitations of the off-the-shelf ridership reporting software to assist in the troubleshooting the Washington Metro service planning and design staff were going through.
15
In addition, Washington Metro service planning and design staff expressed specific interest in inferring passenger OD flows on bus routes using APC data and asked to OSU CTL investigators for information that could help them do so. We shared with them several of our extensive publications on conducting such inferences. These publications report on studies that used CTL data.
2.7 Presentations, Papers, and Theses
1. Burch, G., Chen, C., Ettefagh, M., Reinhold, H., McCord, M.R., Mishalani, R.G., April 23, 2012. Campus Transit Lab (CTL): Select Activities. Presentation to OSU donor.
2. McCord, M.R., Mishalani, R.G., April 20, 2012. Campus Transit Lab (CTL): Select Research Activities. Presentation to Xerox, Columbus, OH.
3. Mishalani, R.G., McCord, M.R., April 20, 2012. Overview of Campus Transit Lab (CTL) at The Ohio State University. Presentation to Xerox, Columbus, OH.
4. McCord, M.R., Mishlani, R.G., Goel, P.K., et al., April, 10, 2012. Campus Transit Lab (CTL): Research, Education, and Outreach Activities. Presentation to EU COST project team representative, Columbus, OH.
5. Mishalani, R.G., McCord, M.R., Goel, P.K., April, 9, 2012. Overview of Campus Transit Lab (CTL) at The Ohio State University. Presentation to EU COST project team representative, Columbus, OH.
6. McCord, M.R., Mishalani, R.G., and Hu, X., 2012. Grouping of Bus Stops for Aggregation of Route-Level Passenger Origin-Destination Flow Matrices. Transportation Research Record, No. 2277, pp. 38-48, 2013.
7. Ji, Y., Mishalani, R.G., McCord, M.R., 2012. Transit Route-level Passenger Origin Destination Flow Estimation: Empirical Evaluation of a Heuristic Expectation Maximization Methodology. Proceedings of the 12th Conference on Advanced Systems for Public Transport, Santiago, Chile.
8. McCord, M.R., and Mishalani, R.G., August 27, 2012. The OSU Campus Transit Lab (CTL) and Transit-related Activities at The Ohio State University. Presentation to Federal Transit Administration representative, The Ohio State University, Columbus, OH.
9. Ettefagh, M., September 24, 2012. Effect of Passenger Information System (TRIP) on OSU Travelers' Attitudes and Perceptions. Presentation to OSU donor and development personnel, The Ohio State University, Columbus, OH.
10. Hertler, G., September 24, 2012. Factors Affecting Intra-Campus Origin Destination Passenger Flows. Presentation to OSU donor and development personnel. The Ohio State University, Columbus, OH.
11. McCord, M.R., and Mishalani, R.G., September 24, 2012. Campus Transit Lab (CTL): Introduction to Select Activities and Institutional Updates. Presentation to OSU donor and development personnel, The Ohio State University, Columbus, OH.
16
12. Reinhold, H., September 24, 2012. Combining Route-specific OD Flows into an Integrated OD Flow Matrix. Presentation to OSU donor and development personnel, The Ohio State University, Columbus, OH.
13. Ji, Y., Mishalani, R.G., McCord, M.R., 2012. Transit Route-level Passenger Origin Destination Flow Estimation: Empirical Evaluation of a Heuristic Expectation Maximization Methodology. 12th Conference on Advanced Systems for Public Transport, Santiago, Chile.
14. Cheng, C., April 2013. Using Archived Bus Automatic Vehicle Location Data to Identify Indications of Recurrent Congestion. Ph.D. dissertation, The Ohio State University, Columbus, OH.
15. Ettefagh, M., April 2013. Effects of Real-time Passenger Information Systems on Perceptions of Transit Services: Investigations of The Ohio State University Community. M.S. thesis, The Ohio State University, Columbus, OH.
16. Hertler, G., April 2013. Effect of Service, Temporal, and Weather Variables on Short Bus Transit Passenger Trips: Investigations of OSU’s Intra-campus Transit Demand. M.S. thesis, The Ohio State University, Columbus, OH.
17. Reinhold, H.E., April 2013. Combining Transit Route Origin-Destination Passenger Flow Matrices into Integrated Area or Corridor Matrices: Evaluating Flow Patterns on the OSU Campus and along a Columbus Corridor. M.S. thesis, The Ohio State University, Columbus, OH.
18. Ji, Y., Mishalani, R.G., and McCord, M.R., 2013. Estimating Transit Route-level OD Flow Matrices from APC Data on Multiple Bus Trips Using the IPF Method with an Iteratively Improved Base. Transportation Research Board 92nd Annual Meeting, Washington, D.C.
19. McCord, M.R., Mishalani, R.G., June 3, 2013. OSU Campus Transit Lab (CTL): Background, Data, Applications, and Outreach. Presentation to OSU Chief Data Officer, The Ohio State University, Columbus, OH.
20. Ji, Y., Mishalani, R.G., McCord, M.R., 2014. Estimating Transit Route OD Flow Matrices from APC Data on Multiple Bus Trips Using the IPF Method with an Iteratively Improved Base: Method and Empirical Evaluation. Journal of Transportation Engineering, ASCE, No. 140, Vol. (5), pp. 040140081-040140088.
21. Ji, Y. Mishalani, R.G., McCord, M.R., 2013. Iteratively Improving the Base Matrix of the IPF Method for Estimating Transit Route-Level OD Flows from APC Data. Select Proceedings of the World Conference on Transportation Research, Rio de Janeiro, Brazil, 2013.
22. McCord, M.R., and Mishalani, R.G., 2013. Using APC Data for Estimating Boarding to Alighting Bus Passenger Flows. American Public Transportation Association 2013 ITS Transit Best Practices Workshop, Detroit, MI.
23. Ettefagh, M., Mishalani, R.G., McCord, M.R., 2013. Effects of Transit Passenger Information System on User and Nonuser Preferences and Perceptions. Ohio Transportation Engineering Conference, Columbus, OH.
17
24. McCord, M.R., Mishalani, R.G., August 2, 2013. OSU Campus Transit Lab (CTL): Background, Data, Applications, and Outreach. Presentation to OSU Chief Data Officer Team, The Ohio State University, Columbus, OH.
25. McCord, M.R., Mishalani, R.G., November 13, 2013. Overview of Campus Transit Lab related activities at OSU. Presentation to Catherine Ross, Professor, City and Regional Planning and Director, Center for Quality Growth and Regional Development, Georgia Institute of Technology.
26. Mishalani, R.G., McCord, M.R., October 18, 2013. Overview of Campus Transit Lab related activities at OSU. Presentation to Steve Schneider, President of Schneider Engineering, PLLC and OSU alum.
27. Mishalani, R.G., McCord, M.R., McLaughlin, K.A., Reinhold, H. (The Ohio State University Transit Lab), January 21, 2014. Comparison of COTA Boarding-to-Alighting (B2A) and APC Data. Teleconference presentation to the Ohio Department of Transportation and ETC.
28. Mishalani, R.G., McCord, M.R., McLaughlin, K.A., Reinhold, H. (The Ohio State University Transit Lab, in collaboration with AECOM and ETC), May 13, 2014. Transit Passenger Flow Estimation and Characteristics Expansion. Research Review Presentation to the Ohio Department of Transportation, Columbus, OH.
29. Mishalani, R.G., McCord, M.R., Colman, M.G., Yuan, Y. (The Ohio State University Transit Lab), November 5 and 12, 2014. OSU Progress Update on Transit Passenger Flow Estimation and Characteristics Expansions Project. Teleconference presentation to the Ohio Department of Transportation, Mid-Ohio Regional Planning Commission, Federal Transit Agency, and other Project Team Members (AECOM, ETC).
30. McCord, M.R., Mishalani, R.G., Ettefagh, M, 2015. The Effect of Real-time Passenger Information Systems on the Perceptions of Transit’s Favorable Environmental and Traffic Reduction Roles. Transportation Research Board 94th Annual Meeting, Washington, D.C.
31. McCord, M.R., Mishalani, R.G., Ettefagh, M., 2015. The Effect of Real-time Passenger Information Systems on the Perceptions of Transit’s Favorable Environmental and Traffic Reduction Roles. Transportation Research Record, No. 2538, pp. 102–109.
32. Ji, Y., Mishalani, R.G., McCord, M.R., 2015. An Efficient Transit Passenger Origin-Destination (OD) Flow Estimation Method Combining Automatic Passenger Count (APC) and Onboard OD Flow Survey Data: Empirical Evaluation Under Varying APC and Survey Sample Sizes. Transportation Research Board 94th Annual Meeting, Washington, D.C.
33. Ji, Y., Mishalani, R.G., McCord, M.R., 2015. Transit Passenger Origin-Destination Flow Estimation: Efficiently Combining Onboard Survey and Large Automatic Passenger Count Datasets. Transportation Research Part C: Emerging Technologies (Special Issue: Big Data in Transportation and Traffic Engineering), Vol. 58, pp. 178-192.
34. McCord, M.R., Bicici, S., Mishalani, R.G., 2015 Using Error Distributions with Model Output to Acknowledge Prediction Uncertainty: Results using Travel Demand and Transit Flow
18
Models. 15th TRB National Transportation Planning Applications Conference, Atlantic City, NJ.
35. Mishalani, R.G., McCord, M.R., Reinhold, H., 2016. Transit Route-level OD Flow Determination from Passengers’ Mobile Devices’ Wi-Fi Signals: Methodology and Empirical Evaluation. Transportation Research Board 95th Annual Meeting, Washington, D.C.
36. Mishalani, R.G., McCord, M.R., Reinhold, T., 2016. Transit Route-level Passenger OD Flow Determination from Mobile Device Wi-Fi Signals: Methodology and Empirical Evaluation. Transportation Research Record, No. 2544, pp. 123-130.
37. Landgraf, A.J., Mishalani., R.G., McCord, M.R., Goel, P.K. 2015. Estimating Transit OD Flows using Boarding and Alighting Data: An Efficient Variational Bayes Method and Clustering-based Extension that Recognizes Multiple Latent OD Flow Matrices. Transportation Research Board 95th Annual Meeting, Washington, D.C.
38. Shay, N.M., 2016. Investigating Real-Time Employer-Based Ridesharing Preferences Based on Stated Preference Survey Data. M.S. Thesis, Graduate Program in Civil Engineering, The Ohio State University, Columbus, OH.
39. Mishalani, R.G, McCord, M.R., 2016. Using Available Data Sources to Correct Biases in Socio-economic and Travel Characteristics, Ohio Transportation Engineering Conference, Columbus, OH.
41. May, A.A., Sivandran, G., Mishalani, R.G., McCord, M.R., Zou, Y., La Susa, T., Liyanaarachchi, S., Van Dommelen, E., Wildey, B., 2016. Using a Transit System as a Mobile Platform for Air Quality Monitoring in Urban Areas, Ohio Transportation Engineering Conference, Columbus, OH.
42. May, A.A., Sivandran, G., Mishalani, R.G., McCord, M.R., Zou, Y., La Susa, T., Liyanaarachchi, S., Van Dommelen, E., Wildey, B., 2016. Using a Transit System as a Mobile Platform for Air Quality Monitoring in Urban Areas, Innovative Environmental Monitoring Technology Symposium, Athens, OH.
43. Mishalani, R.G, McCord, M.R., 2016. Sensitivity of Transit Onboard Survey Passenger Socioeconomic & Travel Characteristic Sample & Response Bias Corrections Using OD Flows Determined from APC & AFC Data. TransitData2016: 2nd International Workshop on Automatic Data Collection Systems, Boston, MA.
44. Landgraf, A.J., Mishalani, R.G., McCord, M.R., Goel, P.K., 2016. Variational Bayes Method for Estimating Transit Route OD Flows using Boarding and Alighting Data in the Presence of Multiple Latent Flow Patterns: Methodology, Evaluation, and Validation. Transportation Research Procedia: Select Proceedings of the 14th World Conference on Transportation Research, Shanghai, China.
19
45. Ji, Y. Mishalani, R.G., McCord, M.R., 2016. Transit Route-level Passenger Alighting Probability, Probability OD Flow and Expected OD Flow Matrices: Estimates from Boarding and Alighting Counts and Relationships among the Representations. Transportation Research Procedia: Select Proceedings of the 14th World Conference on Transportation Research, Shanghai, China.
46. McCord, M.R, Bicici, S., Mishalani, R.G., 2017. Incorporating Uncertainty in Model Predictions: Evaluating Transferability. 16th TRB National Transportation Planning Applications Conference, Raleigh, NC.
47. zumFelde, J., Carrel, A., Mishalani, R.G. McCord, M.R., 2017. Considering Urban Geography in Quantifying and Correcting Sample and Response Biases in Estimated Transit Passenger Socioeconomic and Travel Characteristics. National Science Foundation Mobility Workshop, Columbus, OH.
48. Mishalani, R.G, and McCord, M.R., 2017. Sample and Response Bias Corrections of Transit Passengers’ SE&T Characteristics Collected via Onboard Surveys: Sensitivity to B2A Estimates. 16th TRB National Transportation Planning Applications Conference, Raleigh, NC.
49. Mishalani, R.G., June 8, 2017. The Road to Autonomous Vehicles: A Transportation Systems Perspective. Panelist, invited by the Harvard Business School Club Columbus and hosted by the Center for Automotive Research, The Ohio State University, Columbus, OH, June 8, 2017
50. McCord, M.R., Mishalani, R.G., Coifman, B., 2017. Determining Traffic Flows and Speeds across Spatially Extensive Urban Areas from Transit Buses, Ohio Transportation Engineering Conference, Columbus, OH.
51. May, A.A., Mishalani, R.G., McCord, M.R., Zou, Y., 2017. Using a Transit System as a Mobile Platform for Air Quality Monitoring in Urban Areas, Ohio Transportation Engineering Conference, Columbus, OH.
52. Mishalani, R.G., 2017. Transportation Systems and “Big” Data: Pathways to Decision- and Policy-Making for Smarter Cities. Keynote lecture, National Science Foundation Smart Vehicle Concepts Center Meeting, Columbus, OH.
53. Mishalani, R.G., 2017. Public Transportation, Big Data, and Smarter Cities: Advances in Monitoring, Analysis, and Modeling Methods. 3rd NYUAD Transportation Symposium (by invitation), Abu Dhabi, UAE.
3. RESEARCH ACTIVITIES
3.1 Effect of Passenger Information on Perception of Transit Services
Information systems have become commonplace in public transportation agencies as a means to improve level-of-service to riders. When well utilized, transit also plays a major role in reducing roadway congestion and mitigating transportation’s negative impacts on the environment, benefits that accrue to transit users and nonusers alike. Nonusers’ recognition of such benefits can be important when agencies seek community support of transit initiatives, and it is possible that state-of-the-art technologies enhance the progressive image of transit.
20
In this research activity, we used data previously collected in a two-wave survey of OSU community, which was designed to elicit users’ and nonusers’ perceptions of the influence of real-time passenger information systems on dimensions associated with transit service (McCord et al., 2009; Mishalani et al., 2011). The first wave was conducted before OSU’s Campus Area Bus Service (CABS) implemented a state-of-the-art passenger information system. The second wave was conducted approximately a year after this implementation.
Our results show statistically significant increases in the value CABS users ascribed to the service provided and in their perceptions of personal safety while accessing and using transit services after the implementation of the information system. The results also show statistically significant increases in both users’ and nonusers’ perceptions of the positive contribution CABS makes towards mitigating negative environmental impacts and decreasing congestion. Furthermore, those who noticed the recently implemented real-time information system had more positive attitudes toward these dimensions, and the effect of the information system on the perceptions was as great or greater for those who did not use the bus service as it was for those who used the service. We also found interesting, statistically significant associations with socioeconomic variables – such as gender, whether an individual is a current or past user of other metropolitan transit systems, and university affiliation (student, faculty, and staff). Details of the study can be found in Ettefagh (2013) and McCord et al., (2015).
We hypothesize that these results, especially if confirmed in other studies, could motivate transit agencies to promote environmental and traffic reduction benefits of transit to gain public support of nonusers for transit subsidies and to market high-tech and progressive investments to increase support among nonusers.
3.2 Effect of Weather on Transit Short Trips
We used bus passenger route-level origin-destination (OD) flows estimated from the regularly collected CABS APC data and the modifications of the Iterative Proportional Fitting (IPF) method we previously developed – see for example Mishalani et al. (2011) – to investigate the factors affecting the demand for intra-campus passenger bus trips on the OSU campus. We considered proportions of intra-campus trips to serve as a proxy for proportions of short trips, where the traveler can choose between making the trip bus or by walking.
Our results show statistically significant effects of temperature and precipitation on the proportion of bus passenger trips that are intra-campus trips. Very low or very high temperatures are associated with increased intra-campus passenger travel. It is found that the 60oF to 80oF temperature range was associated with lowest intra-campus bus travel. The assumption is that a significant proportion of travelers were substituting walking for the bus mode in this temperature interval. A higher proportion of intra-campus trips are also observed when there was noticeable precipitation. Details of the study can be found in Hertler (2013).
3.3 Effect of a Base Matrix on OD Flow Estimates Using APC Data
In this study, we propose a method to estimate transit route passenger OD flow matrices for time-of-day periods based on OD flow information derived from labor-intensive onboard surveys and the large quantities of APC data. The computational feasibility of the proposed method is established and its accuracy is empirically evaluated using differences between the estimated
21
OD flows and ground-truth observations on an operational bus route. To interpret the empirical differences from the ground-truth estimates, differences are also computed when using the state-of-the-practice Iterative Proportional Fitting (IPF) method to estimate the OD flows.
Our empirical results show that when using sufficient quantities of boarding and alighting data that can be readily obtained from APC-equipped buses, the estimates determined by the proposed method are better than those determined by the IPF method when no or a small sample sized onboard OD flow survey dataset is available and of similar quality to those determined by the IPF method when a large sample sized onboard OD flow survey dataset is available. Therefore, the proposed method offers the opportunity to forgo conducting costly onboard surveys for the purpose of OD flow estimation.
3.4 Using Mobile Device Wi-Fi Signals to Determine Passenger OD Flows
We have successfully used APC data to estimate route-level bus passenger origin-destination flows in both research and outreach efforts. We also introduced the simple techniques for doing so in undergraduate courses. The increasing use of personal mobile devices and the corresponding reliance on Wi-Fi communications in public spaces motivated us to investigate the potential of using detected anonymous Wi-Fi signals from mobile devices carried by transit passengers to extract bus passenger OD movements. We configured an off-the-shelf device designed for detecting Bluetooth and Wi-Fi signals in a stationary setting for mobile use. To process the Wi-Fi signal data into OD passenger movements, we developed a set of rules to (i) distinguish between signals emitted from devices accompanying passengers on the bus and signals emitted from devices in the vicinity of, but not on the bus; (ii) then to determine boarding and alighting stops for the passengers whose devices are determined to be on the bus.
We conducted an empirical study using the CTL infrastructure to evaluate our hardware configuration and rules and to assess the value of using the detected Wi-Fi signals to estimate passenger OD flows. Specifically, we carried the device on bus trips where we collected directly observed OD flows and APC data (see Section 1.2). The directly observed OD flows were used as ground truth, while the APC data were used to estimate OD flows with the methods we have been developing and using and by amending these methods to include the information obtained from processing the Wi-Fi data when estimating OD flows. Our empirical results show that the OD flows determined directly from the Wi-Fi data for a specific bus trip do not correspond well to the ground-truth flows, in part because of being able to estimate the “Wi-Fi flows” for only a sample of the passengers. However, the results demonstrate improvements in estimation accuracy when using Wi-Fi signal data to estimate average OD flows across multiple bus trips for a time-of-day period, especially when used in conjunction with APC data. Details of the study can be found in Mishalani et al. (2016).
3.5 Investigating the Stated Preferences for Real-time Employer-based Ridesharing Considering Personal and Travel
By expanding the travel choice set for many individuals, ridesharing has the potential to improve mobility and accessibility appreciably. The increased multi-traveler auto occupancy that would result can also reduce congestion, travel costs, energy consumption, and vehicle emissions. Real-time ridesharing takes advantage of advances in information and social media technologies to facilitate the matching of prospective travelers shortly before the commencement of trips.
22
Employer-based programs further increase the potential for successful large-scale ridesharing implementations by increasing the chances of viable matches and addressing “stranger danger” concerns.
In this study, we analyzed data from a stated-preference survey of The Ohio State University community, one of the largest university campus communities in the US, to identify individual willingness to participate in a real-time, employer-based ridesharing program under ideal conditions. We estimated a binary discrete choice model to investigate willingness to participate as a function of numerous personal and travel characteristics. In addition to supporting present understanding of ridesharing preferences, results indicate that private automobile travelers (whether in single occupancy or shared form) are more willing to participate in ridesharing than those who use the transit or bicycle modes for their commutes. This result is encouraging, since ridesharing is more likely to lead to societal benefits if it attracts single occupancy automobile than transit and bicycle travelers. Details of the study can be found in Shay (2016).
3.6 Evaluating the Use of OD Flows Determined from APC and AFC Data to Correct Sample and Response Biases in Transit Onboard Survey Results
Transit agencies collect large-scale onboard surveys of passengers’ socioeconomic and travel (SE&T) characteristics on an infrequent but regular basis (approximately every five years). The surveys are subject to sample and response biases. Independently conducted passenger stop-to-stop origin-destination (OD) surveys can be used to correct for some of the biases, but such surveys are costly, intrusive, and time-consuming. Information in the OD survey can be estimated using data already being collected from Automatic Passenger Count (APC) and Automatic Fare Collection (AFC) systems and conceivably used to correct the SE&T characteristics for sample and response biases.
We conducted a large-scale empirical study to investigate the sensitivity of the adjusted SE&T characteristics to different data sources used to determine or estimate the OD flows and evaluate the use of APC and AFC for correcting some of the biases in the SE&T characteristics. The results indicate that OD survey data collected at typical sample sizes offer no systematic improvement for adjusting SE&T characteristics compared to OD flow matrices estimated from readily available APC and AFC data. Details of the study can be found in Mishalani and McCord (2016).
3.7 Investigating Sampling Biases in Transit Onboard Surveys and Associated Impacts on Resulting Passenger Socioeconomic and Travel Characteristics
Conducting transit onboard surveys is a primary way that transit agencies and metropolitan planning organizations (MPOs) gather data on transit user socioeconomic and travel (SE&T) characteristics. These surveys are known to suffer from a variety of possible sampling and response biases. This study investigates two possible causes of sampling biases: those resulting from passenger making short trips who, as a result, do not have sufficient time to complete an interview or questionnaire, and those resulting from a mismatch between the number of surveyors and the passenger boarding volumes.
We conducted a large-scale empirical study to investigate the presence of these biases. The results indicate that the short-trip bias remains present despite efforts to mitigate it while the bias
23
associated with surveyor workload is mitigated. Furthermore, the presence of short-trip bias appears to vary by route and time-of-day. Finally, short trips are found to be associated with travelers who are making shopping trips, of low income, who are non-white, or who are transit dependent, whereby such travelers are more likely to be under-represented by onboard surveys.
3.8 Transit Route-level Passenger Alighting Probability, Probability OD Flow and Expected OD Flow Matrices: Estimates from Boarding and Alighting Counts and Relationships among the Representations
This study proposes a general formulation for estimating bus transit route-level OD flow matrices based on passenger boarding and alighting counts. Route-level OD flow matrices are often expressed in three representations: Alighting Probability (AP) matrix, Probability OD (POD) flow matrix, and Expected OD (EOD) flow volume matrix. Variants of the proposed formulation are derived when estimating the AP, POD, and EOD matrices. The derivation reveals the underlying relationship between the three representations.
We conducted a numerical study on an operational bus route to confirm and demonstrate the findings. For congested bus routes, estimating the AP matrix is desirable since the POD matrix is not stable across bus trips and, therefore, the estimated POD matrix would not be representative of the underlying passenger travel pattern on a typical bus trip. For routes where congestion is not common, estimating the POD matrix is desirable since it is more informative than the AP matrix in describing the underlying passenger travel pattern. In addition, on routes where the bus trip-level total demand and the POD vary in tandem by time-of-day, estimating the EOD matrix is desirable since the EOD matrix is more informative than the POD matrix. Otherwise, it is more meaningful to estimate the POD matrix and the expected bus trip-level total demand separately.
3.9 Air Quality Monitoring from Transit Buses
In a previous project, we began developing and testing a physical infrastructure for obtaining air quality readings from a suite of inexpensive sensors that is packaged and mounted on transit buses that serve as mobile sensor platforms. The mobile nature of the bus-based platforms would allow a novel means of obtaining air quality in urban regions at spatial resolutions that are presently not available with fixed location sensors. The repeated coverage of the same roadways by transit buses would allow many repeated, independent sample readings that can be combined to obtain good estimates of average pollutant concentration. Our plan was to demonstrate the feasibility of this approach using the CTL infrastructure as motivation for wider scale development and testing. In the previous project, we developed the sensor suite; conducted first-cut testing of data collection using a private automobile, rather than a bus, as the mobile platform; began developing data analysis techniques; worked with OSU TTM to plan for mounting the sensor package on the bus; and mounted the package on a bus and collected preliminary data.
Because of the use of the CTL infrastructure – physical buses, operational bus routes – when the previous project ended we subsumed data collection and analysis tasks in this project devoted to exploiting the CTL for innovative research, outreach, and education. In tis project, we
• Collected additional data with the existing sensor package on one CABS bus. • Redesigned the sensor suite and packaging to be more resistant to precipitation.
24
• Planned for deployment on buses and an additional bus type, which required redesigning the way in which the packaging would be mounted on the different bus type.
• Made contacts with the Byrd Polar and Climate Research Center at OSU, who had previously been inspired and influenced by this project to collect temperature readings from a different CABS bus used to collect our data and who could be beneficial in helping us find sustained support.
• Discussed progress and logistics with TTM, who has been supportive of helping us find ways to continue this effort.
• Continued data analysis, where we are now obtaining results that support the validity of our readings and are beginning to indicate systematic spatial patterns in pollutant concentrations.
3.10 Traffic Sensing from Transit Buses
Similar to the Air Quality research activity reported in Section 3.9, this research activity is the continuation of an activity begun in another project. In this activity, we are attempting to demonstrate the ability to obtain meaningful traffic flow estimates from video data obtained from transit buses in regular operation. Since video cameras are increasingly being installed on transit buses for security and liability purposes, we believe one could take advantage of the existing data to estimate traffic flows using the modification of the “moving observer method” we previously developed. As with the Air Quality research activity, using transit buses as the mobile platform from which the data are collected is attractive because the public nature of the agency should make it institutionally easier to access data in practice and because the repeated, systematic coverage of the same roadways should lead to good sampling properties.
We previously investigated the feasibility of estimating traffic flows from a mobile platform by using LiDAR and video data obtained from sensors mounted on a van that we repeatedly drove on routes that emulated existing bus routes and from observations manually obtained from data collectors riding CABS buses. In this project, we:
• Worked with TTM to ensure that the camera specifications they developed to satisfy their operational needs would also satisfy our research needs.
• Obtained trial video sets from eight video cameras on one bus after the cameras were installed on the buses in summer 2017.
• Modified software we previously developed to semi-automatically record traffic observations in the video.
• Tested the software on the trial video provided.
We consider that the results of these tasks to be successful in taking steps toward developing the institutional and software components that will allow us to investigate the ability to provide meaningful traffic flow estimates from existing bus-based video in an externally funded project we have secured.
3.11 Preliminary Analyses of Data on Requests for Real-time Transit Information Made through a Mobile App
A preliminary analyses of data on request for real-time CABS bus locations or arrival time to stops information made through OSU’s mobile app was carried out. This analysis is based on a limited dataset consisting of a 15-minute period that include the following fields for each
25
information request: IP address of the mobile smart devise (phone or tablet) from which a request is made, the latitude and longitude of the devise at the time of the request, and the timestamp at the time of the request. The location information was associated with the bus stops on the CABS network and in turn to historic passenger boarding volumes at these stops. While the sample size is too small to arrive at generalizable results of the analyses, the results do show the promise of investigating such data. For example, such data may reveal the passenger arrival patterns at stops and how such patters may depend on the bus service frequencies. The data may also indicate the conditions under which real-time information is of greater or lesser interest to prospective passengers.
4. EDUCATIONAL ACTIVITIES
We continued to take advantage of the underlying physical and institutional infrastructure of the transit living laboratory and of the automatically and manually collected data on CABS to support the incorporation of transit-related educational activities in the following classes taught by project investigators.
• CIVILEN 3700 Transportation Engineering and Analysis: Undergraduate Civil Engineering students must choose six “select core” courses from a set of eight courses, which includes CIVILEN 3700. Typically, 150-200 students per year take this course. Some undergraduate students take additional transportation courses after CIVILEN 3700, but this is the only transportation course taken by the majority of the students. A module on scheduled transit services is included, where the Campus Transit Lab (CTL) is highlighted. We recently added a module on sustainability in transportation related applications that focuses on CTL applications in an attempt to provide readily interpretable examples. Assignments involve the processing of APC and AVL data automatically collected as part of the CTL and a manual data collection exercise, as well as the interpretation of the processed and manually collected data. A final exam question, which the students prepare in advance, asks them to choose the section in the class they liked the best and describe why they chose that section. The section associated with CTL is the section most often cited, and the ability to analyse a system that is familiar and with which they are engaged is a common reason the students give for citing this section.
• CIVILEN 5720 Transportation Engineering Data Collection Studies: This course is typically taken by 15-25 students per year and is comprised of undergraduate and graduate Civil Engineering students and graduate City and Regional Planning students. It is a required course in the Dual Civil Engineering – City and Regional Planning M.S. Program in Urban Transportation Planning. We introduced a module on estimating traffic flows from a modified moving observer method we developed with the vision of collecting data from transit buses. We include an assignment where students board CABS buses to collect traffic data and process the data to produce traffic flow estimates.
• CIVILEN 5770 Urban Public Transportation: Like CIVILEN 5720, CIVILEN 5770 is a required course in the Dual Civil Engineering – City and Regional Planning M.S. Program in Urban Transportation Planning and is taken by undergraduate and graduate Civil Engineering students and graduate City and Regional Planning students. It is a required course in the Dual Civil Engineering – City and Regional Planning M.S. Program in Urban Transportation Planning. Typically, more than 30 students take this course in a year. A major course requirement consists of a semester long project based on CTL carried out in teams of three to
26
four students. Students collect field data on CABS vehicle and passenger movements and use these data along with CTL’s automatically collected APC and AVL data to analyse and model various aspects of the supply of and demand for service. Based on the results, students comment on performance and make recommendations to the operators of CABS.
• CIVILEN 7730 Urban Transportation Forecasting: This course is offered once every two years. Like CIVILEN 5720 and 5770, it is a required course in the Dual Civil Engineering – City and Regional Planning M.S. Program in Urban Transportation Planning. It is not open to undergraduate students. Over the duration of this project, approximately 10 students have taken the course on average. Students conduct a term project, which is generally presented to others in the class. Approximately one quarter of the students use data from the Campus Transit Lab in their project.
• Individual Studies: Several students undertook independent studies for credit that relied on automatically collected CTL data or data they manually collected as part of their independent study course and on methods we developed to process the data into estimates of vehicle or passenger movements. In addition, CTL infrastructure and data formed the basis of a summer-long study of one Summer Research Opportunities Program (http://www.btaa.org/resources-for/students/srop/introduction) student. Furthermore, one student in the Dual Civil Engineering – City and Regional Planning M.S. Program in Urban Transportation Planning conducted his required “practicum” course – consisting of an internship at a transportation agency or company and regular academic reporting on the experience to the course instructor – at OSU’s TTM, where he provided an interface between CTL activities and TTM needs.
• Theses and Reports: Seven students completed theses or extended M.S. project reports based on CTL applications, one Ph.D. student completed a dissertation based on CTL AVL data, two Ph.D. students and two M.S. students are targeting theses that use CTL infrastructure and data.
5. SUMMARY
This report documents the activities conducted within the Campus Transit Lab (CTL) at The Ohio State University for the purposes of research, education, and outreach from Spring 2012 through Autumn 2017. CTL investigators utilized automatically and manually collected data from CABS to support these goals. CTL investigators conducted outreach with CABS to assess night service ridership, support campus planning efforts, fill in and correct ridership reports produced by off-the-shelf software, support campus sustainability policy efforts, advise on the management of the data for a new campus bike-sharing service, provide lessons learned regarding ridership reporting from APC data to Washington Metro, and share extensive documentation of inferring OD flows from APC data with Washington Metro.
Regarding research, data collected in the CTL were used to investigate the effect of passenger information on perception of transit services; effect of weather on transit short trips; effect of a base matrix on OD flow estimates using APC data; use of mobile device Wi-Fi signals to determine passenger OD flows; stated preferences for real-time employer-based ridesharing considering personal and travel characteristics; use of OD flows determined from APC and AFC data to correct sample and response biases in transit onboard survey results; sampling biases in transit onboard surveys and associated impacts on resulting passenger socioeconomic and travel
27
characteristics; relationships among transit route-level passenger alighting probability, probability OD flow, and expected OD flow matrices; air quality monitoring from transit buses; traffic sensing from transit buses; and use of data on requests for real-time transit information made through the use of a mobile app.
CTL data and infrastructure continued to be used in undergraduate and graduate courses through class lectures, assignments, data collection exercises, and exam questions.
2. Ettefagh, M., 2013. Effects of Real-time Passenger Information Systems on Perceptions of Transit Services: Investigations of The Ohio State University Community. M.S. thesis, The Ohio State University, Columbus, OH.
3. Hertler, G., 2013. Effect of Service, Temporal, and Weather Variables on Short Bus Transit Passenger Trips: Investigations of OSU’s Intra-campus Transit Demand. M.S. thesis, The Ohio State University, Columbus, OH.
4. Ji, Y., Mishalani, R.G, McCord, M.R., 2014. Estimating transit route OD flow matrices from APC data on multiple bus trips using the IPF method with an iteratively improved base: Method and empirical evaluation. Journal of Transportation Engineering, 140(5), 040140081-040140088.
5. Ji, Y., Mishalani, R.G., McCord, M.R., 2015. Transit passenger origin-destination flow estimation: Efficiently combining onboard survey and large automatic passenger count datasets. Transportation Research Part C: Emerging Technologies, 58, 178-192.
6. McCord, M.R., Mishalani, R.G., Ettefagh, M., 2015. The Effect of Real-time Passenger Information Systems on the Perceptions of Transit’s Favorable Environmental and Traffic Reduction Roles. Transportation Research Record, No. 2538, pp. 102–109.
7. McCord, M.R., Mishalani, R.G., Goel, P., 2009. Research and Education from a Smart Campus Transit Laboratory (year 1). Region 5 University Transportation Center (NEXTRANS), Office of the Assistant Secretary for Research and Technology (OST-R), US Department of Transportation.
8. McCord, M.R., Mishalani, R.G., Goel, P.K., Strohl, B., 2010. Empirical comparative assessment of the IPF procedure for determining bus route passenger OD flows. Transportation Research Record, Vol. 2145. pp. 59-65.
9. Mishalani, R.G., Ji, Y., McCord, M.R., 2011. Empirical Evaluation of the Effect of Onboard Survey Sample Size on Transit Bus Route Passenger OD Flow Matrix Estimation Using APC Data. Transportation Research Record, No. 2246, pp. 64-73.
10. Mishalani, R.G., McCord, M.R., 2016. Transit Passenger Flow Estimation and Characteristics Expansion. Final project report, Ohio Department of Transportation (ODOT).
28
11. Mishalani, R.G., McCord, M.R., Goel, P., 2011. Smart Campus Transit Laboratory for Research and Education (year 2). Region 5 University Transportation Center (NEXTRANS), Office of the Assistant Secretary for Research and Technology (OST-R), US Department of Transportation.
12. Mishalani, R.G., McCord, M.R., Reinhold, T., 2016. Transit Route-level Passenger OD Flow Determination from Mobile Device Wi-Fi Signals: Methodology and Empirical Evaluation. Transportation Research Record, No. 2544, pp. 123-130.
13. Reinhold, H.E., 2013. Combining Transit Route Origin-Destination Passenger Flow Matrices into Integrated Area or Corridor Matrices: Evaluating Flow Patterns on the OSU Campus and along a Columbus Corridor. M.S. thesis, The Ohio State University, Columbus, OH.
14. Shay, N.M., 2016. Investigating Real-Time Employer-Based Ridesharing Preferences Based on Stated Preference Survey Data. M.S. Thesis, The Ohio State University, Columbus, OH.
29
CONTACTS
For more information:
PI Names: Mark McCord and Rabi Mishalani University: The Ohio State University Address: 2070 Neil Ave, Rm 491D and Rm 483E, Columbus, OH 43210 Phone Numbers: 614-292-2388 and 614-292-5949 Fax Number: 614-292-8730 Email Addresses: [email protected] and [email protected] Web Addresses: https://ceg.osu.edu/people/mccord.2 and https://ceg.osu.edu/people/mishalani.1
NEXTRANS Center Purdue University - Discovery Park 3000 Kent Ave. West Lafayette, IN 47906 [email protected] (765) 496-9724 www.purdue.edu/dp/nextrans