Use and Design of Acceleration and Deceleration Lanes in Indiana NEDDY C. JOUZY, Assistant Professor, American University, Beirut, Lebanon, and HAROLD L. MICHAEL, Associate Director, Joint Highway Research Project, Purdue University The speed and lateral placement of vehicles on the various designs of the acceleration and deceleration lanes of the Indiana Toll Road and the Interstate System of the State of Indiana were studied to correlate the acceleration and deceleration lane design with traffic behavior and driver requirements and to determine which acceleration and deceleration lane designs provide the most efficient and safest operation. Data on speeds and lateral placement of traffic using the acceleration and de- celerati6n lanes were obtained by use of a motion picture tech- nique. Spot speeds of through lane traffic were measured using an electromatic radar speed meter. The study revealed that a large number of the driving public do not know how to use acceleration and deceleration lanes properly. Acceleration or deceleration lane traffic was found to have little effect on the speed of the through lanes before diverging into the deceleration lanes. The long direct taper type of design was found superior for both acceleration and deceleration lanes. •ON THE BASIS of various recent research studies, it is apparent that highway de- signers are becoming more and more concerned with the relationship between highway design and traffic behavior. An excellent example of current interest is the design of acceleration and deceleration lanes. To obtain maximum efficiency and safety in the operation of acceleration and deceleration lanes, and to maintain efficiency on the main facility, it is necessary to relate the design of such lanes to traffic behavior, as indi- cated by the requirements and desires of drivers. Drivers leaving a highway at an intersection are usually required to reduce speed before turning. On the other hand, drivers entering a highway at an intersection have to accelerate to reach the desired speed of the traffic on the facility. Whenever this deceleration or acceleration by exiting or entering traffic takes place on the main traveled way of the highway, it disrupts the flow of through traffic and is hazardous (1). Thus, to minimize these undesirable aspects on high-speed facilities, maximum use - should be made of acceleration and deceleration lanes. For best operating conditions, acceleration and deceleration lanes should be used for the entire acceleration and deceleration phase by vehicles entering or leaving the through traffic lane. Each such acceleration and deceleration lane, therefore, should be of a design that will enable a driver to maneuver his vehicle onto it without a major change in speed and, once on it, to make the necessary change between the speed of operation on the main facility and the lower speed required for exit or entrance. The optimum condition of operation for an acceleration lane is to have acceleration lane traffic accelerate on the acceleration lane and merge into the through lane traffic at approximately the same direction of travel and at the same speed as the through lane traffic. That for a deceleration lane is to have deceleration lane traffic leave the Paper sponsored by Committee on Geometric Highway Design. 25
Transcript
Use and Design of Acceleration and
Deceleration Lanes in Indiana NEDDY C. JOUZY, Assistant Professor, American University, Beirut, Lebanon, and HAROLD L. MICHAEL, Associate Director, Joint Highway Research Project,
Purdue University
The speed and lateral placement of vehicles on the various designs of the acceleration and deceleration lanes of the Indiana Toll Road and the Interstate System of the State of Indiana were studied to correlate the acceleration and deceleration lane design with traffic behavior and driver requirements and to determine which acceleration and deceleration lane designs provide the most efficient and safest operation. Data on speeds and lateral placement of traffic using the acceleration and decelerati6n lanes were obtained by use of a motion picture technique. Spot speeds of through lane traffic were measured using an electromatic radar speed meter.
The study revealed that a large number of the driving public do not know how to use acceleration and deceleration lanes properly. Acceleration or deceleration lane traffic was found to have little effect on the speed of the through lanes before diverging into the deceleration lanes. The long direct taper type of design was found superior for both acceleration and deceleration lanes.
•ON THE BASIS of various recent research studies, it is apparent that highway designers are becoming more and more concerned with the relationship between highway design and traffic behavior. An excellent example of current interest is the design of acceleration and deceleration lanes. To obtain maximum efficiency and safety in the operation of acceleration and deceleration lanes, and to maintain efficiency on the main facility, it is necessary to relate the design of such lanes to traffic behavior, as indicated by the requirements and desires of drivers.
Drivers leaving a highway at an intersection are usually required to reduce speed before turning. On the other hand, drivers entering a highway at an intersection have to accelerate to reach the desired speed of the traffic on the facility. Whenever this deceleration or acceleration by exiting or entering traffic takes place on the main traveled way of the highway, it disrupts the flow of through traffic and is hazardous (1). Thus, to minimize these undesirable aspects on high-speed facilities, maximum use -should be made of acceleration and deceleration lanes.
For best operating conditions, acceleration and deceleration lanes should be used for the entire acceleration and deceleration phase by vehicles entering or leaving the through traffic lane. Each such acceleration and deceleration lane, therefore, should be of a design that will enable a driver to maneuver his vehicle onto it without a major change in speed and, once on it, to make the necessary change between the speed of operation on the main facility and the lower speed required for exit or entrance. The optimum condition of operation for an acceleration lane is to have acceleration lane traffic accelerate on the acceleration lane and merge into the through lane traffic at approximately the same direction of travel and at the same speed as the through lane traffic. That for a deceleration lane is to have deceleration lane traffic leave the
Paper sponsored by Committee on Geometric Highway Design.
25
26
through lane at about the s ame direction of travel as through lane traffic and at the same speed, with all deceleration taking place in the deceleration lane.
Acceleration and deceler ation lane design varies very s ignificantly from State to State. Some States follow the standards set for th in the AASHO manual (1); other s have developed their own standards using the AASHO manual as a guide. -
The Indiana State Highway Commission has used several designs for acceleration and decel eration lanes. The parallel lane type of acceleration lane was initially adopted as a s tandard. This type, consisting of a full width lane 350 ft long with 400 ft of · taper , has been cons tn1cted at s everal locations. Late1· , the length of the parallel acceleration lane was changed to 250 ft of full width with 250 ft of taper. Later yet , the direct taper type of acceleration lane design was adopted to correct a tendency for entering traffic to move into the through lane too quickly. This latter acceleration lane has a 750-ft taper. More recently , an acceleration lane having 50:1 taper was adopted. This design is similar to one described in "Traffic Behavior on Freeways," Highway Research Board Bulletin 235. This last design , however, had not been incorporated in any construction completed before 1962.
Adopted standards for the State of Indiana for deceleration lanes have also included the pa1·allel lane type and the direct taper type. One design uses a taper lane width ranging from 0 to 12 ft in 250 ft, followed by 50 ft of tangent and then a curve. A second design uses a co11tinuous curve. A third design has a taper followed by a curve, and a fourth design uses a straight short taper. During 1961, a design having about 900 ft of straight taper was adopted.
This paper reports the speed and lateral placement of vehicles on acceleration and deceleration lanes of these various designs as constructed in Indiana. It also correlates acceleration and deceleration lane design with traffic behavior and apparent driver requirements and makes some suggestions relative to acceleration lane and deceleration lane design.
SCOPE
The study was limited to high-type facilities in Indiana . Locations were chosen 011
the Indiana Toll Road and those s ctions of the Int rstate System that were completed and had been openeci tn traffic before 1962. The study locations were specifically selected to provide data on speeds and lateral placement for various designs of acceleration and deceleration lanes and for operation under diffe1·ent conditions . Not all the different designs of acceleration and deceleration lanes which have been adopted by the Indiana State Highway Commission could be studied , as some of these designs had not as yet been incorporated in any completed construction .
Locations were chosen, if possible, to include one of three conditions of road geometry: where the acceleration or deceleration lanes met or left the through lanes on (a) a tangent, (b) a right curve , or (c) a left curve. One location was also studied where an acceleration lane joined the through lane on tbe upgrade portion of a crest vertical curve, and another was included where the junction occurred on the downgrade portion of a sag vertical curve. All these conditions were studied to evaluate wl1at effects each had on traffic behavior and to deter mine wh ich condition provided for the most efficient and safe use of acceleration and deceleration lanes .
In £our cases, more than one locat'on having the same acceleration or deceleration lane design a nd similu conditions of road geometry were studied . These studies were made at_ different locations having different traffi , in order to evaluate the repetitive character of the results. It was suspected that other factors s uch as traffic volumes and types of drivers using the faeility would have a significant bearing on the results .
The speeds of through vehicles were also analyzed at each interchange around the point where the acceler ation or deceleration lanes joined the through lanes . This was done to compare speeds of acceleration or deceleration lane traffic with thr ough lane traffic at each location. The speeds of through traffic were also obtained before or after th interchanges to evaluate the effect of interchange traffic on the speed of through traffic at the interchange .
The types of vehicles studied were passenger cars and light trucks, which were considered as passenger cars . Data from at least 108 passenger cars were analyzed for
27
each acceleration or deceleration lane studied. Heavy trucks were not included , as the number of such trucks using acceleration and deceleration lanes on existing Indiana freeways was small and a long and expensive period of data collection to obtain an adequate sample of trucks would have been required. Information on the use of acceleration and deceleration lanes by trucks is certainly desirable and should be obtained. During the course of the study the location where deceleration lane traffic begins to decelerate while on the through lanes and before the beginning of the deceleration lane was found of interest. This information, therefore, was obtained for a few of the study locations for deceleration lanes. Only information for free-moving vehicles was used for all parts of this study.
Vehicles that stopped on the acceleration or deceleration lanes were not included in the speed and lateral placement evaluations but were recorded for possible use as a measure of the efficiency of operation of the various designs. Data on accidents at each site were obtained but the number of accidents was so small because so little time had elapsed since construction that an analysis was not possible.
PROCEDURE
Data on speeds and lateral placement of traffic using acceleration and deceleration lanes were obtained with a 16-mm motion picture camera. The motion picture type of study was selected, after consideration of various other methods, as being the best for detailed study and analysis.
The filming was done from a vantage point, usually an overpass over the main facility at the interchange. The camera used was a 16-mm Bell and Howell movie camera with a built- in turret head.
In the case of acceleration lanes, movies were taken of each free-flowing passenger car as it passed a designated point, usually the nose, beyond which it was able to maneuver and merge into the through lanes, and until the left rear wheel of the vehicle crossed from the acceleration lane onto the through lane. The left rear wheel of the car was chosen as the criterion because acceleration lane traffic traveled away from the camera and therefore was visible, and for all practical purposes the instant the left rear wheel crosses from the acceleration lane onto the through lane, conflict with the through traffic operation becomes serious.
As for the deceleration lane, movies were taken of each vehicle before its left front wheel crossed from the through lane onto the deceleration lane and until it passed a designated point on the deceleration lane, usually the nose, beyond which the car was unable to maneuver back onto the through lane. Here, the left front wheel of the car was chosen because, for deceleration lanes, traffic traveled towards the camera and by that point most of the car had left the through lane and was no longer a conflict on the through lanes .
The film was analyzed by projecting it through a time-motion study projector. A grid was superimposed on the screen where the film was projected to a scale which provided accurate ground measurements. The vehicle speeds at various locations on the acceleration and deceleration lanes were compluted using the grid system by determining the distance traveled during a time period. Time was measured by the number of frames a vehicle traveled between two grid lines. The lateral placement of the vehicles on the acceleration or deceleration lanes was also traced by using the grid system. The stations at which the left rear wheel of acceleration lane traffic and the left front wheel of deceleration lane traffic crossed the line between the acceleration or deceleration lane and through lanes were noted.
Speed information was grouped by 100-ft sections according to the location on the acceleration or deceleration lane where each car merged or diverged. For example, the speed data for all vehicles on a study lane which merged between Station 0+00 and Station 1+00 were grouped for analysis. The average speed, 85th percentile speed, standard deviation, and percent of total vehicles leaving or entering between stations were computed for each group. The 85th percentile speed and percent leaving or entering between 100-ft stations are indicated on the sketches of each study site which are included in this report. A single value for the 85th percentile speed for all vehicles entering or leaving the deceleration or acceleration lane is shown on these sketches in parentheses.
28
A cumulative frequency graph of lateral placements was plotted for each study site. This graph was developed by plotting the cumulative pe1·cent of vehicles thal merged into or diverged from the through lane against the distance from the nose at which the merger or divergence occurred. It was found that the cumulative curves thus prepared tended to break sharply at approximately 90 percent. Thus, the 90th percentile was taken as an important criterion for determining the length of an acceleration or deceleration lane which would be effectively used.
Spot speeds of through lane traffic were measured using a concealed radar meter. The spot speeds of through traffic were measured at two locations at each study site. The first of these was "within the area of conflict," the area where acceleration or deceleration lanes adjoined the through lane. The second spot speed location was "beyond the area of conflict, " a point approximately 1 mi before or after the interchange. Posted speed limits were the same for traffic on all .through lanes studied.
Spot speeds of deceleration lane traffic were measured at three deceleration lane sites in an attempt to de termine where traffic destined for a deceleration lane begins to decelerate on the through lane. The radar meter was placed so that the cars approaching the deceleration lane intersected the beam at the specified location, but only cars that proceeded to use the deceleration lane were recorded.
RESULTS
Acceleration Lanes
Figure 1 is a map of Indiana showing the location of the acceleration and deceleration lanes studied. Pertinent data for each acceleration lane location are given in Table 1.
TABLE I
STUDY LOCATION DATA- ACCELERATION LANES
Acee!. Lane Direction oi Geometric Condition Acceleration Lane
Identification Location Accel. Lane
Traffic Description Type Description Type
Ala Indiana Toll Road- Westbound Tangent Direct taper Middlebury 1,200 ft
Alb Gary West Westbound Tangenl Direct taper 1,200 ft
Ale Michigan City Westbound Tangent and down- Direct Laper grade portion of 1,200 ft sag vertical curve
Ald Chesterton- Westbound Right curve '2 Direct taper Valparaiso 1, 200 ft
Ale LaPorte Westbound Right curve and up- 5 Dir ect taper grade portion or 1, 200 ft crest vertical
Alf Gary East Eastbound Left curve Direct taper 1,200 ft
A2a Interstate 65-Stat e Road 39 Northbound Tangent Parallel-
350-it str and 400-ft taper
A2b Tri-State- Eastbound Tangent Parallel-Kennedy Ave. 350-it str and
400-(t taper
A2c Interstate 74- Eastbound Tangent Par allel-Post Road 350-ft str and
400~ft taper
A2d Interstate 65- Southbound Right curve Parallel-State Road 60 350-ft etr and
400-(t taper
A2e State Road 39 Southbound Left curve l'aralll::!l- 2 350-ft Blr and 400-ft taper
A3a State Road 56 Nortl1bound Tangent Parallel-250-ft str and 250-ct taper
A3b State Road 334 Northbound Left curve Parallel-250-ct str and 250-ft taper
A4b Calumet Ave , Westbound Right curve 2 Direct taper 300 ft
29
"" "'"''
·-·
r 65 -H-+---+---li.-'" ..,___r....L..,r==-f ~
I 74 -t--"f'--t:--=~---+-...,
Figure 1. Study locations of acceleration and deceleration lanes.
These locations are coded as follows: Ala, A2b, etc., in which the A stands for acceleration lane; the number, for the type of lane design; and the lower-case letter (a, b, etc . ) , for the location.
Type 1. -One type of acceleration lane studied is on the Indiana Toll Road and is of the design shown in Figure 2 . The length of the acceleration lane is 1, 200 ft from the end of the ramp curve to the intersection with the right edge of the through lane. A shoulder, paved but of a different color, separates the acceleration lane from the through lane for a distance of 577. 82 ft. For some of this distance, a curb also adjoins the acceleration lane. Beyond the point of separation, the acceleration lane is an extra lane with a 52: 1 straight taper from a width of 12 to 0 ft in a distance of 622. 03 ft.
Six locations of this type of acceleration lane were studied. At two of these locations, the acceleration lane meets the through lane on a tangent; at a third location, on
Figure J, Speeds and lateral placement of passenger cars on type 1 acceleration lane, location Ala~Indiana Toll Road, Middlebury Interchange , westbound traffic.
a tangent and also on the downgrade portion of a sag vertical curve; at a fourth, on a right curve; at a fifth , on a right curve and also on the upgrade portion of a crest vertical curve; and at a sixth, on a left curve.
Station 0+00 was placed as the end of the ramp curb; beyond this point, acceleration lane traffic could merge into the through lanes .
Figures 3 through 8 show the results of the speed and lateral placement studies made at these locations. The results at location Ala are discussed in the following paragraphs as an example of how each of these figw•es and the data in Table 2 were analyzed. A summary of the important characteristics of use obtained at each location is given in Table 2.
In location Ala, the acceleration lane meets the through lane on a tangent at the interchange. The annual average daily traffic (1960) on lhe acceleration lane was 620 vehicles per day and on the westbound through lanes was 3, 720 vehicles per day.
Figure 3 shows the results of the speed and lateral placement study made at this location. On this figure, as on similar figures for other locations of acceleration and deceleration lanes studied, 85th percentile speeds are shown for acceleration lane traffic and for through lane traffic. For acceleration lane traffic, the 85th percentile speed is given for Station 0+00 and for all vehicles which left the acceleration lane in each 100 ft thereafter at the time of merging. The percentage of the total non-stopping vehicles using the acceleration lanes which left the lane in each 100 ft and the cumulative percent-
CUMULATIVE %
STATION
0 0
100"1.
0 0
6a
31
54 62 62 l ---- t---- ----65
Figure 4. Speeds and lateral placement of passenger cars on type 1 acceleration lane, location Alb~Indiana Toll Road, Gary West Interchange, westbound traffic.
~ =--- -I---=-~ .;:::;::::+crs s SS \$~SS\ \ \ S \ \\\ ±""S % LEAVING ._._.-_ ~ -BET~EN STATIONS 4
•6 3 86·1"•
9·3
"- _ __ ___ - ---
851h 'X. SPEED OF 70 55 54 54 ACCELERATION LANE TRAFFIC 57 )
85 1h '4 SPEED OF
THROUGH LANE TR_AFFIC 67~ 67
6i 66 65 63 66 57 64
67
----t----
Figure 6. Speeds and lateral placement of passenger cars on type 1 acceleration lane, location Ald~Indiana Toll Road, Valparaiso Interchange, westbound traffic.
32
CUMULATIVE 'l
STATION t000 % t-~ r~U :~'8" ~ i +I ~ ~<:s0
8!:5"''l SPEED OF ACCEL. !54 LANE TRAFFIC eo•~" SPEED OF THROUGH
LANE TR~F'F IC 4_ 66 ~---_....
!54 !54 (!54)
62 41
66 ---t---Figure 7. Speeds and lateral pl acement of p as senger cars on type 1 acceleration lane,
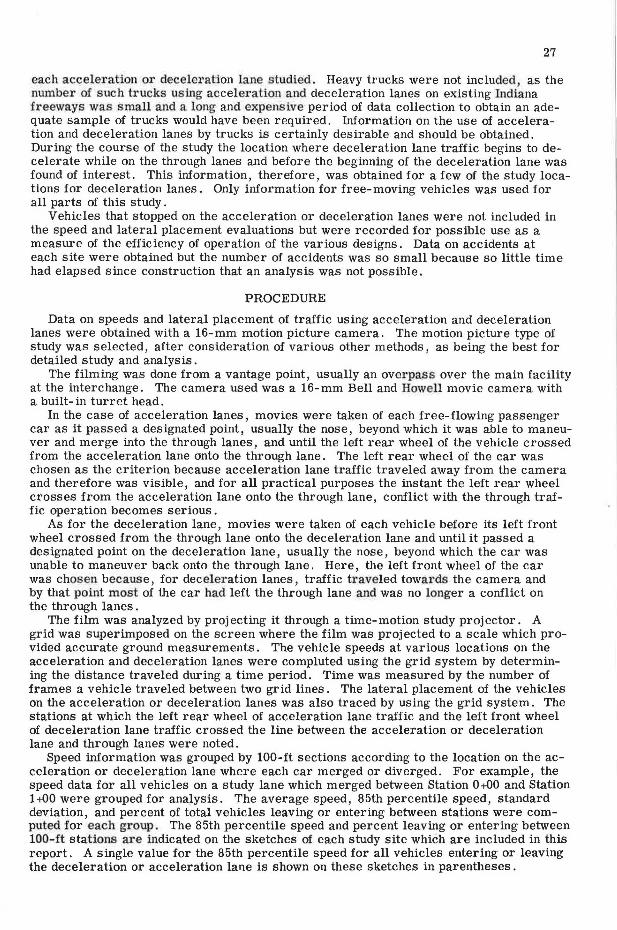
l ocation Ale~Indiana Toll Road, LaPorte Inter change , westbound t raffic.
Figure 8. Speeds and lateral placement of pas senger cars on type 1 acceleration lane, l oc ation Alf~Indiana Toll Ro ad, Gary East I nt erchange, eastbound traffic .
age leaving at the end of each 100 ft are also given. The average 85th percentile speed of all V9hiclelil using the acceleration lanes and at the time of their merging, except those that stopped, is shown by a number in parentheses; for example, (55). The 85th percentile speed for through lane traffic is given for a point within the area of merging and at a point approximately 1 mi from this area. All percentages of acceleration lane traffic used in this report are on the basis of the total number of passenger cars and light trucks using the lane which did not stop before entering the through lane.
The 85th percentile speed of acceleration lane traffic for location Ala at Station 0+00 was 48 mph (Fig. 3). The difference between the 85th percentile speed of through traffic within the area of conflict and the average 85th percentile speed of acceleration lane traffic as it merged into the through lane was 14 mph (69- 55). This difference is
TABLE 2
SUMMARY OF RESULTS-ACCELERATION LANES
Annual Av . Distance U bl Length of A 1 Was This D .1 T aff~ · 85th Percentile Speed Beyond Point Lsngtha e Accel. Lane Lcce · Accel. Lane a1 y r ic . e ane
F" G t . Type of of Separation of Unused by T aff" Used Location Nig · Ceomdiet· n~ Accel. Within Which 90\( A
1 90~ of Thr tic Satisfactorily
o . on 10n • cce . a Lane Accel. Through Station Avg . Through S eed Through Speed of Ac~el. Lane Lane• Through Sto ed as to
Accel. Lane P • Lane . • Traffic Merged Lane PP Lane Lane O..OO Lane w AOC' Diff · B.ACX:::5 Dilf · (ft) (ft) Traffic (ft) (%) Speed Placement
~Refers to condition given in Table 1. 4* :i:::: significant.
3Refers to type given in Table 1. 5 Beyond area of conflict. Within area of conflict. 6 That length from end of ramp curve to where acceleration lane width is 6 ft wide .
~ ~
34
t--- ------
Figure 9 . Acceleration lane, type 2.
statistically significant and indicates that much of the acceleration lane traffic did not accelerate to about the same speed as the through lane traffic before merging with it.
The difference between the 85th percentile speed of through lane traffic within the area of conflict and that beyond the area of conflict was zero (69-69}.
Ninety percent of the traffic using the acceleration lane merged into the through lane before Station 4+50. This indicates that the majority of drivers merged within a distance of about 185 ft (4+50 - 2+65) beyond the point of separation of the acceleration lane from the through lane by means of the paved shoulder.
For this 52: 1 taper design and at this location, the natural straight path of the left wheels of acceleration lane vehicles intersects the edge of the through lanes between Stations 4+00 and 5+00. Onlyl8.5percent of acceleration lane traffic, however, merged in this area. The majority (79. 6%} merged between Stations 3+00 and 4+00. It thus merged earlier than the natural straight path and at significantly lower speeds than through lane traffic .
A small percentage (1. 9%) merged into the through lanes between Stations 5+00 and 6+00 at an 85th percentile speed of 51 mph. This small percentage of vehicles made use of a longer distance of the acceleration lane, and yet they merged at lower speeds than those at the previous indicated locations. The reason for this is either that these cars had to slow down due to conflicts with through traffic or that the drivers hesitated before inerging due to inexperience in driving on high- type facilities or to not understanding the proper usage of acceleration lanes .
Of all vehicles using this acceleration lane, 1 percent stopped on the acceleration lane.
These results indicate that, at this location, this type of acceleration lane design was not being p-roperly used by the majority of drivers.
Type 2. - The second type of accel eration lane s tudied is s hown in Figure 9. The acceleration lane is of the parallel type having a full width lane for 350 ft plus 400 ft of taper . F ive locations of this type of acceleration lane were studied . At three of the locations, the acceleration lane meets the through lane on a tangent; at the fourth location, on a right curve; and at the fifth location, on a left curve. Station 0+00 for this type of lane was taken to be at the nose. Beyond this point, acceleration lane traffic could merge into the through lane. The results of the speed and lateral placement studies of these five locations are shown in Figures 10 through 14.
Type 3. -The third type of acceleration lane studied is shown in Figure 15. The acceleration lane is of the parallel type having a full width lane of 250 ft plus 250 ft of taper.
Two locations of this type of acceleration lane were studied. At the first location, the acceleration lane meets the through lane on a tangent, and at the second, on a left curve. No suitable location could be found where the acceleration lane met the through lane on a right curve. Figures 16 and 17 show the results of the speed and lateral placement studies at these two locations.
Type 4. - The fourth type of acceleration lane studied is shown in Figure 18. This accelerat ion lane is of the taper design, but has only 300 ft of taper.
Two locations of this type were studied and both were at the same interchange. At the first location, the acceleration lane meets the through lane on a tangent, and at the second, on a right curve. No suitable location could be found where the acceleration
85'"'- SPEED Of ACCEL. 46 50 -49 -49 46 43 49 42 LANE TRAFFIC ( 47)
85'" ~ SPEED OF THROUGH ----.zLM!!.E... ~E _TRAFFIC 4_ 68 66 ------t---
Figure 10. Speeds and lateral placement of passenger cars on type 2 acceleration lane, location A2a.-Interstate 65, S. R. 39 Interchange, northbound traffic.
- - --t----47 53 51 47 52
( 51)
62
43 57 52 t ---95lh 'I'. SPEED OF
ACCELERATION LANE TRAFFIC 85th 'I'. SPEED OF THROUGH LANE TRAFFIC
STATION
C\)IAl.ATIVE %
Figure 11. Speeds and lateral placement of passenger cars on type 2 acceleration lane, location A2b~Tri-State Highway, Kennedy Avenue Interchange, eastbound traffic.
95th % SPEED 62 55 52 55 54 55 57 55 OF ACCELERATION LANE TRAFFIC
95th % SPEED ( 55)
OF THROUGH LANE T RAFFIC 63 ---Z.L.Mlil ---- t - ----
61
----t----Figure 12. Speeds and lateral placement of passenger cars on type 2 acceleration lane,
location A2c~Interstate 74, Post Road Interchange, eastbound traffic.
36
ssth % SPEED 45 48 OF ACCELERATION LANE TRAFFIC
ssth % SPEED
54 47 43 51 49 42
( 50)
OF THROUGH LANE TRAFFIC 58 ,. I MILE_ --- - t- - - 64
- - - t---
Figure 13. Speeds and l ateral placement of. passenger cars on t ype 2 acceleration lane, l ocation A2d-Interstate 65, S. R. 60 Interchange, southbound traffi c .
---t- --
44 44 46 50
-----tt_ es''"4 SPEEO OF THROUGH LANE TRAFFIC
l _MU_E..s--67 es•• "4 SPEEO OF 42 !,GGEL. LAME TRAFFIC
% LEAVING 55.6% 13.9% 8.3o/o 10.2% 6.5% 5.5% BETWEEN STATIONS
~~ ~J J Jo J j J i ~
0 0 0 0 STATION + + + + + + + - N l<l f 1itl !!I p..
0
55.6 • 695% 77.8% ·eao% 94.5 100% CUMULATIVE 'I.
Figure 14. Speeds and l ateral placement of passenger cars on type 2 acceleration lane, location A2e-Interstate 65, S. R. 39 Inte rchange, southbound traffic.
lane met the through lane on a left curve. Figures 19 and 20 show the results of the speed and lateral placement studies at these two locations.
Deceleration Lanes
The locations of the deceleration lanes studied are also shown in Figure 1, and pertinent data for each location are given in Table 3. These locations are referenced like those for acceleration lanes , except that the D stands for deceleration lanes. ~.-The first type of deceleration lane studied was on the Indiana Toll Road
(Fig. 21). The decP.l1m1tion lane is 1,200 ft long from the right edge of the through lane to the beginning of the ramp curve. It cons is ts of 845 ft of direct taper, having an angle of diver gence of 1° 30 min with the thr ough lanes. Along this distance, the deceleration lane is not separated from the through lane . It is then connected to a 356-ft direct taper , having an angle of divergence of 4° with the through lane. For this 356 ft, the deceleration lane is separated from the through lanes by a shoulder paved but of a different color than the traveled area. The exit nose is offs et 6 ft from the edge of the through lane, and there are 17 3 ft of recovery.
Three locations were studied of this type of deceleration lane. At two of the locations,
37
~:RIABLE--~--i.r------ 250'-----N~,------ 250'-----'• r ~1-~
Figure 16. Speeds and lateral placement of passenger cars on type 3 acceleration lane, location A3a~Interstate 65, S. R. 56 Interchange, northbound traffic,
95th 'X. SPEED 62 5 7 53 51 53
Of ACCELERATION LANE TRAFFIC ( 53) 95lh 'X. SPEED E 64
Of THR?lJGH LANE t_TRAFFIC 6_3
--z.LMlL _ -------- t ---- - -
Figure 17. Speeds and lateral placement of passenger cars on type 3 acceleration lane, location A3b~Interstate 65, S. R. 334 Interchange, northbound traffic,
the deceleration lane leaves the through lanes on a tangent, and at the third, on a left curve. No suitable location could be found where the deceleration lane left the through lane on a right curve.
Station O-t-00 was taken at the nose, which is the point where the paved shoulder that
38
--------
<f
"'
--- - ---it--- ----
Figure 18. Acceleration lane , type 4.
44 48
60 ( 48)
48
- ----9-5t-,-h \0
SPEED OF - - - -
l_Mll.L=---- 66 THROUGH LANE TRAFFIC
49 85 th % SPEED OF
ACCELERATION LANE TRAFFIC
Figure 19. Speeds and lateral placement of passenger cars on type 4 acceleration lane, location A4a- 'l'ri -State Highway, Calumet Ave. I nLere:hange, eastbound traffic.
-+-,.,. L £.AY fHC DCTWE(PI STATI ON$
851h'}'. SPEED OF THROUGH LANE ThRAFFIC
85 % SPEED OF ACCELERATION L ANE TRAFFIC~~{ · ----~--
60
41 (45)
_ _ _ 4~7~ t-__ 4_1 . - --
Figure 20. Speeds and lateral placement of passenger c ars on type 4 acceleration lane, location A4b-Tri-State Highway, Calumet Ave. Interchange, westbound traffic.
separates the deceleration lane and the through lane begins. At the end of the deceler ation lane and the beginning of the exit ramp there is an advisory speed sign, "Ramp Speed 25."
---t - -ssrh "· PEED OF
DECEL. LANE TRAFFIC 55 69 70 70 71 70
CUMULATIVE 'X. ' o,J,.J,,,J.,,J STATION
Figure 22. Speeds and lateral placement of passenger cars on type 1 deceleration lane, location Dla-Indiana Toll Road, Gary West Interchange, eastbound traffic.
t l00t 963\f- t ... o o/ 926\ 657t92\ N :, s1 g 0
... .. 0 + +
<D ,.._
851 % SPEED 52 59 56 60 60 59 4 7 OF DECELERATION LANE TRAFFIC ....i,CO .l,_, -
--- t t - ---Figure 23. Speeds and lateral placement of passenger cars on type 1 decel eration lane,
location Dlb-Indiana '!'all Hoad, Michigan City Interchange , westbuurnl Lraffle.
Figures 22, 2 3, and 24 show the results of the speed and lateral placement studies at these three locations. The results at location Dlc are described next as an example of how the information shown in the figures was analyzed. Also, summaries of the important deceleration lane characteristics and of the results obtained at each location studied are given in Table 4.
The deceleration lane leaves the through lane at location Dlc on a left curve. The annual average daily traffic on the deceleration lane was 730 vehicles per day and on the through lanes eastbound was 6, 630 vehicles per day .
The difference between the 85th percentile speed of through lane traffic within the area of conflict and the average 85th percentile speed of deceleration lane traffic as it diverged into the deceleration lane was 14 mph {69- 55) (Fig. 24). This difference is significant, and indicates that most of this deceleration lane traffic started to decelerate 011 the tlu·ough an before diverging into the deceleration lane.
Becaµse of the significant deceleration on the through lane at this location, a study was made as to where it occurred with respect to the beginning of the deceleration lane. Figure 25 shows for 200-ft intervals prior to the beginning of the deceleration lane the
41
--~-------85'h '· SPEED OF - -- t 69 • 2 ~ ~ - - 69 THROUGH LANE TRAFFIC )
85'h ~ SPEED OF l 55 56 DECEL. LANE TRAFFIC 68 5 --------
STATION
CUMULATIVE % ~I Jo Jo Jo Jo J~ J• inf + + + ! () -
8,3"/o ¢ 25.9% r') 37.0o/oN 67.6% 96.3"/o 100%
1
0 0 + (\I
I
Figure 24. Speeds and lateral placement of passenger cars on type 1 deceleration lane, location Dlc-Indiana Toll Road, Chesterton-Valparaiso Interchange, eastbound traffic.
70
0 w w Cl. (/) 65
w _J
.... z w (.)
60 Q: w Cl.
~
"' "' 55
50 0 200
Through Lone Traffic 0
Oeceleration Lane Traffic
400 600 STATION
BOO
-- -- ------0
1000
Figure 25. Determination of point where deceleration lane traffic begins to decelerate on through lane, location Dlc,
85th percentile speeds for the traffic that later entered the deceleration lane. Through traffic in this area was traveling at 69 mph. There is a clear indication that some of the traffic planning to use the deceleration lane at this location begins to decelerate well in advance (over 1, 000 ft) of the deceleration lane.
The data in Figure 22, as well as that in similar figures for other deceleration lanes, are similar to that given for acceleration lanes, and explained earlier in this report.
Approximately 90 percent of the drivers using the deceleration lane diverged within a distance of approximately 400 ft.
The natural straight path of exit of the left wheels of the vehicles, which was taken as a line parallel to but offset by a distance of 3 ft from that path joining the point of beginning of the deceleration lane with the end point of the deceleration lane at the nose (Station 0+00), intersects the through lane between Station 4+00 and 5+00, where only
TABLE 4
SUMMARY OF RESULTS-DECELERATION LANES
Annual Avg. 85th Percentile Speed Distance Usable Length of Figure Geomet ric Type of Daily Traffic
Within Which Length Decel. Lane Location Decel. No. Condition' Lane2 Avg. Through Through 90 % of Decel. of Not Used by
Dec el. Through Station Speed Speed Lane Traffic Dec el. 90% of Lane Lane 0-tOO Decel . Lane Diff. 4 Lane Diff. 4 Diverged in Lane" Traffic
r0 + o r G + o ~ Cle.,-... e,,. .,. + o ~ -.ree.v "'"'~
CUMULATOVE ~ 0 .9 % 17.6 % N 94.5 % ~ '<>o % f Figure 27. Speeds and lateral placement of passenger cars on type 2 deceleration lane,
location D2a-Interstate 65, State Route 39 Interchange, southbound traffic,
a small per.centage (8. 3%) of deceleration lane traffic diverged at an 85th percentile speed of 68 mph . Most of the remaining drivers diverged later and at lower speeds, thus indicating deceleration on the through lane instead of on the deceleration lane. This could have been aggravated by the effect of the left cul'Ve.
A small percentage (3. 7%) of deceleration lane traffic crossed the paved shoulder and diverged between Stations 0+00 and 1+00 at an 85th percentile speed of 46 mph. This speed is lower than that of other observed deceleration lane traffic, and this might have been caused by these drivers hesitating on the through lane and making the decision at the last minute to leave at this interchange.
These results indicate that drivers were not properly using the deceleration lane at this location for this roadway geometry and this type of deceleration lane design.
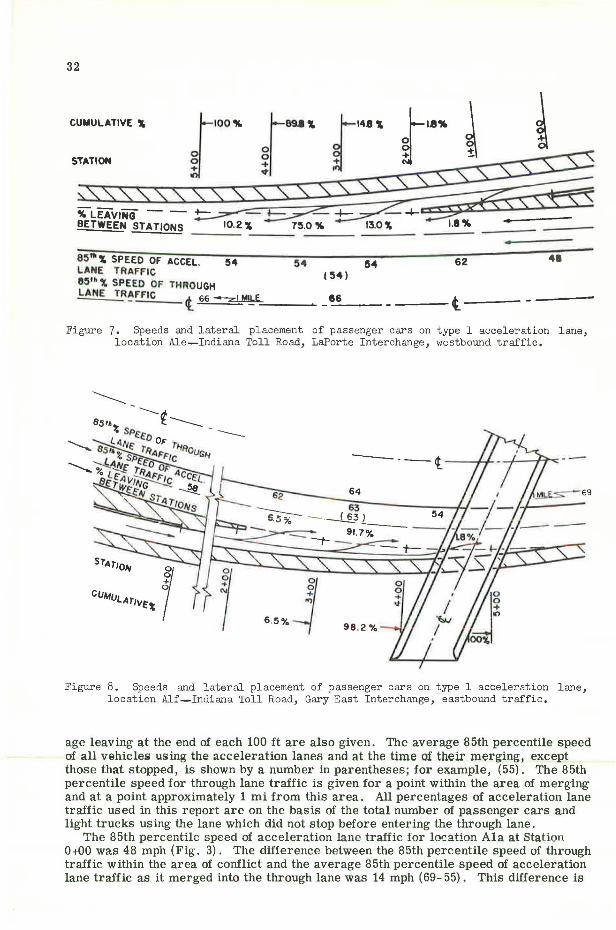
Type 2. -The second type of deceleration lane studied is shown in Figure 26. The deceleration lane has a taper from 0 to 12 ft in a distance of 250 ft, followed by 50 ft of tangent and 195 ft of curve. Near the exit nose there is a regulatory speed sign, "Exit Speed 40." Three locations of this type of deceleration lane were studied. At two of the locations, the deceleration lane leaves the through lane on a tangent, and at the third, on a right horizontal curve. No suitable location could be found where the deceleration lane left the through lane on a left curve. Station 0+00 was taken at the nose of the deceleration lane. The results of the speed and lateral placement studies at these locations are shown in Figures 27, 28, and 29.
., •• ,. SPEED OF - ...:..__i 50 l - - - - -THROU - - - .... r ~ 70 -- GH LANE TRAFFIC 68 1 ~
- ct--- ---t----Figure 29 . Speeds and l at eral pl acement of passenger cars on type 2 de cel er ation l ane ,
l ocation D2c-Interstate 65 , Stat e Route 39 Inter change , northbound traffic.
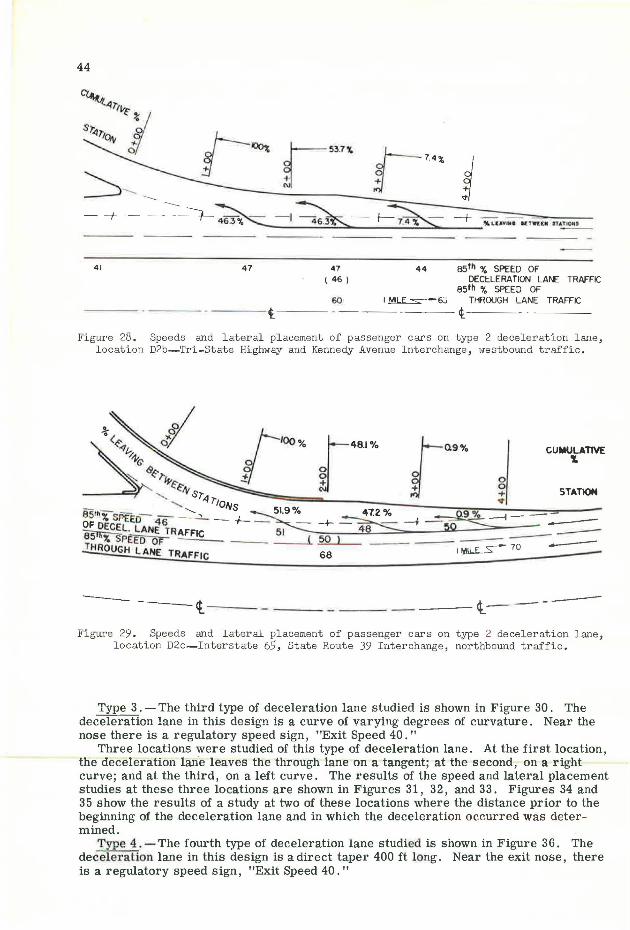
Type 3. -The third type of deceleration lane studied is shown in Figure 30. The deceleration lane in this design is a curve of varying degrees of curvature. Near the nose there is a regulatory speed sign, "Exit Speed 40."
Three locations were studied of this type of deceleration lane. At the first location, the deceleration lan·e leaves the through lane on a tangent; at the second, on a right curve; and at the third, on a left curve. The results of the speed and lateral placement studies at these three locations are shown in Figures 31, 32, and 33. Figures 34 and 35 show the results of a study at two of these locations where the distance prior to the beginning of the deceleration lane and in which the deceleration occurred was determined.
Type 4 . -The fourth type of deceleration lane studied is shown in Figure 36. The deceler ation lane in this design is a direct taper 400 ft long. Near the exit nose, there is a regulatory speed sign , "Exit Speed 40."
<r --- N ---- ----VA-R IABLE
Figure JO. Deceleration lane, type J,
-- ------ t---95th "/0 SPEED
OF THROUGH LANE TRAFFIC 65 ---"LLMlLE. 95th % SPEED
OF DECELERATION LANE TRAFFIC 51
T, LEAVING BETWEEN STATIONS
STATION
CUMULATIVE %
62 ( 51
41
45
46
Figure 31. Speeds and lateral placement of passenger cars on type 3 deceleration lane, location DJa~Interstate 74, S. R. 9 Interchange, eastbound traffic.
--- - t----esth % SPEED OF THROUGH --LANE TRAFFIC 6 7 ---zLM!J...E 65 e5lh % SPEED OF DECELERATION ( 54 I
LANE TRAFFIC 54 47 50
Figure 32. Speeds and lateral placement of passenger cars on type 3 deceleration lane, location DJb~Interstate 65 and S, R. 334 Interchange, southbound traffic.
~ •oo•--/ 1 Figure 33. Speeds and lateral placement of passenger cars on type 3 deceleration lane,
location D3c- Interstate 65 and S. R. 60 Interchange, northbound traffic.
60
a lJJ lJJ (l_ If)
55 lJJ 0 _J
!-z lJJ u a: 50 0 lJJ a..
.£:. +-LO co
45
0 200 400 600 STATION
Through
0
800
Lane Traffic
------
0
Lone Traffic
1000 1200
Figure 34. Determination of point where deceleration lane traffic begins to decelerate on through lane, location D3a.
Only one location was studied of this type of deceleration lane as it was the only one completed as of the date of this study. Figure 37 shows the results of the speed and lateral placement study at this location.
Type 5. -The fifth type of deceleration lane studied is shown in Figure 38 . The deceleration lane in this design is a variable distance, direct taper followed by a curve. Near the exit nose, there is a regulatory speed sign, "Exit Speed 40."
70
0 w w (}._
en 65
w _J
i=: z w u a:: 60 -w (}._
:!: I[) (X)
55
50 0 400 800 1200
STATION
47
Lone Traffic
0
Deceleration Lone Traffic
1600 2000
Figure 35. Determination of point where deceleration lane traffic begins to decelerate on through lane, location D3b.
95th % SPEED OF I M1L.E.=-- 63 THROUGH LANE TRAFFIC
----t ----Figure 37. Speeds and lateral placement of passenger cars on type 4 deceleration lane,
location D4a~Interstate 74, Pleasant View Interchange, eastbound traffic.
48
CURB
s -VARIABLE -----=-~- i _
Figure 38. Deceleration lane, type 5.
.._ LEAVING BETWEEN STfTIONS ---- 1---
l--99~ 1-~, El 6
-/--
95th % SPEED 32 37 48 36 OF DECELERATION LANE TRAFFIC
95th 'l'0 SPEED ( 46)
OF THROUGH LANE TRAFF:_IC 62 ---z!_M!U t_ ---~6~3- ----- t-----Figure 39. Speeds and lateral placement of passenger cars on type 5 deceleration lane,
location D5a~Tri-State Highway and Calumet Avenue Interchange, westbound traffic.
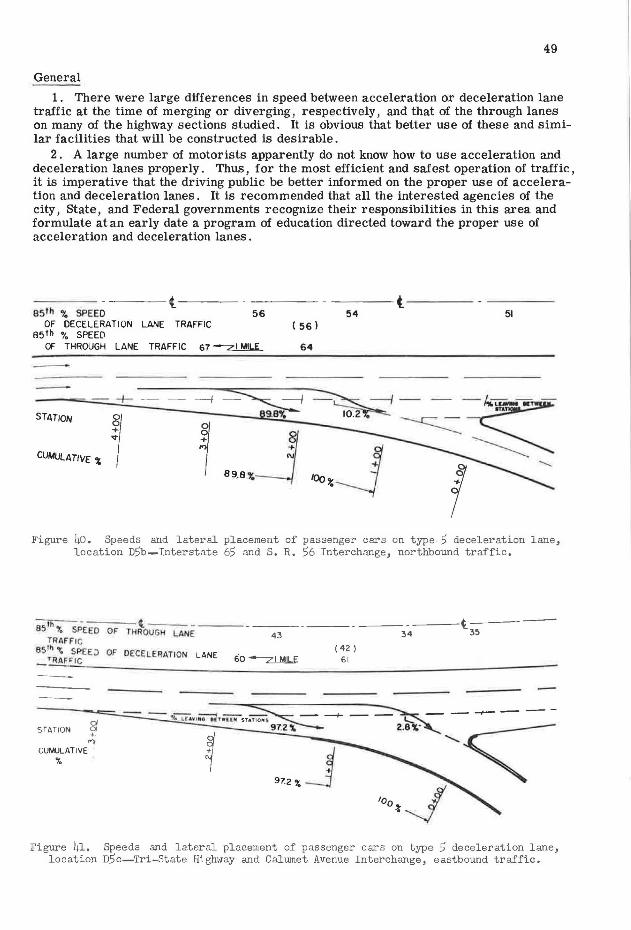
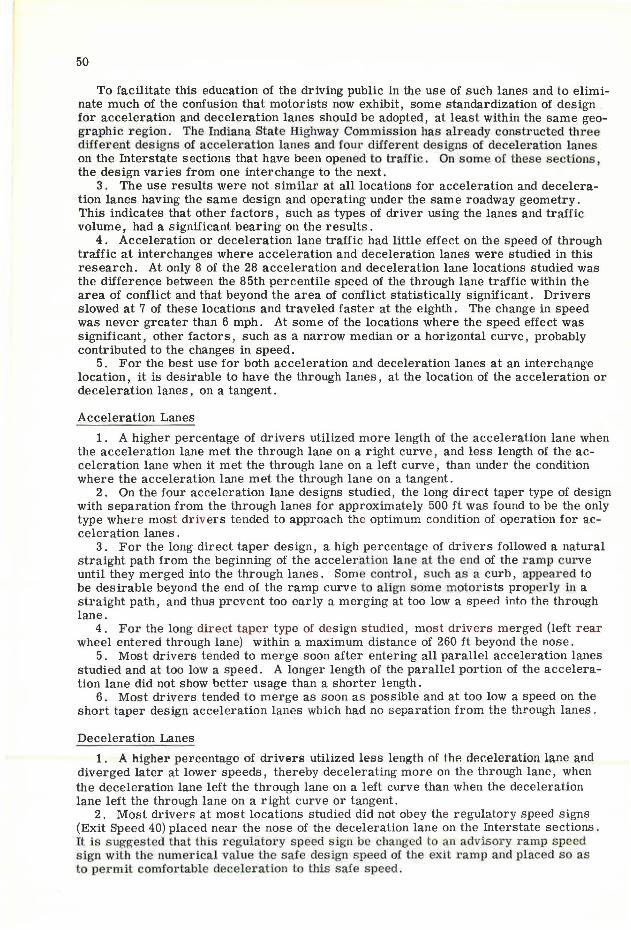
Three locations were studied of this type of deceleration lane. At the first two locations, the deceleration lanes leave the through lanes on a tangent, and at the third, on a left curve. At the first and third locations, the length of the tangent section is 200 ft and the length of the curve portion to the nose is 139 ft , whereas at the second location, these lengths are 250 and 217 ft, respectively. Figures 39, 40, and 41 show the results of the speed and lateral placement studies at these three locations.
SUMMARY AND FINDINGS
Summaries of the important acceleration lane characteristics and of the results obtained at each location studied are given in Table 2. A similar table for the deceleration lanes studied is Table 4. These two tables provide a comparison of the us e characteristics found on the various designs and permit a rather rapid comparison of the various des igns.
The behavior of vehicles on acceleration and deceleration lanes as found and reported in the figures and tables indicates the following:
49
General
1. There were large differences in speed between acceleration or deceleration lane traffic at the time of merging or diverging, respectively, and that of the through lanes on many of the highway sections studied. It is obvious that better use of these and similar facilities that will be constructed is desirable .
2. A large number of motorists apparently do not know how to use acceleration and deceleration lanes properly. Thus, for the most efficient and safest operation of traffic, it is imperative that the driving public be better informed on the proper use of acceleration and deceleration lanes. It is recommended that all the interested agencies of the city, State, and Federal governments recognize their responsibilities in this area and formulate at an early date a program of education directed toward the proper use of acceleration and deceleration lanes.
95th % SPEED ~~~~t-~~-
OF DECELERATION LANE TRAFFIC 85 th "10 SPEED
56
OF THROUGH LANE TRAFFIC 67 --z1.M!LE...
54 51 ( 56)
64
Figure 40. Speeds and lateral placement of passenger cars on type 5 deceleration lane, location D5b~Interstate 65 and S. R. 56 Interchange, northbound traffic.
85 1h 'l:. SPE_E_O--- it - ----OF THROUGH LANE
TRAFFIC
asrn % SPEEJ OF DECELERATION LANE - TRAF• IC
d STATION '?,
~
CUMULATIVE %
43 ( 42)
61
34----t35
-~-~---
.~ '~
Figure 41. Speeds and lateral placement of passenger cars on type 5 deceleration lane, location D5c~Tri-State Highway and Calumet Avenue Interchange, eastbound traffic.
50
To facilitate this education of the driving public in the use of such lanes and to eliminate much of the confusion that motorists now exhibit, some standardization of design for acceleration and deceleration lanes should be adopted, at least within the same geographic r egion. The Indiana Sta te Highway Commission has already constructed three diife1·ent designs of accel eration lanes and four different designs of deceleration lanes on the Interstate sections that have been opened to traffic . On some of these sections, the design varies from one interchange to the next.
3. The use results were not similar at all locations for acceleration and deceleration lanes having the same design and operating under the same roadway geometry. This indicates that other factors, such as types of driver using the lanes and traffic volume, had a significant bearing on the results.
4. Acceleration or deceleration lane traffic had little effect on the speed of through traffic at interchanges where acceleration and deceleration lanes were studied in this research . At only 8 of the 28 acceleration and deceleration lane locations studied was the difference between the 85th percentile speed of the through lane traffic within the area of conflict and that beyond the area of conflict statistically significant. Drivers slowed at 7 of these locations and traveled faster at the eighth. The change in speed was never greater than 6 mph. At some of the locations where the speed effect was significant , other factors, such as a narrow median or a horizontal curve, probably contributed to the changes in speed.
5. For the best use for both acceleration and deceleration lanes at an interchange location, it is desirable to have the through lanes, at the location of the acceleration or deceleration lanes, on a tangent.
Acceleration Lanes
1. A higher percentage of drivers utilized more length of the acceleration lane when the acceleration lane met the through lane on a right curve , and less length of the acceleration lane when it met the through lane on a left curve, than under the condition where the acceleration lane met the through lane on a tangent.
2. On the four acceleration lane designs studied, the long direct taper type of design with separation from the through lanes for approximately 500 ft was found to be the only type where most drivers tended to approach the optimum condition of operation for acceleration lanes .
3. For the long direct taper design, a high percentage of drivers followed a natural straight path from the beginning of the acceleration lane at the end of the r amp curve until they merged into the through lanes. Some control s uch as a curb , appeared to be desirable beyond the end of the ramp curve to align some motorists properly in a straight path, and thus prevent too early a merging at too low a speeci into the through lane.
4. For the long direct taper type of des ign studied, most drivers merged (left r ear wheel entered through lane) within a maximum distance of 260 ft beyond the nose.
5. Most drivers tended to merge soon after entering all parallel acceleration lanes studied and at too low a speed. A longer length of the parallel portion of the acceleration lane did not show better usage than a shorter length.
6. Most drivers tended to merge as soon as possible and at too low a speed on the short taper design acceler ation lanes which had no s eparation from the through lanes.
Deceleration Lanes
1 . A higher percentage of drivers utilized less length of the de~eleration lane and diverged later at lower speeds , thereby decelerating more on the through lane, when the deceleration lane left the through lane on a left curve than when the deceleration lane left the through lane on a right curve or tangent.
2. Most drivers at mos t locations studied did not obey the r egulatory speed signs (Exit Spee d 40) placed near the nose of the deceleration lane on the Interstate sections . It is suggested that this regulatory s peed sign be changed to an advisory r a mp speed sign with the numerical value the safe design speed of the exit r amp and placed so as to permit comfortable deceleration to this safe speed.
51
3. At all but one of the locations studied, much of the deceleration lane traffic started to decelerate on the through lane before diverging into the deceleration lane . The results further show that many drivers began to decelerate well in advance (more than 1, 000 ft) of the beginning of the deceleration lane.
4. Of the five types of design studied, the long direct taper type of deceleration lane with separation of the lane from the through lane for about 300 ft (as on the Indiana Toll Road) was found to be the best. On this design, most drivers tended to approach the optimum condition of operation for deceleration lanes.
5. Most drivers on the deceleration lanes studied desired to follow a natural straight path of exit with a minimum of maneuvering.
6. Ninety percent of the drivers diverging onto a deceleration lane did so within a maximum distance of 300 ft, except for one case where the lane was on a left horizontal curve.
7. The curve type design for deceleration lanes tended to provide good usage throughout the length of the lane, but most drivers decelerated considerably before entering lanes of this design.
8. Most drivers tended to decelerate appreciably on the through lane where a short direct taper design was used.
REFERENCES
1. "A Policy on Geometric Design of Rural Highways." American Association of State Highway Officials (1959).
2. Beakey, J. , "Acceleration and Deceleration Character istics of Private Passenger Vehicles." HRB Proc., 18:Pt. 1, pp. 81-89 (1938).
3 . "Braking Performance of Motor Vehicles." U. S. Bureau of Public Roads. 4. Conklin, R. D. , "A Comparison of Vehicle Operating Characteristics Between
Parallel Lane and Direct Taper Types of Freeway Off-Ramps." Proc., Institute of Traffic Engineers (1959) .
5. Covault, D. 0. , "Time-Lapse Movie Photography Use to Study Traffic Flow Characteristics." Traffic Engineering (March 1960).
6. Fisher, R. C. , "Types and Lengths of Acceleration and Deceleration Lanes as They Affect Traffic Accidents." Assistant Supervising Engineer, State Highway Department of New Jersey.
7. "Freeway Operations." Institute of Traffic Engineers (1961). 8. Fukutome, I., and Moskowitz, K., "Traffic Behavior and On-Ramp Design." HRB
Bull . 235, 38-72(1959). 9. Keese, C. J., Pinnell, C., and Mccasland, W. R., "A Study of Freeway Traffic
Operations." HRB Bull. 235, 73-132 (1959). 10. Malo, A. F. , Mika, H. S. , and Walbridge, V. P. , "Traffic Behavior on an Urban
Expressway." HRB Bull. 235, 19-37 (1959). 11. Normann, 0. K., "Research Needed to Keep Pace with Changing Traffic Trends."
Traffic Quart. (July 1958) . 12. Pinnell, C. , and Keese, C. J. , "Freeway Ramps." Texas Transportation Institute,
Texas A and M College System. 13. Stonex, K. A., "Review of Vehicle Dimensions and Performance Characteristics."
HRB Proc., 39:467-478 (1960). 14. Webb, G. M., andMoskowitz, K., "California Freeway Capacity Study, 1956."
Proc. , Institute of Traffic Engineers (Sept. 1957). 15. Wilson, E. E., "Deceleration Distance for High Speed Vehicles." HRB Proc.,