Water-Resources Investigations Report 00-4035 IN COOPERATION WITH NEW HAMPSHIRE DEPARTMENT OF TRANSPORTATION Use of a Ground-Penetrating Radar System to Detect Pre- and Post-Flood Scour at Selected Bridge Sites in New Hampshire, 1996-98 U.S. Department of the Interior U.S. Geological Survey
Transcript
Water-Resources Investigations Report 00-4035
IN COOPERATION WITHNEW HAMPSHIRE DEPARTMENT OF TRANSPORTATION
Use of a Ground-Penetrating Radar System to Detect Pre- and Post-Flood Scour at Selected Bridge Sites in New Hampshire, 1996-98
U.S. Department of the InteriorU.S. Geological Survey
Cover photograph is showing the Peabody River in Gorham, N.H. Mount Washington and the Presidential Range is in the background. (Photograph was taken by J.R. Olimpio, U.S. Geological Survey)
Use of a Ground-Penetrating Radar System to Detect Pre- and Post-Flood Scour at Selected Bridge Sites in New Hampshire, 1996-98
U.S. Department of the InteriorU.S. Geological Survey
Water-Resources Investigations Report 00-4035
By Joseph R. Olimpio
Pembroke, New Hampshire2000
IN COOPERATION WITHNEW HAMPSHIRE DEPARTMENT OF TRANSPORTATION
U.S. DEPARTMENT OF THE INTERIORBRUCE BABBITT, Secretary
U.S. GEOLOGICAL SURVEY
Charles G. Groat, Director
The use of firm, trade, and brand names in this report is for identification purposes only and doesnot constitute endorsement by the U.S. Geological Survey.
For additional information write to: Copies of this report can be purchased
U.S. Geological SurveyInformation ServicesBox 25286Federal CenterDenver, CO 80225
from:
District ChiefU.S. Geological SurveyNew Hampshire/Vermont District361 Commerce WayPembroke, NH 03275-3718
or through our website at http://nh.water.usgs.gov
Purpose and Scope ....................................................................................................................................................... 2Description of the Study Area ..................................................................................................................................... 4Use of Terms................................................................................................................................................................ 4Acknowledgments ....................................................................................................................................................... 4
Summary and Conclusions .................................................................................................................................................... 24References Cited .................................................................................................................................................................... 27
FIGURES
1. Map showing the location of ground-penetrating-radar data-collection sites at seven bridge sites in New Hampshire ...................................................................................................................................................... 3
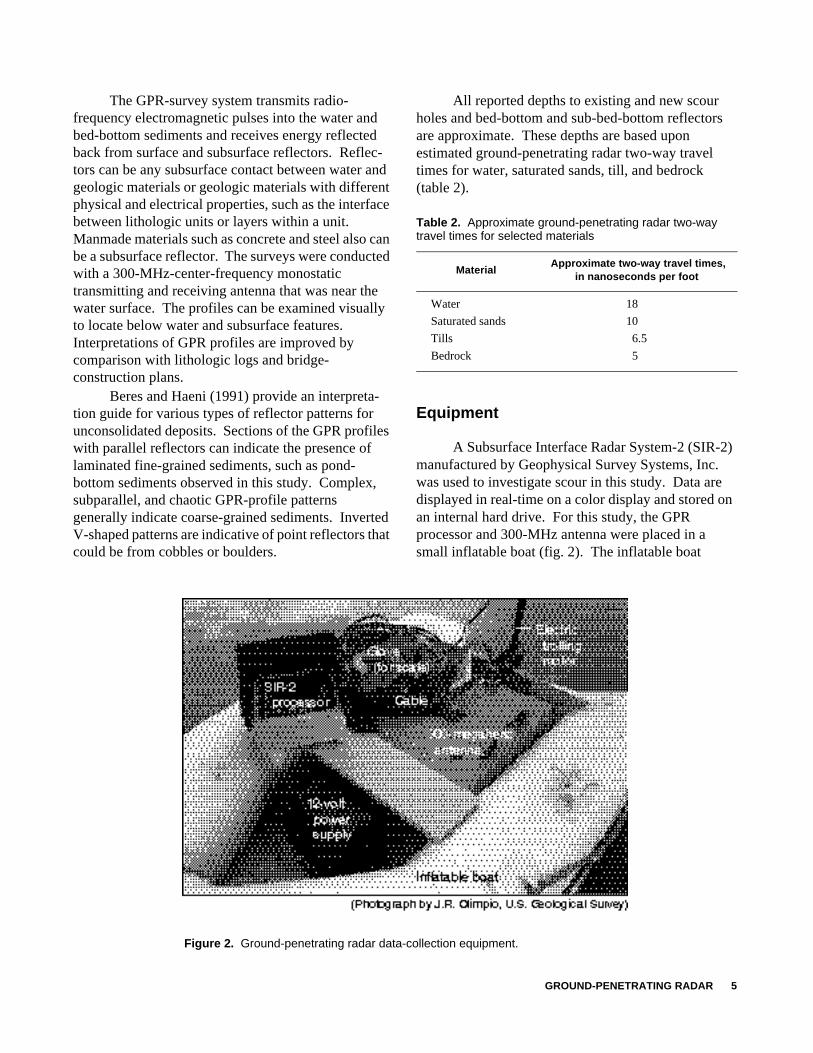
2. Photograph of ground-penetrating radar data-collection equipment .......................................................................... 53-13. Figures showing ground-penetrating-radar profiles of the:
3. Downstream bridge-face cross sections for (A) 1996 pre-flood and (B) 1998 post-flood data collection, from left to right bank, Route 9 over the Soucook River, Concord, N.H. ......................................................... 11
4. Pier-set cross sections for (A) 1996 pre-flood and (B) 1998 post-flood data collection, from upstream to downstream, Route 9 over the Soucook River, Concord, N.H. ......................................................................... 12
5. Upstream bridge-face cross sections for (A) 1996 pre-flood and (B) 1998 post-flood data collection, from left to right bank, Route 18 over the Connecticut River, Littleton, N.H. .................................................. 13
6. Upstream bridge-face cross sections for (A) 1997 pre-flood and (B) 1998 post-flood data collection, from pier to right bank, Route 13 over the Cold River, Sandwich, N.H............................................................ 15
7. Downstream bridge-face cross sections for (A) 1997 pre-flood and (B) 1998 post-flood data collection, from pier to right bank, Route 13 over the Cold River, Sandwich, N.H............................................................ 17
8. Upstream bridge-face cross sections for (A) 1996 pre-flood and (B) 1998 post-flood data collection, from left to right bank, Routes 202 and 9 over the Contoocook River, Hopkinton, N.H. ................................. 18
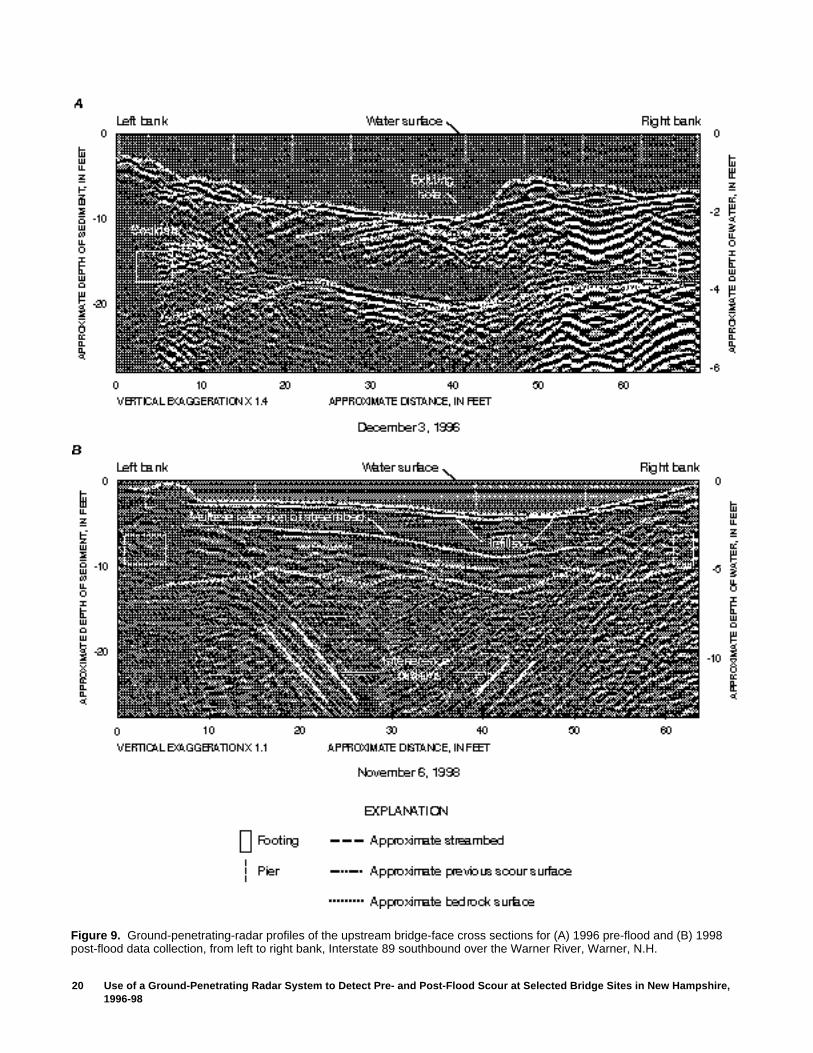
9. Upstream bridge-face cross sections for (A) 1996 pre-flood and (B) 1998 post-flood data collection, from left to right bank, Interstate 89 southbound over the Warner River, Warner, N.H. .................................. 20
CONTENTS
VI Contents
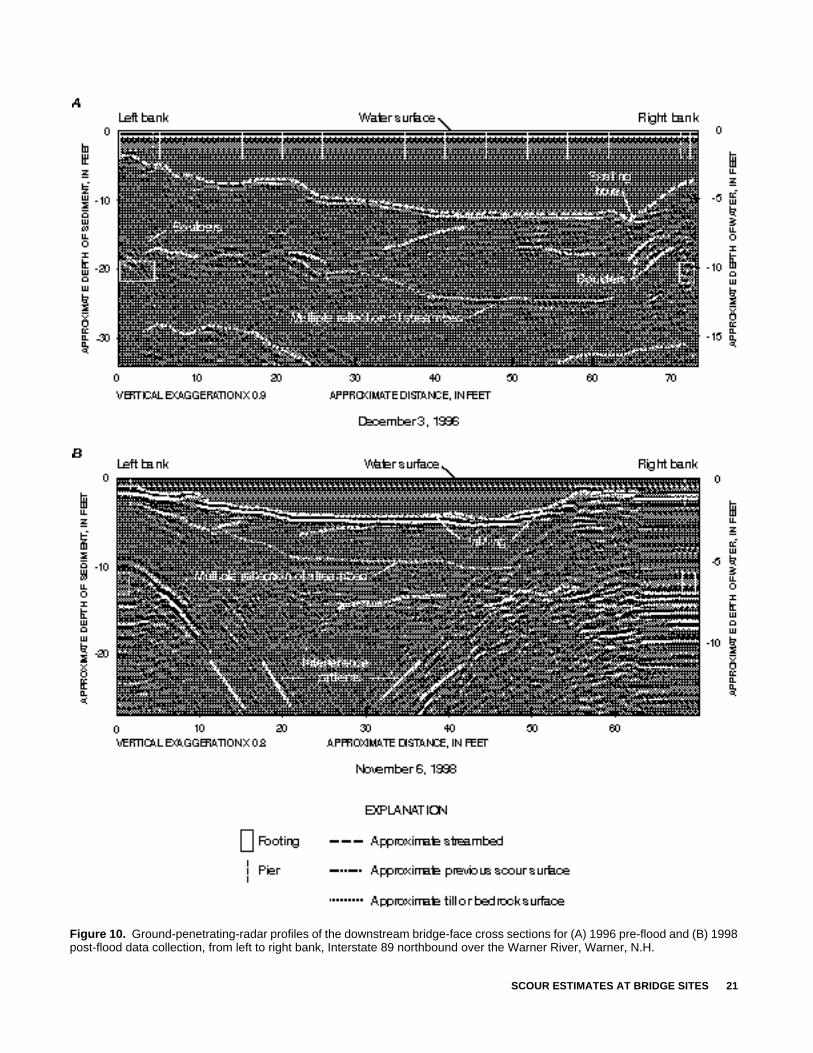
10. Downstream bridge-face cross sections for (A) 1996 pre-flood and (B) 1998 post-flood data collection, from left to right bank, Interstate 89 northbound over the Warner River, Warner, N.H................................... 21
11. Upstream bridge-face cross sections for (A) 1996 pre-flood and (B) 1998 post-flood data collection, from left to right bank, Routes 3 and 25 over the Pemigewassett River, Ashland, N.H. .................................. 23
12. Downstream bridge-face cross sections for (A) 1996 pre-flood and (B) 1998 post-flood data collection, from left to right bank, Route 13 over the Souhegan River, Milford, N.H. ...................................................... 25
13. Right-bank pier cross section for (A) 1996 pre-flood and (B) 1998 post-flood data collection, from upstream to downstream, Route 13 over the Souhegan River, Milford, N.H........................................... 26
TABLES
1. Selected descriptive characteristics of seven bridge sites in New Hampshire........................................................ 42. Approximate ground-penetrating radar two-way travel times for selected materials............................................. 53. Flood-flow data at stream-gaging stations near seven bridges in New Hampshire................................................ 74. Ground-penetrating-radar scour data for seven bridges in New Hampshire .......................................................... 8
CONVERSION FACTORS, ABBREVIATIONS, AND SEA LEVEL
Sea Level: In this report "sea level" refers to the National Geodetic Vertical Datum of 1929(NGVD of 1929)—a geodetic datum derived from a general adjustment of the first-order level netsof both the United States and Canada, formerly called Sea Level Datum of 1929.
ABBREVIATIONS USED IN THIS REPORT
MHz = megahertz
Multiply By To obtain
foot (ft) 0.3048 metermile (mi) 1.609 kilometer
cubic feet per second (ft3/s) 0.02832 cubic meter per second
Abstract 1
Abstract
Ground-penetrating radar was used to measure the depth and extent of existing and infilled scour holes and previous scour surfaces at seven bridges in New Hampshire from April 1996 to November 1998. Ground-penetrating-radar survey techniques initially were used by the U.S. Geological Survey to study streambed scour at 30 bridges. Sixteen of the 30 bridges were re-surveyed where floods exceeded a 2-year recurrence interval. A 300-megahertz signal was used in the ground-penetrating radar system that penetrated through depths as great as 20 feet of water and as great as 32 feet of streambed materials.
Existing scour-hole dimensions, infilled thickness, previous scour surfaces, and streambed materials were detected using ground-penetrating radar. Depths to riprap materials and pier footings were identified and verified with bridge plans. Post data-collection-processing techniques were applied to assist in the interpretation of the data, and the processed data were displayed and printed as line plots. Processing included distance normalization, migration, and filtering but processing was kept to a minimum and some interference from multiple reflections was left in the record.
Of the 16 post-flood bridges, 22 ground-penetrating-radar cross sections at 7 bridges were compared and presented in this report. Existing scour holes were detected during 1996 (pre-flood) data collection in nine cross sections where scour depths ranged from 1 to 3 feet. New scour holes were detected during 1998 (post-flood) data
collection in four cross sections where scour depths were as great as 4 feet deep. Infilled scour holes were detected in seven cross sections, where depths of infilling ranged from less than 1 to 4 feet. Depth of infilling by means of steel rod and hammer was difficult to verify in the field because of cobble and boulder streambeds or deep water.
Previous scour surfaces in streambed materials were identified in 15 cross sections and the depths to these surfaces ranged from 1 to 10 feet below the streambed. Riprap materials or pier footings were identified in all cross sections. Calculated record depths generally agree with bridge plans. Pier footings were exposed at two bridges and steel pile was exposed at one bridge. Exposures were verified by field observations.
INTRODUCTION
In 1993, the New Hampshire Department of Transportation (NHDOT) completed scour analysis of 48 bridges across the State that had previously been determined to be scour susceptible. Based on recommended procedures outlined in Richardson and others (1993), 44 of the 48 bridges evaluated had scour estimated to extend below the top of the footings and were classified as “scour critical” (Whitman and Howard, 1992). Additionally, predicted scour was below the elevation of the footings for floods at the 10-year recurrence interval for 35 of the 44 bridges. For New Hampshire bridges that have been in place for 50 years or more, scour-related problems were appreciably less frequent than results from these analyses indicate.
Use of a Ground-Penetrating Radar System to Detect Pre- and Post-Flood Scour at Selected Bridge Sites in New Hampshire, 1996-98By Joseph R. Olimpio
2 Use of a Ground-Penetrating Radar System to Detect Pre- and Post-Flood Scour at Selected Bridge Sites in New Hampshire, 1996-98
Bridges over waterways that are identified as scour critical require evaluation and monitoring to ensure public safety. However, such evaluation and monitoring measures are costly to apply to large numbers of bridges. Transportation agencies need better information and methods to accurately assess, predict, and remediate scour problems in a cost-effective manner. Detailed field observation of scour processes is needed to achieve these objectives in New Hampshire. Measurements of streambed scour and deposition at bridge sites are essential to studying the scour process; therefore, by understanding this process, better construction techniques and scour countermeasures can be developed to minimize scour effects. Maximum scour at a bridge usually occurs near the peak of a flood when measurements are difficult to collect. Scour holes are often infilled just after the peak flow and during the flow recession. If the scour hole has been infilled, data collected after the flood based on traditional methods (sounding weight) may not be able to detect the maximum scour depth. Pre- and post-flood ground-penetrating-radar (GPR) data collection may be able to detect existing or infilled scour holes that occurred during the flood. GPR techniques are suitable as an alternative to traditional methods of flood-data collection such as the installation of fixed instrumentation or the deploy-ment of mobile flood teams. GPR data collected at bridge sites contain a continuous profile of the streambed and, in some instances, the sub-bed bottom. These sub-bed-bottom reflectors can be correlated to erosional or depositional surfaces, pier footings, previous scour surfaces, or sediment layers (Placzek and others,1995).
A disadvantage of pre- and post-flood GPR data collection is that it is not a technique used to protect the motorist or the public during a flood and analyses of data may be limited if sufficient hydraulic data are not available to quantify flow velocities during a flood. GPR, however, does provide advantages over other methods in that it can be used to identify historical maximum scour depths, as well as existing or infilled scour holes that occurred during a flood.
In 1995, the U.S. Geological Survey (USGS), in cooperation with the NHDOT, began a study to provide data needed to improve the understanding of bridge-scour processes, scour prediction, and scour monitoring by collecting limited-detail scour data at selected bridges in New Hampshire. As part of this study, GPR was used to measure pre- and post-flood
scour cross-sectional profiles at upstream, downstream, and pier locations at bridge sites. Initially, 30 bridge sites were chosen for pre-flood GPR data collection. Site-selection criteria for GPR data collection were based on (1) physical characteris-tics of the river and bridge, (2) close proximity of USGS stream-gaging stations to bridge sites, and (3) the occurrence of a flood. The pre-flood GPR data served as a baseline cross-sectional survey for a site. Existing scour, infilling of scour holes, and historical maximum scour surfaces were identified on the records. River-characteristics criteria included the presence of permeable streambed materials that the radar signal was assumed to be able to penetrate. Sites with steep ravines; streambed materials predominantly consisting of large boulders; bedrock channels; large amounts of debris (such as trees, tree stumps, or concrete and granite abutment materials from old bridges); or in saltwater were not chosen for GPR data collection. Close proximity of the bridge to USGS stream-gaging stations also was a selection factor because streamflow could be associated with a recurrence interval. Recurrence interval for floods is defined as the average time interval between occurrences of a flood of a given or greater magnitude, usually expressed in years. When streamflow reached the level of a 2-year or greater recurrence interval based on USGS streamflow data at a nearby gaging station, the bridge was chosen for post-flood GPR data collection.
Purpose and Scope
The purpose of this report is to describe (1) the use of GPR to detect pre- and post-flood scour holes and previous scour surfaces at bridge sites, and (2) the interpretation of data collected from selected bridge sites. This report includes descriptions of the GPR methods and equipment used during this study. Each of the bridge sites are described with interpretations of the geophysical records. Of the original 30 evaluated bridges, 16 bridges with floods exceeding the 2-year recurrence interval were selected for post-flood GPR data collection. Of the 16 bridges surveyed, 11 bridge sites at 7 bridges (fig. 1) were evaluated for pre- to post-flood changes.
INTRODUCTION 3
Figure 1. Location of ground-penetrating-radar data-collection sites at seven bridge sites in New Hampshire.
4 Use of a Ground-Penetrating Radar System to Detect Pre- and Post-Flood Scour at Selected Bridge Sites in New Hampshire, 1996-98
Description of the Study Area
The study area includes bridges crossing the Connecticut, Cold, Pemigewasset, Warner, Soucook, Contoocook, and Souhegan Rivers in northwestern to southern New Hampshire. Selected descriptive characteristics of these bridge sites are shown in table 1.
Use of Terms
In this report, the following terminology is used to describe various bed-bottom-scour characteristics:
Existing scour hole: The bed-bottom scour observed during the 1996 pre-flood cross-sectional data collection. Depth is measured in feet below the streambed reference surface adjacent to the scour hole.
New scour hole: New or deepened scour observed during the 1998 post-flood cross-sectional data collection. Depth is measured in feet below the streambed reference surface adjacent to the scour hole.
Infilling: The partial or complete filling of an existing scour hole observed during the post-flood cross-sectional data collection. Extent of infilling is measured as the difference in hole depths between the pre- and post-flood data collection.
Previous scour surface: Buried scour holes or surfaces that are evident in the GPR record and existed prior to the pre-flood cross-sectional data collection.
Depth is measured in feet below the streambed reference surface at the time the cross section was surveyed.
Multiple: A secondary reflection of the streambed surface in a GPR record that appears below the streambed and is not indicative of sub-bed-bottom reflectors.
Acknowledgments
Information for this study was provided by the NHDOT. The author wishes to thank Dave Powellson, Chief of the Existing Bridge Section of the Bureau of Bridge Design, and his staff, for their cooperation and assistance during this study.
GROUND-PENETRATING RADAR
GPR was used to provide continuous profiles of the streambed surfaces at the seven bridges shown on figure 1. GPR surveys have been used for a variety of subsurface investigations (Beres and Haeni, 1991; Placzek and Haeni, 1995). This investigation used the GPR methods reported by Placzek and Haeni (1995) to obtain profiles of the shallow stratigraphy of subsur-face deposits. Depths to reflectors and types of lithol-ogies were verified by comparing depths to reflectors with depths to lithologic units and physical structures on bridge-construction plans.
Table 1. Selected descriptive characteristics of seven bridge sites in New Hampshire
[No., number; NHDOT, New Hampshire Department of Transportation; mi2, square mile; ft/ft, foot per foot; ft, foot; NH, New Hampshire; US, United States]
Bridge site No.
(fig. 1)
Town NHDOT No. Route River crossedDrain-
age area(mi2)
Slope(ft/ft)
Total width
(ft)
Waterdepth
(ft)Bed-bottom materials
1 Littleton 109/134 NH 18 Connecticut 1,604 0.0005 530 1-20 Silt, fine sand, some boulders2 Sandwich 238/092 NH 113 Cold 31 .04 146 1-5 Coarse sand, gravel, cobbles3 Ashland 076/080 US 3 & NH 25 Pemigewasset 634 .001 800 1-8 Medium sand, cobbles4 Warner 166/103 I-89 Warner 83 .001 191 1-4 Fine to medium sand, gravel,
cobbles5 Concord 160/188 NH 9 Soucook 77 .004 178 1-4 Fine to medium sand, boulders6 Hopkinton 049/096 NH 9 & US 202 Contoocook 400 .0006 312 1-12 Fine to medium sand, some
boulders7 Milford 123/133 NH 13 Souhegan 120 .001 112 1-8 Fine to medium sand, some
boulders
GROUND-PENETRATING RADAR 5
The GPR-survey system transmits radio-frequency electromagnetic pulses into the water and bed-bottom sediments and receives energy reflected back from surface and subsurface reflectors. Reflec-tors can be any subsurface contact between water and geologic materials or geologic materials with different physical and electrical properties, such as the interface between lithologic units or layers within a unit. Manmade materials such as concrete and steel also can be a subsurface reflector. The surveys were conducted with a 300-MHz-center-frequency monostatic transmitting and receiving antenna that was near the water surface. The profiles can be examined visually to locate below water and subsurface features. Interpretations of GPR profiles are improved by comparison with lithologic logs and bridge-construction plans.
Beres and Haeni (1991) provide an interpreta-tion guide for various types of reflector patterns for unconsolidated deposits. Sections of the GPR profiles with parallel reflectors can indicate the presence of laminated fine-grained sediments, such as pond-bottom sediments observed in this study. Complex, subparallel, and chaotic GPR-profile patterns generally indicate coarse-grained sediments. Inverted V-shaped patterns are indicative of point reflectors that could be from cobbles or boulders.
All reported depths to existing and new scour holes and bed-bottom and sub-bed-bottom reflectors are approximate. These depths are based upon estimated ground-penetrating radar two-way travel times for water, saturated sands, till, and bedrock (table 2).
Equipment
A Subsurface Interface Radar System-2 (SIR-2) manufactured by Geophysical Survey Systems, Inc. was used to investigate scour in this study. Data are displayed in real-time on a color display and stored on an internal hard drive. For this study, the GPR processor and 300-MHz antenna were placed in a small inflatable boat (fig. 2). The inflatable boat
Table 2. Approximate ground-penetrating radar two-way travel times for selected materials
6 Use of a Ground-Penetrating Radar System to Detect Pre- and Post-Flood Scour at Selected Bridge Sites in New Hampshire, 1996-98
provides a stable platform that has minimal effect on radar-signal transmission and reception. In deep water (depth is greater than or equal to 4 ft), the operator sat in the boat, which was propelled across the water surface by an electric trolling motor. In shallow water (depth is less than 4 ft), the equipment operator waded alongside the boat and pushed the boat by hand in water or dragged it across sand, gravel, and cobble bars. These methods of equipment deployment were fast, safe, and easily transportable from the vehicle to the river’s edge by one person. A geophysical record was collected at one bridge per day.
Data-collection Methods
Cross-sectional GPR profiles were collected at upstream and downstream bridge faces, from the left bank to the right bank of the river, directly beneath the leading and trailing edges of the bridge, and within 1 ft of each pier nose. (Left bank and right bank terminology used here is from a facing downstream perspective). Profiles also were collected 1 ft from and alongside the piers parallel with the axis of the river, from downstream to upstream within about 20 to 40 ft downstream of the nose of the pier, alongside the length of the pier, and within about 20 to 40 ft upstream of the nose of the pier.
Depths of scour holes, exposed pier footings, channels, boulders, and streambeds were measured with a surveying rod during data collection. Attempts to probe into the streambed with a steel rod to verify depths of infilled holes were met with limited success, as the presence of cobbles and boulders or deep water usually prevented verification. The water-surface elevation was measured from a known reference point on the bridge before and after data were collected.
Transmission velocities of the radar signal were used to interpret depth to a reflector. Approximate GPR two-way travel times for selected materials (Geophysical Survey Systems, Inc., 1994) used for interpretation are summarized in table 2.
GPR data were processed to enhance reflector patterns in the data. Distance normalization, migration, and signal amplification were used selectively to process the data. These processes, as performed using commercial computer software, are described by Geophysical Survey Systems, Inc. (1995). Processing was kept to a minimum to preserve as much of the original record as possible.
SCOUR ESTIMATES AT BRIDGE SITES
The results of the geophysical surveys presented in this section include selected GPR cross sections, showing pre- and post-flood-scour data at seven bridges. Baseline GPR data were collected at 30 bridge sites as part of the pre-flood data-collection effort. The criteria for post-flood data collection at bridge sites were the occurrence of a 2-year or greater recurrence interval flood at any of the 30 bridge sites during the study. The flood-recurrence interval was determined from USGS streamflow data at gaging stations located either on each river near the bridge, or compared to USGS streamflow data at gaging stations that were about 2 to 10 mi away on an adjacent river with similar basin characteristics. Flood-flow data at stream-gaging stations near bridges in New Hampshire are presented in table 3. Bridges that had uninterpret-able GPR data from the pre-flood survey also were eliminated as potential post-flood GPR data-collection sites. Thus, 22 pre- and post-flood GPR cross sections (11 pre-flood sections and 11 post-flood sections) at 7 bridge sites were used for this study. Water-surface elevations were determined by using a steel tape and known reference mark on the bridge deck. The vertical distance from the reference point to the water surface was measured twice during each site visit. This measured distance from the reference point to the water surface was used to obtain a water-surface elevation for each day GPR data were collected (elevation data for the reference point were obtained from NHDOT bridge plans). The water-surface elevation was used as a point of reference on the GPR cross sections. Estimated two-way travel times (in nanoseconds per foot, table 2) in water, saturated sand, till, and bedrock were used to determine depths to the surface of the streambed, existing and new scour holes, infilled streambed sections, and subsurface reflectors such as previous scour surfaces, pier footings, and riprap materials. Depths to reflectors were calculated based on the known water-surface elevation and travel time through the water or subsur-face materials. These calculated depths were compared to cross-sectional data on NHDOT bridge plans to verify depths to features such as streambed and top-of-footing and(or) bottom-of-footing.
The footing outline is superimposed on the GPR records. Footing placement on the record is based on known dimensions of the footing, the top and bottom elevations of the footing, and the two-way travel time of the radar signal in the bed-bottom materials (footing data are from NHDOT bridge plans).
SCOUR ESTIMATES AT BRIDGE SITES 7
Scour holes and depths to exposed bridge features (top-of-footing, top-of-steel pile) were manually measured during GPR data collection using a surveying rod. These measurements also were used to verify depths to these features, when identified, in the GPR cross sections. A summary of scour estimates at each of the 7 bridges and 22 cross sections is provided in table 4. A detailed description for each bridge site follows this summary.
Route 9 Bridge
A bridge is located on Route 9 and crosses the Soucook River (about 100 ft wide). The bridge is 178 ft long by 44 ft wide, and is supported by two 6-column-bridge pile bents. Each of the columns are 3 ft wide and 5 ft long. Each 6-column-bridge pile bent is 40 ft long.
Pre- and post-flood GPR data were collected at the upstream and downstream bridge faces and along
Table 3. Flood-flow data at stream-gaging stations near seven bridges in New Hampshire
[Bridge site distance is distance in miles from bridge to gaging station. NHDOT reference no., New Hampshire Department of Transportation bridge reference number; GPR, Ground-penetrating Radar; ft3/s, cubic feet per second; >, greater than]
Stream-gaging station information:
river, location, station identifier
Bridge site, river,
distance, NHDOT
reference no.
1996 Pre-flood GPR data collection:
Date and flow (ft3/s)
1998 Post-flood GPR data collection:
Date and flow (ft3/s)
Highest flow during study: Date and flow
(ft3/s)
Approximate recurrence
interval (years)
Soucook RiverConcord01089100
Route 9Soucook1.9160/188
5/20/96311
11/05/9817
3/10/981,890 5-10
Connecticut RiverDalton01131500
Route 18Connecticut11.2109/134
8/08/961,123
11/10/981,500
4/01/9842,000 25-50
Bearcamp RiverTamworth01064801
Route 13Cold10238/092
8/12/9715
11/13/98129
6/14/986,150 >50
Contoocook RiverHenniker01085000
Route 9/202Contoocook4.2049/096
12/04/963,430
11/06/98179
6/18/985,740 2-5
PemigewassetPlymouth01076500
Route 3/25Pemigewasset5.9076/080
10/03/96237
11/16/981,640
6/14/9822,200 2-5
Souhegan RiverMerrimack:01094000
Route 13Souhegan3.8123/133
8/11/9654
11/20/9876
10/22/966,260 5-10
Contoocook RiverHenniker01085000
I-89Warner8.5166/103-4
12/04/963,430
11/06/98179
6/18/985,740 2-5
8U
se of a G
rou
nd
-Pen
etrating
Rad
ar System
to D
etect Pre- an
d P
ost-F
loo
d S
cou
r at Selected
Brid
ge S
ites in N
ew H
amp
shire,
1996-98
Table 4. Ground-penetrating-radar scour data for seven bridges in New Hampshire
[No., number]
SiteSection of river and
figure No.
Ground-penetrating
radar survey dates
Existing scour hole depth observed
during study period, in feet, and location
New scour hole depth observed
during study period, in feet, and location
Maximum discharge
observed during study period, in cubic feet per
second, and date
Infilling observed during period, in feet, and location
Previous streambed surface depth below bed bottom, in feet,
and location
Route 9 over Soucook River in Concord
Concord, Route 9 over Soucook River
Downstream cross-section (fig. 3)
8/13/9611/5/98
1.3Right bank pier
1.7Right bank pier
1,8903/10/98
0.5Left bank pier
1-4Left and right sides of
section
Concord, Route 9 over Soucook River
Pier-set cross-section (fig. 4)
8/13/9611/5/98
2.8Column 5
2.0Column 2
1,8903/10/98
None 1-5Between columns
Route 18 over Connecticut River in Littleton
Littleton, Route 18 over Connecticut River
Upstream cross-section (fig. 5)
8/26/9611/10/98
2.5Pier 2
None 42,0004/1/98
2.0Pier 2
None
Route 13 over Cold River in Sandwich
Sandwich, Route 13 over Cold River
Upstream cross-section (fig. 6)
8/12/9711/13/98
None 3.0Pier
6,150 16/14/98
None 6-13Middle of river channel
Sandwich, Route 13 over the Cold River
Downstream cross-section (fig. 7)
8/12/9711/13/98
None 1.2Pier
6,15016/14/98
None 6-9Middle of river channel
Routes 202 and 9 over Contoocook River in Hopkinton
Hopkinton, Routes 202 and 9 over Contoocook River
Upstream cross-section (fig. 8)
12/4/9611/6/98
2.0Right bank pier
None 5,740 26/18/98
2.0Right bank pier
None
Interstate I-89 southbound over Warner River in Warner
Warner, I-89 southbound over Warner River
Upstream cross-section (fig. 9)
12/3/9611/6/98
1.2Middle of river channel
None 5,74026/18/98
0.7Middle of river
channel
1-8Middle of river channel
Interstate I-89 northbound over Warner River in Warner
Warner, I-89 northbound over Warner River
Downstream cross-section (fig. 10)
12/3/9611/6/98
1.0Right bank pier
None 5,7406/18/98
1.0Right bank pier
4Middle of river channel
SC
OU
R E
ST
IMA
TE
S A
T B
RID
GE
SIT
ES
9
Routes 3 and 25 over Pemigewasset River in Ashland
Ashland, Routes 3 and 25 over Pemigewasset River
Upstream cross-section (fig. 11)
10/3/9611/16/98
3.0/1.0Left channel/pier
3.5/2.0Left channel/pier
22,2006/14/98
2.0Middle of river
channel
6-8Middle of river channel
Route 13 over Souhegan River in Milford
Milford, Route 13 over Souhegan River
Downstream cross-section (fig. 12)
8/11/9611/20/98
2.0Right bank pier
3.0Right bank pier
6,26010/22/96
None 2-3Left bank pier
Milford, Route 13 over Souhegan River
Right bank pier cross-section (fig. 13)
8/11/9611/20/98
3.0/2.0us pier/ds pier
4.0/4.0us pier/ds pier
6,26010/22/96
4.0ds pier
None
1Maximum discharge for the Bearcamp River, Tamworth, 4.2 miles east of this site was 6,150 cubic feet per second on June 14, 1998.2Maximum discharge for the Contoocook River, Henniker, 9.6 miles south of this site was 5,740 cubic feet per second on June 18, 1998.
Table 4. Ground-penetrating-radar scour data for seven bridges in New Hampshire—Continued
[No., number]
SiteSection of river and
figure No.
Ground-penetrating
radar survey dates
Existing scour hole depth observed
during study period, in feet, and location
New scour hole depth observed
during study period, in feet, and location
Maximum discharge
observed during study period, in cubic feet per
second, and date
Infilling observed during period, in feet, and location
Previous streambed surface depth below bed bottom, in feet,
and location
10 Use of a Ground-Penetrating Radar System to Detect Pre- and Post-Flood Scour at Selected Bridge Sites in New Hampshire, 1996-98
the right and left bank sides of the pile bents. The downstream bridge face and the right-bank pier cross sections were interpretable with GPR and were used for comparison of pre- and post-flood conditions. Water depths range from 1 to 5 ft during the study. The streambed materials at this site consist of fine-to-coarse sand with cobbles. Radar-signal-penetration depths ranged from 5 ft in water to 13.5 ft in streambed sediments.
A stream-gaging station (01089100, table 3) is on the Soucook River 1.9 mi south of the bridge. Pre-flood GPR data were collected on May 20, 1996, (streamflow of 311 ft3/s, table 3) and post-flood GPR data were collected on November 5, 1998, (streamflow of 17 ft3/s, table 3). The highest flood flow during this time interval was 1,890 ft3/s and was recorded on March 10, 1998. This flow corresponds to a 5- to 10-year flood.
Downstream Bridge-face Cross Section
The 1996 (pre-flood) cross section (fig. 3A) shows an undulating streambed of strong sand reflec-tors. Near the left-bank column a small existing scour hole measures about 1 ft deep. An existing scour hole (1.3 ft deep) is adjacent to the right-bank column. Previous scour surfaces (thin faint reflectors in the middle left and middle right of the section) are 1 to 2.5 ft below the streambed. Depth to the top of the column footing in this cross section is 7 ft below the streambed.
The 1998 (post-flood) cross section (fig. 3B) shows a gradual smoothing of the streambed and infilling of the small existing scour hole near the left-bank column. This infilling measures 0.5 ft deep. The existing scour hole identified in the pre-flood section adjacent to the right-bank column now measures 1.7 ft deep. The previous scour surface near the right-bank column is easily identified in this section as a discon-tinuous thin subparallel reflector on the left and right sides of the record, and is 1.8 to 3.7 ft below the present streambed. The scour surface near the left-bank column may represent the potential maximum extent of scour that occurred during the intervening period (between pre- and post-flood measurements). The inverted triangular reflectors near the right-bank column are interference patterns from the concrete column. Depth to the top of the column footing in this cross section remains unchanged at about 7 ft.
Column-set Cross Section, Upstream to Downstream
The 1996 (pre-flood) cross section (fig. 4A) shows a strong sand reflector representing the streambed, across the entire record, in shallow water. This shallow reflector dips downward, from left to right, toward the downstream end of the record, ending at an existing scour hole at column 5. The hole depth is 2.4 ft. The inverted triangular reflectors just to the left of column 2, and to the right of the scour hole at column 5, represent reflections off of exposed steel-pile sections. Previous scour surfaces (thin faint reflectors beneath the hole in the middle right of the record) range from 1.6 to 4.8 ft beneath the streambed. Riprap protection of the pier footing is represented by a strong, thick, parallel-wavy reflector on the right side of the record above the footing. The position of this reflector on the record agrees with measured elevation data from the bridge plans. Average depth to the top of the pier footing is about 10 ft.
The 1998 (post-flood) cross section (fig. 4B) shows the same strong sand reflector representing the streambed, from left to right across the entire record, but there is a new scour hole 1.2 ft deep and 4 ft wide located around column 2. The inverted triangular reflectors are still present near columns 2 and 5. The shallow streambed reflector follows the same downward trend toward the pre-existing scour hole at column 5. The hole at column 5 (2.4 ft deep) appears to have remained relatively stable. There is no evidence of infilling in the record (fig. 4B). The riprap protection above the pier footing is still represented in the record, but the thick parallel-wavy reflector pattern is more obscured in this record by thick wavy reflec-tors just above it. Average depth to the top of the footing remains the same at 10 ft.
Route 18 Bridge
The Route 18 bridge in Littleton crosses the 450-ft-wide Connecticut River and is supported by four piers. Each pier is 6.5 ft wide and 31 ft long. Pre- and post-flood GPR data were collected at the upstream and downstream bridge faces and along both the right and left bank sides of each pier (fig. 5). The upstream bridge face cross section was used for comparison of pre- and post-flood conditions. Water depths ranged from 2 to 32 ft during the study. The streambed materials at this site consist of silt,
SCOUR ESTIMATES AT BRIDGE SITES 11
Figure 3. Ground-penetrating-radar profiles of the downstream bridge-face cross sections for (A) 1996 pre-flood and (B) 1998 post-flood data collection, from left to right bank, Route 9 over the Soucook River, Concord, N.H.
12 Use of a Ground-Penetrating Radar System to Detect Pre- and Post-Flood Scour at Selected Bridge Sites in New Hampshire, 1996-98
Figure 4. Ground-penetrating-radar profiles of the pier-set cross sections for (A) 1996 pre-flood and (B) 1998 post-flood data collection, from upstream to downstream, Route 9 over the Soucook River, Concord, N.H.
SCOUR ESTIMATES AT BRIDGE SITES 13
Figure 5. Ground-penetrating-radar profiles of the upstream bridge-face cross sections for (A) 1996 pre-flood and (B) 1998 post-flood data collection, from left to right bank, Route 18 over the Connecticut River, Littleton, N.H.
14 Use of a Ground-Penetrating Radar System to Detect Pre- and Post-Flood Scour at Selected Bridge Sites in New Hampshire, 1996-98
fine-to-medium sand, and some boulders (New Hampshire Department of Transportation, 1992). Radar-signal-penetration depths were about 32 ft in water and 8.2 ft in streambed materials.
A stream-gaging station (01131500, table 3) is on the Connecticut River 10 mi north of the bridge. Pre-flood GPR data were collected on August 8, 1996, and the flow at the gaging station was 1,123 ft3/s. Post-flood GPR data were collected on November 10, 1998, and the flow at the gaging station was 1,500 ft3/s. The highest flood flow during this time interval was 42,000 ft3/s recorded on April 1, 1998. This flow corresponds to a 25- to 50-year flood.
The 1996 (pre-flood) cross-section (fig. 5A) data were collected in water up to 32 ft deep. The GPR signal is attenuated by the water and only able to penetrate about 8.2 ft of the streambed sediments. At each pier, as seen on the record, a mound of streambed material represents the granite riprap protection that was installed to prevent streambed scour. At pier 2, 2.5-ft-deep scour holes exist on both sides of the pier (fig. 5A). A small hole (2.3 ft deep) developed to the right of pier 3.
The 1998 (post-flood) cross section (fig. 5B) was collected in water somewhat shallower than in 1996 (23 ft deep). The GPR signal is still attenuated (but to a lesser degree because the water is shallower) and is able to penetrate further into the streambed sediments. At pier 2, the hole configuration has changed; the scour holes have filled in (about 2 ft deep), but the overall depth of streambed material over the top of the footing is less (this result may represent the settlement of riprap as streambed material is scoured away from the toe of the riprap slope). At pier 3, the mound of riprap is still identifiable on the record, and the hole to the right of the pier appears to have filled in with 1.2 ft of material. Previous scour surfaces were not identified because the radar signal was attenuated by the depth of the water and the fine-grained streambed materials.
Route 13 Bridge
The Route 13 bridge in Sandwich crosses the Cold River and is 146 ft long by 32 ft wide, and has 2 bridge spans. The river width is about 40 ft. The single pier is 3.5 ft wide and 40 ft long.
Pre- and post-flood GPR data were collected at the upstream and downstream bridge faces and along
the right and left bank sides of the pier. The upstream and downstream cross sections were used for compar-ison of pre- and post-flood conditions. Observed water depths ranged from 1 to 4.2 ft during the study. The streambed materials at this site consist of coarse sand, gravel, cobbles, and boulders. Radar-signal-penetration depths were about 4.2 ft in water and 11 ft in streambed materials.
A stream-gaging station (01064801, table 3) is on the Bearcamp River 4.2 mi east of the bridge. Pre-flood GPR data were collected on August 12, 1997, and the flow at the gaging station was 15 ft3/s. Post-flood GPR data were collected on November 13, 1998, and the flow at the gaging station was 129 ft3/s. The highest flood flow for this time period was 6,150 ft3/s and was recorded on June 14, 1998. This corresponds to a greater than 50- to 100-year flood.
Upstream Bridge-face Cross Section
The 1997 (pre-flood) cross-section data (fig. 6A) were collected in shallow water from 0 to 2.5 ft deep. The section represents the right half of the bridge opening from the pier to the right bank. The radar signal did not penetrate the dry sand and cobble streambed materials in the left bridge-face opening. The streambed appears as a thick continuous reflector (in the top middle of the record) that trends downward to the deepest part of the streambed at an existing depression 2.2 ft deep. This bridge site restricts the flow of water during flood flows. This restriction causes contraction scour to occur (the 2.2-ft-deep depression in the center of the channel). No scour holes were observed during this survey. However, thin wavy reflectors represent previous scour surfaces of unknown age about 8 ft below the streambed (fig. 6A). The entire right half of the record shows chaotic wavy thin reflectors. This is a cobble-boulder section of the streambed.
The 1998 (post-flood) cross-section data (fig. 6B) were collected in deeper water (up to 4.4 ft deep) than in 1997. Similar to the upstream record in figure 6A, data for the entire bridge opening were collected but only the data for the right bridge face opening are shown for comparison to the 1997 data. A scour hole about 2 ft deep exists in front of the pier. The depth to the top of the pier footing is about 2 ft below the streambed. Beneath this hole, parallel strong reflectors represent the top of the pier footing. Large boulders (riprap) to the right of the pier are
SCOUR ESTIMATES AT BRIDGE SITES 15
Figure 6. Ground-penetrating-radar profiles of the upstream bridge-face cross sections for (A) 1997 pre-flood and (B) 1998 post-flood data collection, from pier to right bank, Route 13 over the Cold River, Sandwich, N.H.
16 Use of a Ground-Penetrating Radar System to Detect Pre- and Post-Flood Scour at Selected Bridge Sites in New Hampshire, 1996-98
represented by a mound of faint chaotic reflectors. The depression in the middle of the channel is 0.6 ft deeper than the depression in the 1997 record. This depression could be the result of continued contraction scour processes occurring during flood flows. Previous scour surfaces apparent in the 1997 data (fig. 6) are less readily identifiable; they are obscured by the interfering inverted triangular reflection signature of boulders on the streambed. The right half of the record is similar to the 1997 record; chaotic wavy reflectors are the dominant signature. Streambed-bottom materials on this side of the bridge opening appear to be protected from scour processes by large boulders.
Downstream Bridge-face Cross Section
The 1997 (pre-flood) cross-section data (fig. 7A) were collected in water from 0 to 2 ft deep. The section represents the right half of the bridge opening from the pier to the right bank. The radar signal did not penetrate the dry sand and cobble streambed materials in the left bridge-face opening. The streambed appears as a thick continuous reflector on the left side of the record trending downward to the right. No scour holes were observed in this survey, however, thin wavy reflectors represent previous scour surfaces that are about 6 to 9 ft below the streambed and up to 2 ft below the bottom of the footing. On the right side, cobbles, boulders, and a coarse sand streambed produce chaotic and thin wavy reflection patterns. There is approximately 7 ft of streambed material above the footing.
The 1998 (post-flood) cross-section data (fig. 7B) were collected in water up to about 3 ft deep. Similar to the upstream record (fig. 6), data for the entire bridge opening were collected but only the data for the right bridge-face opening are shown for comparison to the 1997 data. The thick, continuous reflector sloping toward the right (shown in the 1997 data), is replaced in 1998 by a discontinuous flat-lying reflector (streambed materials have been removed and boulders have moved into the section). A new scour hole has formed (1.2 ft deep) to the right of the pier. Interference patterns from cobbles and boulders (inverted triangles) fill much of the record; field observations confirm the movement of sand out of the section and movement of riprap protection material from the upstream bridge-face area to the downstream bridge-face area during a recent flood. Thin wavy
reflectors representing previous scour surfaces are still present at about 6 to 9 ft below the streambed. There is 6 ft of streambed material above the footing; this result indicates that 1 ft of material has been removed from the downstream nose of the pier.
Routes 202 and 9 Bridge
The Routes 202 and 9 bridge in Hopkinton that crosses the Contoocook River is 312 ft long by 60 ft wide, and has 2 piers. The river is approximately 180 ft wide, and each pier is 5 ft wide and 70 ft long.
Pre- and post-flood GPR data were collected at the upstream and downstream bridge faces and along the right and left bank sides of both piers. The upstream bridge-face cross section was used for comparison of pre- and post-flood conditions. Observed water depths ranged from 4 to 13 ft during the study. The streambed materials at this site consist of medium-grained sand (New Hampshire Department of Transportation, 1992). Radar-signal-penetration depths were 13 ft in water and 4 ft in streambed materials.
A stream-gaging station (01085000, table 3) is on the Contoocook River 5.9 mi west of the bridge. Pre-flood GPR data were collected on December 4, 1996, and the flow at the gaging station was 3,430 ft3/s. Post-flood GPR data were collected on November 6, 1998, and the flow at the gaging station was 179 ft3/s. The highest flood flow for this time period was 5,740 ft3/s and was recorded on June 18, 1998. This flood flow corresponds to a 2 to 5-year flood.
The 1996 (pre-flood) cross-section data (fig. 8A) were collected in 2 to 13 ft of water. The streambed is represented by a continuous thick wavy reflector. Below the streambed, thin subparallel discontinuous reflectors represent layering of fine-grained sediments (silt or sand) and inverted triangular interference patterns represent coarse-grained materials (cobbles or boulders). At the left bank pier, there is 2.5 ft of streambed material above the top of the pier footing. An existing 2-ft-deep scour hole is at the front-left side of the right bank pier.
The 1998 (post-flood) cross section (fig. 8B) shows a bed-bottom geometry similar to the 1996 data. However, 0.75 ft of infilling has occurred at the left-bank pier and there is now 2 ft of infilled material above the right-bank pier footing. The thin subparallel
SCOUR ESTIMATES AT BRIDGE SITES 17
Figure 7. Ground-penetrating-radar profiles of the downstream bridge-face cross sections for (A) 1997 pre-flood and (B) 1998 post-flood data collection, from pier to right bank, Route 13 over the Cold River, Sandwich, N.H.
18 Use of a Ground-Penetrating Radar System to Detect Pre- and Post-Flood Scour at Selected Bridge Sites in New Hampshire, 1996-98
Figure 8. Ground-penetrating-radar profiles of the upstream bridge-face cross sections for (A) 1996 pre-flood and (B) 1998 post-flood data collection, from left to right bank, Routes 202 and 9 over the Contoocook River, Hopkinton, N.H.
SCOUR ESTIMATES AT BRIDGE SITES 19
reflectors beneath the streambed in the center of the record are not as distinct as the 1996 data; they are obscured somewhat by the inverted triangular signature of the cobble-boulder sublayer. No previous scour surfaces were observed in either the pre- or post-flood surveys at this bridge.
Interstate 89 Southbound Bridge
The Interstate 89 Southbound bridge in Warner crosses the 90-ft-wide Warner River, is 190 ft long by 52 ft wide, and has 2 piers. Each pier is 3 ft wide and 68 ft long.
Pre- and post-flood GPR data were collected at the upstream and downstream bridge faces and along both the right and left bank sides of the two piers. The upstream bridge-face cross section was used for comparison of pre- and post-flood conditions. Observed water depths ranged from 2 to 10 ft during the study. The streambed materials at this site consist of sand and gravel. Radar-signal-penetration depths ranged from 6 ft in water and 20 ft in substreambed materials.
A stream-gaging station (01085000, table 3) is on the Contoocook River 9.6 mi south of the bridge. This gaging station was used as an indicator for potential flood-flows on the Warner River (fig. 1). Even though the gage is not on the Warner River, the flows are similar. Pre-flood GPR data were collected on December 4, 1996, and the flow at the Contoocook River gaging station was 3,430 ft3/s. A comparison of drainage areas (Davidian, 1984) provided an estimate of 1,268 ft3/s at the Warner River site. Post-flood GPR data were collected on November 6, 1998, and the flow at the Contoocook River gaging station was 179 ft3/s. The estimated discharge at the Warner River site was 66 ft3/s. The highest flood flow for the Contoocook River in Henniker during this time interval was 5,740 ft3/s and was recorded on June 18, 1998. This result corresponds to a 2- to 5-year flood.
The 1996 (pre-flood) cross section (fig. 9A) shows a thin wavy streambed reflector extending across the entire record. An existing 1.2 ft scour hole is in the middle of the river channel. A thin wavy subparallel reflector extends across the middle center of the record and represents a multiple reflection of the streambed. Previous scour surfaces of sand or sand and gravel appear as thin subparallel sloping reflectors
in the center of the record at 1 to 3 ft below the streambed. Thin dense wavy reflectors 9 ft below the streambed at the left bank pier represent the top of the riprap protection for the left-bank pier footing.
The 1998 (post-flood) cross section (fig. 9B) shows a similar thin parallel streambed reflector across the entire record but the streambed is now a smooth surface. Approximately 0.7 ft of material infilled the middle of the river channel. A thin subparallel reflector extends across the top-middle of the record and represents a similar multiple to that shown in the 1996 record. Previous scour surfaces of sand or sand and gravel appear as discontinuous thin wavy reflec-tors (obscured somewhat by multiple reflectors of the streambed) 7.5 ft below the streambed. These scour surfaces may represent the potential maximum extent of scour that occurred during the 23 months between measurements.
Interstate 89 Northbound Bridge
The Interstate 89 Northbound bridge in Warner crosses the 90-ft-wide Warner River, is 190 ft long by 52 ft wide, and has 2 piers. Each pier is 3 ft wide and 68 ft long.
Pre- and post-flood GPR data were collected at the upstream and downstream bridge faces and along the right and left bank sides of the two piers. The downstream bridge-face cross section was used for comparison of pre- and post-flood conditions. Observed water depths ranged from 2 to 10 ft during the study. The streambed materials at this site consist of sand and gravel. Radar-signal-penetration depths were as great as 10 ft in water and 20 ft in streambed materials.
A stream-gaging station (01085000, table 3) is on the Contoocook River 9.6 mi south of the bridge. This gaging station was used as an indicator for potential flood-flow events on the Warner River even though the gage is not on the Warner River. Pre-flood GPR data were collected on December 4, 1996, with a flow rate of 3.430 ft3/s. The highest flow of 5,740 ft3/s was recorded on June 18, 1998. This flow corresponds to a 2- to 5-year flood.
The 1996 (pre-flood) cross section (fig. 10A) shows a thin wavy streambed reflector extending across the entire record. A small existing scour hole (1 ft deep) is on the left side of the right pier. A thin wavy parallel reflector extends across the middle
20 Use of a Ground-Penetrating Radar System to Detect Pre- and Post-Flood Scour at Selected Bridge Sites in New Hampshire, 1996-98
Figure 9. Ground-penetrating-radar profiles of the upstream bridge-face cross sections for (A) 1996 pre-flood and (B) 1998 post-flood data collection, from left to right bank, Interstate 89 southbound over the Warner River, Warner, N.H.
SCOUR ESTIMATES AT BRIDGE SITES 21
Figure 10. Ground-penetrating-radar profiles of the downstream bridge-face cross sections for (A) 1996 pre-flood and (B) 1998 post-flood data collection, from left to right bank, Interstate 89 northbound over the Warner River, Warner, N.H.
22 Use of a Ground-Penetrating Radar System to Detect Pre- and Post-Flood Scour at Selected Bridge Sites in New Hampshire, 1996-98
center of the record 11.3 ft below the streambed and represents a multiple reflection of the streambed. Previous scour surfaces of sand or sand and gravel appear as multiple thin wavy reflectors at 3.8 ft below the streambed across the entire record. Boulder protection of the pier footing is identified on the record as chaotic wavy reflectors at both piers 11 ft below the streambed.
The 1998 (post-flood) cross section (fig. 10B) shows the same thin wavy streambed reflector present in the 1996 record extending across the entire record. The thin wavy parallel reflector extending across the middle center of the record represents the same multiple reflection of the streambed. Previous scour surfaces of sand or sand and gravel appear as similar multiple thin wavy reflectors at between 2 and 10 ft below the streambed. The deepest scour surfaces could potentially represent the potential maximum extent of scour that occurred during the intervening period between measurements. There are only subtle changes in the streambed; a flat streambed at left-center changes to a cobble-boulder streambed on the right side of the record, and the small existing scour hole identified in the pre-flood section has been infilled with 1 ft of streambed material.
Routes 3 and 25 Bridge
The Routes 3 and 25 bridge in Ashland crosses the Pemigewasset River and is 800 ft long, 24 ft wide, and has 6 piers. The flood plain is 500 ft wide. Only one of the 6 piers is in the 300-ft-wide river. This 1 pier is 8 ft wide and 32 ft long.
Pre- and post-flood GPR data were collected at the upstream and downstream bridge faces and along the right and left bank sides of the pier. The upstream bridge-face cross section was used for comparison of pre- and post-flood conditions. Observed water depths during the study ranged from less than 1 to 6 ft. The streambed materials at this site consist of fine-to-medium sand and cobbles. Radar-signal-penetration depths were as great as 6 ft in water and 7 ft in streambed materials.
A stream-gaging station (01076500, table 3) is 3.8 mi north of the bridge. Pre-flood GPR data were collected on October 3, 1996, and the flow at the gaging station was 237 ft3/s. Post-flood GPR data were collected on November 16, 1998, and the flow at the gaging station was 1,640 ft3/s. The highest flood
flow for this time period was 22,200 ft3/s and was recorded on June 14, 1998. This flow corresponds to a 2- to 5-year flood.
The 1996 (pre-flood) cross-section (fig. 11A) data were collected in water 0 to 3 ft deep. An 18 ft-wide area around the center pier consisted of a sand and gravel bar (less than 0.5 ft water depth) and is represented by the flat dark low-frequency band at the top-center of the record. Field observations of streambed features (ripples, elongated scour channels, sand bars) indicate that the streambed consisting of sands and gravels is mobile at this bridge site. The streambed is represented by the thick subparallel reflector that forms a 3-ft-deep hole in the middle of the channel on the left side of the pier and a 2-ft-deep hole in the middle of the channel on the right side of the pier. A 1-ft-deep scour hole exposes a steel pile on the left side of the pier. Infilling of sands and gravels (2 ft thick) is represented by the highly reflective wavy bands in both river bed channels.
The 1998 (post-flood) cross-section (fig. 11B) data were collected in water 1-5 ft deep. (The sand and gravel bar around the center pier is now submerged under 1 ft of water). The streambed is represented by the same subparallel reflector identified in the 1996 record (fig. 11A). A 6-ft-deep depression exists in the river channel left of center in the record. Contraction scour may be occurring between the pier and the left bank and the scour depression may be the result of this contraction. A new 3-ft-deep scour hole exposes the steel pile on the left side of the pier. This scour hole is 2 ft deeper than the hole identified in the 1996 data. The wavy chaotic streambed reflectors to the right of the pier represent an infilling of sand and gravel about 2 ft thick. Previous scour surfaces exist below the infilled material on the right side of the record and may represent the potential maximum extent of scour that occurred during the intervening period between measurements.
Route 13 Bridge
The Route 13 bridge in Milford crosses the Souhegan River and is 112 ft long and 50 ft wide. This bridge has one concrete and stone pier that is 10 ft wide and 60 ft long. The river width is about 100 ft.
Pre- and post-flood GPR data were collected at the upstream and downstream bridge faces and along the right and left bank sides of the pier. The
SCOUR ESTIMATES AT BRIDGE SITES 23
Figure 11. Ground-penetrating-radar profiles of the upstream bridge-face cross sections for (A) 1996 pre-flood and (B) 1998 post-flood data collection, from left to right bank, Routes 3 and 25 over the Pemigewassett River, Ashland, N.H.
24 Use of a Ground-Penetrating Radar System to Detect Pre- and Post-Flood Scour at Selected Bridge Sites in New Hampshire, 1996-98
downstream bridge-face cross section and the right bank side-pier cross section were used for comparison of pre- and post-flood conditions. Observed water depths ranged from 1 to 8 ft during the study. The streambed materials at this site consist of silt, fine-to-medium sand, and some boulders. Radar-signal-penetration depths were about 8 ft in water and about 6 ft in streambed materials.
A stream-gaging station (01094000, table 3) is 8.5 mi east of the bridge. Pre-flood GPR data were collected on August 11, 1996, and the flow at the gaging station was 54 ft3/s. Post-flood GPR data were collected on November 20, 1998, and the flow at the gaging station was 76 ft3/s. The highest flood flow for this time period was 6,260 ft3/s and was recorded on October 22, 1996. This flow corresponds to a 5- to 10-year flood.
Downstream Bridge-face Cross Section
The 1996 (pre-flood) cross section (fig. 12A) shows an irregular streambed represented by a thin parallel reflector. A 5-ft-deep channel exists on the left side of the record. Chaotic inverted triangular reflectors dominate the right side of the record and are evidence of boulders in the streambed. A previous scour surface on the left side of the pier is represented by a thin diagonal reflector 0 to 4 ft below the streambed and is overlain by more recent infilled sand of the current streambed. A small existing 2-ft-deep scour hole is to the right of the pier.
The 1998 (post-flood) cross section (fig. 12B) is similar to the 1996 record with some differences. On the left side of the record, the scour channel is 1.5 ft below the bottom of the footing and almost 1 ft deeper than the 1996 scour channel, indicating that sand was scoured out of the section. The previous scour surface in the top center of the record is still identifiable and
the sand-bed material above this surface to the left of the pier has shifted slightly to the right accumulating over the pier footing. This scour surface may represent the potential maximum extent of scour that occurred during the intervening period between measurements. The small existing scour hole to the right of the pier and the chaotic reflector signature of the streambed boulders on the right side of the record remain unchanged.
Right-bank-pier Cross Section
The 1996 (pre-flood) cross section (fig. 13A) shows an irregular streambed represented by thin wavy parallel reflectors. An existing 3-ft-deep scour hole (hole 1) is at the upstream center section of the footing. Inverted triangular reflectors dominate the center of the record and represent interference patterns from boulders present in the streambed. Two existing scour holes in the streambed (holes 2 and 3) are 1 and 2 ft deep, respectively, and are at the downstream center section of the footing. A strong subparallel reflector is across the bottom third of the record and represents a multiple reflection of the streambed. Radar-signal penetration in streambed sediments is blocked by the presence of boulders in the streambed.
The 1998 (post-flood) cross section (fig. 13B) shows a similar irregular streambed represented by thin wavy parallel reflectors. An additional 1 ft of scour has occurred at hole 1 identified in the 1996 section (left-center at the footing upstream end) and extends downward slightly past the top of the pier footing. The extent of the two existing scour holes at the downstream center section of the footing also have changed. Existing scour hole 2 is now 4 ft deep (2 ft deeper than in 1996) and hole 3 has been infilled. A previous scour surface now exists at hole 3 and is overlain by 4 ft of new streambed materials.
SCOUR ESTIMATES AT BRIDGE SITES 25
Figure 12. Ground-penetrating-radar profiles of the downstream bridge-face cross sections for (A) 1996 pre-flood and (B) 1998 post-flood data collection, from left to right bank, Route 13 over the Souhegan River, Milford, N.H.
26 Use of a Ground-Penetrating Radar System to Detect Pre- and Post-Flood Scour at Selected Bridge Sites in New Hampshire, 1996-98
Figure 13. Ground-penetrating-radar profiles of the right-bank pier cross section for (A) 1996 pre-flood and (B) 1998 post-flood data collection, from upstream to downstream, Route 13 over the Souhegan River, Milford, N.H.
SUMMARY AND CONCLUSIONS 27
SUMMARY AND CONCLUSIONS
Ground-penetrating-radar (GPR) techniques were used to detect pre- and post-flood scour from 1996-98 at bridge sites in New Hampshire in a cooper-ative study with the New Hampshire Department of Transportation. The 1996 pre-flood GPR cross-section data were collected at 30 bridges. The 1998 post-flood GPR cross-section data were collected at 16 bridges where GPR data were interpretable. Of the post-flood data collected at 16 bridges, 7 sites and 22 profiles were selected for this report. Post-flood data-collection efforts at the bridges were based on the occurrence of a 2-year or greater flood recurrence interval at any of the bridge sites.
The geophysical equipment was operated from a small inflatable boat. The boat was easily maneuvered by an operator wading beside it and guiding it in shallow water. In deep water, an electric trolling motor was used to propel and steer the boat by an operator inside the boat. This method of equipment deployment was fast, safe, and easily transportable from the vehicle to the river’s edge by one person. Geophysical record was collected at one bridge per day.
Water depth and streambed materials affected the depth of penetration of the GPR signal. Shallow water (less than 3 ft) had a small affect on signal penetration of streambed materials, whereas deep water (10 ft or greater) attenuated the signal preventing signal penetration beyond 1-2 ft of the streambed. Cobbles and boulder streambeds stopped signal penetration and caused the record to become obscured with multiple inverted triangular reflections.
After data collection, the geophysical record was processed using commercially available software and correlated with data contained in New Hampshire Department of Transportation bridge plans. These data supplemented the geophysical data and aided in the interpretation of depths and locations of footings and geologic materials.
Twenty-two pre- and post-flood cross sections at seven bridge sites are presented and discussed.
Existing 1996 pre-flood data collection scour holes were detected in 14 cross sections. Scour depths ranged from 1 to 3 ft. New, 1998 post-flood data- collection scour holes were detected in seven cross sections. Scour depths ranged from greater than 1 to 4 ft. Infilled scour holes were detected in seven of the post-flood cross sections. Depths of infilling ranged from less than 1 to 4 ft. Field verification of the depth of infilling by means of steel rod and hammer was difficult because of cobble and boulder streambeds or deep water. Previous scour surfaces in streambed materials are identified in 15 cross sections and the depths to these surfaces ranged from 1 ft to 10 ft below the streambed.
Riprap materials or pier footings were identified in all 22 cross sections and calculated record depths generally agree with bridge plans. Pier footings were exposed at two bridge sites and steel pile was exposed at one bridge site. Exposures were verified by field observations.
GPR was found to be an effective tool for detecting existing scour holes, infilled scour holes, and previous scour surfaces at bridge sites. The use of pre- and post-flood GPR surveys was effective in measuring the potential maximum extent of scour that occurred during the intervening period between measurements. If this scour occurred during the highest flow in the intervening period, pre- and post-flood GPR can be effective in maximizing the number of scour measurements at bridges during a flood event. Thus, the use of GPR permits augmentation of scour-data collection that is limited by the number of mobile teams or fixed instrumentation available during floods. GPR also is more versatile than fixed instrumentation mounted on bridge piers because data collection is not confined to the fixed-instrument location. The GPR instrument is mobile and can be positioned anywhere beneath the bridge to collect continuous streambed data in a cross-sectional format. Care must be taken to position the equipment to follow the same traverse paths for comparison of pre- and post-flood measure-ments.
28 Use of a Ground-Penetrating Radar System to Detect Pre- and Post-Flood Scour at Selected Bridge Sites in New Hampshire, 1996-98
SELECTED REFERENCES
Beres, Milan, Jr., and Haeni, F.P., 1991, Application of ground-penetrating-radar methods in hydrogeologic studies: Ground Water, v. 29, no. 3, p. 375-386.
Davidian, J., 1984, Computation of water-surface profiles in open channels: U.S. Geological Survey Techniques of Water-Resources Investigations, book 3, chap. A15, 48 p.
Geophysical Survey Systems, Inc., 1994, SIR System-2 Operation Manual #MN72-140: Hudson, N.H., 20 p.
———1995, Radan for Windows Manual #MN43-116: Hudson, N.H., 55 p.
Haeni, F.P., 1995, Use of ground-penetrating radar and continuous seismic-reflection profiling on surface-water bodies in environmental and engineering studies in Bell, R.S. (ed.), Symposium on the application of geophysics to engineering and environmental
problems, Oak Brook Illinois, April 26-29, 1992, Proceedings: Golden, Colo., Society of Engineering and Mineral Exploration Geophysicists, p. 145-162.
New Hampshire Department of Transportation, 1992, Final report for bridge scour evaluation: Whitman and Howard, Inc., November, 208 p.
Placzek, Gary, and Haeni, F.P., 1995, Surface-geophysical techniques used to detect existing and infilled scour holes near bridge piers: U.S. Geological Survey Water-Resources Investigations Report 95-4009, 44 p.
Richardson, Dr. E.V., Harrison, L.J., Richardson, Dr. J.R., and Davis, S.R., 1993, Evaluating scour at bridges: National Highway Institute, Federal Highway Administration Technical Report HEC-18, PB93-186138, 244 p.
Whitman and Howard, Inc., 1992, Final report for bridge scour evaluation statewide: November, br-nbis (10) 11366, 214 p.