Use of By-Plot CV’s Use of By-Plot CV’s for Refining Mid- for Refining Mid- Season Fertilizer N Season Fertilizer N Rates Rates Daryl Brian Arnall Daryl Brian Arnall Plant and Soil Sciences Plant and Soil Sciences Department Department Oklahoma State University Oklahoma State University
Transcript
Use of By-Plot CV’s for Use of By-Plot CV’s for Refining Mid-Season Fertilizer Refining Mid-Season Fertilizer
N RatesN Rates
Daryl Brian ArnallDaryl Brian ArnallPlant and Soil Sciences DepartmentPlant and Soil Sciences Department
Oklahoma State UniversityOklahoma State University
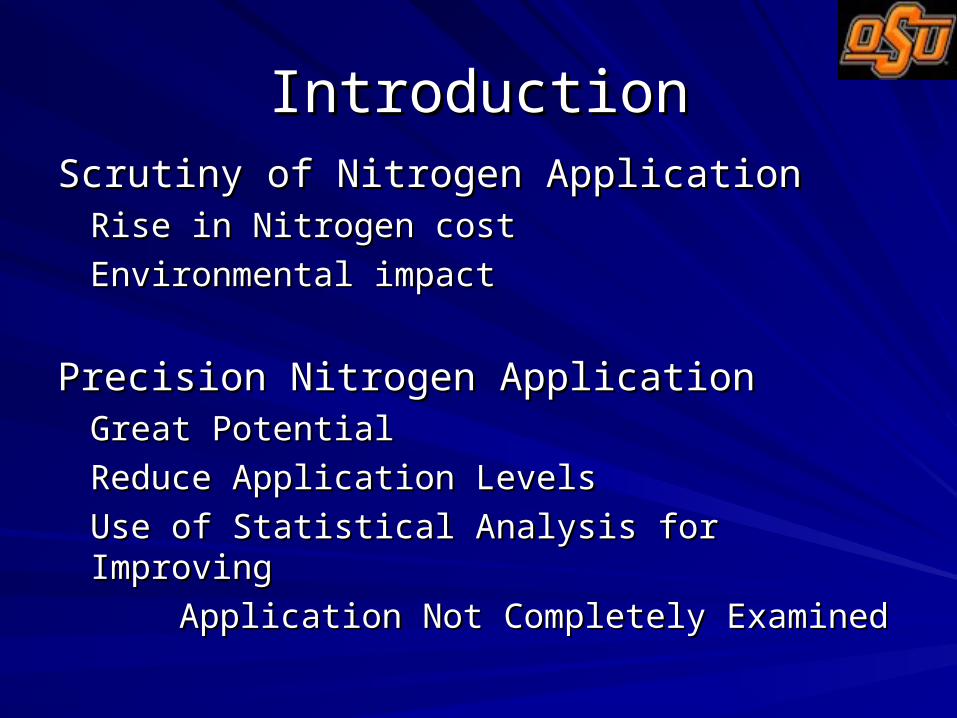
IntroductionIntroductionScrutiny of Nitrogen Application Scrutiny of Nitrogen Application
Use of Statistical Analysis for ImprovingUse of Statistical Analysis for Improving
Application Not Completely Examined Application Not Completely Examined
ObjectiveObjective
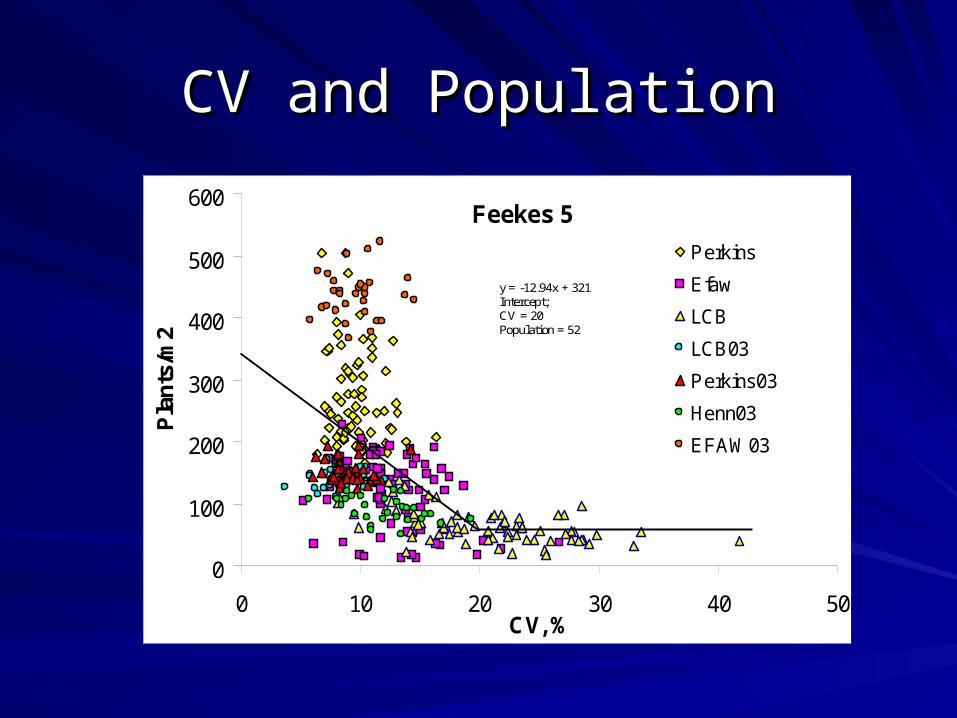
Determine the relationship between Determine the relationship between the CV measured using spectral radiance the CV measured using spectral radiance measurements, and plant population at measurements, and plant population at early growth stages. early growth stages.
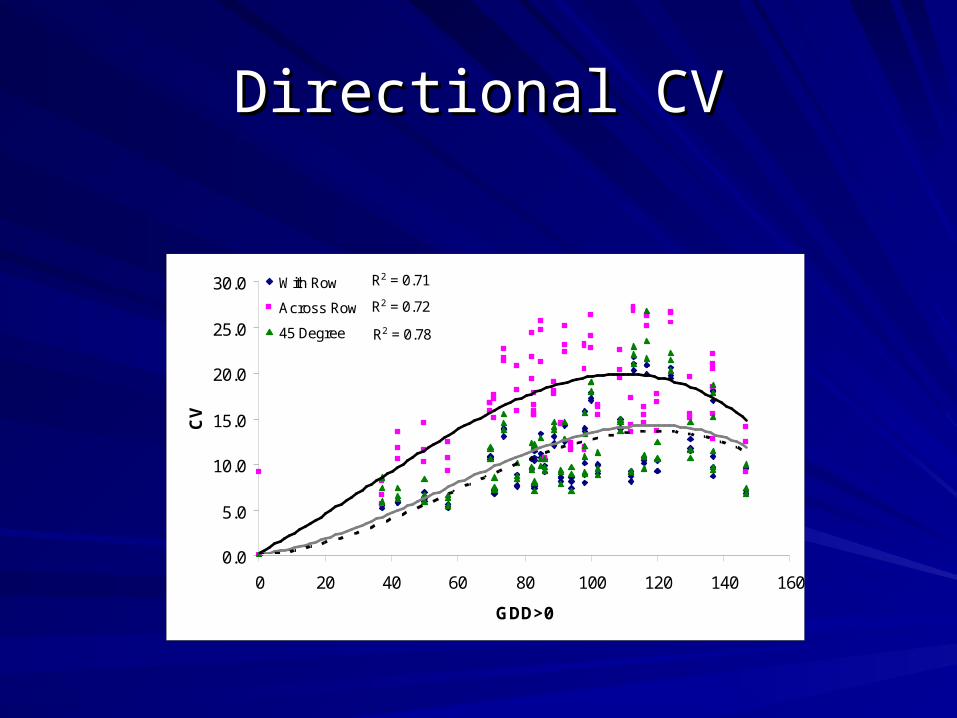
Sensing direction in relation to the Sensing direction in relation to the crop row direction impact on NDVI.crop row direction impact on NDVI.
MethodMethod
25 plots at 3 locations:25 plots at 3 locations:
Plots measured 1.48m by 4.88mPlots measured 1.48m by 4.88m
3 nitrogen treatments implemented with 3 nitrogen treatments implemented with each plot.each plot.
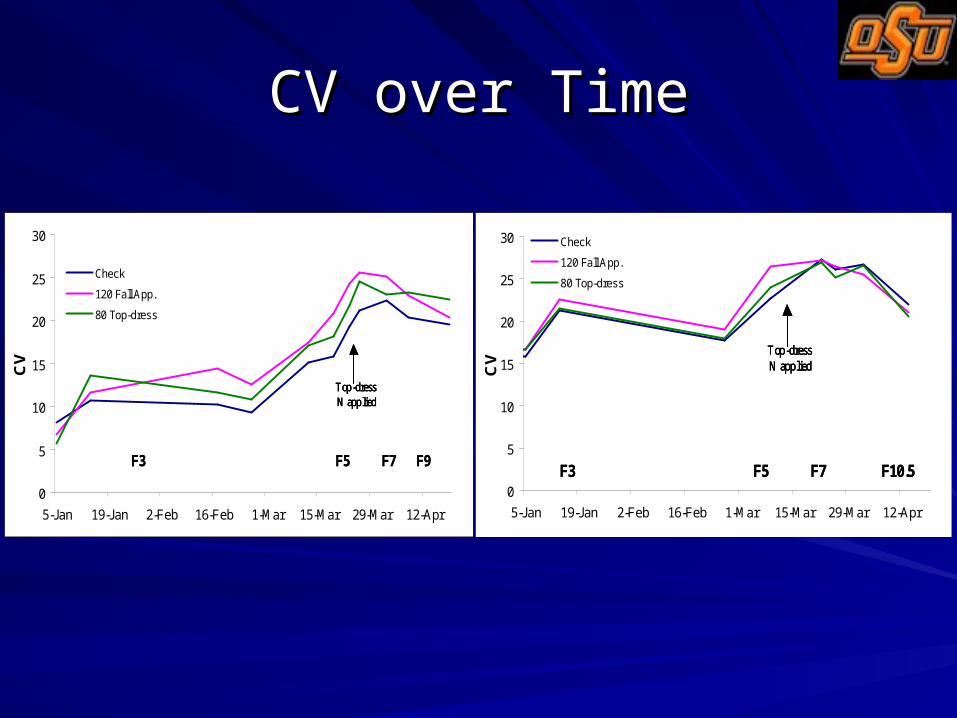
0 N, 120kg/ha Fall App., 80 kg/ha Top-0 N, 120kg/ha Fall App., 80 kg/ha Top-dressdress
Plot PlanPlot Plan
Check
0 N
N-Rich120 kg/ha N Fall App.
Farmer Practice
80 kg/ha NTopdress
Method cont.Method cont.
At Feekes 1 (At Feekes 1 (EmergenceEmergence))::
Plots were established.Plots were established.
Fall nitrogen applied.Fall nitrogen applied.
Plant counts taken on 4 randomly selected Plant counts taken on 4 randomly selected rows.rows.
At Feekes 6 (At Feekes 6 (Stem ElongationStem Elongation))::
Began in January.Began in January.Concluded at physiological maturity.Concluded at physiological maturity.
Sensor held 75cm to 100 cm over the crop Sensor held 75cm to 100 cm over the crop canopy.canopy.
3 seconds allowed for each reading.3 seconds allowed for each reading.
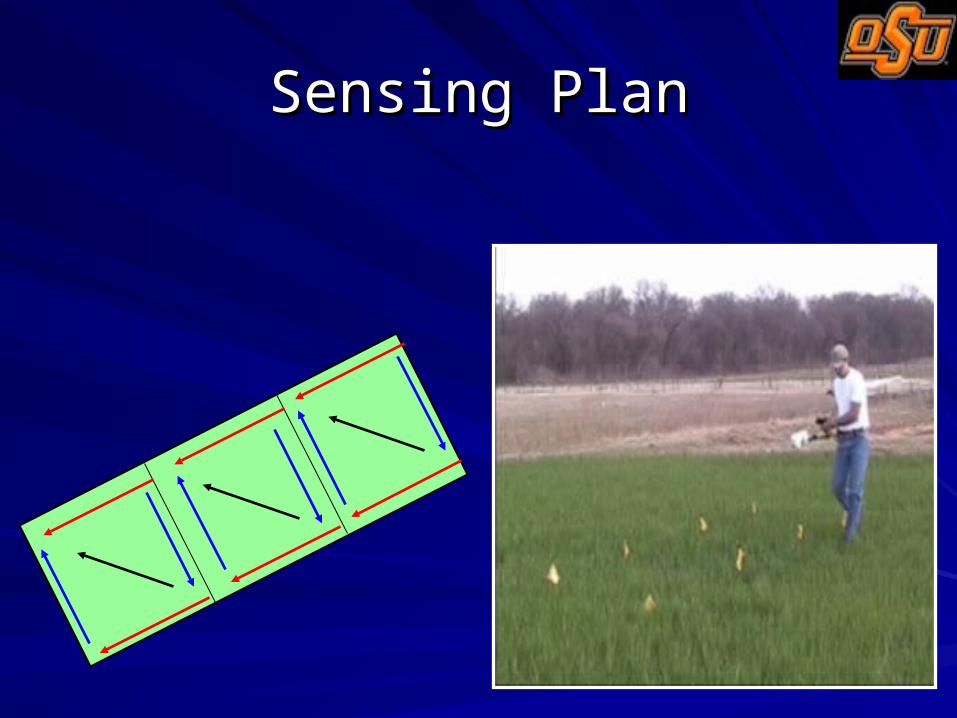
Sensing PlanSensing Plan
1 2 3 4 5 6 7 8
1
2
3
4
Row
5
1 2 3 4 5 6 7 8
1
2
3
4
Row
5
5 Readings per trt: 2 with row, 2 across row, 5 Readings per trt: 2 with row, 2 across row, and 1 at a 45 degree to the seed row.and 1 at a 45 degree to the seed row.