1 Use of dopamine polymerisation to produce self-standing membranes from (PLL-HA) n exponentially growing multilayer films Falk Bernsmann ab , Ludovic Richert ab , Bernard Senger ab , Philippe Lavalle ab , Jean-Claude Voegel ab , Pierre Schaaf c and Vincent Ball *ab a Institut National de la Santé et de la Recherche Médicale (INSERM), Unité 595, 11 rue Humann, 67085 Strasbourg Cedex, France Fax: +33 3 90243379 Tel: +33 3 90243258 *E-mail: [email protected]b Université Louis Pasteur, Faculté de Chirurgie Dentaire, 1 Place de l’Hôpital, 67000 Strasbourg, France c Centre National de la Recherche Scientifique (CNRS), Unité Propre de Recherche 22, Institut Charles Sadron, 23 rue du Loess, BP 84047, 67034 Strasbourg Cedex 2, France Supporting information Chemicals All solutions were freshly prepared before use from water with a resistivity of 18.2 MΩ.cm purified in a Milli Q Plus water purification system (Millipore, Billerica, MA, USA). The polyelectrolytes used to build up the polyelectrolyte multilayer (PEM) films were hyaluronic acid (HA, viscosimetric molecular weight MW vis = 4.2 × 10 5 g.mol -1 , LifecoreBiomedical, Chaska, MN, USA) as the polyanion and poly-L-lysine (PLL, MW vis = 4.6 × 10 4 g.mol -1 , Sigma-Aldrich, St. Louis, MA, USA, ref. P2636) as the polycation. Before building films on a ZnSe crystal, the deposition of an anchoring layer of poly(ethyleneimine) (PEI, MW = 7.5 × 10 5 g.mol -1 , Sigma-Aldrich, ref. P3143) was necessary. The
Transcript
1
Use of dopamine polymerisation to produce self-standing membranes from (PLL-HA)n
exponentially growing multilayer films
Falk Bernsmann ab, Ludovic Richert ab, Bernard Senger ab, Philippe Lavalle ab, Jean-Claude
Voegel ab, Pierre Schaaf c and Vincent Ball *ab
a Institut National de la Santé et de la Recherche Médicale (INSERM), Unité 595, 11 rue
LifecoreBiomedical, Chaska, MN, USA) as the polyanion and poly-L-lysine (PLL, MWvis =
4.6 × 10⁴ g.mol-1, Sigma-Aldrich, St. Louis, MA, USA, ref. P2636) as the polycation. Before
building films on a ZnSe crystal, the deposition of an anchoring layer of poly(ethyleneimine)
(PEI, MW = 7.5 × 10⁵ g.mol-1, Sigma-Aldrich, ref. P3143) was necessary. The
2
polyelectrolytes, as well as dopamine (Sigma-Aldrich, ref. H8502) were dissolved in 50 mM
Tris (tris(hydroxymethyl) aminomethane, Sigma-Aldrich, ref. T1503) buffer at pH 8.50. The
pH was measured with a pH-meter HI8417 (Hanna Instruments, Tanneries, France) and
adjusted by addition of hydrochloric acid solution (37% HCl, Sigma-Aldrich, ref. 258148).
The buffer was chosen because it allows for fast dopamine polymerisation.1
Preparation of labelled PLL
PLL was conjugated with FITC. Briefly, a PLL solution at 1 mg.mL-1 in Tris buffer
(50 mM, pH = 8.5) was put in contact during 1 hour at ambient temperature and in the dark
with FITC dissolved in a small volume of dimethyl sulfoxyde (SdS, Peypin, France). The
initial ratio between the number of FITC molecules and the number of PLL monomers was
lower than 0.05. The PLL-FITC / free FITC mixture was then dialysed against Tris buffer
using a dialysis bag made of cellulose ester with a molecular weight cut off of 10 kg.mol-1
(Spectra / Por, Spectrum Laboratories, Rancho Dominguez, CA, USA). This dialysis step was
repeated at least 2 times and was stopped when no FITC could be detected anymore in the
dialysate. This was checked by UV-vis spectroscopy at a wavelength of 494 nm.
UV-vis spectroscopy
UV-vis absorbance spectra were acquired with a Safas-mc2 spectrophotometer (Safas,
Monaco) in the single beam mode. The spectra between 200 and 800 nm of dopamine
solutions were taken after a given time of reaction with a spectral resolution of 1 nm. The
same conditions were used to acquire the spectra of (PLL-HA)n films deposited on quartz
slides and put in contact during a time t with a dopamine solution at 2 g.L-1. Before spectral
characterization, the glass slides covered with the PEM film were rinsed with buffer and
blown dry under a stream of nitrogen. The base line was acquired with a quartz cuvette (1 cm
3
of optical path length) filled with buffer or with a dry and cleaned quartz slide respectively for
experiments performed on dopamine solutions or on thin films.
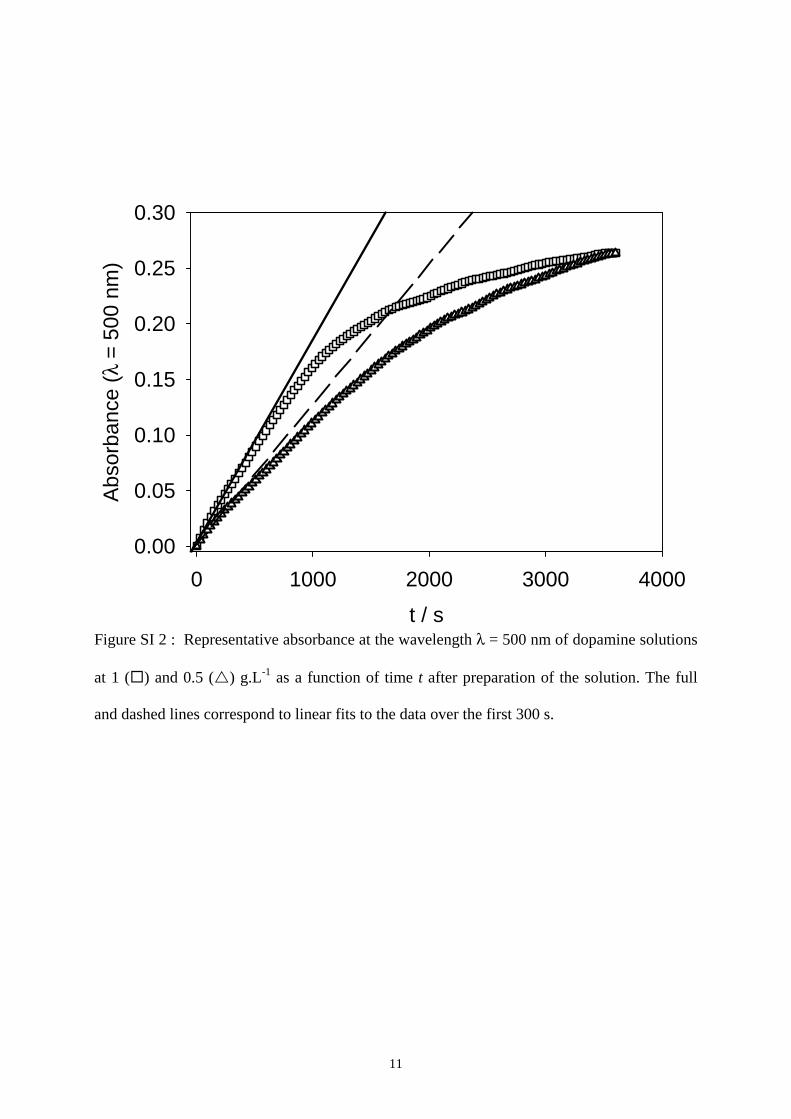
UV-vis spectroscopy was also used to follow the absorbance increase for dopamine
solutions with concentrations ranging from 0.1 to 4 g.L-1. These experiments were performed
at a fixed wavelength of 500 nm because dopamine monomers do not absorb at this
wavelength. The appropriate volume of buffer was mixed with the weighed dopamine powder
just before giving it into the quartz cuvette to measure the baseline absorbance. Afterwards,
the absorbance was acquired every 30 s. The initial rate of dopamine transformation was
calculated by linear regression of the initial part of the absorbance versus time curve. These
curves were linear over a time range of about 5 min (See Figure SI 2 below).
The same kinetic experiments were also performed by using Tris buffer that had been
deaerated by intensive argon bubbling.
Build-up of the PEM films and reaction with dopamine
The films used for characterisation by atomic force microscopy (AFM) or confocal
laser scanning microscopy (CLSM) were deposited on cover glasses (12 mm diameter, Fisher
Bioblock Scientific, Illkirch, France). These supports were cleaned just before use in a 10 mM
solution of sodium dodecylsulfate (SDS, Sigma-Aldrich) at a temperature of about 70 °C
during 15 min, rinsed with water, put in a 0.1 M hydrochloric acid solution (Sigma-Aldrich)
at about 70 °C for another 15 min and rinsed with water once more. The PEMs were
deposited with an automated dipping machine (DR3, Riegler and Kirstein GmbH, Berlin,
Germany). The adsorption duration was of 8 min for both polyelectrolytes, the concentration
of HA and PLL being of 1g.L-1. Each adsorption step was separated from the next one by
three rinsing steps of 40 s, 5 min and 5 min in different beakers containing Tris buffer. The
4
cover glasses being negatively charged at pH 8.50, the build-up of the PEM films always
started with the deposition of the polycation, PLL.
For the measurement of the film thickness in the dry state, the PEM deposition was
done on silicon wafers (Siltronix, Archamps, France), covered with naturally grown silicon
oxide. They were cut in the form of rectangles, about 3 × 1 cm2 in dimension and cleaned in
the same manner as the cover glasses. The film build up was performed by manually dipping
the silicon slides for 5 min in polyelectrolyte solutions, hence less than the 8 min used for the
film deposition using the dipping machine. This does not change the film build up because the
adsorption of HA and PLL on previously formed multilayer films is achieved in less than 5
min (data not shown). Between polyelectrolyte depositions, the samples were rinsed by
dipping them twice for 2.5 min in Tris buffer solutions. The film was blown dry under a
nitrogen stream every six layer pairs to determine its thickness at ambient humidity. The
growth of (PLL-HA)n PEM films is not disturbed by regular drying-rehydration cycles2,
which are necessary to determine the film thickness by means of ellipsometry in the dry state.
Films for UV-vis spectroscopy and membrane detachment were prepared the same way on
quartz slides (Fisher Bioblock Scientific) without intermediate drying steps.
All build-up experiments were performed at temperatures between 20 °C and 25 °C.
The (PLL-HA)n PEM films were put in contact with dopamine solutions at 2 g.L-1 in Tris
buffer, which had been prepared just before. The samples were maintained in a vertical
orientation to avoid the sedimentation of colloidal particles, which appeared in the dopamine
solutions after a few hours of reaction at pH 8.5. The presence of such particles on the surface
of the films might lead to a considerable increase in film roughness.
5
Ellipsometry
The thickness of the silicon oxide layer covering the silicon substrate was measured
before the build up of the PEM film by ellipsometry (HORIBA Jobin Yvon, model PZ 2000,
Longjumeau, France) at a wavelength of 632.8 nm and an incidence angle of 70°. The total
thickness of the oxide layer and the PEM was calculated from the measured ψ and Δ
ellipsometric angles assuming the film to be uniform and isotropic and using a refractive
index value of 1.465 as for the silicon oxide layer. The thickness values given are the average
(± one standard deviation) over 5 to 10 independent measurements taken along the major axis
of the rectangular silicon slide. The thickness of the PEM was determined by subtracting the
thickness of the SiO2 layer from the measured total thickness. The assumption that the
refractive index of the PEM film is equal to 1.465 is realistic in the dry state, since the fully
hydrated (PLL-HA)n films have a refractive index between 1.42 and 1.43 at 632.8 nm.3 We
did not measure the thickness change upon incorporation of dopamine in its polymerised form
since this incorporation may induce an important increase in refractive index and the
approximation of fixing it to 1.465 may be an underestimation leading to an overestimation of
the film thickness. The effect of dopamine incorporation on film thickness was hence
investigated directly by confocal laser scanning microscopy and indirectly by infrared
spectroscopy in the attenuated total reflection mode.
Confocal laser scanning microscopy
(PLL-HA)30 films constructed on cover glasses were put in contact during 5 min with
a PLL-FITC (PLL - fluorescein isothiocyanate) solution at 1 g.L-1 in Tris buffer and rinsed
with Tris buffer to remove the weakly bound molecules. Since PLL-FITC is able to diffuse
across the whole film thickness, it labels the entire film.3
The films were then imaged with an LSM 510 inverted confocal laser scanning
microscope (CLSM) (Zeiss, Oberkochen, Germany). The cover glasses supporting the
6
polyelectrolyte films were placed in a homemade sample holder in Tris buffer (50 mM at pH
= 8.50). The FITC molecules were excited at a wavelength of 488 nm with a 25 mW argon
ion laser and the emitted fluorescence was collected at wavelengths between 505 nm and 530
nm. The employed immersion objective (Plan Neofluar, Zeiss) had a 40 × magnification and a
numerical aperture of 1.3. Stacks of line scans with a length of 230.3 μm in the sample plane
were acquired at a resolution of 512 pixels and combined to virtual z-sections. The number of
line scans and their distance normal to the sample plane were calculated by the operating
software of the microscope as a function of the sample thickness to obtain an optimum
resolution.
Fluorescence recovery after photobleaching
To study the mobility of PLL chains labelled with fluorescein isothiocyanate (PLL-
FITC) in films made of PLL and HA, the technique of fluorescence recovery after
photobleaching (FRAP) was used. The experiments were performed on the same microscope
with the same configuration as in the previous section. An area of 230.3 μm² was imaged
using a raster of 512 by 512 pixels. To obtain a depth of field comparable to the film
thickness, the confocal pinhole was opened to 5 Airy units corresponding to ca. 2.3 µm. A
disk of 111 pixels (50.0 µm) diameter in the centre of the imaged area was bleached by
scanning it between 100 and 300 times with the laser at full power. Then, a time series of
images was acquired with the laser power reduced to a few per cent of its full power to
minimize further bleaching of the sample. For the first 10 min an image was taken every 2
min, from 10 to 45 min the time interval between two images was 5 min, then it was 15 min
up to a total time of 2 h. Further images were taken every 30 min up to a total time of 3 to 4 h
after the bleaching.
7
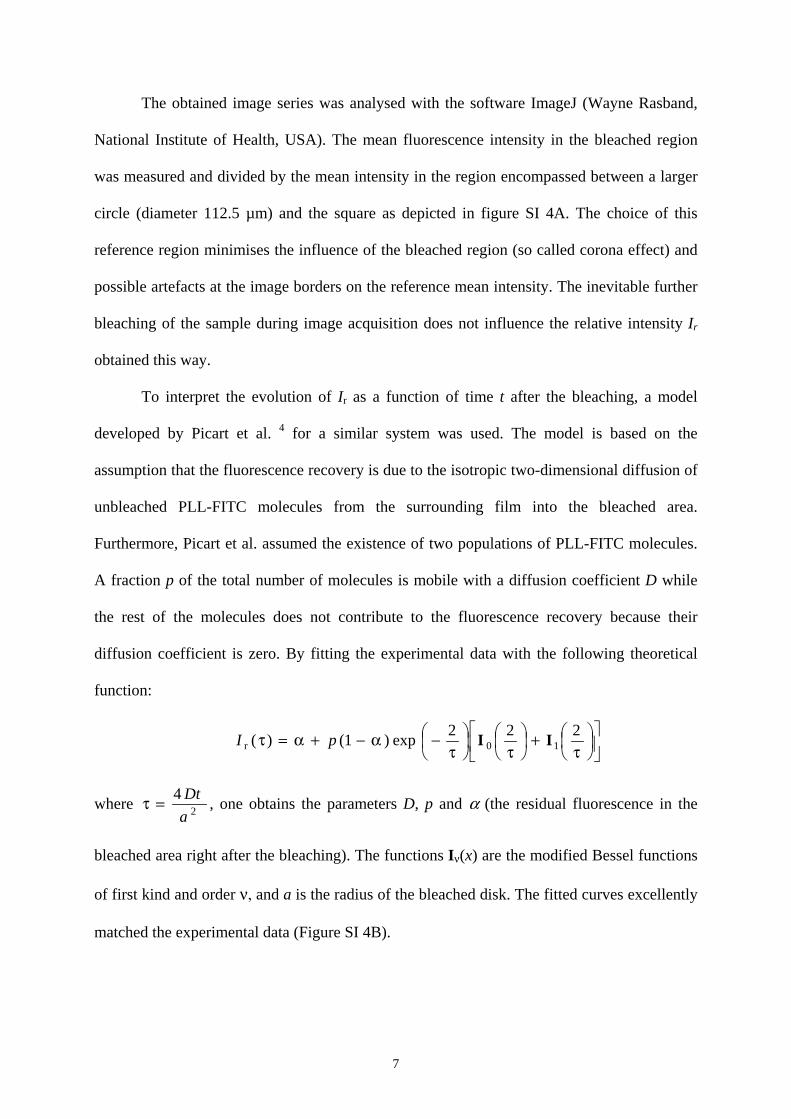
The obtained image series was analysed with the software ImageJ (Wayne Rasband,
National Institute of Health, USA). The mean fluorescence intensity in the bleached region
was measured and divided by the mean intensity in the region encompassed between a larger
circle (diameter 112.5 µm) and the square as depicted in figure SI 4A. The choice of this
reference region minimises the influence of the bleached region (so called corona effect) and
possible artefacts at the image borders on the reference mean intensity. The inevitable further
bleaching of the sample during image acquisition does not influence the relative intensity Ir
obtained this way.
To interpret the evolution of Ir as a function of time t after the bleaching, a model
developed by Picart et al. 4 for a similar system was used. The model is based on the
assumption that the fluorescence recovery is due to the isotropic two-dimensional diffusion of
unbleached PLL-FITC molecules from the surrounding film into the bleached area.
Furthermore, Picart et al. assumed the existence of two populations of PLL-FITC molecules.
A fraction p of the total number of molecules is mobile with a diffusion coefficient D while
the rest of the molecules does not contribute to the fluorescence recovery because their
diffusion coefficient is zero. By fitting the experimental data with the following theoretical
function:
⎥⎦
⎤⎢⎣
⎡⎟⎠⎞
⎜⎝⎛
τ+⎟
⎠⎞
⎜⎝⎛
τ⎟⎠⎞
⎜⎝⎛
τ−α−+α=τ 222exp)1()( 10r IIpI
where 24aDt=τ , one obtains the parameters D, p and α (the residual fluorescence in the
bleached area right after the bleaching). The functions Iν(x) are the modified Bessel functions
of first kind and order ν, and a is the radius of the bleached disk. The fitted curves excellently
matched the experimental data (Figure SI 4B).
8
Infrared spectroscopy in the attenuated total reflection mode (ATR-FTIR)
PEI-(HA-PLL)n films were built up from D2O solutions (Sigma-Aldrich) containing
50 mM Tris buffer (at pH 8.9 to account for the 0.4 pH units difference between H2O and
D2O) and polyelectrolytes at 1 g.L-1. In difference with the other build up experiments, the
films used for ATR-FTIR spectroscopy were initiated with a layer of PEI which is mandatory
as an anchoring layer to obtain reproducible build up of the PEM films. After each
polyelectrolyte adsorption from flowing solutions atop the trapezoidal ZnSe support during 5
min, the polyelectrolyte solution was replaced by Tris buffer (in D2O) and the infrared
spectrum of the film was acquired by accumulating 512 scans at 2 cm-1 spectral resolution on
an Equinox 55 spectrometer (Bruker, Wissembourg, France). The detector was a liquid
nitrogen cooled mercury cadmium telluride (MCT) detector. The transmitted intensity was
compared to that transmitted by the pristine ZnSe crystal to calculate the absorption spectrum
of each layer. After the film build up was completed, the 50 mM Tris buffer was replaced by a
2 g.L-1 dopamine solution in Tris buffer to follow the incorporation of dopamine and its
polymerisation in the film as a function of time. The PEI-(HA-PLL)n film was built up to the
level at which no further increase in absorbance could be observed upon deposition of
additional layer pairs. This means that the thickness of the PEI-(HA-PLL)n film is
significantly higher than the penetration depth of the evanescent wave from the ZnSe crystal
into the multilayer film. We found (Figure SI 5A) that between n = 9 and n = 12 no significant
increase in the absorbance of the amide I band (between 1600 and 1700 cm-1) due to PLL
could be detected. Hence we used a PEI-(HA-PLL)12 film to investigate the incorporation of
dopamine and its polymerization product in this kind of multilayer architectures.
9
Atomic force microscopy (AFM)
AFM topographies of (PLL-HA)30 films, as well as of the same films put in contact
with a dopamine solution (2 g.L-1 in Tris buffer) for a duration t, deposited on 12 mm cover
glasses were acquired in presence of Tris buffer in Tapping mode using a Nanoscope IV
(Veeco, Santa Barbara, CA, USA) microscope. The employed cantilevers (model NP 10,
Veeco) had a nominative spring constant of 0.06 N.m-1 and were terminated with a silicon
nitride tip.
Membrane detachment
(PLL-HA)23 films deposited on quartz slides (4 × 1 or 4 × 2 cm2) were held in a
vertical orientation in a freshly prepared dopamine solution at 2 g.L-1 for various time
durations : 1, 4 or 10 h. They were then rinsed with Tris buffer and water. Note that a (PLL–
HA)23 film decomposes spontaneously when rinsed with pure water, whereas after 4 hours of
contact with a dopamine solution the brownish colour remains on the quartz slide after water
rinse. The samples were blown dry under a stream of nitrogen and the edges of the quartz
slide were cut with a razor blade allowing the diffusion of the liquid to be used for film
detachment between the film and the support. Afterwards, the samples were put in contact
with hydrochloric acid solutions at increasing concentrations: 10-3 M, 10-2 M and 10-1 M.
Decomposition of the film in small pieces, or detachment of two membranes (one for each
side of the support) was observed only in the presence of HCl at 10-1 M. No membrane
detachment was observed when the quartz slide was put in pure water for a long time (up to
one day).
10
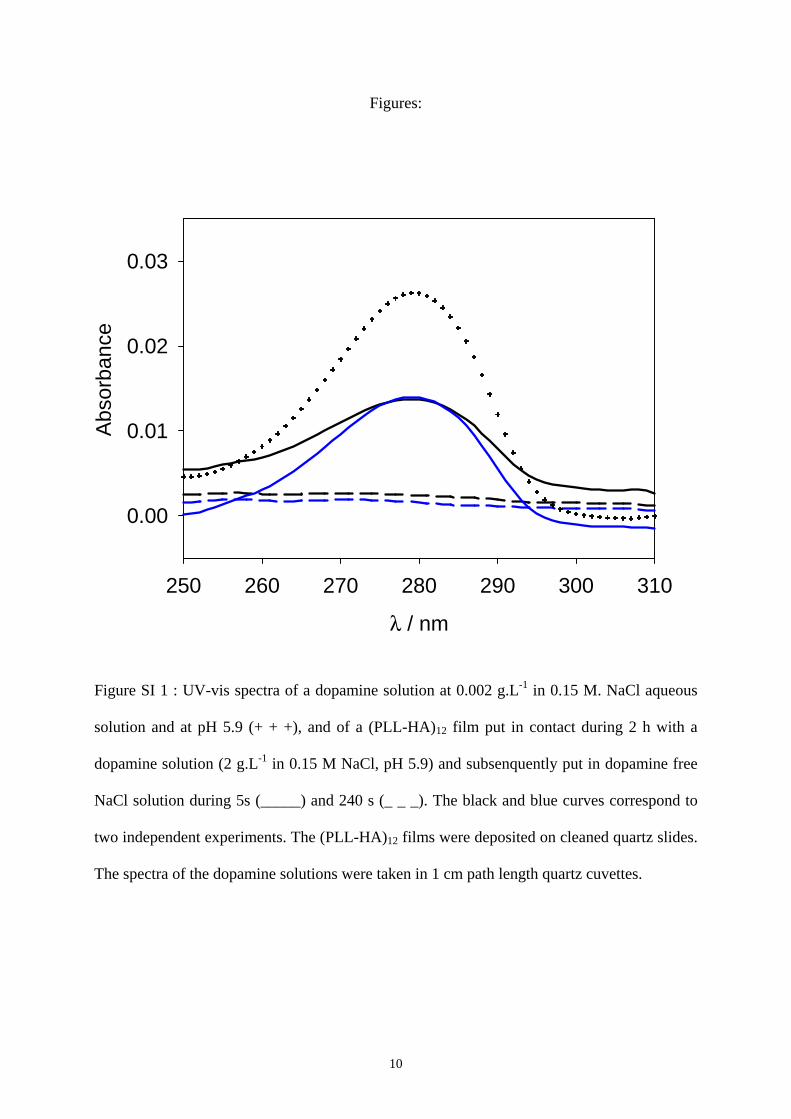
Figures: Figure SI 1 : UV-vis spectra of a dopamine solution at 0.002 g.L-1 in 0.15 M. NaCl aqueous
solution and at pH 5.9 (+ + +), and of a (PLL-HA)12 film put in contact during 2 h with a
dopamine solution (2 g.L-1 in 0.15 M NaCl, pH 5.9) and subsenquently put in dopamine free
NaCl solution during 5s (_____) and 240 s (_ _ _). The black and blue curves correspond to
two independent experiments. The (PLL-HA)12 films were deposited on cleaned quartz slides.
The spectra of the dopamine solutions were taken in 1 cm path length quartz cuvettes.
λ / nm
250 260 270 280 290 300 310
Abs
orba
nce
0.00
0.01
0.02
0.03
11
t / s
0 1000 2000 3000 4000
Abs
orba
nce
(λ =
500
nm
)
0.00
0.05
0.10
0.15
0.20
0.25
0.30
Figure SI 2 : Representative absorbance at the wavelength λ = 500 nm of dopamine solutions
at 1 ( ) and 0.5 ( ) g.L-1 as a function of time t after preparation of the solution. The full
and dashed lines correspond to linear fits to the data over the first 300 s.
12
t / s
0 1000 2000 3000 4000 5000
Abs
orba
nce
(λ =
500
nm
)
0.00
0.05
0.10
0.15
0.20
0.25
0.30
Figure SI 3 : Influence of pH change from 8.5 to 3.45 upon the kinetics of dopamine (at 0.5
g.L-1 in the presence of Tris buffer) transformation (most probably into dopamine quinone and
into a polymer at later stages 1) as followed by UV-vis spectroscopy at a wavelength λ = 500
nm. The arrows correspond to the addition of 50 µL of concentrated hydrochloric acid to the
reaction mixture (1.4 mL) at two different times t (300 s for and 3600 s for ). The pH of
the solutions was measured at the end of the experiments.
13
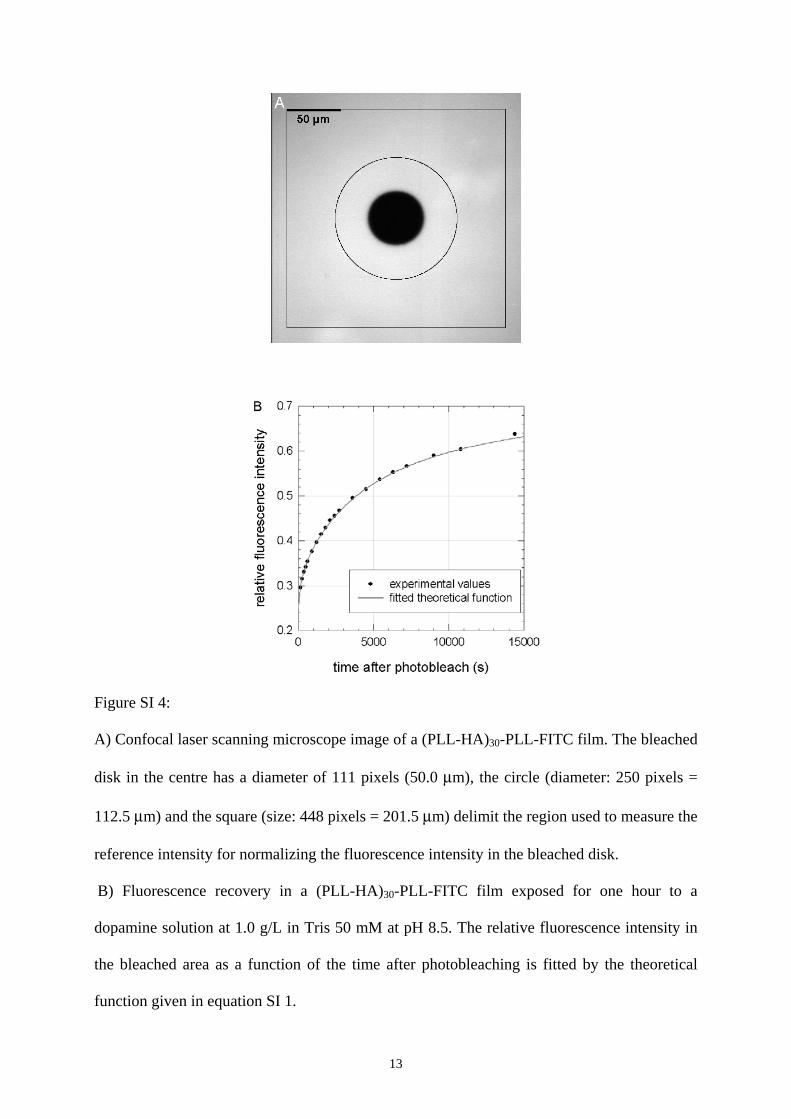
Figure SI 4:
A) Confocal laser scanning microscope image of a (PLL-HA)30-PLL-FITC film. The bleached
disk in the centre has a diameter of 111 pixels (50.0 μm), the circle (diameter: 250 pixels =
112.5 μm) and the square (size: 448 pixels = 201.5 μm) delimit the region used to measure the
reference intensity for normalizing the fluorescence intensity in the bleached disk.
B) Fluorescence recovery in a (PLL-HA)30-PLL-FITC film exposed for one hour to a
dopamine solution at 1.0 g/L in Tris 50 mM at pH 8.5. The relative fluorescence intensity in
the bleached area as a function of the time after photobleaching is fitted by the theoretical
function given in equation SI 1.
14
1/λ (cm-1)
800100012001400160018002000
Abs
orba
nce
0.0
0.1
0.2
0.3
0.4
0.5A
1/λ (cm-1)
800100012001400160018002000
Abs
orba
nce
-0.02
0.00
0.02
0.04
0.06
0.08B
1/λ (cm-1)
800100012001400160018002000
Abso
rban
ce
0.0
0.1
0.2
0.3
0.4C
1 2
3
3
1 2
1 2
3
15
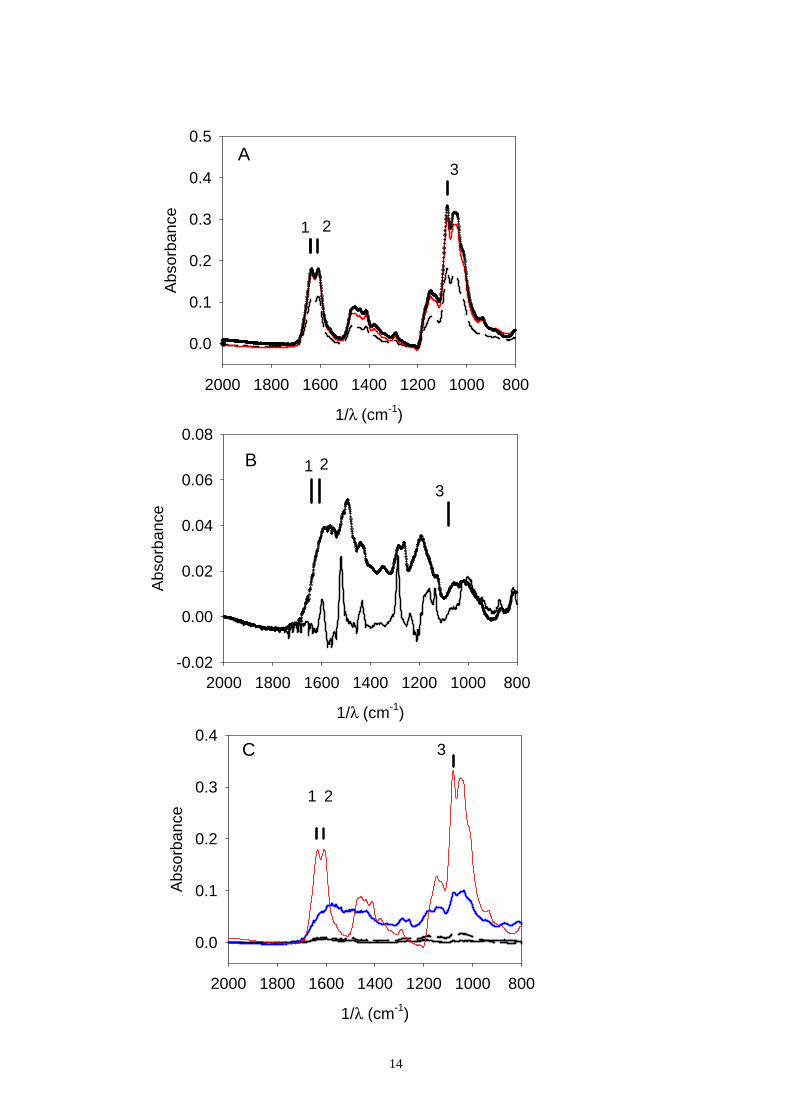
Figure SI 5:
A: Evolution of the ATR-FTIR spectra in the wavenumber (1/λ) range between 800 and 2000
cm-1 during the build up of the PEI-(HA-PLL)n film, with n=6 (_ _ _), n = 9 (____ ) and n =
12 (+++ ).
B: Infrared spectrum of a dopamine solution at 2 g.L-1 (at pH 6.6) (____) and of the ZnSe
crystal being put in contact with a 2 g.L-1 dopamine solution (in Tris buffer at pH = 8.5)
during 24 h and rinsed with Tris buffer before the measurement (+++).
C: Infrared spectra of the PEI-(HA-PLL)12 film put in contact with dopamine solutions at 2
g.L-1 (in Tris buffer at pH = 8.5) during 1h (___), 3h (_ _ _) and 25 h (___). The displayed
spectra were calculated by taking the intensity transmitted through the PEI-(HA-PLL)12 film
as a reference.
One sees that with reference to the PEI-(HA-PLL)12 film, the spectrum after 25 h of reaction
is not only composed of bands due to the incorporation of polymer [most probably poly(5,6-
indolequinone)1] but also displays in increase in the intensity of the bands present in the PEI-
(HA-PLL)12 film (labelled with 1, 2 and 3 in all three parts of the Figure). To illustrate an
increase in the intensity of the PLL and HA bands upon dopamine polymerization, the
spectrum of the PEI-(HA-PLL)12 film (____) has been added on part C, the reference
transmission spectrum being that of the bare ZnSe crystal. This clearly demonstrates that
prolonged incubation of the film in a dopamine solution leads to a deswelling of the film.
16
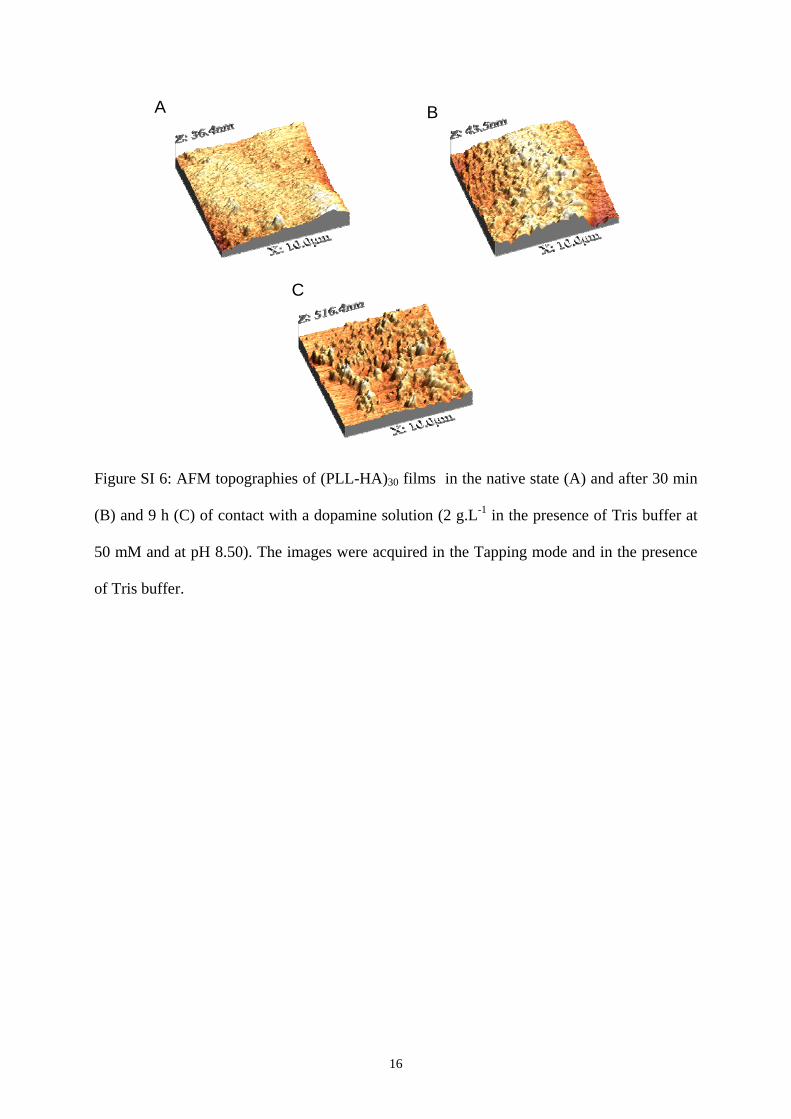
Figure SI 6: AFM topographies of (PLL-HA)30 films in the native state (A) and after 30 min
(B) and 9 h (C) of contact with a dopamine solution (2 g.L-1 in the presence of Tris buffer at
50 mM and at pH 8.50). The images were acquired in the Tapping mode and in the presence
of Tris buffer.
A B
C
17
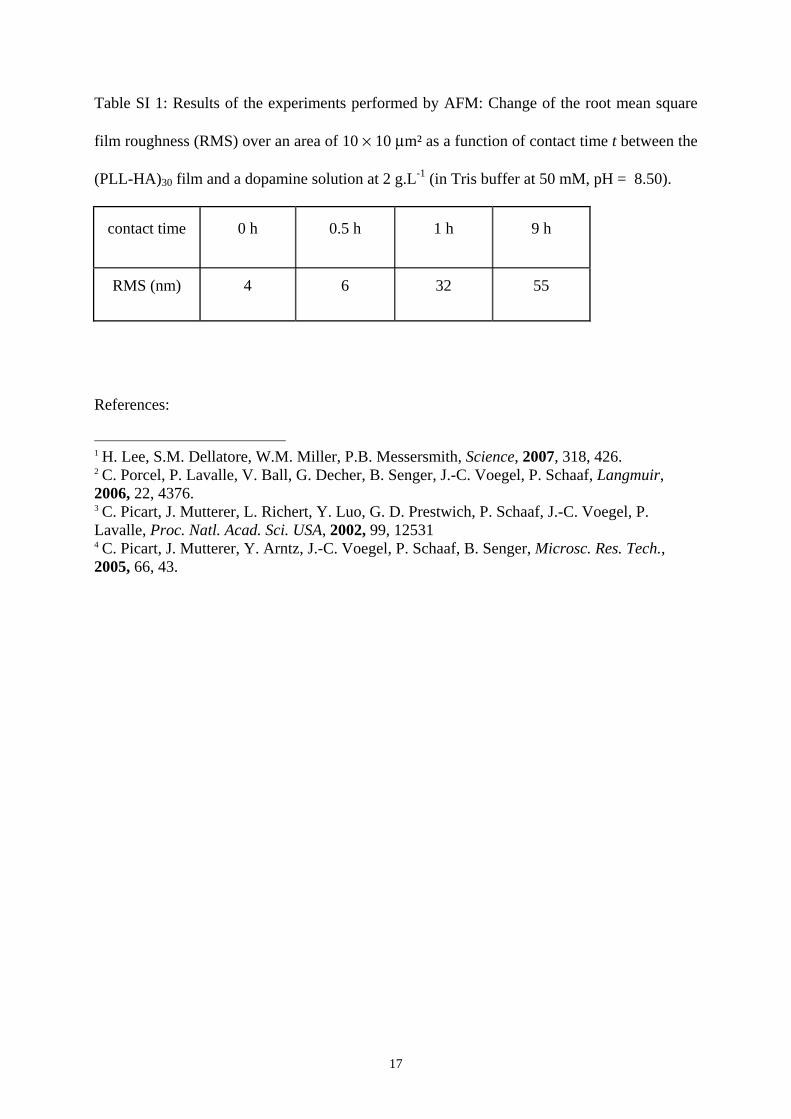
Table SI 1: Results of the experiments performed by AFM: Change of the root mean square
film roughness (RMS) over an area of 10 × 10 μm² as a function of contact time t between the
(PLL-HA)30 film and a dopamine solution at 2 g.L-1 (in Tris buffer at 50 mM, pH = 8.50).
contact time 0 h 0.5 h 1 h 9 h
RMS (nm) 4 6 32 55
References:
1 H. Lee, S.M. Dellatore, W.M. Miller, P.B. Messersmith, Science, 2007, 318, 426. 2 C. Porcel, P. Lavalle, V. Ball, G. Decher, B. Senger, J.-C. Voegel, P. Schaaf, Langmuir, 2006, 22, 4376. 3 C. Picart, J. Mutterer, L. Richert, Y. Luo, G. D. Prestwich, P. Schaaf, J.-C. Voegel, P. Lavalle, Proc. Natl. Acad. Sci. USA, 2002, 99, 12531 4 C. Picart, J. Mutterer, Y. Arntz, J.-C. Voegel, P. Schaaf, B. Senger, Microsc. Res. Tech., 2005, 66, 43.