EDGEWOOD CHEMICAL BIOLOGICAL CENTER U.S. ARMY SOLDIER AND BIOLOGICAL CHEMICAL COMMAND ECBC-TR-103 USE OF FLUORESCEIN IN AEROSOL STUDIES Jana Kasavan INDEPENDENT CONTRACTOR Robert W.Doherty RESEARCH AND TECHNOLOGY DIRECTORATE September 2000 Approved for public release; distribution is unlimited. 20001120 157 ^a^agggasxi^y Aberdeen Proving Ground, MD 21010-5424
Transcript
EDGEWOOD CHEMICAL BIOLOGICAL CENTER
U.S. ARMY SOLDIER AND BIOLOGICAL CHEMICAL COMMAND
ECBC-TR-103
USE OF FLUORESCEIN IN AEROSOL STUDIES
Jana Kasavan
INDEPENDENT CONTRACTOR
Robert W.Doherty
RESEARCH AND TECHNOLOGY DIRECTORATE
September 2000
Approved for public release; distribution is unlimited.
20001120 157 ^a^agggasxi^y
Aberdeen Proving Ground, MD 21010-5424
Disclaimer
The findings in this report are not to be construed as an official Department of the Army position unless so designated by other authorizing documents.
REPORT DOCUMENTATION PAGE Form Approved OMB No. 0704-0188
Public reporting burden for this collection of information is estimated to average 1 hour per response, including the time for reviewing instructions, searching existing data sources, gathering and maintaining the data needed, and completing and reviewing the collection of information. Send comments regarding this burden estimate or any other aspect of this collection of information, including suggestions for reducing this burden, to Washington Headquarters Services, Directorate for Information Operations and Reports, 1215 Jefferson Davis Highway, Suite 1204, Arlington, VA 22202-4302, and to the Office of Management and Budget, Paperwork, Reduction Project (0704-0188), Washington, DC 20503.
1. AGENCY USE ONLY (Leave Blank) REPORT DATE
September 2000 3. REPORT TYPE AND DATES COVERED
Final; 98 Jan - 00 Mar 4. TITLE AND SUBTITLE
Use of Fluorescein in Aerosol Studies
6. AUTHOR(S)
Kesavan, Jana (Independent Contractor), and Doherty, Robert W. (ECBC)
7. PERFORMING ORGANIZATION NAME(S) AND ADDRESS(ES)
9. SPONSORING/MONITORING AGENCY NAME(S) AND ADDRESS(ES)
5. FUNDING NUMBERS
PR-622384/ACB2
8. PERFORMING ORGANIZATION REPORT NUMBER
ECBC-TR-103
10. SPONSORING/MONITORING AGENCY REPORT NUMBER
11. SUPPLEMENTARY NOTES
*When this work was started, the U.S. Army Edgewood Chemical Biological Center (ECBC) was known as the U.S. Army Edgewood Research, Development and Engineering Center (ERDEC).
12a. DISTRIBUTION/AVAILABILITY STATEMENT
Approved for public release; distribution is unlimited.
12b. DISTRIBUTION CODE
13. ABSTRACT (Maximum 200 words) Fluorescein has been used as a tracer in aerosol studies for the detection and quantification of aerosols. This report summarizes a sequence of experiments conducted to confirm our procedure used for the recovery and detection of fluorescein from filters. Our results confirmed the following: (1) The optimum excitation and emission wavelengths for fluorescein are 492 and 516 nm, respectively. (2) For fluorescence intensity (FI) measurements to be accurate, FI of a sample has to be significantly higher than the FI of water filled test tubes. (3) At higher gain settings, changes in the test tube orientation can affect the FI measurement of low fluorescence material. (4) Consistent alignment of the test tube in the fluorometer reduces the variation in FI measurements. (5) Below the self-quenching limit, the fluorometer readings increase linearly with increasing fluorescein concentrations. (6) After the pH of the recovery solution has reached 8, there is no significant effect on FI measurements for further increase in pH. (7) The change in pH does not affect the shape or the position of the peak of the emission spectrum. (8) Our procedure fully recovers fluorescein from glass fiber filters. (9) Fluorescein samples, prepared for fluorometer measurements, were stable over at least a 12 day period. (10) Test tubes can be reused if they are washed properly. All the above information was successfully used in two sampling line penetration studies. Measured and calculated penetration values agreed for tested particle sizes. ___^__ 14. SUBJECT TERMS
Fluorescein Aerosol Penetration efficiency
17. SECURITY CLASSIFICATION OF REPORT
UNCLASSIFIED
18. SECURITY CLASSIFICATION OF THIS PAGE
UNCLASSIFIED
19. SECURITY CLASSIFICATION OFABSTRACT
UNCLASSIFIED
15. NUMBER OF PAGES
23 16. PRICE CODE
20. LIMITATION OF ABSTRACT
UL NSN 7540-01-280-5500 Standard Form 298 (Rev. 2-89)
Prescribed by ANSI Std. Z39-18 298-102
Blank
li
PREFACE
The work described in this report was authorized under Project No. 622384/ACB2, Non-Medical CB Defense. The work was started in January 1998 and completed in March 2000.
The use of either trade or manufacturers' names in this report does not constitute an official endorsement of any commercial products. This report may not be cited for purposes of advertisement.
This report has been approved for public release. Registered users should request additional copies from the Defense Technical Information Center; unregistered users should direct such requests to the National Technical Information Center.
Acknowledements
The authors thank John Knapton for help in compiling the report; Jon Eckman, Laura Carpin, and Rafi Nudelman for their help with experiments; and also, a special thank you to Dr. A. McFarland, Texas A&M University, for his helpful suggestions.
in
Blank
IV
CONTENTS
1. INTRODUCTION 1
2. EXPERIMENTAL METHODS, RESULTS AND DISCUSSION 2 2.1 Optimum Excitation and Emission Wavelengths for Fluorescein 2 2.2 The Use of Different Test Tubes 2 2.3 Test Tube Orientation 4 2.4 The Effect of Aligning the Test Tube in the Fluorometer 5 2.5 Linearity of the Fluorometer Readings below Fluorescence Saturation 6 2.6 The Effect of the pH of a Solution on the FI 7 2.7 The Effect of pH on the Emission Curve Shape and the Position of the Peak 8 2.8 Recovery Procedure of Fluorescein from Glass Fiber Filters 9 2.9 Stability of Fluorescein Solutions over a 12 Day Period 10 2.10 Removal of Fluorescein from Test Tubes during Washing 10 2.11 Measured vs Calculated Amount of Penetration through Two Aerosol
1. Excitation and emission spectrum of fluorescein obtained using a spectrofluorometer 3
2. Excitation, emission, and fluorescein intensity graph 3
3. Fluoroescence intensity measurements as a function of fluorescein concentration 6
4. Normalized fluorescence intensity measurements as a function of pH 7
5. Normalized emission spectra of a pH 9.8 and a pH 7 solution 8
6. Normalized fluorescence intensity measurements of fluorescein removed from filters and fluorescein added to the solution 9
7. Fluorescence intensity measurements of nine samples over a 12 day period 11
8. Normalized fluorescence intensity measurements of original and wash solutions 11
9. Aerosol transport tube experimental setup and sampling line orientation for penetration efficiency tests 12
TABLES
1. Fluorescence comparison of six distilled deionized water filled test tubes (diameter = 10 mm, length = 75 mm) 4
2. Fluorometer reading range (counts) at each gain setting for two different sized test tubes at random orientation 5
3. The range of fluorometer readings at each gain setting for two different size test tubes aligned in the fluorometer 5
4. Measured and calculated (Deposition, version 4.0, McFarland 1996) aerosol transmission efficiencies through two aerosol transport tubes 13
USE OF FLUORESCEIN IN AEROSOL STUDIES
1. INTRODUCTION
Many aerosol studies require well defined aerosols that have suitable chemical and physical properties for the particular purpose of the experiment. Fluorescein has been used as a tracer in aerosol studies for detection and quantification of aerosols. Small quantities of fluorescein can be detected in samples due to the extreme sensitivity of fluorometry and the large fluorescent cross section of fluorescein. For example, fluorometry has been used in research studies to determine uranium in air, soil, and biological materials (Lodge 1988), and to determine the collection efficiency of filters and samplers (McFarland et al., 1987). There are many factors that affect fluorometry: intensity and wavelength of primary light, band width of excitation and emission filters used in the fluorometer, and the pH of the sample (Lodge 1988). The disadvantage of fluorometry is that it is non-specific and the fluorescence of many compounds fades very rapidly (Lodge 1988).
Fluorescence is shown by organic compounds that have conjugated double bonds (alternating single and double bonds). These compounds emit longer wavelength light when excited by a radiation source of appropriate higher energy or shorter wavelength (Lodge 1988). The emitted light is of longer wavelength because energy is lost in the internal transitions of the molecule. At low fluorescein concentrations, the emitted light is proportional to the concentration of the compound.
Many forms of fluorescein have been used by researchers: fluorescein, sodium fluorescein (uranine) (Lodge 1988), and ammonium fluorescein (Stober and Flachsbart 1973). Uranine particles are hygroscopic while ammonium fluorescein particles are not. However, hygroscopicity is of little consequence when fluorescein is used as a tracer in oil droplets, which is the most common contemporary application in aerosol applications of fluorescein. One advantage of using oil droplets is that they do not bounce when they impact or settle on surfaces. Therefore, fluorescein tagged oil droplets are used in studies where there should be no particle bounce.
Fluorescein tagged particles have been used in studies for a long time. The use of fluorescein tagged aerosol in tests as a meteorological tracer was reported by Robinson et al. (1959). In this study, uranine was aerosolized for field tracer tests by spraying a solution of the dye into the air using a specially designed nozzle and high pressure air from a field compressor. The analysis of the fluorescein sample was conducted using a fluorescence meter. Since then fluorescein tagged aerosols have been used by many researchers. Burgess et al. (1961) used uranine aerosol to test respirator performance and following this, the use of fluorescein in evaluation of respirator performance was adapted by the Bureau of Mines (Ferber 1966). Schulz et al. (1960) used uranine to measure stack emissions. Stein et al. (1966) measured the density of uranine aerosol particles so that they can be used to calibrate an aerosol spectrometer. Stober and Flachsbart (1973) evaluated ammonium fluorescein as a laboratory test aerosol. Fluorescein tagged aerosols were used by Chandra and McFarland (1997) in wind tunnels to evaluate inlets
In experimental work, fluorescein tagged aerosols are sampled onto filters. The fluorescein is then transferred to a solution and a fluorometer is used to analyze the fluorescence intensity (FI) of the solution. The objective of this study was to confirm that the procedure used to recover and detect fluorescein from filters is accurate. Finally, penetration efficiencies of two aerosol transport tubes were experimentally determined and compared to theoretical predictions using Deposition, version 4.0 (McFarland 1996).
EXPERIMENTAL METHODS, RESULTS AND DISCUSSION
2.L Optimum Excitation and Emission Wavelengths for Fluorescein
This test was conducted to determine the optimum excitation wavelength of a fluorescein sample (Chemical Abstracts Registry No. CAS-518-47-8, Acros Organics, NJ) and its corresponding emission spectrum.
For most materials the optimum excitation wavelength is equal to the highest UV absorption wavelength. In our study, the fluorescein's UV absorption spectrum was obtained using a spectrophotometer (Model DU 7400, Beckman Instruments, Inc., Fullerton, CA). The wavelength with the highest UV absorption was used to excite a fluorescein sample in a spectrofluorometer (Spex Fluorolog-2, Spex Industries, Inc., Edison, NJ) to obtain the emission spectrum. To confirm the excitation wavelength, the wavelength of the emission peak was recorded for a range of excitation wavelengths to determine the optimum excitation wavelength of fluorescein using the spectrofluorometer. In addition, the spectrofluorometer was used to measure emission spectra for a range of excitation wavelengths to construct a 3D excitation, emission, and FI graph.
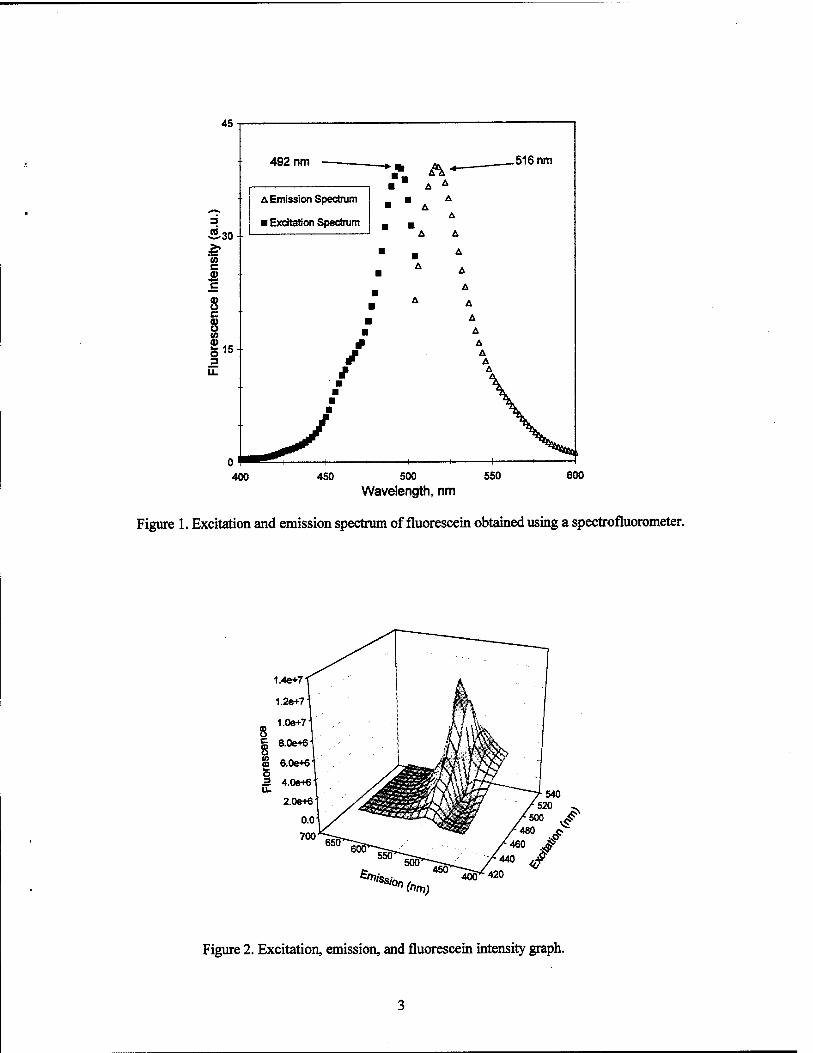
Figure 1 shows excitation and emission spectra. From Figure 1, it is clear that the fluorescein samples should be excited using a wavelength of 492 nm and the filters should be installed to capture the emission peak of 516 nm. The fluorometer (Sequoia - Turner Fluorometer, Model 450) uses a narrow band excitation filter NB490 and a short cut emission filter SC515 to optimally excite the sample and to capture the emission.
Figure 2 shows emission spectra as a function of excitation wavelengths. From this 3D graph, it is clear that for fluorescein samples there is an optimum excitation wavelength range, and an optimum emission wavelength range.
The fluorometer (Sequoia - Turner Fluorometer, Model 450) operating manual (Barnstead/ Thermolyne Corporation 1996) suggests that ordinary borosilicate glass tubes may be used as sample containers when excitation and emission wavelengths are above 320 nm. Synthetic silica cells are recommended by the manufacturer to transmit lower excitation wavelengths. Hence for our experiments we chose the less expensive borosilicate glass test tubes.
2.2. The Use of Different Test Tubes
In our laboratory, test tubes were discarded after each use. Therefore, an experiment was conducted to determine the variation in FI measurements due to the use of different test tubes. Six test tubes (10 mm diameter, 75 mm long) were filled with deionized water and fluorescence was measured with the fluorometer at gain settings of 1, 5,10, 50,200, and 1000. The test tube with the lowest reading was taken as the reference sample and the fluorometer was zeroed with that test tube. A separate zeroing at each gain setting was found to be necessary. FI measurements of all 5 test tubes were recorded. Table I shows the measurement range of the five test tubes.
400 450 500 550 Wavelength, nm
600
Figure 1. Excitation and emission spectrum of fluorescein obtained using a spectrofluorometer.
Figure 2. Excitation, emission, and fluorescein intensity graph.
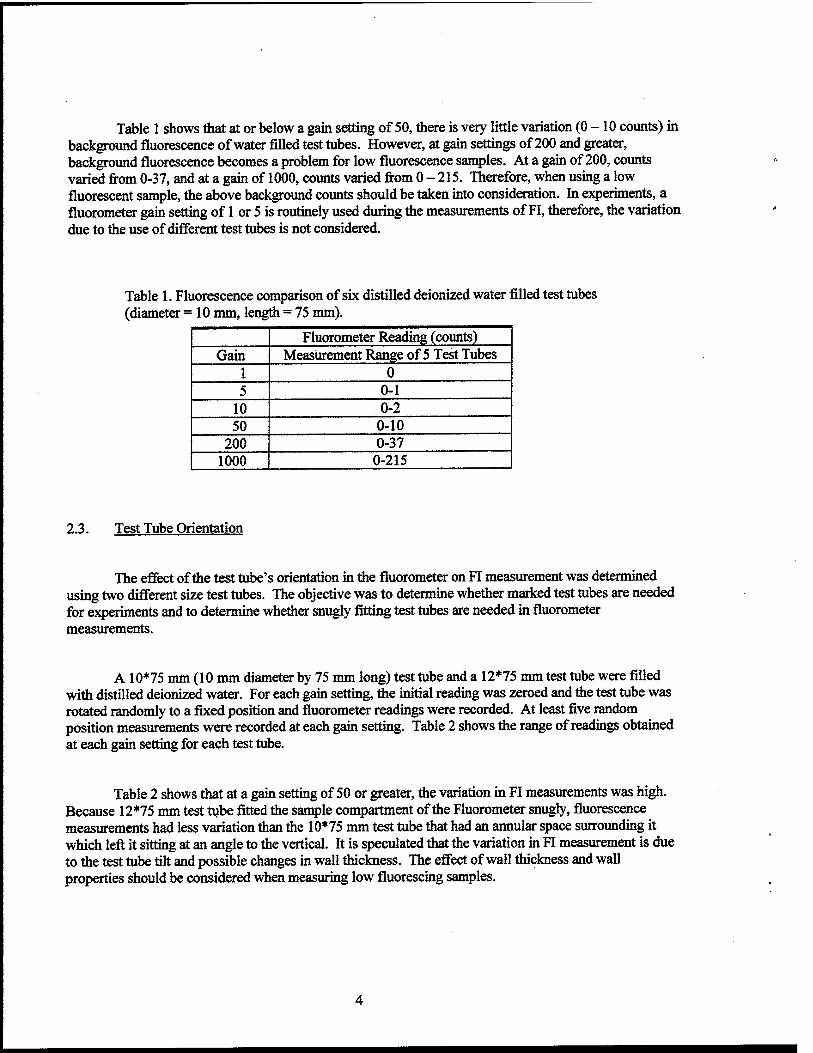
Table 1 shows that at or below a gain setting of 50, there is very little variation (0-10 counts) in background fluorescence of water filled test tubes. However, at gain settings of 200 and greater, background fluorescence becomes a problem for low fluorescence samples. At a gain of 200, counts varied from 0-37, and at a gain of 1000, counts varied from 0-215. Therefore, when using a low fluorescent sample, the above background counts should be taken into consideration. In experiments, a fluorometer gain setting of 1 or 5 is routinely used during the measurements of FI, therefore, the variation due to the use of different test tubes is not considered.
Table 1. Fluorescence comparison of six distilled deionized water filled test tubes (diameter =10 mm, length = 75 mm).
Fluorometer Reading (counts) Gain Measurement Range of 5 Test Tubes
1 0 5 0-1
10 0-2 50 0-10
200 0-37 1000 0-215
2.3. Test Tube Orientation
The effect of the test tube's orientation in the fluorometer on FI measurement was determined using two different size test tubes. The objective was to determine whether marked test tubes are needed for experiments and to determine whether snugly fitting test tubes are needed in fluorometer measurements.
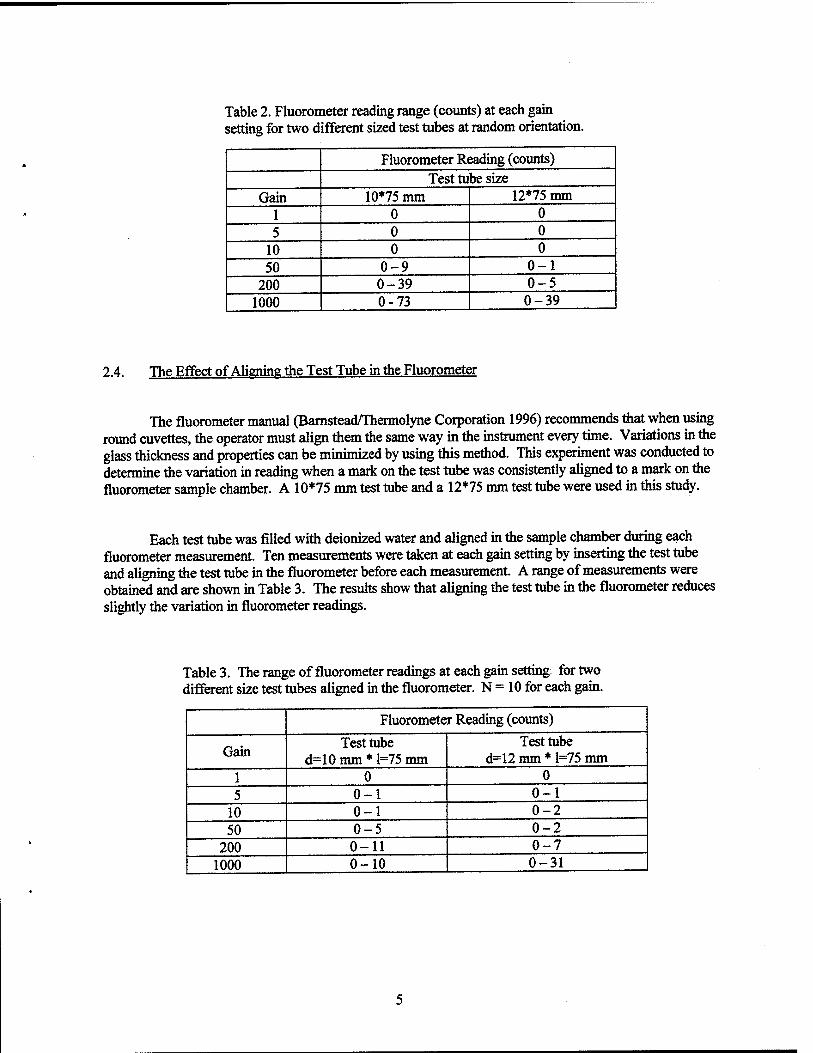
A 10*75 mm (10 mm diameter by 75 mm long) test tube and a 12*75 mm test tube were filled with distilled deionized water. For each gain setting, the initial reading was zeroed and the test tube was rotated randomly to a fixed position and fluorometer readings were recorded. At least five random position measurements were recorded at each gain setting. Table 2 shows the range of readings obtained at each gain setting for each test tube.
Table 2 shows that at a gain setting of 50 or greater, the variation in FI measurements was high. Because 12*75 mm test tube fitted the sample compartment of the Fluorometer snugly, fluorescence measurements had less variation than the 10*75 mm test tube that had an annular space surrounding it which left it sitting at an angle to the vertical. It is speculated that the variation in FI measurement is due to the test tube tilt and possible changes in wall thickness. The effect of wall thickness and wall properties should be considered when measuring low fluorescing samples.
Table 2. Fluorometer reading range (counts) at each gain setting for two different sized test tubes at random orientation.
Fluorometer Reading (counts) Test tube size
Grain 10*75 mm 12*75 mm 1 0 0 5 0 0
10 0 0 50 0-9 0-1
200 0-39 0-5 1000 0-73 0-39
2.4. The Effect of Aliening the Test Tube in the Fluorometer
The fluorometer manual (Barnstead/Thermolyne Corporation 1996) recommends that when using round cuvettes, the operator must align them the same way in the instrument every time. Variations in the glass thickness and properties can be minimized by using this method. This experiment was conducted to determine the variation in reading when a mark on the test tube was consistently aligned to a mark on the fluorometer sample chamber. A 10*75 mm test tube and a 12*75 mm test tube were used in this study.
Each test tube was filled with deionized water and aligned in the sample chamber during each fluorometer measurement. Ten measurements were taken at each gain setting by inserting the test tube and aligning the test tube in the fluorometer before each measurement. A range of measurements were obtained and are shown in Table 3. The results show that aligning the test tube in the fluorometer reduces slightly the variation in fluorometer readings.
Table 3. The range of fluorometer readings at each gain setting; for two different size test tubes aligned in the fluorometer. N = 10 for each gain.
Fluorometer Reading (counts)
Gain Test tube
d=10 mm * 1=75 mm Test tube
d=12 mm * 1=75 mm 1 0 0 5 0-1 0-1
10 0-1 0-2 50 0-5 0-2
200 0-11 0-7 1000 0-10 0-31
2.5. Linearity of the Fluorometer Readings below Fluorescence Saturation
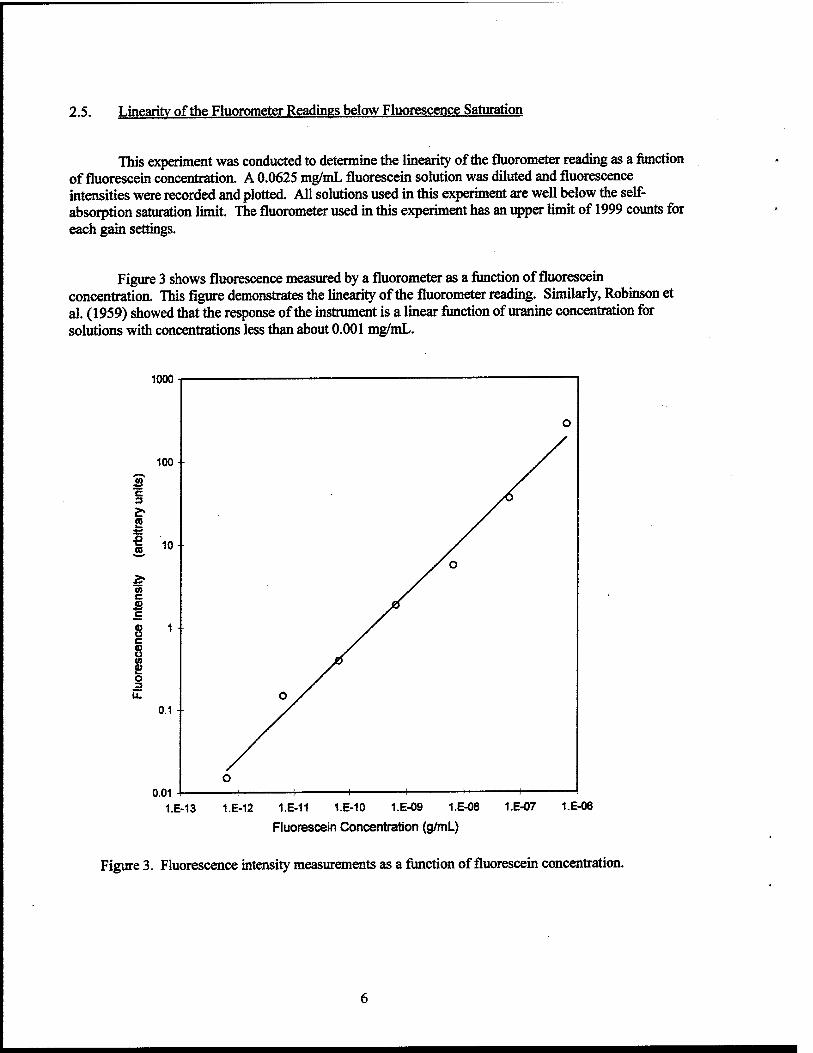
This experiment was conducted to determine the linearity of the fluorometer reading as a function of fluorescein concentration. A 0.0625 mg/mL fluorescein solution was diluted and fluorescence intensities were recorded and plotted. All solutions used in this experiment are well below the self- absorption saturation limit. The fluorometer used in this experiment has an upper limit of 1999 counts for each gain settings.
Figure 3 shows fluorescence measured by a fluorometer as a function of fluorescein concentration. This figure demonstrates the linearity of the fluorometer reading. Similarly, Robinson et al. (1959) showed that the response of the instrument is a linear function of uranine concentration for solutions with concentrations less than about 0.001 mg/mL.
1000
c
.1 (0
to c 52
8 c 8 09 2 o
0.01 1.E-13 1.E-12 1.E-11 1.E-10 1.E-09 1.E-08
Fluorescein Concentration (g/mL)
1.E-07 1.E-06
Figure 3. Fluorescence intensity measurements as a function of fluorescein concentration.
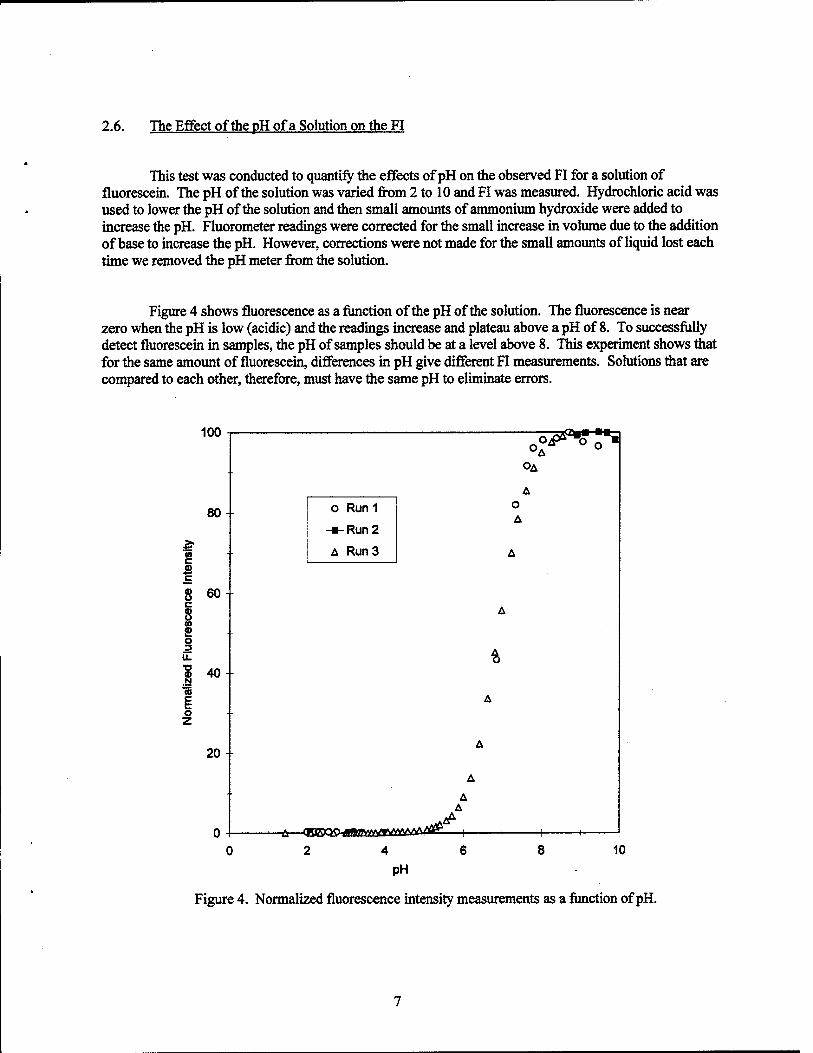
2.6. The Effect of the pH of a Solution on the FI
This test was conducted to quantify the effects of pH on the observed FI for a solution of fluorescein. The pH of the solution was varied from 2 to 10 and FI was measured. Hydrochloric acid was used to lower the pH of the solution and then small amounts of ammonium hydroxide were added to increase the pH. Fluorometer readings were corrected for the small increase in volume due to the addition of base to increase the pH. However, corrections were not made for the small amounts of liquid lost each time we removed the pH meter from the solution.
Figure 4 shows fluorescence as a function of the pH of the solution. The fluorescence is near zero when the pH is low (acidic) and the readings increase and plateau above a pH of 8. To successfully detect fluorescein in samples, the pH of samples should be at a level above 8. This experiment shows that for the same amount of fluorescein, differences in pH give different FI measurements. Solutions that are compared to each other, therefore, must have the same pH to eliminate errors.
100
80
A- CO
8 60 c 8 to £ o 3
| 40
20
^^rH OA
o Run 1
-■-Run 2
A Run 3
o A
a
A A
-A—qsBCiJ^raBasaaBÄ^Aäk *£ 10
pH
Figure 4. Normalized fluorescence intensity measurements as a function of pH.
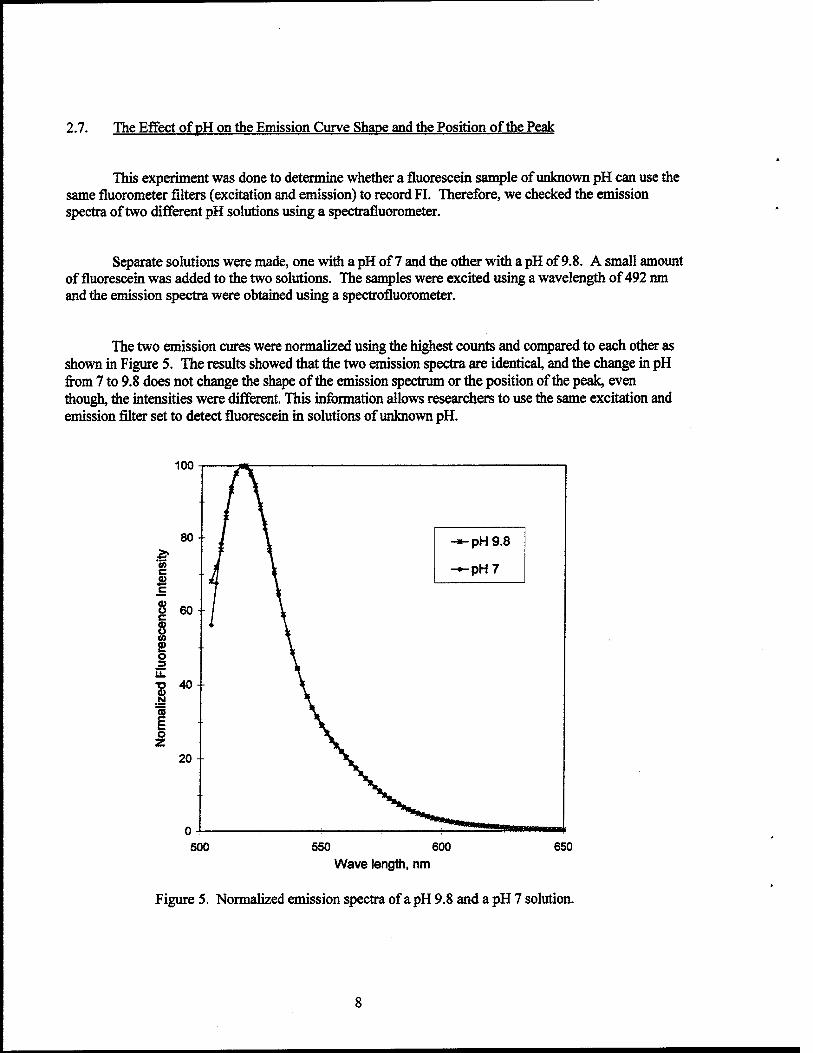
2.7. The Effect of pH on the Emission Curve Shape and the Position of the Peak
This experiment was done to determine whether a fluorescein sample of unknown pH can use the same fiuorometer filters (excitation and emission) to record FT. Therefore, we checked the emission spectra of two different pH solutions using a spectrafluorometer.
Separate solutions were made, one with a pH of 7 and the other with a pH of 9.8. A small amount of fluorescein was added to the two solutions. The samples were excited using a wavelength of 492 nm and the emission spectra were obtained using a spectrofiuorometer.
The two emission cures were normalized using the highest counts and compared to each other as shown in Figure 5. The results showed that the two emission spectra are identical, and the change in pH from 7 to 9.8 does not change the shape of the emission spectrum or the position of the peak, even though, the intensities were different. This information allows researchers to use the same excitation and emission filter set to detect fluorescein in solutions of unknown pH.
100
550 600 Wave length, nm
Figure 5. Normalized emission spectra of a pH 9.8 and a pH 7 solution.
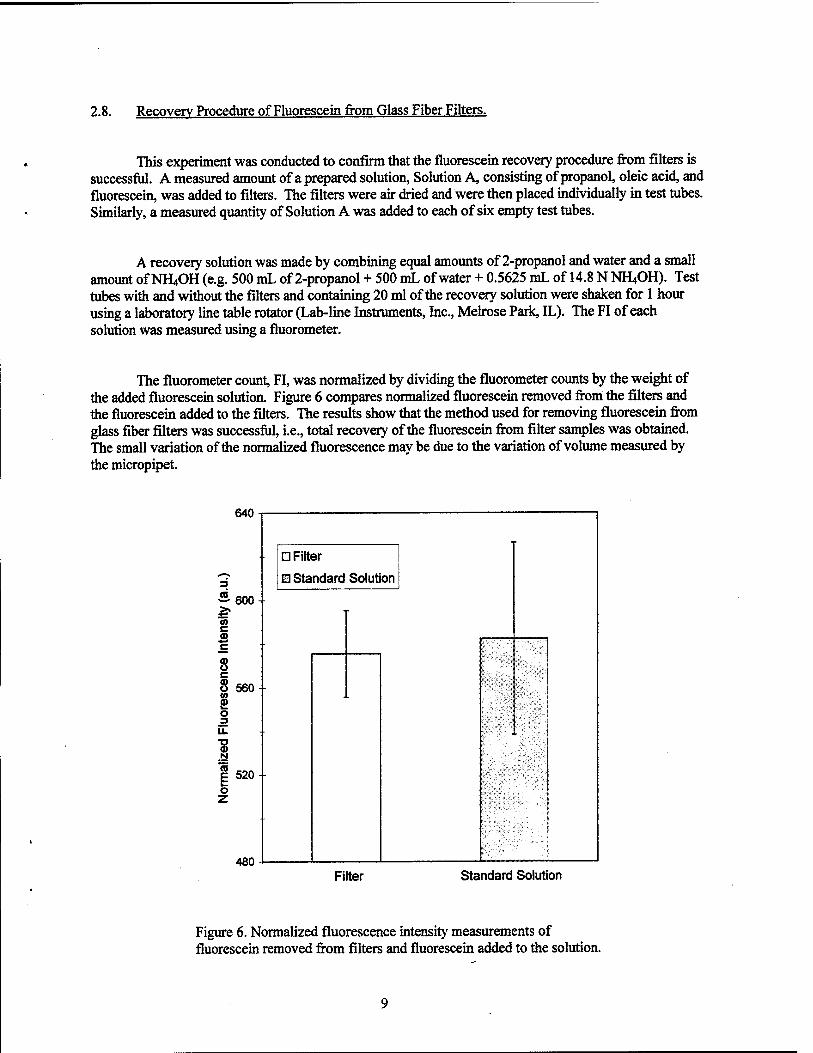
2.8. Recovery Procedure of Fluorescein from Glass Fiber Filters.
This experiment was conducted to confirm that the fluorescein recovery procedure from filters is successful. A measured amount of a prepared solution, Solution A, consisting of propanol, oleic acid, and fluorescein, was added to filters. The filters were air dried and were then placed individually in test tubes. Similarly, a measured quantity of Solution A was added to each of six empty test tubes.
A recovery solution was made by combining equal amounts of 2-propanol and water and a small amount of NH4OH (e.g. 500 mL of 2-propanol + 500 mL of water + 0.5625 mL of 14.8 N NH4OH). Test tubes with and without the filters and containing 20 ml of the recovery solution were shaken for 1 hour using a laboratory line table rotator (Lab-line Instruments, Inc., Melrose Park, IL). The FI of each solution was measured using a fluorometer.
The fluorometer count, FI, was normalized by dividing the fluorometer counts by the weight of the added fluorescein solution. Figure 6 compares normalized fluorescein removed from the filters and the fluorescein added to the filters. The results show that the method used for removing fluorescein from glass fiber filters was successful, i.e., total recovery of the fluorescein from filter samples was obtained. The small variation of the normalized fluorescence may be due to the variation of volume measured by the micropipet
04U -
D Filter
3 E Standard Solution
ensi
ty (a
C
8 c $ 560- CO CD O 3 U.
Nor
mal
ized
0
ARC\ ■
Filter Standard Solution
Figure 6. Normalized fluorescence intensity measurements of fluorescein removed from filters and fluorescein added to the solution.
Robinson et al. (1959) showed that uranine removal from filters takes only a few minutes. In this procedure, water was added to the filter, the filter remained in the solution for a few minutes, and then the liquid was taken for analysis using a fluorescence meter. They claimed a minimum detectable uranine concentration of 10"n g/mL. Stein et al. (1966) report that the fluorescence technique offers a limiting sensitivity of 10"10 g/mL.
Fluorometers use apertures with excitation and emission filters. Perhaps, greater sensitivity could be obtained by removal of diese apertures.
2.9. Stability of Fluorescein Solutions over a 12 Day Period.
In most experiments, fluorescein aerosol generation and sampling are performed within a several hour period. Yet the analysis of fluorescein collected on filters is typically done the following day. Because the literature (Lodge 1988) states that the fluorescein of many compounds fade very rapidly, this experiment was conducted to determine the stability of fluorescein over a 12 day period.
Fluorescein samples from actual tests were left in tightly covered test tubes on laboratory benches over a 12 day period and fluorometer measurements were taken during this time. The laboratory lights were turned off during nights and weekends, otherwise the samples were exposed to room light.
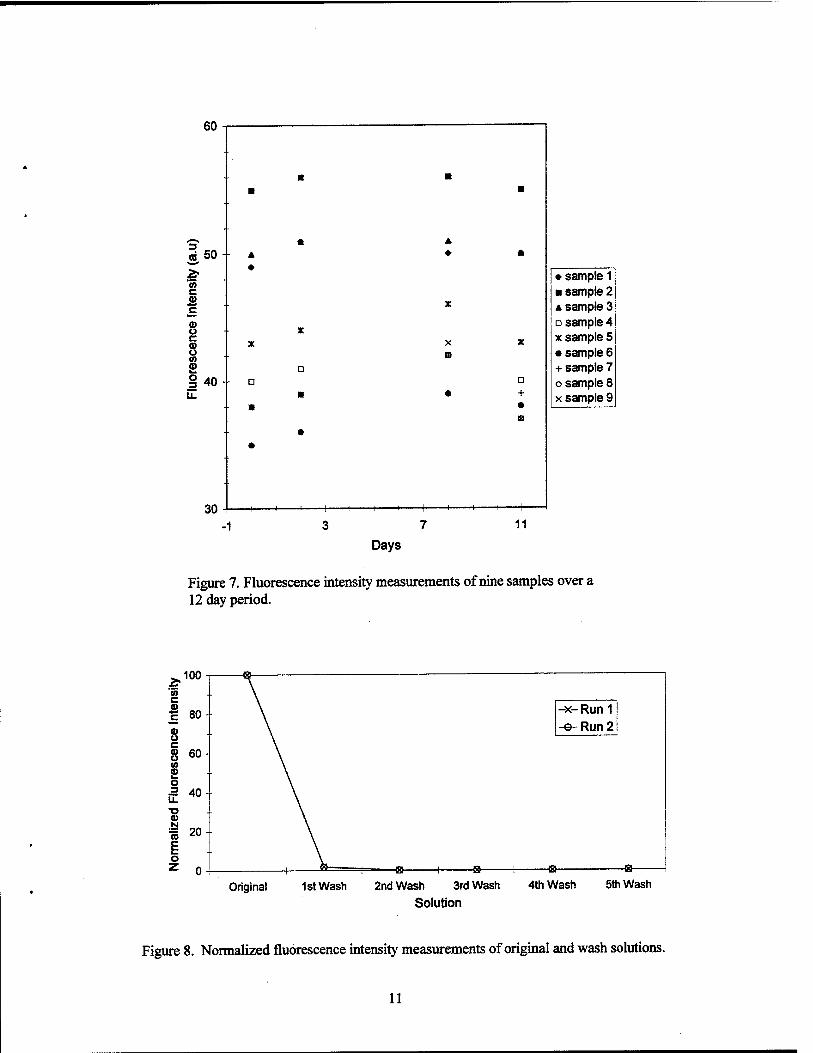
Figure 7 shows the fluorometer reading of samples over a 12 day period. Results show that the stability of the test samples over a 12 day period is excellent. The differences in fluorescence are mainly due to the zero adjustment of the instrument.
2.10. Removal of Fluorescein from Test Tubes during Washing
Because some laboratories re-use the test tubes for fluorescein studies, this experiment was conducted to determine how efficiently fluorescein can be removed from test tubes by washing.
A solution consisting 3 mL of fluorescein + oleic acid + propanol solution was put in a 10*75 mm test tube and FI was recorded. The original solution was removed and washing was conducted. Washing was done by adding 3 mL of recovery solution to the test tube, closing the open end with parafilm, and turning it upside down a few times to remove all the fluorescein from the walls of the test tube. FI measurements of the wash liquid were taken using the fluorometer. The wash procedure was repeated until the counts did not decrease with additional washing. The FI measurements were normalized by dividing the counts by the original count.
The results are shown in Figure 8. The first wash solution has less than 2.0% of the original FI measurements, and the second wash solution has less than 0.06% of the original FI measurements. Test tubes can be reused if they are washed properly. However, it is recommended that laboratories verify the background FI of the test tubes before reusing.
10
60
oj,50
& 'to c c
8 c 8 CO
s> § 40 u.
..
■ ■ ■ ■
•• * A
A ♦ *
♦ sample 1 ■ sample 2
X A sample 3 D sample 4
X X X x sample 5
0
B • sample 6 + sample 7
a D o sample 8 ■ • +
• x sample 9
R
■■ • m
1 1 1 1 1 1 1 1 1 1— —1 1
3 7
Days
11
Figure 7. Fluorescence intensity measurements of nine samples over a 12 day period.
Figure 8. Normalized fluorescence intensity measurements of original and wash solutions.
11
2.11. Measured vs Calculated Amount of Penetration through Two Aerosol Transport Tubes
2.11.1. Penetration Efficiency
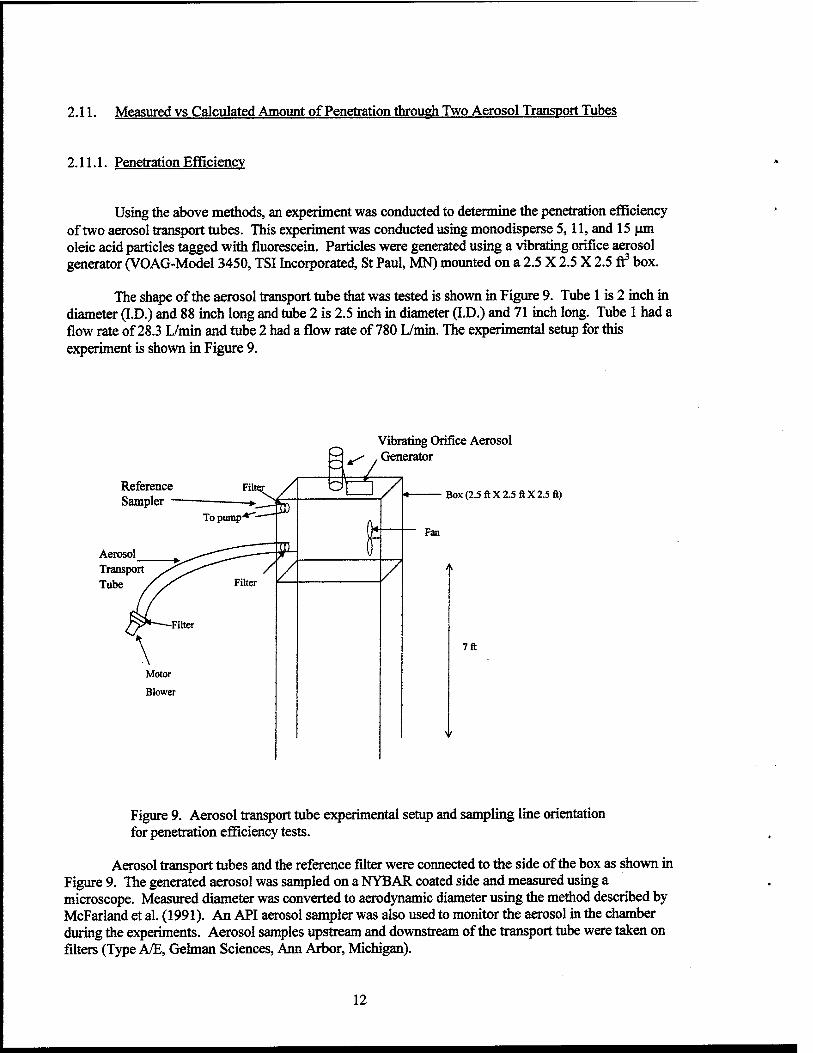
Using the above methods, an experiment was conducted to determine the penetration efficiency of two aerosol transport tubes. This experiment was conducted using monodisperse 5,11, and 15 um oleic acid particles tagged with fluorescein. Particles were generated using a vibrating orifice aerosol generator (VOAG-Model 3450, TSI Incorporated, St Paul, MN) mounted on a 2.5 X 2.5 X 2.5 ft3 box.
The shape of the aerosol transport tube that was tested is shown in Figure 9. Tube 1 is 2 inch in diameter (I.D.) and 88 inch long and tube 2 is 2.5 inch in diameter (I.D.) and 71 inch long. Tube 1 had a flow rate of 28.3 L/min and tube 2 had a flow rate of 780 L/min. The experimental setup for mis experiment is shown in Figure 9.
Reference Sampler
Aerosol Transport Tube
2 Vibrating Orifice Aerosol Generator
« Box (2.5 ft X 2.5 ft X 2.5 ft)
Fan
7ft
Figure 9. Aerosol transport tube experimental setup and sampling line orientation for penetration efficiency tests.
Aerosol transport tubes and the reference filter were connected to the side of the box as shown in Figure 9. The generated aerosol was sampled on a NYBAR coated side and measured using a microscope. Measured diameter was converted to aerodynamic diameter using the method described by McFarland et al. (1991). An API aerosol sampler was also used to monitor the aerosol in the chamber during the experiments. Aerosol samples upstream and downstream of the transport tube were taken on filters (Type A/E, Gelman Sciences, Ann Arbor, Michigan).
12
These filtere were put into measured amounts of recovery solution and were shaken on a table rotator for 1 hr. The amount of fluorescein intensity in the solution was measured using a fluorometer. A gain setting of 1 or 5 on the fluorometer was used in all experiments. Penetration efficiency was determined by sampling upstream (Q,) and downstream (CA,) of the aerosol transport tubes. A reference filter was used to measure the actual aerosol concentration in the chamber. Relative particle concentration values C for the filters were calculated using
C = Eh. QJ
(i)
where F is the fluorometer reading, VL is the volume of the solution, QA is the sampling volumetric flow rate, and t is the sampling time. Transmission efficiency, T, is given by the following equation.
T = -'dn *100 (2) UP
The calculation program, Deposition version 4.0 (McFarland 1996), does not allow continuous change in angle, therefore, the program assumed three components: (1) a straight tube 8° to horizontal (inlet high), (2) a 37° bend, and (3) a straight tube 45° to the horizontal (outlet low).
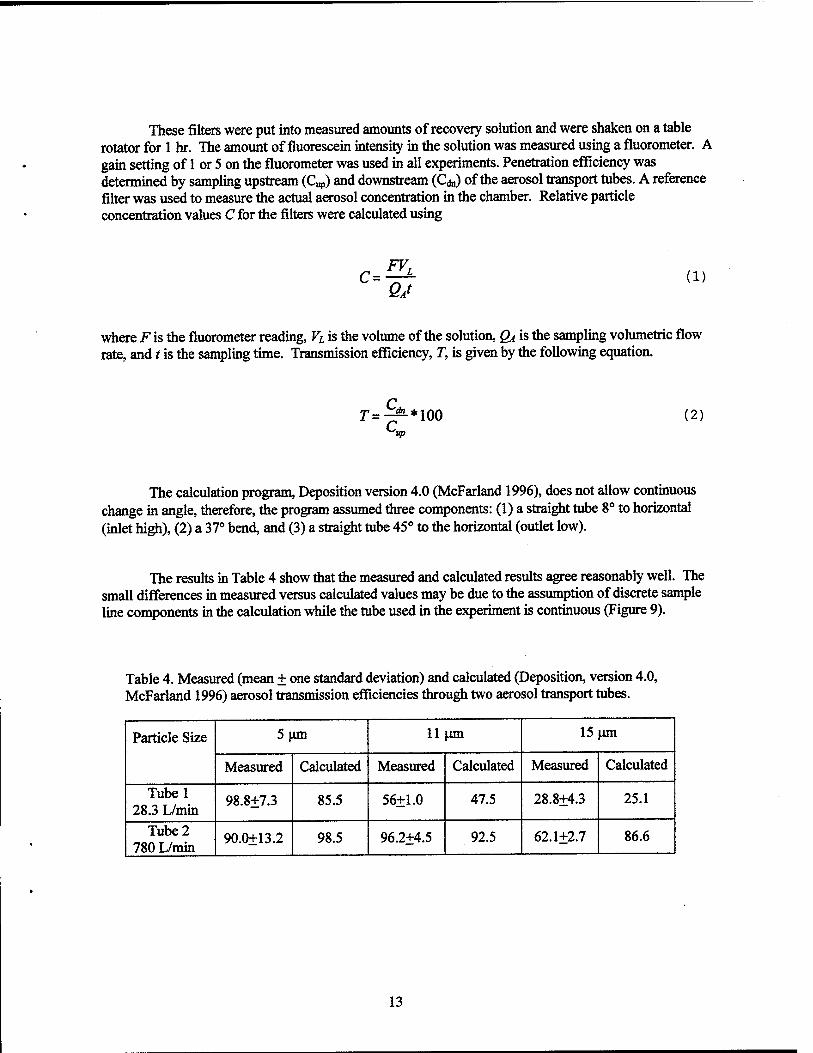
The results in Table 4 show that the measured and calculated results agree reasonably well. The small differences in measured versus calculated values may be due to the assumption of discrete sample line components in the calculation while the tube used in the experiment is continuous (Figure 9).
Table 4. Measured (mean + one standard deviation) and calculated (Deposition, version 4.0, McFarland 1996) aerosol transmission efficiencies through two aerosol transport tubes.
Describing and analyzing uncertainties in single sample experiments are given by Kline and McClintock (1953) and used in a study by Chandra and McFarland (1997).
In our study, particle concentration is determined by equation 1. The uncertainty interval related to particle concentration measurements as given by Kline and McClintock would then be given by the following equation.
■e(C) S(F) e\VL) e2(QJ e2(t)
where e denotes the uncertainty in the parameter within the parenthesis.
The independent variables are fluorometer readings (F), solution volume (V£), volumetric flowrate of air QA, and time /. The relative uncertainty in these parameters are estimated to be 0.2%, 0.2%, 2.3%, and 2.8% respectively. Using these values in equation 3, the uncertainty related to particle concentration is estimated to be + 3.7%.
The transmission ratio is calculated using Equation 2. The uncertainty related to transmission ratio following the works of Kline and McClintock is given by the following equation. The overall error in transmission efficiency is estimated to be 5.2%.
«n.ÄiÄ (4)
3. CONCLUSIONS
Our tests confirmed that the procedures used for recovering and quantifying fluorescein from filters is acceptable. Using the confirmed procedure, our studies showed reasonable agreement between the experimentally determined penetration efficiency through two tubes and the amount predicted by the McFarland (1996) model, Deposition, version 4.0.
Our results showed the following:
(1) The optimum excitation and emission wavelengths for fluorescein are 492 and 516 nm respectively.
14
(2) For fluorescence intensity (FI) measurements to be accurate, the FI of a sample has to be significantly higher than the FI of water filled test tubes.
(3) At high gain settings, changes in test tube orientation can affect the FI measurement of low fluorescence material.
(4) Consistent alignment of the test tube in the fluorometer reduces the variation in FI measurements.
(5) Below the self-absorption limit, the fluorometer readings increase linearly with increasing fluorescein concentrations.
(6) After the pH of the recovery solution has reached 8, there is no significant effect on FI measurements for further increase in pH.
(7) The change in pH does not affect the shape or the position of the peak of the emission spectrum.
(8) Our procedure fully recovers fluorescein from glass fiber filters.
(9) Fluorescein samples prepared for fluorometer measurements were stable over at least a 12 day period.
(10) Test tubes can be reused if they are washed properly.
2. Burgess, W. A., Silverman, L., and Stein, F. (1961). A new technique for evaluating respirator performance, Industrial Hygiene Journal. 22:422-429.
3. Chandra, S. and McFarland, A. R. (1997). Shrouded probe performance: variable flow operation and effect of free stream turbulence, Aerosol Science and Technology. 26:111-126.
4. Ferber, B. I. (1966). Bureau of mines respirator approval schedules: new and revised, American Industrial Hygiene Association Journal. 27:110-114.
5. Kline, S. J. and McClintock, F. A. (1953). Describing uncertainties in single-sample experiments, MechEng. 3-8.
6. Lodge, J. (1988). Fluorescence Spectrophotometry, Methods of air sampling and analysis, Third edition: Lewis Publishers, New York. pp. 187-190.
7. McFarland, A., Hickman, P., and Pamell, C. (1987). A new cotton dust sampler for PM-10 aerosol, Am.Ind.Hyg.AssocJ. 48:293-297.
8. McFarland, A. R.Q996). Deposition version 4.0, Texas A&M University, College Station, TX
9. McFarland, A. R, Bethel, E. L., Ortiz, C. A., and Stanke, J. G. (1991). A CAM sampler for collecting and assessing a-emitting aerosol particles, Health Phys. 61:97-103.
10. Robinson, E., MacLeod, J. A., and Lapple, C. E. (1959). A meteorological tracer technique using uranine dye, J.Meteor. 16:63-67.
11. Schulz, E. J., Duffee, R. A., and Ungar, E. W. (1960). A tracer technique to measure deposition of stack emissions, Industrial Hygiene Journal. 21:343-349.
12. Stein, F., Esmen, N., and Corn, M. (1966). The density of uranine aerosol particles, American Industrial Hygiene Association Journal. 27:428-430.
13. Stober, W. and Flachsbart, H. (1973). An evaluation of nebulized ammonium fluorescein as a laboratory aerosol, Atmospheric Environment. 7:737-748.


![(Leido) AEROSOL DYMAMICS, LABORATORY AND ON-ROAD STUDIES [8]](https://static.documents.pub/doc/80x56/577d2bbc1a28ab4e1eab479d/leido-aerosol-dymamics-laboratory-and-on-road-studies-8.jpg)


