Vol. 57 JOURNAL OF THE OPTICAL SOCIETY OF AMERICA VOLUME 57, NUMBER 11 NOVEMBER 1967 Use of Laser Radiation in the Calibration of Spectrometer Scanning Functions* Louis SICA Laboratory of Astrophysics and Physical Meteorology, The Johns Hopkins University, Baltimore, Maryland 21218 (Received 28 January 1967) The dependence of the spectrometer scanning function on the spatial coherence of the illumination at the entrance slit implies that the spatial coherence of laser radiation must be degraded before its narrow spectral bandwith can be used to advantage in scanning-function calibration. A conventional incoherent source can be simulated by using a source having a relatively large correlation interval, provided that its correlation function has a favorable form. Partial-coherence theory is used to obtain conditions on the correlation function resulting from the properties of Globar radiation. The correlation function at a spectrom- eter entrance slit is experimentally determined using a method described by Beran and Parrent. The results for an incoherent Hg source are in agreement with Hopkins's concept of an effective source. Results using laser light reflected from an integrating sphere indicate that such a source may be used interchangeably with an ordinary incoherent source for scanning-function calibration. INDEX HEADINGS: Laser; Spectrometer; Fourier transform; Infrared; Coherence; Integrating sphere; Source. T HE spectrometer scanning function may be de- function. Provided that this function is known and that 1 fined as the power output of the instrument vs there are suitable restrictions on the relative widths of the nominal wavelength setting for a fixed-input spec- the convolved functions, the convolution integral may trum of negligible bandwidth. When the input spec- be solved and the original signal recovered with very trum has a finite bandwidth, the output signal is the little distortion.' convolution of the input spectrum anld the scanning The form of the modulation-transfer function, on * Research sponsored by Office of Naval Research, Contract which the scanning function depends when the slit is Nonr 4010(14), and by Air Force Cambridge Research Labora- I Hajime Sakai, Dissertation, The Johns Hopkins University, tories, Office of Aerospace Research, Contract AF 19(628)-4971. (1963).
Transcript
Vol. 57
JOURNAL OF THE OPTICAL SOCIETY OF AMERICA VOLUME 57, NUMBER 11 NOVEMBER 1967
Use of Laser Radiation in the Calibration of Spectrometer Scanning Functions*
Louis SICALaboratory of Astrophysics and Physical Meteorology, The Johns Hopkins University,
Baltimore, Maryland 21218(Received 28 January 1967)
The dependence of the spectrometer scanning function on the spatial coherence of the illumination atthe entrance slit implies that the spatial coherence of laser radiation must be degraded before its narrowspectral bandwith can be used to advantage in scanning-function calibration. A conventional incoherentsource can be simulated by using a source having a relatively large correlation interval, provided that itscorrelation function has a favorable form. Partial-coherence theory is used to obtain conditions on thecorrelation function resulting from the properties of Globar radiation. The correlation function at a spectrom-eter entrance slit is experimentally determined using a method described by Beran and Parrent. The resultsfor an incoherent Hg source are in agreement with Hopkins's concept of an effective source. Results usinglaser light reflected from an integrating sphere indicate that such a source may be used interchangeablywith an ordinary incoherent source for scanning-function calibration.INDEX HEADINGS: Laser; Spectrometer; Fourier transform; Infrared; Coherence; Integrating sphere;Source.
T HE spectrometer scanning function may be de- function. Provided that this function is known and that1 fined as the power output of the instrument vs there are suitable restrictions on the relative widths of
the nominal wavelength setting for a fixed-input spec- the convolved functions, the convolution integral maytrum of negligible bandwidth. When the input spec- be solved and the original signal recovered with verytrum has a finite bandwidth, the output signal is the little distortion.'convolution of the input spectrum anld the scanning The form of the modulation-transfer function, on
* Research sponsored by Office of Naval Research, Contract which the scanning function depends when the slit isNonr 4010(14), and by Air Force Cambridge Research Labora- I Hajime Sakai, Dissertation, The Johns Hopkins University,tories, Office of Aerospace Research, Contract AF 19(628)-4971. (1963).
LASER USE FOR CALCULATING SPECTROMETER
incoherently illuminated, and the form of the slitimage under other conditions of illumination have beencalculated by various workers for several ideal cases. 2'-Recently, Sakai has calculated the transform of a slitimage in the general partially-coherent perfect-opticscase and has verified it experimentally. 7 Experimentaldetermination of the scanning function of each spec-trometer is necessary for the processing of data fromit, since aberrations and grating imperfections uniqueto each instrument are commonly present. This deter-mination may be carried out if a line of known shapeor infinitesimal width is available.",8 It has also beenshown that the complete transfer function may beobtained at any wavelength setting by using an inter-ferometric spectrometer with resolution equal to thatof the monochromator. 9
With the advent of laser transitions over wideregions of the infrared spectrum, it is useful to considerthe question of whether a simple method can be foundto exploit the narrow spectral bandwidth of this radia-tion in the calibration of infrared scanning functions.Although some workers have obtained information onthe scanning function by simply illuminating the spec-trometer entrance slit with a collimated laser beam,10this method yields a correct result only in the limit ofa slit width which is negligibly small compared to thewidth of the diffraction pattern of the source optics.Sakai's curves7 show that for a range of larger slitwidths, errors in the image transform exceeding 20%may occur in the use of this method.
Thus, in order to use laser radiation to calibratespectrometer scanning functions it is necessary toduplicate, at the entrance slit, the spatial coherencecharacteristics of radiation derived originally from anincoherent source. Theoretical and experimental workto this end is the subject of this article. In the theo-retical section, the relevant formulations from theliterature of partial-coherence theory are presentedalong with certain new results to provide a unifiedtreatment and facilitate experimental solution of theproblem. The experimental section reports the con-firmation of the most important theoretical conclusions.
THEORY
Spectrometer Scanning Function
The scanning function of a spectrometer arises fromthe convolution of the entrance-slit image with the
2 E. Marchand and R. Phillips, Appl. Opt. 2, 359 (1963).A. M. Goodbody, Proc. Phys. Soc. (London) 72, 411 (1958).R. Barakat, J. Opt. Soc. Am. 54, 38 (1964).
5G. H. Godfrey, Australian S. Sci. Res. 1, 1 (1948).P P. H. van Cittert, Z. Physik 65, 547 (1930).
'Hajime Sakai, Japan. J. Appl. Phys. 4, Suppl. 1, 308 (1965).8 W. J. Herget, W. E. Deeds, N. M. Gailar, R. J. Lovell, and
A. H. Nielsen, J. Opt. Soc. Am. 52, 1113 (1962).9 Hajime Sakai and G. A. Vanasse, J. Opt. Soc. Am. 56, 357
(1966).1 0L. Delbouille and G. Roland, J. Opt. Soc. Am. 56, 547A
(1966).
exit-slit transmittance function. The transfer functionor Fourier transform of the scanning function is thusthe product of the image transform and a sinc (i.e.,sinx/x) function. Using the notation of Beran andParrent," the slit-image transform may be calculatedin terms of the pupil function and the mutual powerspectrum at the exit-pupil'2 ' 3 as
In this equation, P denotes the pupil function, i., de-notes the spatial dependence of the mutual powerspectrum on the exit-pupil reference sphere, z. and z,are the usual rectangular coordinates in the exit-pupilplane,1 4 and the tilde denotes Fourier transformationwith respect to space coordinates. I(zI) is of the sameform as the incoherent frequency response of the sys-tem except for ,o, which acts as a weighting functionfor integration over the pupil. Totally coherent orpartially coherent illumination of the slit causes P. todepend on z. and z1 as well as on zr', while if the slit isincoherently illuminated, the van Cittert-Zernike theo-rem15 shows that IX is aplanatic and depends only onzo'. In the latter case P., which is then a sinc function,factors out of the integral and the system is linear.
Equation (1) shows that the effect on the transferfunction of the slit and its mode of illumination maybe studied independently of the imaging system bymaking measurements of the irradiance in the entrancepupil. This greatly facilitates the experimental studyof the proper illumination of the slit with laser-derivedradiation. Before considering the exact criteria forcorrect illumination of the slit, we derive a facilitatingcondition for simulation of an incoherent source usinga partially coherent laser-derived source.
Mutual Power Spectrum in the Image of aBroad, Partially Coherent Source
The degrading effects on the spatial coherence oflaser radiation due to transmission or reflection at arough rotating surface are well known.'s'1 It is ap-parent, however, that a radiation source made byallowing a laser beam to impinge on rotating groundglass, for instance, is only partially incoherent; it hasa correlation interval dependent on the grain size of
NM. J. Beran and G. B. Parrent, Jr., Thieory of Partial Cohler-ence (Prentice-Hall, Inc., Englewood Cliffs, New Jersey, 1964).
'W. H. Steel, Proc. Roy. Soc. (London) A249, 574 (1959).13 G. L. Rogers, Proc. Phys. Soc. (London) 81, Pt. 2. 323
(1963).14 H. H. Hopkins, Proc. Phys. Soc. (London) B69, Pt. 5, 562
(1956).15 I. Boris and E. WNolf, Principles of Opdics (Pergamon Press1
Inc., New York, 1964), 2nd ed., p. 510.16 M. V. R. K. Mnrty, J. Opt. Soc. Anm. 54, 1187 (1964).17 W. Martienssen and E. Spiller, Am. J. Phys. 32, 919 (1964).18 P. S. Considine, J. Opt. Soc. Am. 56, 1001 (1966).
1367November 1967
L368LOUIS SICA
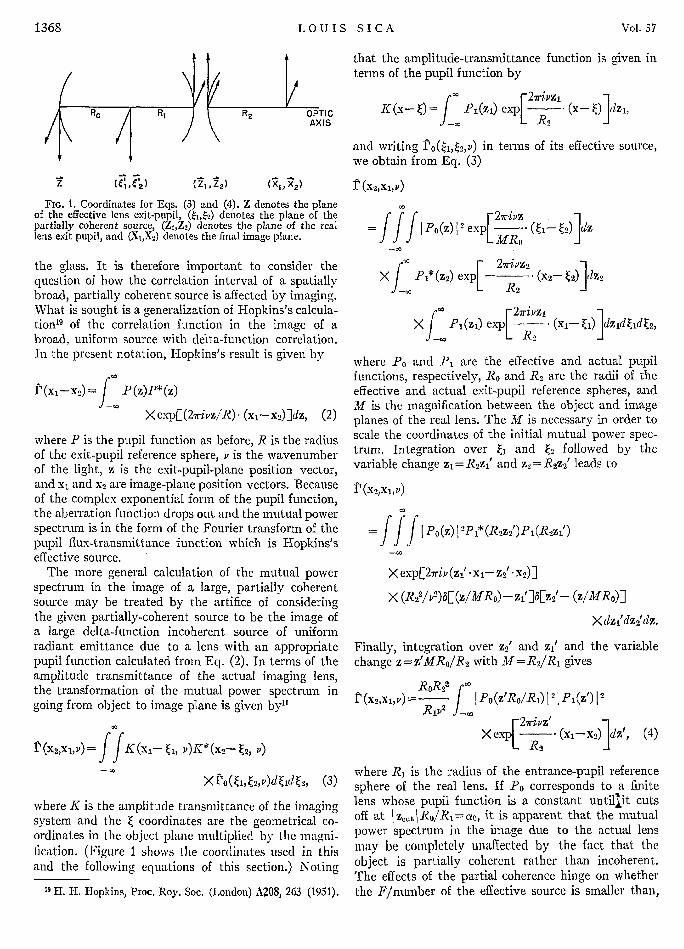
FIG. 1. Coordinates for Eqs. (3) and (4). Z denotes the planeof the effective lens exit-pupil, (%,#2) denotes the plane of thepartially coherent source, (Zl,ZA) denotes the plane of the reallens exit pupil, and (X,,X 2) denotes the final image plane.
the glass. It is therefore important to consider thequestion of how the correlation interval of a spatiallybroad, partially coherent source is affected by imaging.What is sought is a generalization of Hopkins's calcula-tion' 9 of the correlation function in the image of abroad, uniform source with delta-function correlation.In the present notation, Hopkins's result is given by
(XI- X2)= P(z)P*(z)
Xexp[(2,7rivz/R)- (X1-x2)]dz, (2)
where P is the pupil function as before, R is the radiusof the exit-pupil reference sphere, v is the wavenumberof the light, z is the exit-pupil-plane position vector,and xi and x2 are image-plane position vectors. Becauseof the complex exponential form of the pupil function,the aberration function drops out and the mutual powerspectrum is in the form of the Fourier transform of thepupil flux-transmittance function which is Hopkins'seffective source.
The more general calculation of the mutual powerspectrum in the image of a large, partially coherentsource may be treated by the artifice of consideringthe given partially-coherent source to be the image ofa large delta-function incoherent source of uniformradiant emittance due to a lens with an appropriatepupil function calculated from Eq. (2). In terms of theamplitude transmittance of the actual imaging lens,the transformation of the mutual power spectrum ingoing from object to image plane is given by"
fr(X2,X1,V)=JK (xQ1-0 V)K* (X2- 2, V)
XPO(kl,(2,lr)dkidE2, (3)
where K is the amplitude transmittance of the imagingsystem and the t coordinates are the geometrical co-ordinates in the object plane multiplied by the magni-fication. (Figure 1 shows the coordinates used in thisand the following equations of this section.) Noting
1" H. H. Hopkins, Proc. Roy. Soc. (London) A208, 263 (1951).
that the amplitude-transmittance function is given interms of the pupil function by
F 2riplz 1K(x-)=A Pl(zi) exp - - (x - 0 dzl,
and writing PO%,(2,1) in terms of its effective source,we obtain from Eq. (3)
P(x2,x 1,V)
r r r 27rivz- J IPo(z) | 2 exp [ R*. (ri- 2)
- 27rivz2x PI* (Z2) eXP - *_(X2-02) dZ2
oo -271>ipzlX f Pi(z,) exp[ (xi-ki) dzldkldk2,
where P0 and P1 are the effective and actual pupilfunctions, respectively, Ro and R2 are the radii of theeffective and actual exit-pupil reference spheres, andM is the magnification between the object and imageplanes of the real lens. The M is necessary in order toscale the coordinates of the initial mutual power spec-trum. Integration over 0i and 02 followed by thevariable change zi=R2z,' and z2=R2 z2 ' leads to
f' (x2,X1,V)
- fJfI Po (z) 12 p * (R2z,')Pd (R2zl')
X exp[27rip (z1 ' * XIn Z2' * X2 )]
X (R 22 /V2)3[(z/MRo)-zl']8[Z2'- (Z/MRo)]
X dzi'dz2ldz.
Finally, integration over Z2' and z1' and the variablechange z= z'MRo/R2 with M = R2/R, gives
RoR2 2 rP (x2,x1,v) j_ I PO(z'Ro/R1) 121 P,(z') 12
Pi1p2 _
27rivZ' 1
Xexp .(xl-x 2 ) dz', (4)
where R, is the radius of the entrance-pupil referencesphere of the real lens. If Po corresponds to a finitelens whose pupil function is a constant untiljit cutsoff at 1zIUtPRo/Ri==ao, it is apparent that the mutualpower spectrum in the image due to the actual lensmay be completely unaffected by the fact that theobject is partially coherent rather than incoherent.The effects of the partial coherence hinge on whetherthe F/number of the effective source is smaller than,
1368 Vol. 57
r LASER USS FOR CALCULATING SPgCTROMETER
greater than, or equal to that of the source optics atits entrance pupil and whether the effective source isuniform. It is apparent, therefore, that the simulationof an incoherent source does not require degradation ofthe spatial coherence of laser radiation to the extentthat it is completely equivalent to that of an incoherentsource.
Consequences of Properties of Globar Sources
It has been shown by Beran and Parrent2" that theterm incoherence is appropriate to designate a correla-tion interval of the order of a wavelength at the surfaceof a source together with an associated nonzero angulardistribution over a solid angle of 2-7r steradians. Theexact form of the correlation function and relatedangular distribution may vary with the source.
It is convenient to simulate the coherence propertiesof a Globar source for two reasons: The radiance isconstant over angular aperture sizes commonly foundin infrared spectrometers, and the image is much largerthan a diffraction pattern and has uniform radiantemittance. These conditions enable Hopkins's effective-source construction to be applied, with the result thatthe mutual power spectrum in the interior of theimage is aplanatic. It follows that the expression forthe mutual power spectrum at the entrance-pupilreference sphere of the spectrometer collimator maybe written
r(LV~w)= PV O(tl- t2)g(t1)9(k2)
XexPE27riv(1-i(-12-t2)dtdt2, (5)
where g(t) denotes the slit-amplitude transmittance,which is 1 in the opening and 0 elsewhere, and 1 equalsz/R, where R is the radius of the entrance-pupil refer-ence sphere and z specifies coordinates in the pupilplane as before. The amplitude-transmittance functionfrom points in the slit plane to points on the referencesphere is given by exp(2irivl- k) in the small-angleapproximation. If the g's specify a rectangular apertureof half-width s and half-height w, we may integrateEq. (5) and obtain
2w 2a
'(1 1,12 )= f f 2(s- I z/2)J -2w -2s
X sinc[27r(s- I |/2) (lZ.h12z)
X2(w- I [,j /2) sinc[27rv(w- I S,I /2)(I1I-12y)]
Xf'o(iz,~,) exp[7riP,,(11.+12x)]
X expE7ri_ _(_l_,+12__)]d__d__. (6)
20 M. Beran and G. B. Parrent, Jr., Nuovo Cimento 27, 1049(1963a).
As the aperture dimensions become large compared tothe correlation interval determined by Po(ixy) wehave
It (11,12) z 2w sinc27rvv (1,y - 12,) 2s sinc2irvs (II.-,2x)
X (R22/ V2)1 [R2(11.+I2z,)/2, R2(Ij,,+I,~)/2], (7)
where 1, is the Fourier transform of To or the effectivesource. Thus the correlation for the points 11 and 12 is
heavily dependent on the aperture considered as asource, even if the radiant emittance of the effectivesource is not uniform.
If 11 is set equal to 12 in Eq. (6) we see that the far-field irradiance is in the form of the effective sourcewith the slit acting as a lens. Thus, in the case where themutual power spectrum is aplanatic over the slit, itmay be determined by taking the Fourier transformof the far-field distribution and dividing by the transferfunction of the slit aperture." If the aplanatic conditiondoes not hold, then an interferometric measurement isnecessary to establish the mutual power spectrum atthe slit. If we now also impose the condition of radianceuniformity over the source optics, as exhibited by theGlobar, and consider the case of a rectangular aperture,we obtain a sinc-function correlation at the slit. Thefar-field light distribution then has the form of thediffraction image of a bar due to a lens with a rec-tangular aperture stop or
1(1,) K Si4-7rsv(a/R 2 +l:)- Si4rs-sv(-a/R 2+Il,)
sin227rsv (a1R2+ IZ,) sin 22rsv (-a/R2+1.z)± (8)
27rsv (a1R2+l1,) 27rsv (-a11R2+11,:)
In this expression, which has been discussed in detailand tabulated by Godfrey,' Si(z) is the sine integral,a is the half-width of the effective-source aperture, sis the half-slit width, R is the reference-sphere radius,and II. has the same meaning as before.
The interpretation of the radiation pattern as thesuperposition of diffraction patterns of the slit due tothe effective source2 may be used to distinguish be-tween the cases of partially coherent and incoherentslit illumination. If we consider the far-field distribu-tion from the slit as the angular size of the effectivesource increases from infinitesimal to 27r sr, we findthat it changes quickly from a diffraction pattern toa pattern with a flat top of increasing breadth. Inregions sufficiently far from the edge, the finiteness ofthe pattern is not apparent and the correlation functionis aplanatic and has the same form as a diffractionpattern of the slit. This is the same form as it wouldhave in the case of a delta-function incoherent emitter.Only in regions where edge effects are apparent is itpossible to tell that the slit is partially coherentlyilluminated. Even when the ratio of slit width tocorrelation interval is made so large that the pattern
21 H. H. Hopkins, Proc. Roy. Soc. (London) A217, 408 (1953).
Novi~rber 1967
LOUIS SICA
P.M.
tTRAVEL
L. L,
M
A
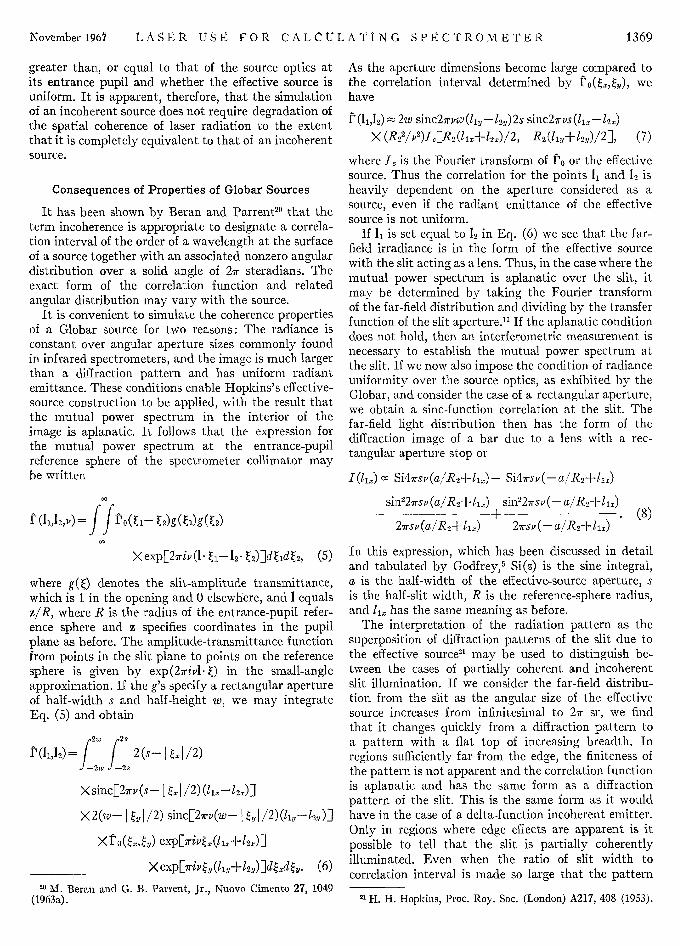
0.G.
FIG. 2. Arrangement of apparatus for measurement of far-fieldpattern of slit. P. M. is a photomultiplier, S is a slit, M is a rec-tangular mask, 0. G. is a piece of opal glass, and L focuses animage of the opal glass on the slit.
in the entrance pupil is essentially rectangular, apartial-coherence effect remains in the angular limita-tion of the beam due to the finite correlation intervalat the slit.
The considerations of this section indicate that forproper simulation of a Globar source for imagingpurposes, the characteristics of Globar radiation, ofimage size and uniformity, and radiance uniformity,must be duplicated. A laser-derived source must giverise to a uniform image which is large compared to asource-optics diffraction pattern, and a correlationfunction of the sinc(x) or besinc(X)22 form dependingon whether the source-mirror aperture is rectangularor circular. For ease of calculation, the rectangular-aperture case was chosen for study.
EXPERIMENTAL METHOD
For convenience, the irradiances necessary to de-termine the correlation at the slit were measured onan optical bench rather than on the spectrometeritself. The arrangement used is shown in Fig. 2. Sincethe ultimate goal of the experiment was the synthesisof a correlation function of prescribed form from laserlight with degraded spatial coherence, the data werecompared directly with the predictions of Eq. (8). Itwill be seen that this equation is characterized by theparameter 27rsva/R, hereafter designated xo. The ratioof the diameters of the geometrical image and the
60-
50-
40-
30-
20-
10-
-80 -70 -60 -50 -40 -30 -20 -10 0
diffraction pattern is 2xo/7r which is also equal to theratio of the slit width to the correlation interval at theslit. Different values of x0 may be obtained by alteringeither the slit width or the aperture size of the sourcelens. The shape of the patterns obtained in the twocases should be identical for a given xo if plotted as afunction of x=27rsvli. although their actual physicalsize in space will be different.
Experiment With Incoherent Source
Before attempting to determine a satisfactory experi-mental method for degrading laser coherence, I decidedto see if the expected irradiance distribution was pro-duced from an Hg source using the green line. Theaplanatism requirements on the light at the slit werefound to be most important. A sufficiently uniformsource was constructed by mounting a piece of opalglass in a screen about a millimeter in front of theenvelope of an Hg arc. The data curves were obtainedby driving a 1P21 photomultiplier across the fieldwhile recording the output with a Varian chart re-corder. A slit width of 0.1 mm was used on thephotomultiplier, which was small enough to eliminatedistortion of the curves due to inadequate spatialresolution.
It proved necessary to place the photomultiplierafter a collimating lens as shown in Fig. 2 in order toeliminate the effect of the excursion of the signal beamacross photocathode regions of varying sensitivityduring the scan. The contours remained sensitive tosmall rotational misadjustments of the collimating lens,however, -and were prone to asymmetry from thiscause.
Two different sets of curves were taken, one witha fixed slit width and varying rectangular-aperturewidth and the other with a fixed aperture and varyingslit width. Points from these curves were replottedwith the appropriately contracted or expanded scales
FIG. 3. Far-field pattern of slit for xo= 20 using Hg source.Aperture=f/8.97, slit width=62.4 p. Theoretical curve - ;experimental points 0.
22 besinc(x) =Ji (x)/x.
-14 -12 -10 -8 -6 -4 -2 0 2 4 6 8 10 12 14
FIG. 4. Far-field pattern of slit for xo=6 using Hg source.Aperture = J/29.9, slit width= 6 2 .4 g. Theoretical curve - ,experimental points 0.
1 370 VOl. 57
LASER USE FOR CALCULATING SPECTROMETER
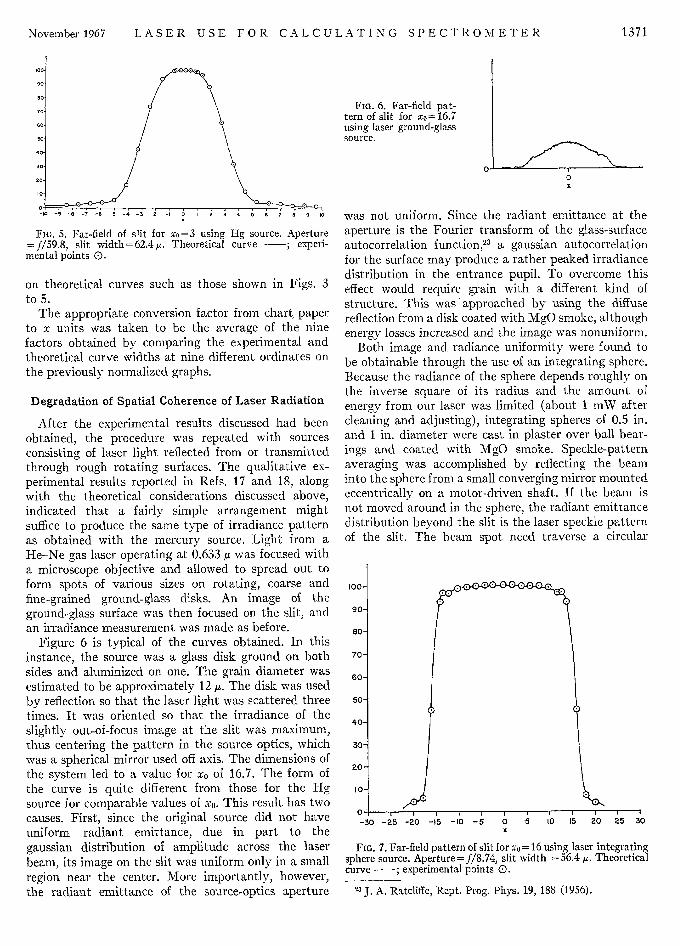
FiG. 6. Far-field pat-tern of slit for x0 = 16.7using laser ground-glasssource.
FIG. 5. Far-field of slit for xo=3 using Hg source. Aperture=f/59.8, slit width=62.4H. Theoretical curve -- ; experi-mental points 0.
on theoretical curves such as those shown in Figs. 3to 5.
The appropriate conversion factor from chart paperto x units was taken to be the average of the ninefactors obtained by comparing the experimental andtheoretical curve widths at nine different ordinates onthe previously normalized graphs.
Degradation of Spatial Coherence of Laser Radiation
After the experimental results discussed had beenobtained, the procedure was repeated with sourcesconsisting of laser light reflected from or transmittedthrough rough rotating surfaces. The qualitative ex-perimental results reported in Refs. 17 and 18, alongwith the theoretical considerations discussed above,indicated that a fairly simple arrangement mightsuffice to produce the same type of irradiance patternas obtained with the mercury source. Light from aHe-Ne gas laser operating at 0.633 A was focused witha microscope objective and allowed to spread out toform spots of various sizes on rotating, coarse andfine-grained ground-glass disks. An image of theground-glass surface was then focused on the slit, andan irradiance measurement was made as before.
Figure 6 is typical of the curves obtained. In thisinstance, the source was a glass disk ground on bothsides and aluminized on one. The grain diameter wasestimated to be approximately 12 pi. The disk was usedby reflection so that the laser light was scattered threetimes. It was oriented so that the irradiance of theslightly out-of-focus image at the slit was maximum,thus centering the pattern in the source optics, whichwas a spherical mirror used off axis. The dimensions ofthe system led to a value for x0 of 16.7. The form ofthe curve is quite different from those for the Hgsource for comparable values of x0. This result has twocauses. First, since the original source did not haveuniform radiant emittance, due in part to thegaussian distribution of amplitude across the laserbeam, its image on the slit was uniform only in a smallregion near the center. More importantly, however,the radiant emittance of the source-optics aperture
was not uniform. Since the radiant emittance at theaperture is the Fourier transform of the glass-surfaceautocorrelation function,2 3 a gaussian autocorrelationfor the surface may produce a rather peaked irradiancedistribution in the entrance pupil. To overcome thiseffect would require grain with a different kind ofstructure. This was approached by using the diffusereflection from a disk coated with MgO smoke, althoughenergy losses increased and the image was nonuniform.
Both image and radiance uniformity were found tobe obtainable through the use of an integrating sphere.Because the radiance of the sphere depends roughly onthe inverse square of its radius and the amount ofenergy from our laser was limited (about 1 mW aftercleaning and adjusting), integrating spheres of 0.5 in.and 1 in. diameter were cast in plaster over ball bear-ings and coated with MgO smoke. Speckle-patternaveraging was accomplished by reflecting the beaminto the sphere from a small converging mirror mountedeccentrically on a motor-driven shaft. If the beam isnot moved around in the sphere, the radiant emittancedistribution beyond the slit is the laser speckle patternof the slit. The beam spot need traverse a circular
100
so
80
70
60
50
40
30-
20-
10-
-30 -25 -20 -15 -10 -5 0I , . .I
5 10 15 20 25 30
FIG. 7. Far-field pattern of slit for x0= 16 using laser integratingsphere source. Aperture= f/8.74, slit width = 56.4 ,. Theoreticalcurve -; experimental points 0.
23 J. A. Ratcliffe, Rept. Prog. Phys. 19, 188 (1956).
FIG. S. Far-field pattern of slit for xo= 10 using laser inte-grating-sphere source. Aperture=f/14, slit ividth=56.4 i. Theo-retical curve -; experimental points 0.
path only 2 or 3 mm in diameter on the sphere wallto produce a very smooth averaged curve. The averag-ing may be carried out slowly enough so that the linewidth of the light is essentially unaltered by theprocess.
The diameter of the image on the slit was 3-4 mmwhich, though considerably smaller than that used inthe experiment with the Hg green line, was still verylarge compared to one diffraction width. Curves ob-tained from this source for different values of x0 areshown in Figs. 7 through 9, in which points from thechart-recorder traces have been replotted on the theo-retical curves as described before. These curves weretaken using a spherical mirror 80 off axis, with theobject distance roughly equal to the radius of curvatureof the mirror. The contours were independent of theexact position of the image on the slit and of theprecise region of incidence of the laser beam on theintegrating-sphere wall. However, the use of regionsfar to the left or right of that directly across from the
input opening seemed to produce spurious bumps inthe curves. As may be seen from the data, the laserintegrating-sphere source duplicates the role of anincoherent Hg source very well.
The irradiance in front of the integrating spherewas monitored as a function of angle. As expected, itwas found to be constant over an angle equal to thatsubtended by the mirror at the integrating sphere.This suggests that all that is necessary to check theproper functioning of the laser-integrating-sphere sourceis to monitor the irradiance distribution in front of thesphere over the angle to be used.
At 3.39 u the Doppler line width is much narrowerthan the free spectral range of the laser cavity; thelaser can therefore oscillate in a single axial mode. Inthe visible, where the Doppler width is larger, specialcare must be exercised to obtain single-mode oscillation.
CONCLUSION
If the narrow spectral bandwidth of laser radiationis to be used in the calibration of spectrometer scanningfunctions, the spatial coherence of the radiation mustbe degraded, since the form of an optical image isdependent on the spatial coherence of the correspond-ing object. Analysis of the imaging problem for thecase of a slit indicates that a correlation function ofspecific form must be obtained at the slit in order forits image to be the same as if it were illuminated withradiation derived from a large, uniform, source with adelta-function correlation. We have shown that theappropriate correlation function may be obtained froma large partially coherent source provided that itsmutual power spectrum has an appropriate form.
A rotating ground glass illuminated by laser lightdoes not necessarily produce a source interchangeablewith ordinary sources for the critical study of opticalimaging. However, an integrating sphere illuminatedby laser light, combined with speckle-pattern averag-ing, provides a source which is uniform and sufficientlyspatially incoherent to be used interchangeably withordinary incoherent sources in applications such asspectrometer scanning-function calibration.
ACKNOWLEDGMENT
I would like to express my sincere thanks to ProfessorJohn Strong for suggesting this problem and for manyhelpful discussions during the course of its solution.Thanks are also due to members of the staff of theLaboratory of Astrophysics and Physical Meteorologyand especially to Thomas Coard for assistance incarrying out the experimental work. Finally I wouldlike to thank Dr. H. Z. Cummins for the use of theHe-Ne laser with which the final data were taken.
-16 -14 -12 -lo -8 -6 -4 -2 0 2 4 6 8 lo 12 14 16
FIG. 9. Far-field pattern of slit for xo=6 using laser integratingsphere source. Aperture= f/23.2; slit width= 56.4 p. Theoreticalcurve -; experimental points X,