Use of “Next Generation” Open-Path Monitoring Systems for Source Detection, Emission Inventory Improvement, Root Cause Analysis and to Direct Emission Reduction Strategies Steven H. Ramsey, P.E., BCEE Houston, Texas 1
Transcript
Use of “Next Generation” Open-Path Monitoring Systems for Source Detection, Emission Inventory Improvement, Root Cause Analysis and
to Direct Emission Reduction Strategies
Steven H. Ramsey, P.E., BCEEHouston, Texas
1
Presentation Outline
State of the market Brief overview of technologies Application example Recent market developments Market needs
Slide #2
State of the Market
Formal EPA/TCEQ approvals of open-path/remote sensing technologies for regulatory compliance purposes are spotty: Use of optical imaging cameras as an alternative work practice to Method 21. Incorporation of radial plume mapping methods into Other Test Method 10. Compendium Method TO-16 for use of OP-FTIR for toxic air pollutant
measurements. Other approvals typically via case-by-case project plans.
Potential end-user understanding of the available technologies is often not robust.
Technologies provided mostly provided by small, boutique, entrepreneurial entities.
Limited number of suppliers, many are not based in the US. Limited delivery capacities for many of the technologies. Limited validation studies for most technologies. Many of the suppliers only offer one solution.
Slide #3
Inevitable Result
Slide #4
Finding the Right Tool
Numerous factors need to be considered when evaluating the various technologies for a specific application: Extent of geographic area to be covered. Importance of collecting data over time (steady state v. transient or variable
sources). Pollutants of interest. Importance of two-dimensional vertical source profiling. Ground-level or elevated source. Temperature profile of target release relative to background. Loss prevention v. environmental compliance v. affirmative defense. Need to accurately quantify emissions.
Slide #5
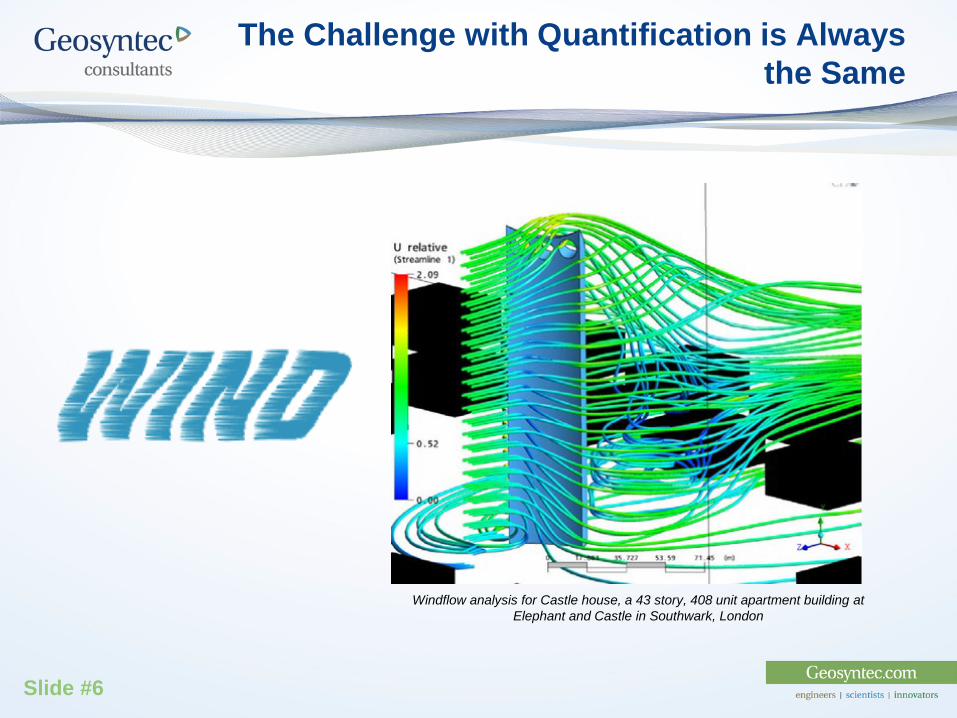
The Challenge with Quantification is Always the Same
Windflow analysis for Castle house, a 43 story, 408 unit apartment building at Elephant and Castle in Southwark, London
Slide #6
State of the Various Commercially-Available Technologies
Differential Absorption Light Detection and Ranging, “DIAL” Solar Occultation Flux, “SOF” Passive optical gas imaging systems: Passive Fourier Transform Infrared (“PFTIR”) Hyper-spectral imaging Forward-Looking Infrared (“FLIR”) cameras
Active optical gas measurement systems: Open-path FTIR (OP-FTIR”) systems UV Differential Optical Absorption Spectroscopy (“UV-DOAS”) Open-path Tunable Diode Laser Spectroscopy (“OP-TDLAS”)
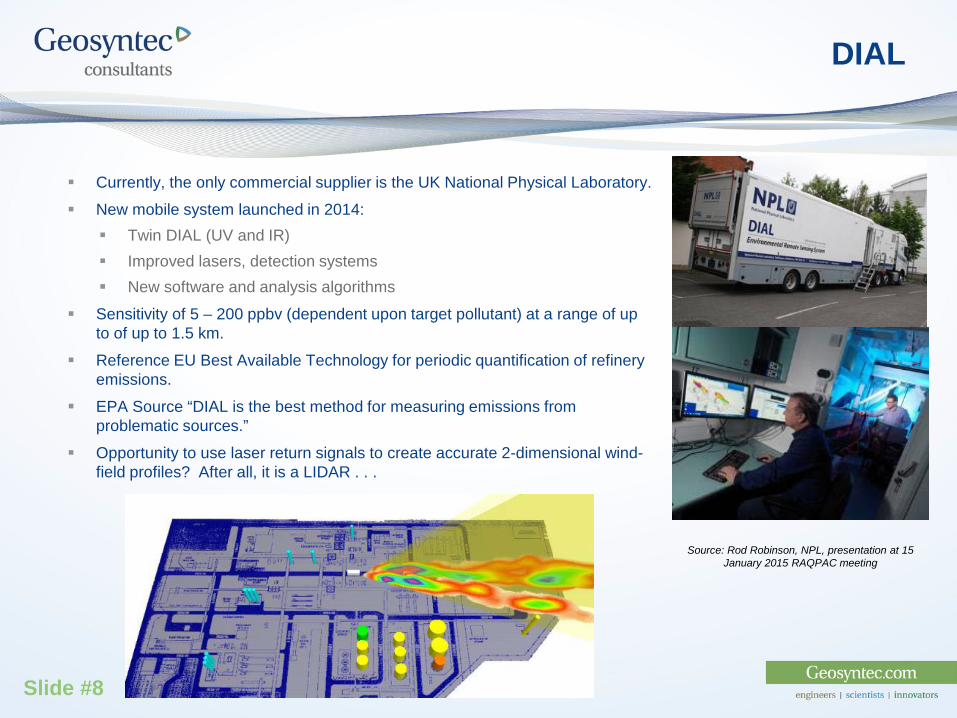
Currently, the only commercial supplier is the UK National Physical Laboratory. New mobile system launched in 2014:
Twin DIAL (UV and IR) Improved lasers, detection systems New software and analysis algorithms
Sensitivity of 5 – 200 ppbv (dependent upon target pollutant) at a range of up to of up to 1.5 km.
Reference EU Best Available Technology for periodic quantification of refinery emissions.
EPA Source “DIAL is the best method for measuring emissions from problematic sources.”
Opportunity to use laser return signals to create accurate 2-dimensional wind-field profiles? After all, it is a LIDAR . . .
Source: Rod Robinson, NPL, presentation at 15 January 2015 RAQPAC meeting
Slide #8
SOF
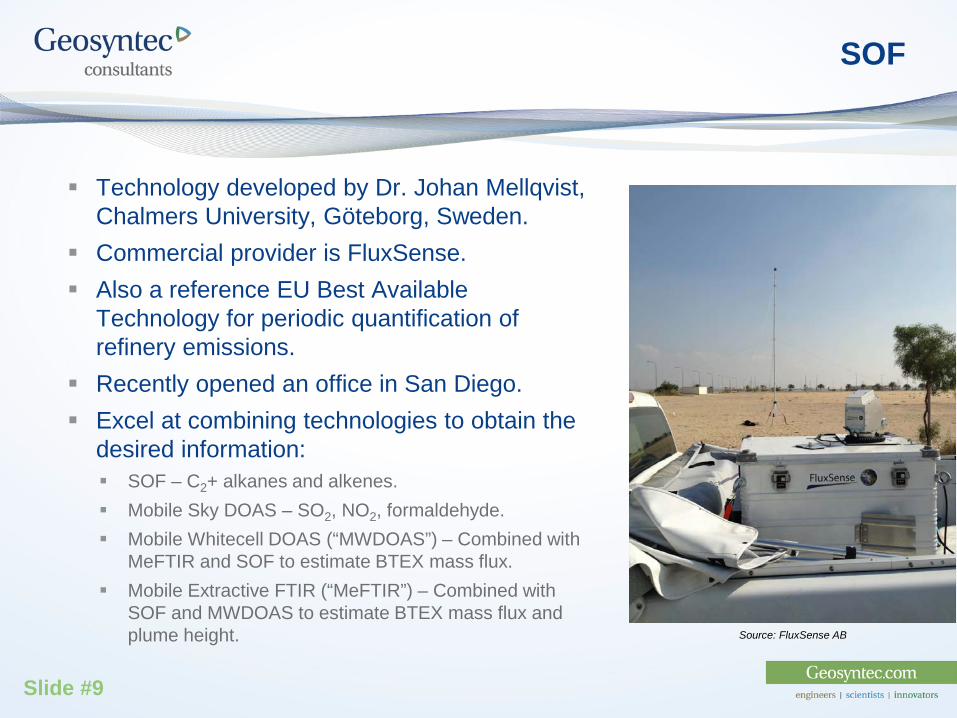
Technology developed by Dr. Johan Mellqvist, Chalmers University, Göteborg, Sweden.
Commercial provider is FluxSense. Also a reference EU Best Available
Technology for periodic quantification of refinery emissions.
Recently opened an office in San Diego. Excel at combining technologies to obtain the
desired information: SOF – C2+ alkanes and alkenes. Mobile Sky DOAS – SO2, NO2, formaldehyde. Mobile Whitecell DOAS (“MWDOAS”) – Combined with
MeFTIR and SOF to estimate BTEX mass flux. Mobile Extractive FTIR (“MeFTIR”) – Combined with
SOF and MWDOAS to estimate BTEX mass flux and plume height. Source: FluxSense AB
Slide #9
PFTIR
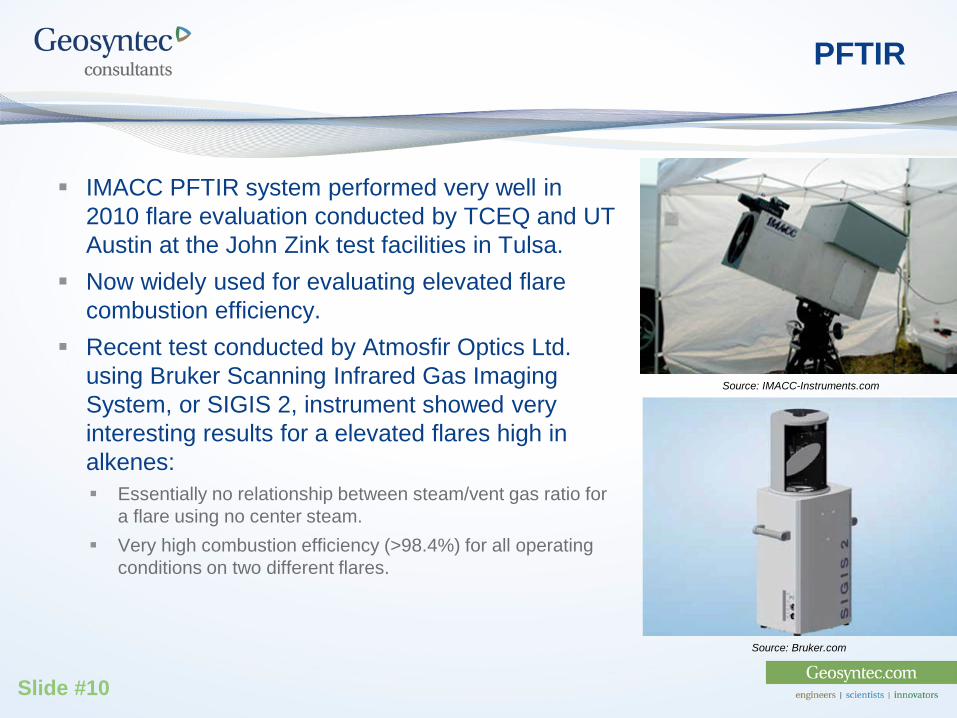
IMACC PFTIR system performed very well in 2010 flare evaluation conducted by TCEQ and UT Austin at the John Zink test facilities in Tulsa.
Now widely used for evaluating elevated flare combustion efficiency.
Recent test conducted by Atmosfir Optics Ltd. using Bruker Scanning Infrared Gas Imaging System, or SIGIS 2, instrument showed very interesting results for a elevated flares high in alkenes: Essentially no relationship between steam/vent gas ratio for
a flare using no center steam. Very high combustion efficiency (>98.4%) for all operating
conditions on two different flares.
Source: IMACC-Instruments.com
Source: Bruker.com
Slide #10
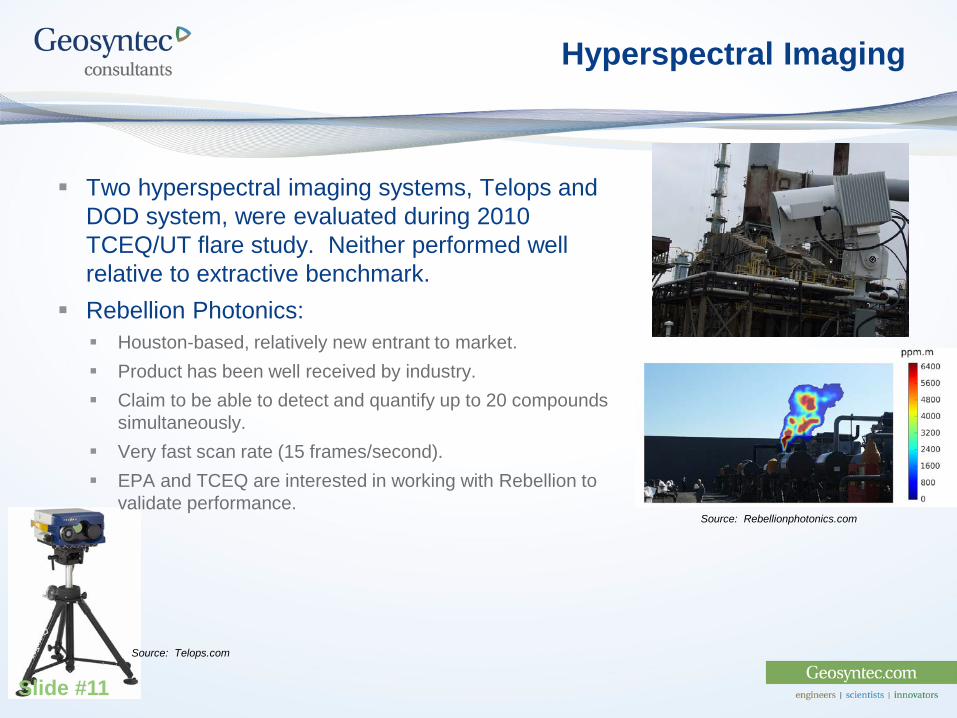
Hyperspectral Imaging
Two hyperspectral imaging systems, Telops and DOD system, were evaluated during 2010 TCEQ/UT flare study. Neither performed well relative to extractive benchmark.
Rebellion Photonics: Houston-based, relatively new entrant to market. Product has been well received by industry. Claim to be able to detect and quantify up to 20 compounds
simultaneously. Very fast scan rate (15 frames/second). EPA and TCEQ are interested in working with Rebellion to
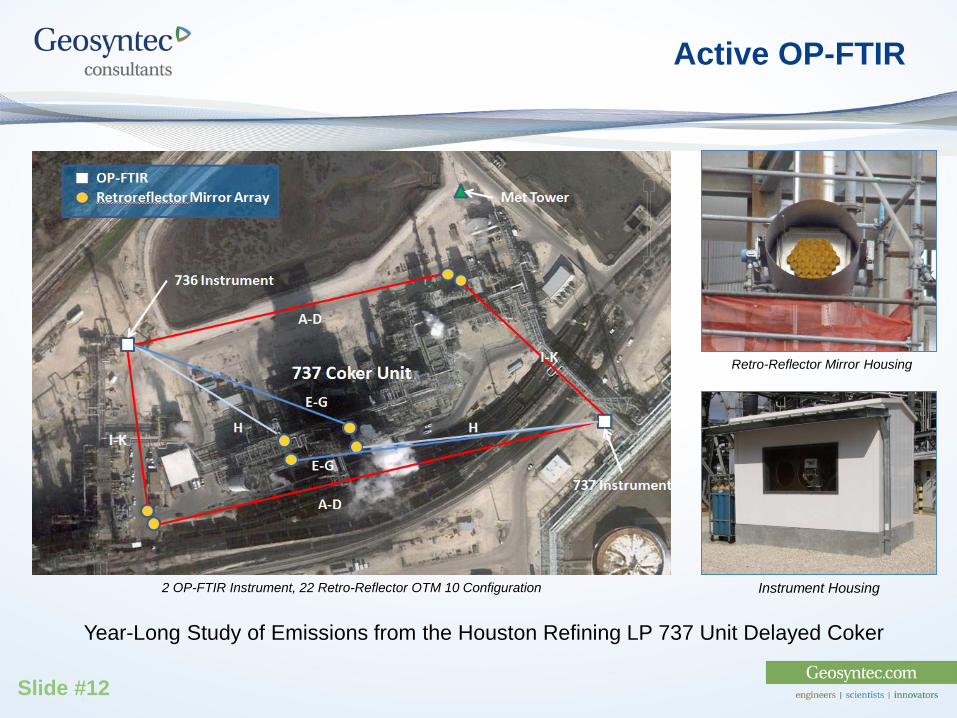
Year-Long Study of Emissions from the Houston Refining LP 737 Unit Delayed Coker
Slide #12
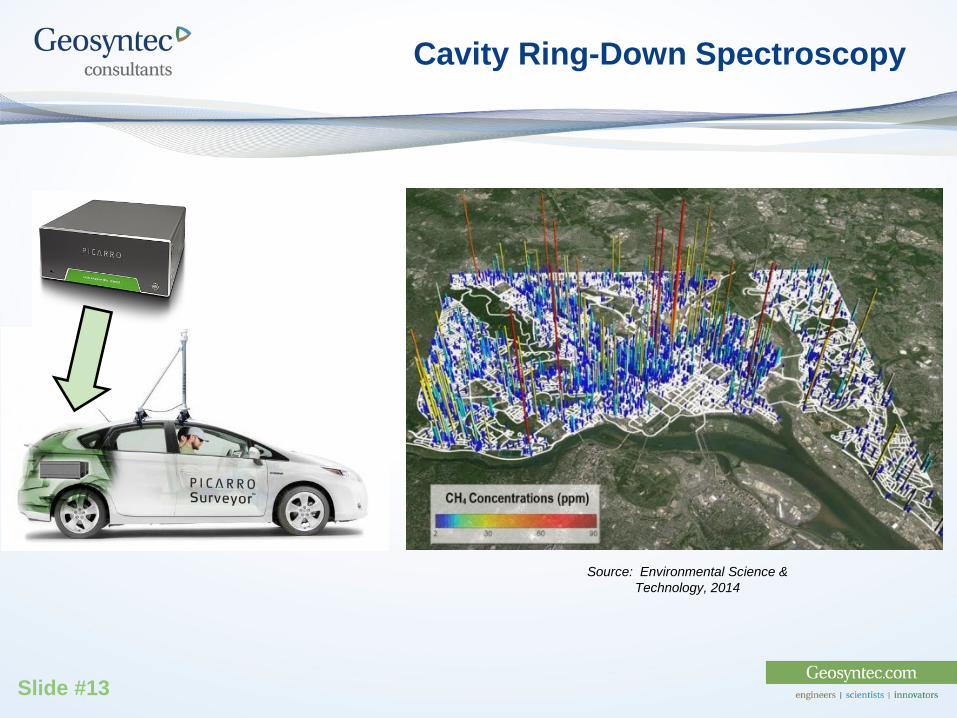
Cavity Ring-Down Spectroscopy
Source: Environmental Science & Technology, 2014
Slide #13
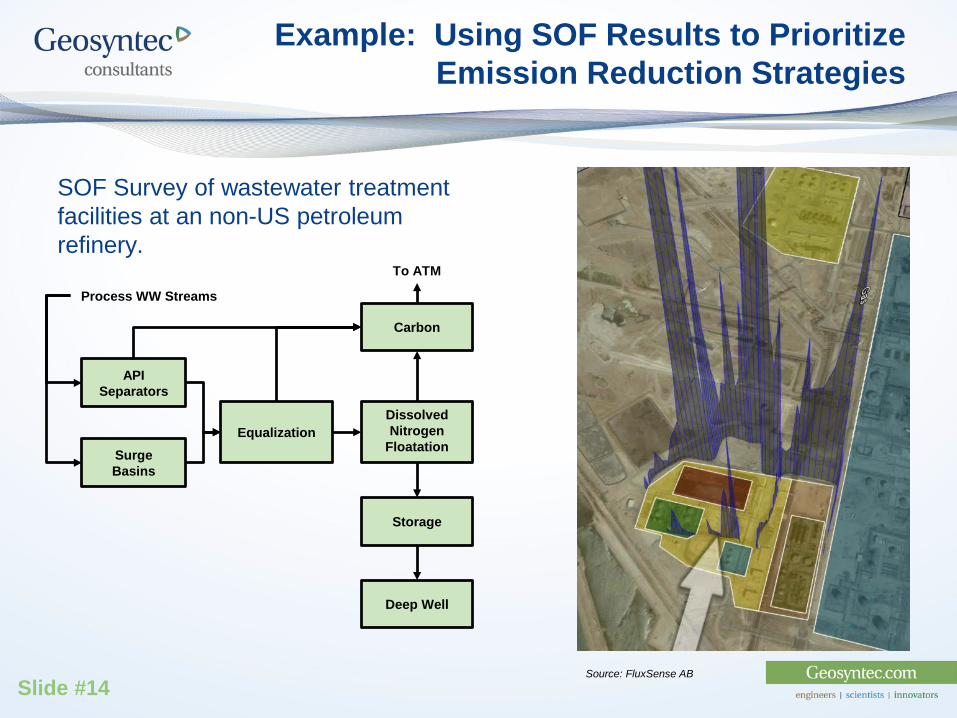
Example: Using SOF Results to Prioritize Emission Reduction Strategies
SOF Survey of wastewater treatment facilities at an non-US petroleum refinery.
API Separators
Surge Basins
Storage
Dissolved Nitrogen
Floatation
Deep Well
Process WW Streams
Carbon
To ATM
Source: FluxSense AB
Equalization
Slide #14
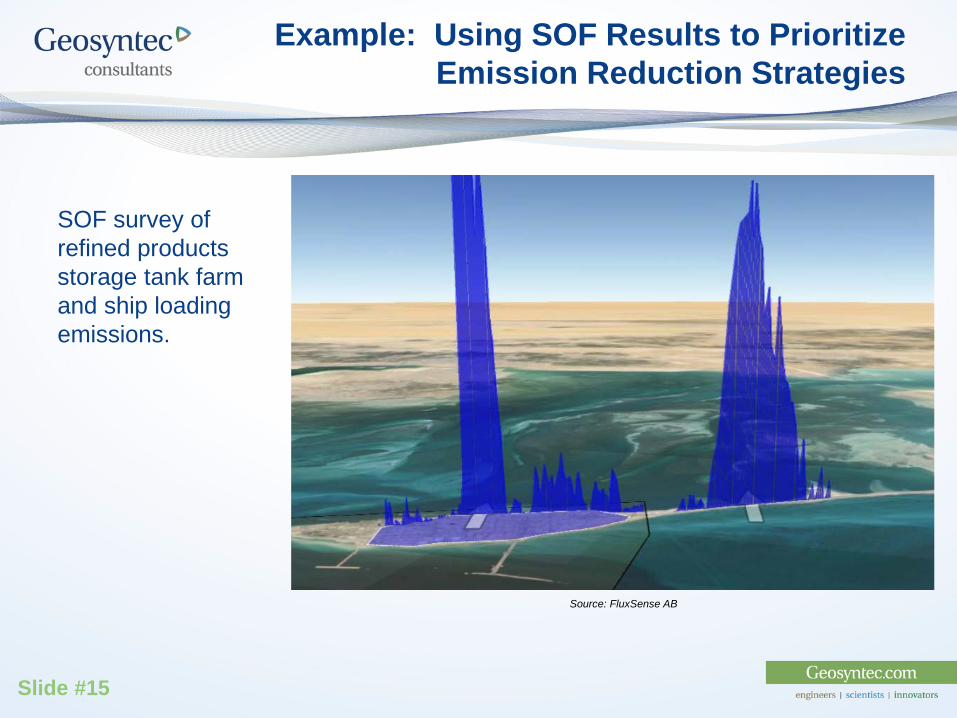
Example: Using SOF Results to Prioritize Emission Reduction Strategies
SOF survey of refined products storage tank farm and ship loading emissions.
Source: FluxSense AB
Slide #15
Recent Market Developments
Petroleum refinery sector RTR requires fenceline monitoring for benzene. EPA risk assessment indicates that a limited number of refineries will have impacts greater than
action level (2-week ΔC > 9 µg/m3). This analysis assumes reported benzene emissions are accurate.
EPA believes that refinery reported inventories are under-reported by a factor of at least five. 14-day passive-diffusive monitors provide insufficient information for either conducting a root
cause analysis or presenting an affirmative defense that elevated benzene is due to off-site sources.
EPA’s preference is permanent, fenceline monitors. Didn’t propose it because of concerns about OMB review.
Bay Area Air Quality Management District proposed recently proposed rules that will require all refiners in the District to install permanent, open-path fenceline monitoring systems.
South Coast Air Quality Management District is moving forward with a multi-million dollar campaign to survey emissions from a number of petroleum hydrocarbon sources in the district. The campaign includes use of multiple technologies provided by multiple commercial entities.
Slide #16
Needs
Continued improvement in data analysis methods. Improved algorithms to process wind speed and direction
data with path-integrated (or averaged) concentrations. Solve the wind speed and vector problem. Improved commercial availability of key technologies,
such as DIAL and SOF, in the US. EPA global approval of technologies and methods – no
more “send us the results and we will see if we like them, first.”
Solve the “chicken-or-egg” problem. We need more capacity and more competition to improve reliability and lower delivery costs. But for this to happen, there needs to be a significant infusion of investment capital . . . and that requires a dependable market. Will recent regulatory developments solve this problem?
Slide #17
Contact Information
Steven H. Ramsey, P.E., BCEEPrincipalGeosyntec Consultants11490 Westheimer Road, Suite 150Houston, TX 77077Office: +1 281.810.5027Cell: +1 713.725.7037Email: [email protected]


![Personalized Learning Path Generation Approach … Learning Path Generation Approach ... learner-customized tutorial lessons, ... (CAT) theory [16] through a conscientiousAuthors:](https://static.documents.pub/doc/80x56/5b0640877f8b9ac33f8c8f94/personalized-learning-path-generation-approach-learning-path-generation-approach.jpg)


