37
USE OF SATELLITE IMAGES FOR AGRICULTURAL STATISTICS National Administrative Department of Statistics DANE – Colombia Geostatistical Department September 2014

USE OF SATELLITE IMAGES FOR
AGRICULTURAL STATISTICS
National Administrative Department of Statistics
DANE – Colombia
Geostatistical DepartmentSeptember 2014
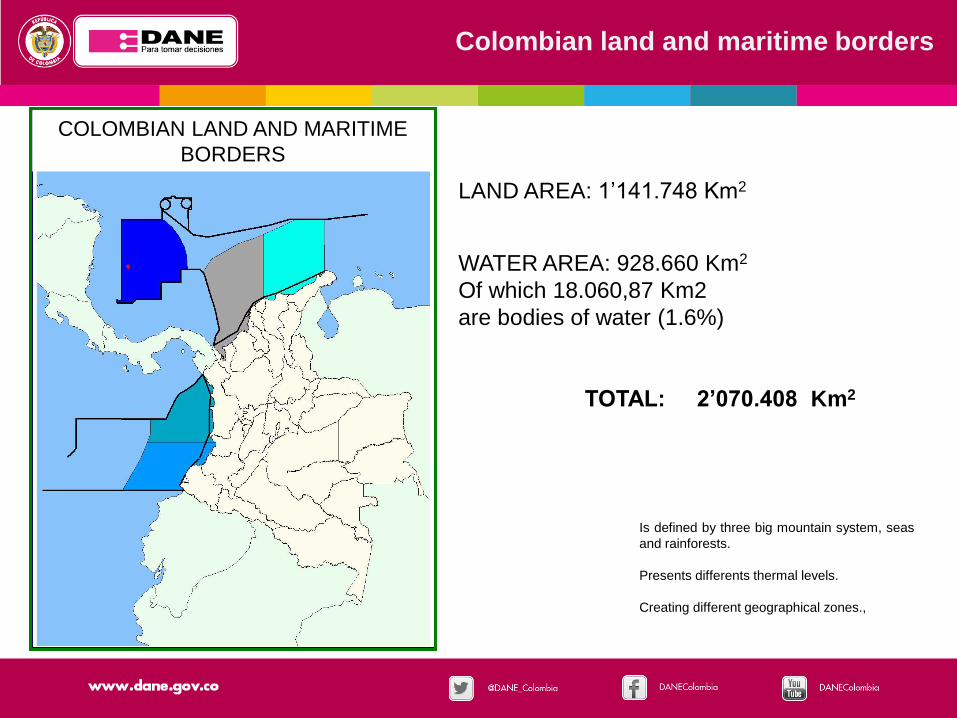
Is defined by three big mountain system, seas
and rainforests.
Presents differents thermal levels.
Creating different geographical zones.,
LAND AREA: 1’141.748 Km2
WATER AREA: 928.660 Km2
Of which 18.060,87 Km2
are bodies of water (1.6%)
TOTAL: 2’070.408 Km2
Colombian land and maritime borders
COLOMBIAN LAND AND MARITIME
BORDERS
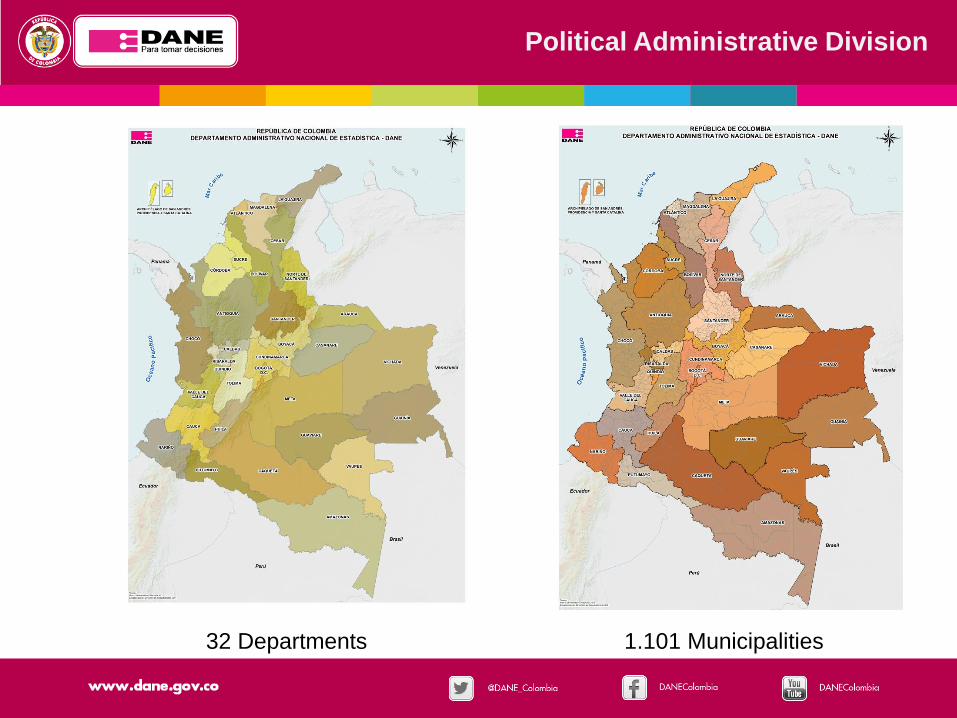
32 Departments 1.101 Municipalities
Political Administrative Division

182 Afro-Descendant Communities Lands
(53.229 Km2)
770 Indigenous Reservations
(322.982 Km2 )
Political Administrative Division
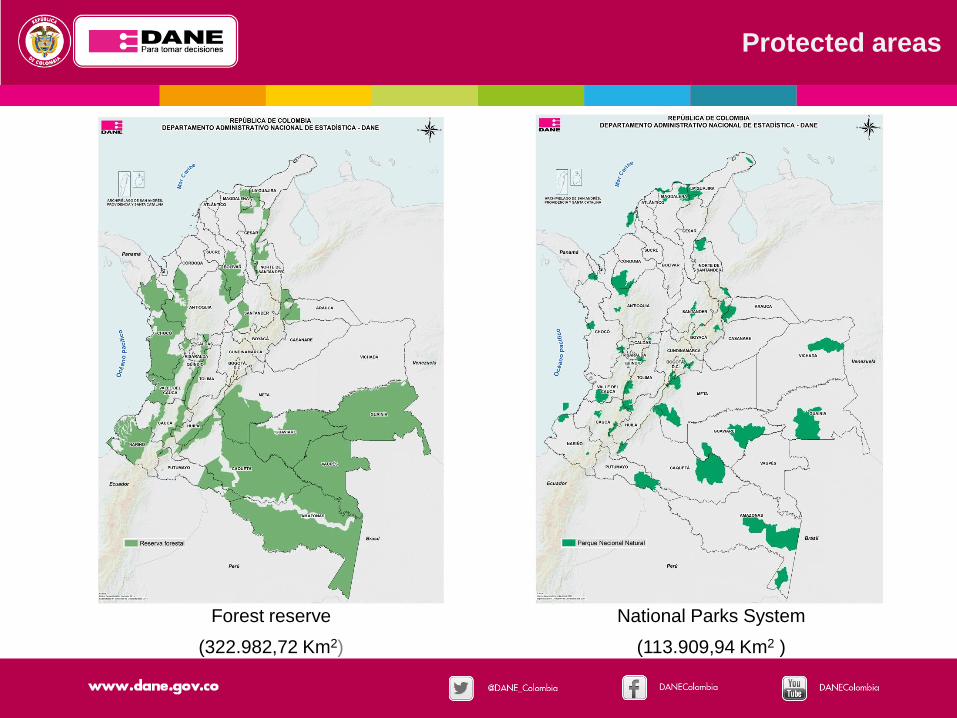
Forest reserve
(322.982,72 Km2)
National Parks System
(113.909,94 Km2 )
Protected areas

• Pastures:
The herbaceous species coverage that have been planted,
generally used for livestock activities. They can be clean
pastures, woodlands, weedy or stubble land.
• Heterogeneous agricultural areas:
Areas with mixture of different types of crops, as a mosaic of
annual and permanent crops; pastures and crops; crops,
pastures and natural areas.
• Annual or transitory crops:
Occupied areas with crops whose growth cycle lasts one
year or less, even can be a few months. They are mainly
characterized because after the harvest, it is necessary to
sow or plant to keep producing.
• Semipermanent and permanent crops:
Lands dedicated to crops whose growth cycle is superior
than a year, and where they produce various harvests
without the need to plant again (Melo y Camacho, 2005).
Exist permanent crops like sugarcane, brown sugarcane,
plantain and banana.
• Planted forest:
Planted broadleaved and conifer forests.
15,2%
4,4%
2,9%
0,9 %
0,1 %
23,5%
Land Cover
dfsaddasdAnnual or transitory crops
Annual or transitory crops
Permanent or semi permanent
cropsPastures
Heterogeneous agricultural areas
Coverage
SOURCE: IDEAM, IGAC, 2010
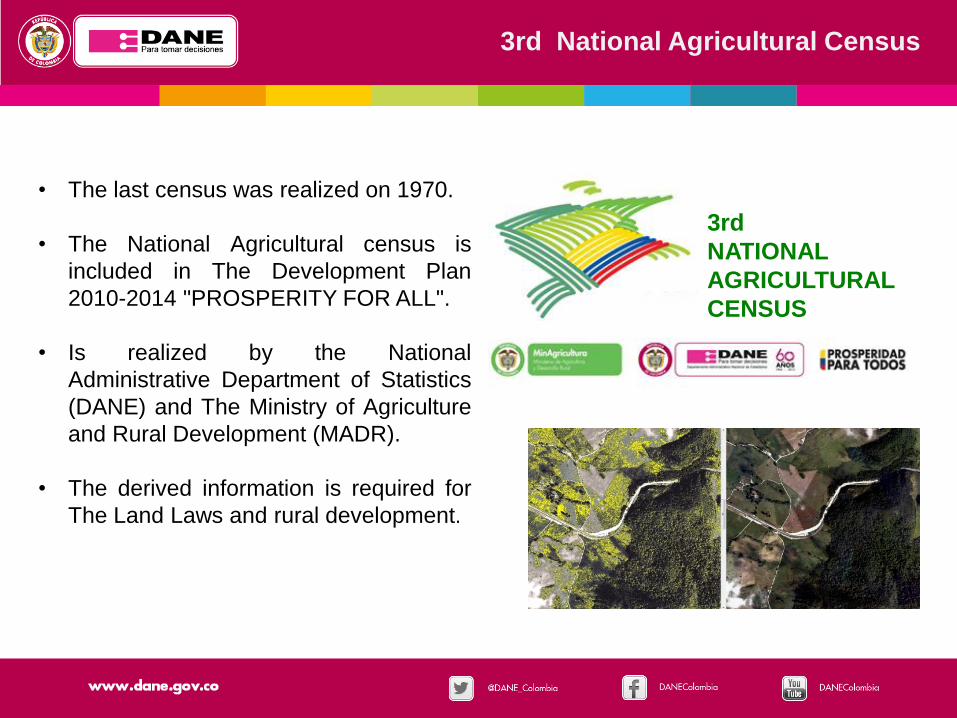
3rd
NATIONAL
AGRICULTURAL
CENSUS
3rd National Agricultural Census
• The last census was realized on 1970.
• The National Agricultural census is
included in The Development Plan
2010-2014 "PROSPERITY FOR ALL".
• Is realized by the National
Administrative Department of Statistics
(DANE) and The Ministry of Agriculture
and Rural Development (MADR).
• The derived information is required for
The Land Laws and rural development.
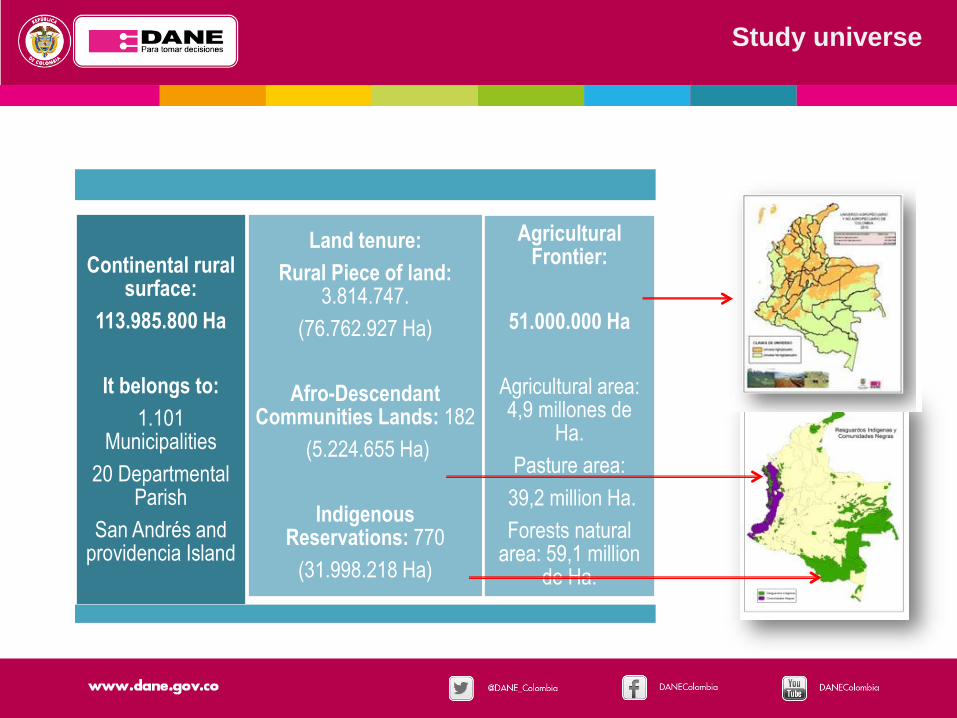
Continental rural surface:
113.985.800 Ha
It belongs to:
1.101 Municipalities
20 DepartmentalParish
San Andrés and providencia Island
Land tenure:
Rural Piece of land: 3.814.747.
(76.762.927 Ha)
Afro-DescendantCommunities Lands: 182
(5.224.655 Ha)
IndigenousReservations: 770
(31.998.218 Ha)
AgriculturalFrontier:
51.000.000 Ha
Agricultural area: 4,9 millones de
Ha.
Pasture area:
39,2 million Ha.
Forests natural area: 59,1 million
de Ha.
Study universe
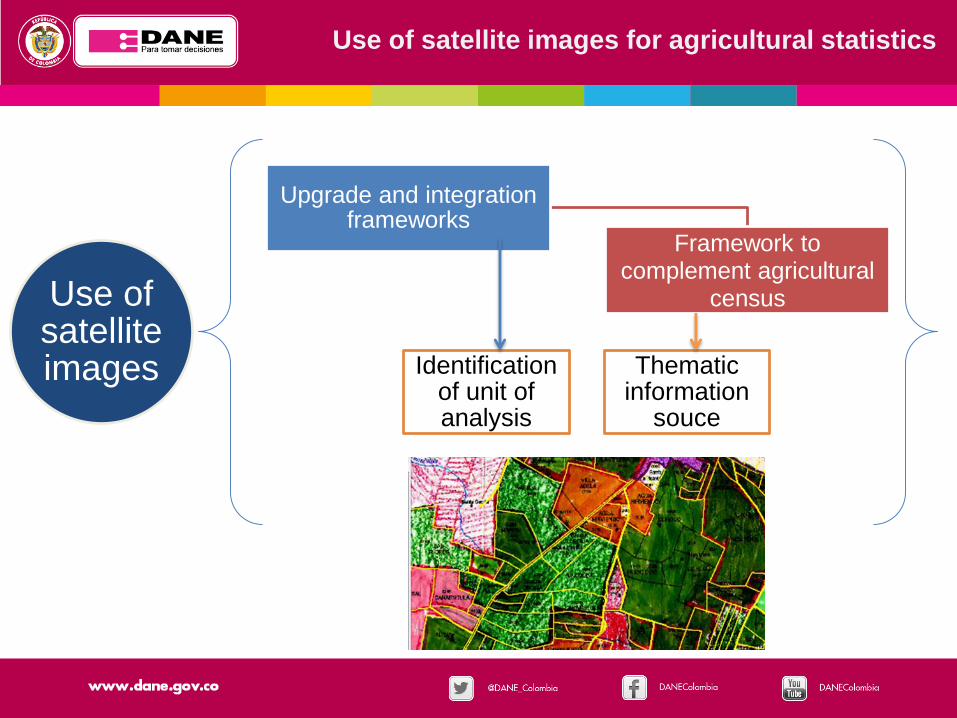
Upgrade and integrationframeworks
Framework to complement agricultural
census
Identification of unit of analysis
Thematicinformation
souce
Use of satelliteimages
Use of satellite images for agricultural statistics
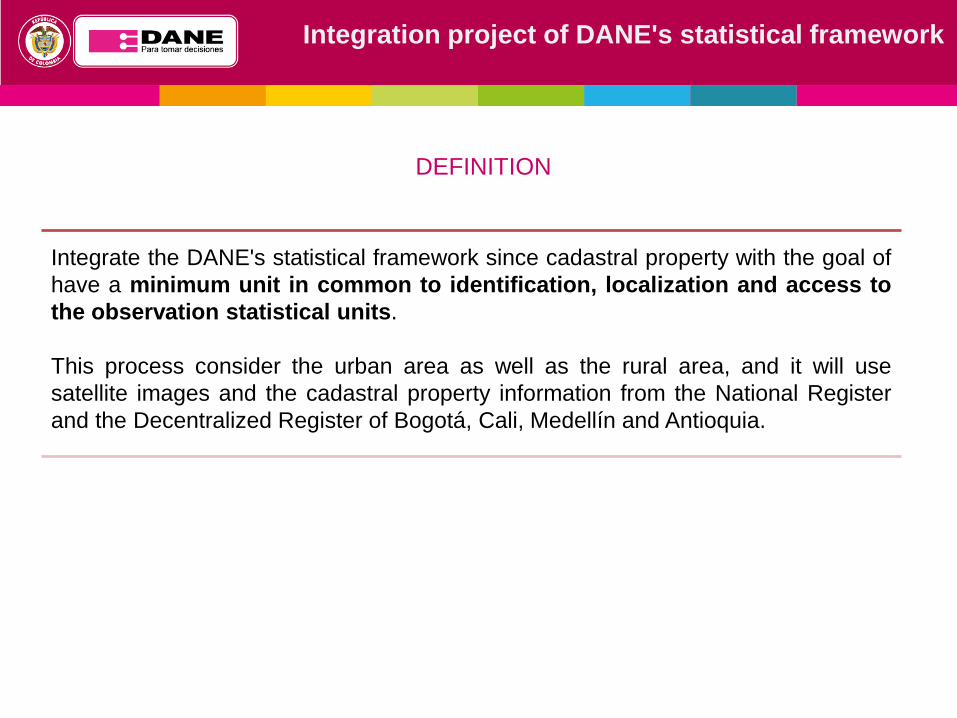
Integration project of DANE's statistical framework
Integrate the DANE's statistical framework since cadastral property with the goal of
have a minimum unit in common to identification, localization and access to
the observation statistical units.
This process consider the urban area as well as the rural area, and it will use
satellite images and the cadastral property information from the National Register
and the Decentralized Register of Bogotá, Cali, Medellín and Antioquia.
DEFINITION
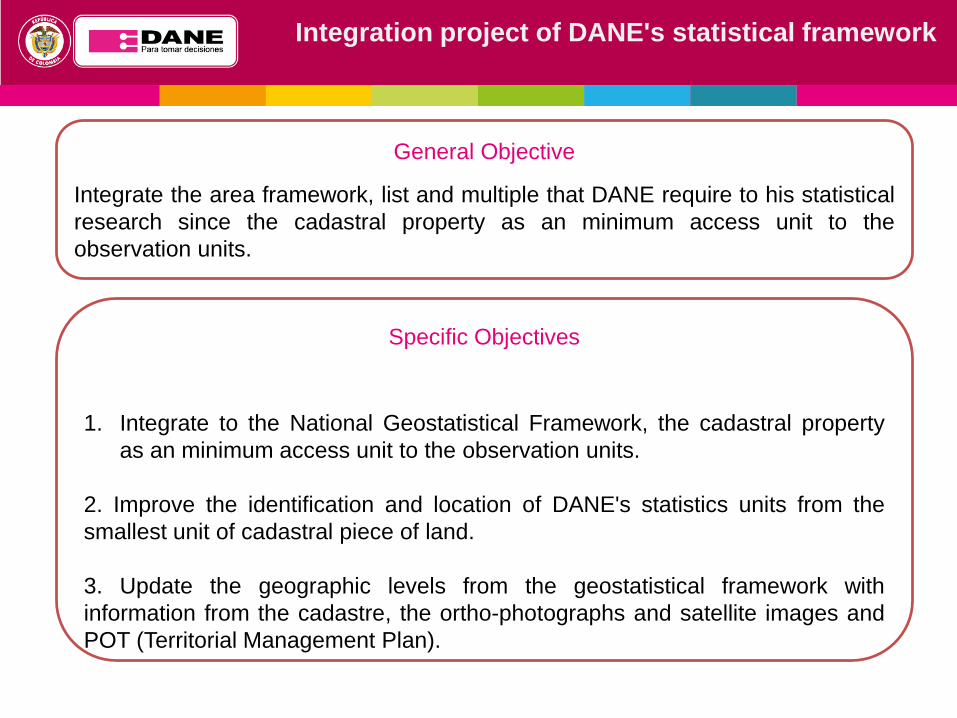
General Objective
Integrate the area framework, list and multiple that DANE require to his statistical
research since the cadastral property as an minimum access unit to the
observation units.
Specific Objectives
1. Integrate to the National Geostatistical Framework, the cadastral property
as an minimum access unit to the observation units.
2. Improve the identification and location of DANE's statistics units from the
smallest unit of cadastral piece of land.
3. Update the geographic levels from the geostatistical framework with
information from the cadastre, the ortho-photographs and satellite images and
POT (Territorial Management Plan).
Integration project of DANE's statistical framework

It's main feature is that all of the elements that comprise it, are georeferenced, means it
identify and locate geographically the elements of the target population. This consists of:
National Geostatistical Framework

Rural
Social Economics Environmental
Housing Undertakings or business
Agricultural Production Units
Environmental units
National coverage
Urban
Integration of statistical frameworks

Sources of information
Cadastre
(Farm information – Records)
Image bank
(Satellite imagery,
Ortho-photo
mosaic)
Basic cartography
1:100.000 y 1:25.000
Borders of territorial entities
RI y TCCN
DANE’s
Census
Mapping
1:25.000
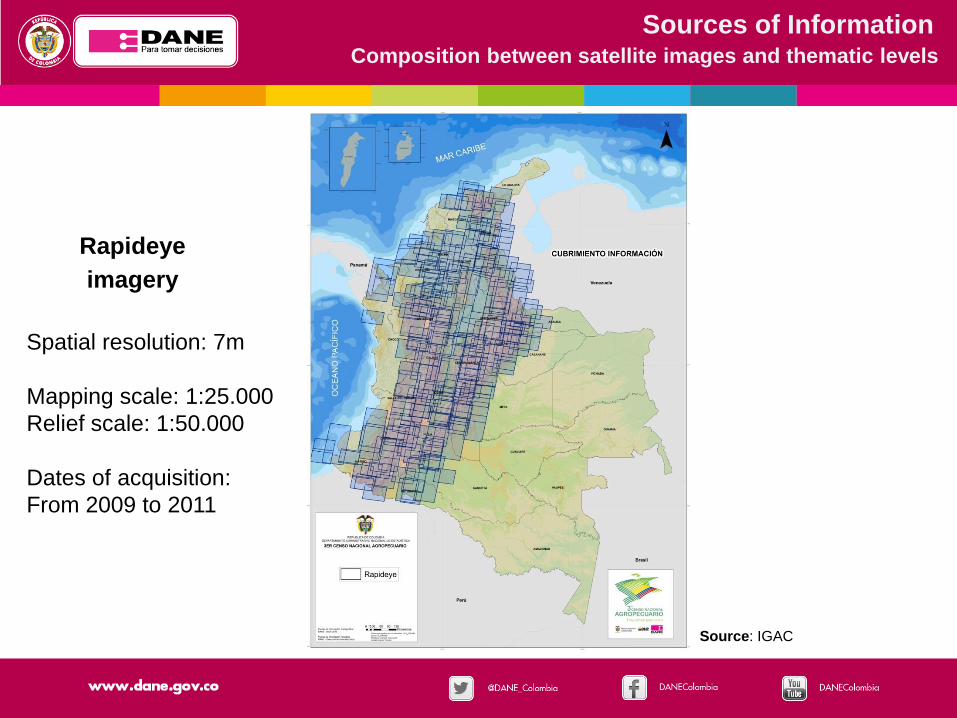
Sources of Information
Rapideye
imagery
Spatial resolution: 7m
Mapping scale: 1:25.000
Relief scale: 1:50.000
Dates of acquisition:
From 2009 to 2011
Composition between satellite images and thematic levels
Source: IGAC

SPOT
Imagery
Spatial resolution: 5m
Mapping scale: 1:25.000
Relief scale: 1:50.000
Dates of acquisition :
From 1996 to 2009
Sources of InformationComposition between satellite images and thematic levels
Source: IGAC
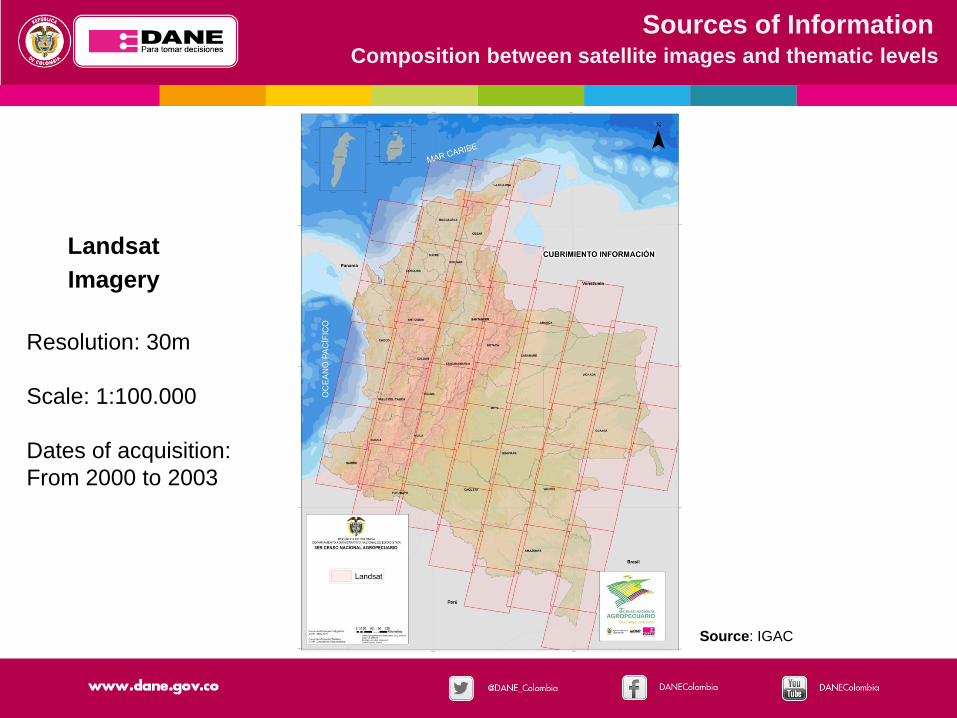
Source: IGAC
Landsat
Imagery
Resolution: 30m
Scale: 1:100.000
Dates of acquisition:
From 2000 to 2003
Sources of InformationComposition between satellite images and thematic levels
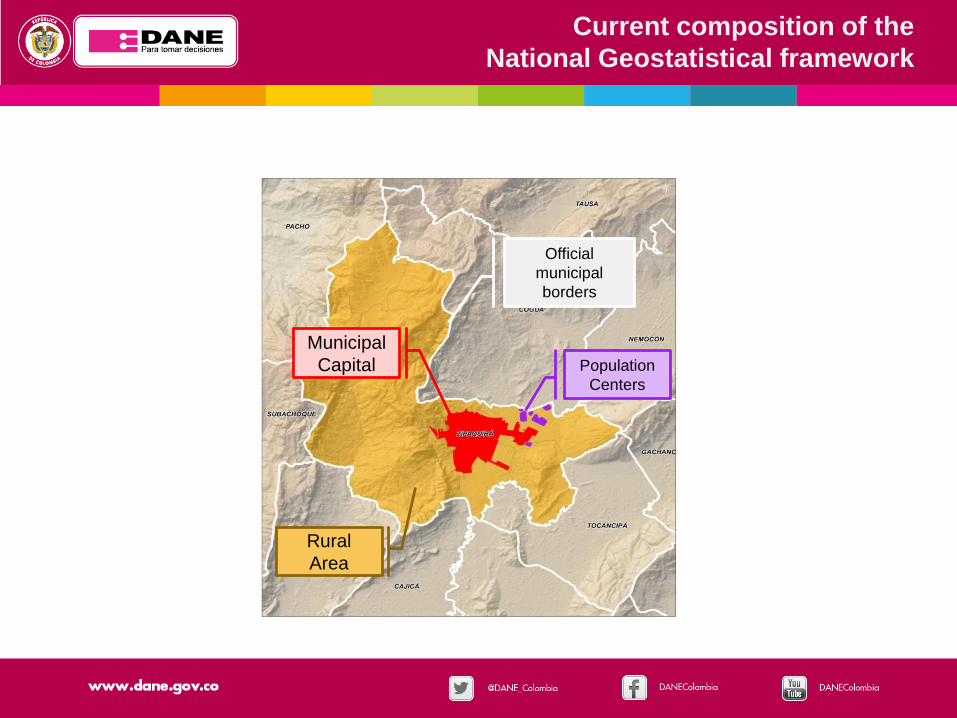
Population
Centers
Municipal
Capital
Rural
Area
Official
municipal
borders
Current composition of the
National Geostatistical framework
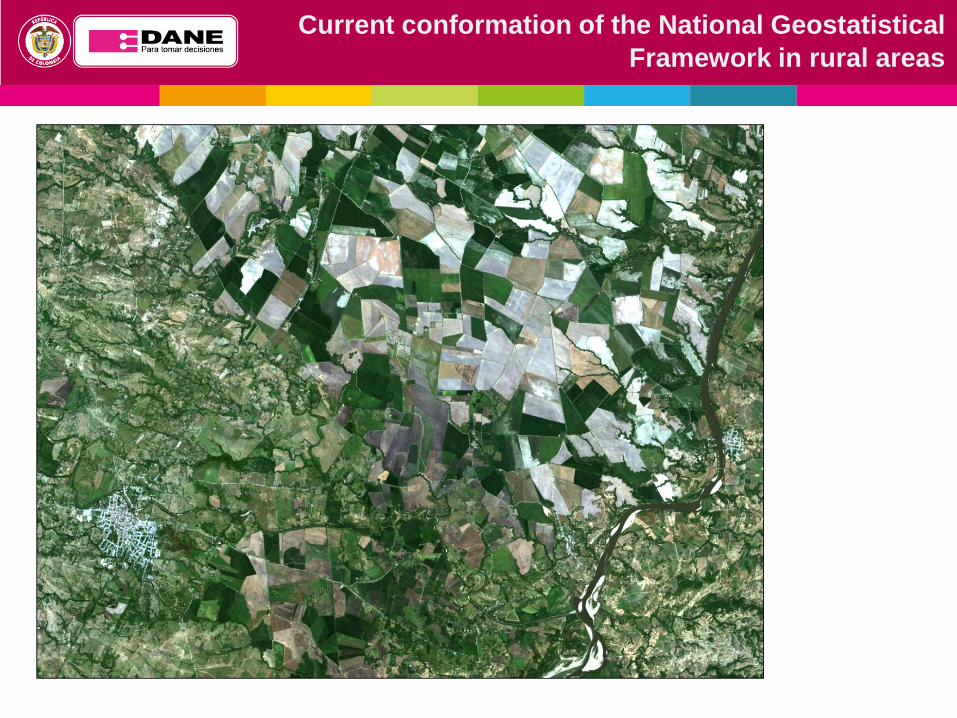
Current conformation of the National Geostatistical
Framework in rural areas

Rural
Census
Tracts
Current conformation of the National Geostatistical
Framework in rural areas

Rural
Census
Tracts
Minimum
mappeable unit
Census 2005
equivalent to
20 Km2
Current conformation of the National Geostatistical
Framework in rural areas
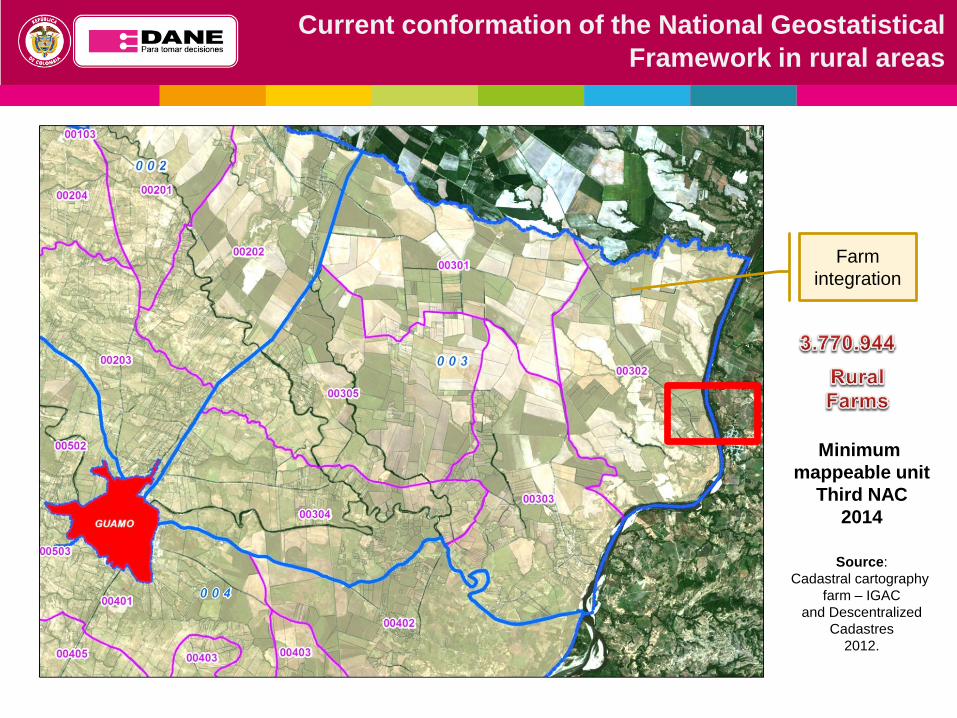
Farm
integration
Minimum
mappeable unit
Third NAC
2014
Source:
Cadastral cartography
farm – IGAC
and Descentralized
Cadastres
2012.
Current conformation of the National Geostatistical
Framework in rural areas
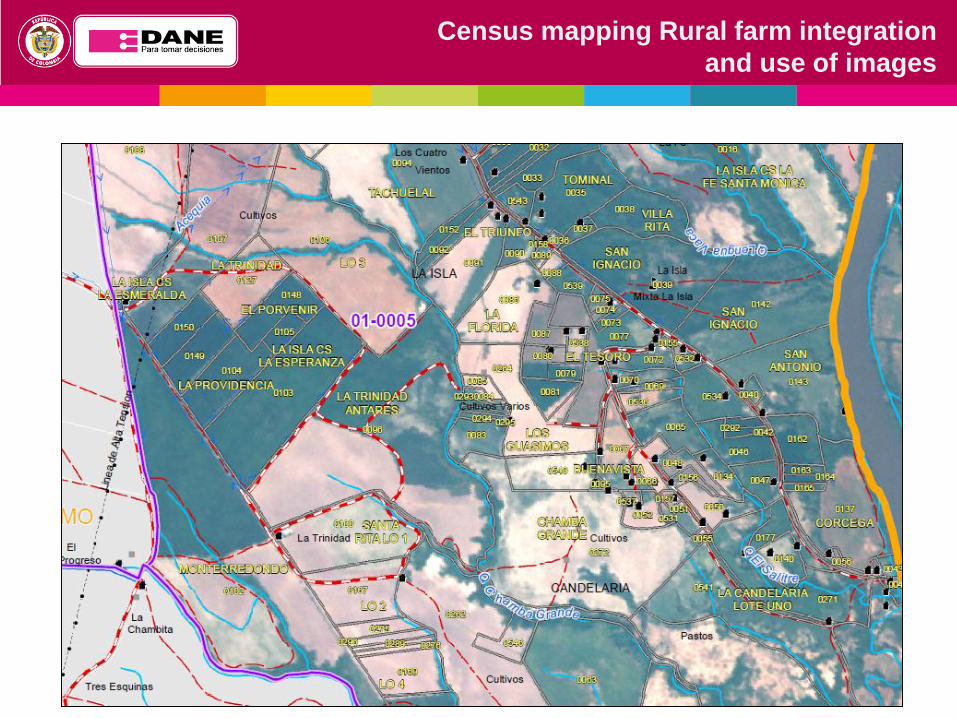
Census mapping Rural farm integration
and use of images
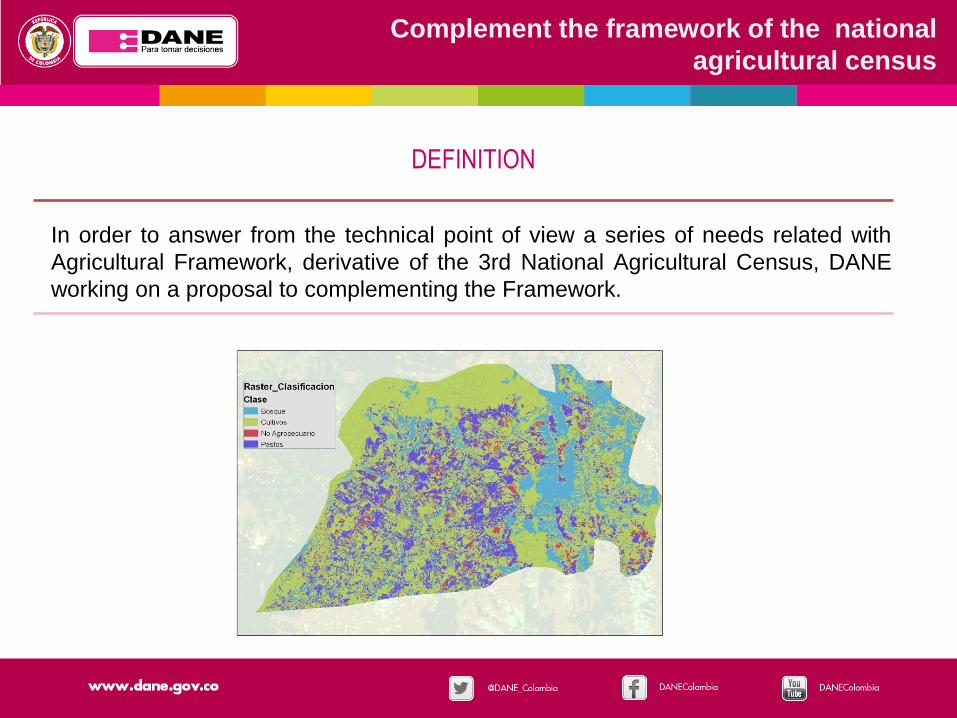
Complement the framework of the national
agricultural census
DEFINITION
In order to answer from the technical point of view a series of needs related with
Agricultural Framework, derivative of the 3rd National Agricultural Census, DANE
working on a proposal to complementing the Framework.
Complement the framework of the national
agricultural census
General Objective
Propose possible alternatives to complement the information in areas not
surveyed on the National Agropecuarian Census, based on the spatial
component and supplementary information.
Submit recommendations on the proposed alternatives.
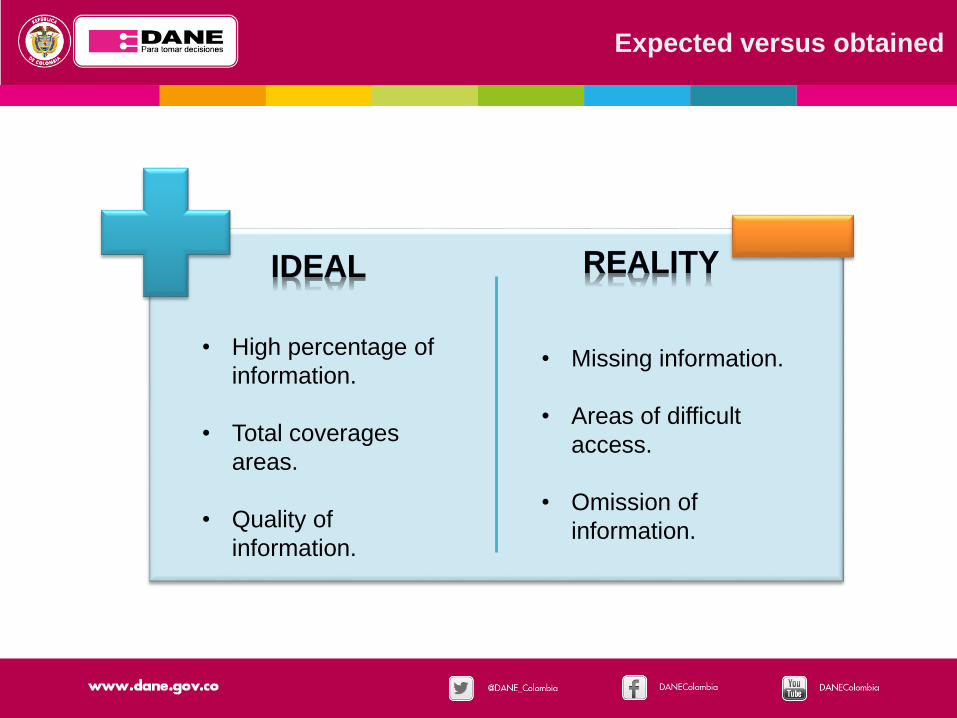
Expected versus obtained
IDEAL REALITY
• High percentage of
information.
• Total coverages
areas.
• Quality of
information.
• Missing information.
• Areas of difficult
access.
• Omission of
information.
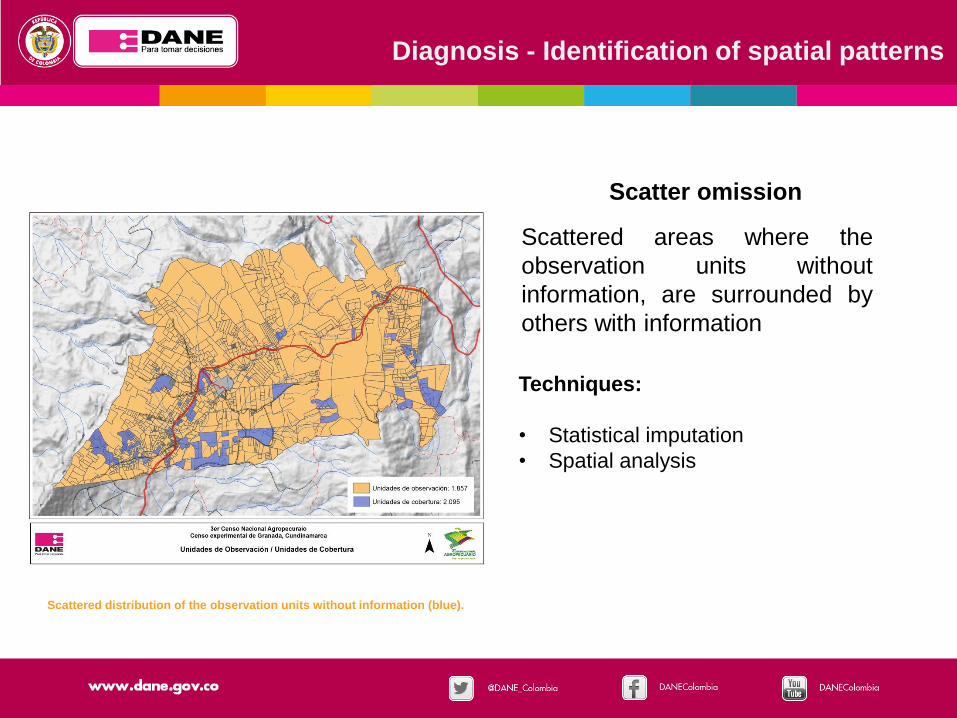
Scattered areas where the
observation units without
information, are surrounded by
others with information
Scattered distribution of the observation units without information (blue).
Techniques:
• Statistical imputation
• Spatial analysis
Scatter omission
Diagnosis - Identification of spatial patterns
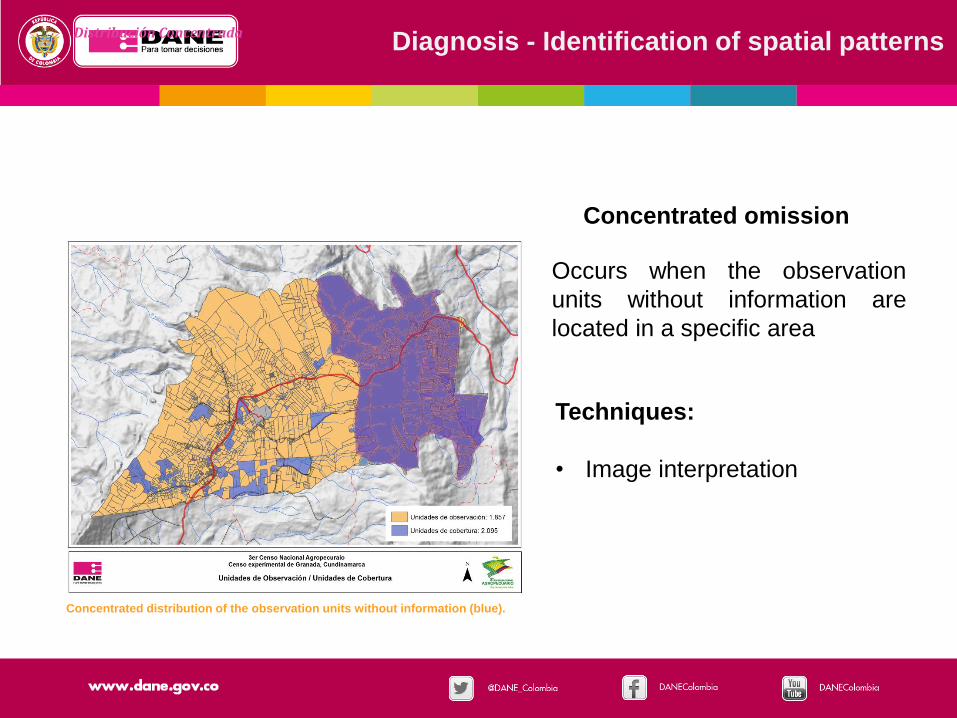
Concentrated distribution of the observation units without information (blue).
Distribución Concentrada
Occurs when the observation
units without information are
located in a specific area
Techniques:
• Image interpretation
Concentrated omission
Diagnosis - Identification of spatial patterns
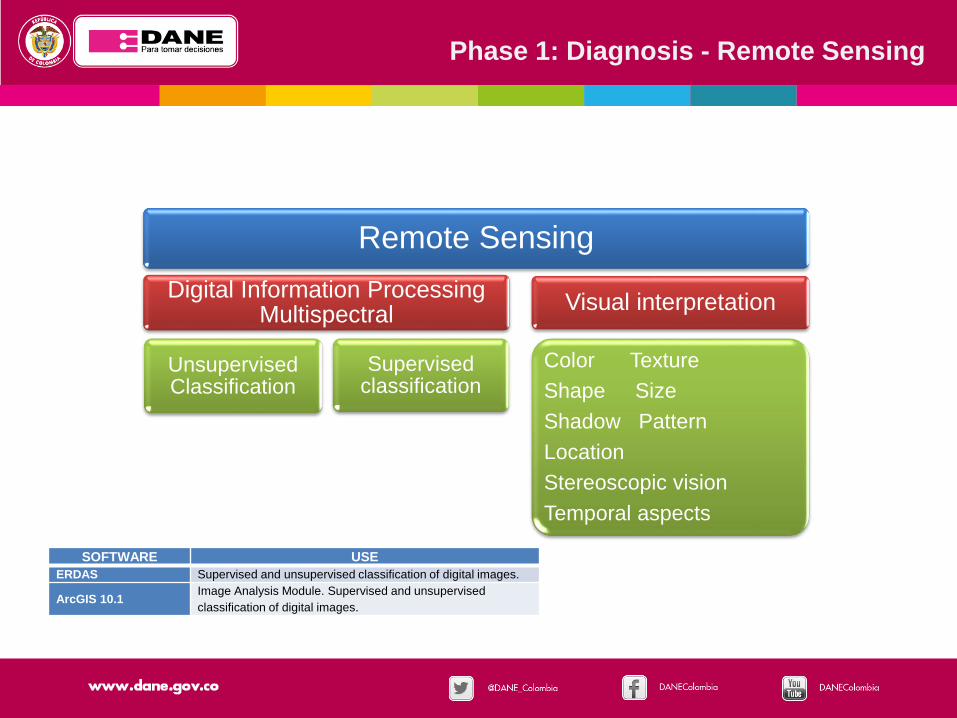
Remote Sensing
Digital Information ProcessingMultispectral
UnsupervisedClassification
Supervisedclassification
Visual interpretation
Color Texture
Shape Size
Shadow Pattern
Location
Stereoscopic vision
Temporal aspects
Phase 1: Diagnosis - Remote Sensing
SOFTWARE USE
ERDAS Supervised and unsupervised classification of digital images.
ArcGIS 10.1Image Analysis Module. Supervised and unsupervised
classification of digital images.

Multitemporal analysis. Determination of land use trends
Unsupervised classification. Testing software
Supervised classification. Determination of spectral signatures
Considered Techniques:
• Image Interpretation
Phase 2 Implementation - Remote sensing techniques
TYPE OF USE SPECTRAL
SIGN ATURE
Crop 4
Crop 5
Forests 1
Crop 6
Grassland 2
Forests 2
N onagricultural
Forests 3

(a) Ultracam Image (b) AIRPHOTO (c) SPOT
Comparison of spatial resolution of Granada images (Department of Cundinamarca)
RESULTS OBTAINED
• Allowed to extract information from images having
as main criteria the relationship of tones, colors
and spatial patterns that occur there.
• This process depends on the quality and, in
particular, the spatial resolution of the image.
Visual verification
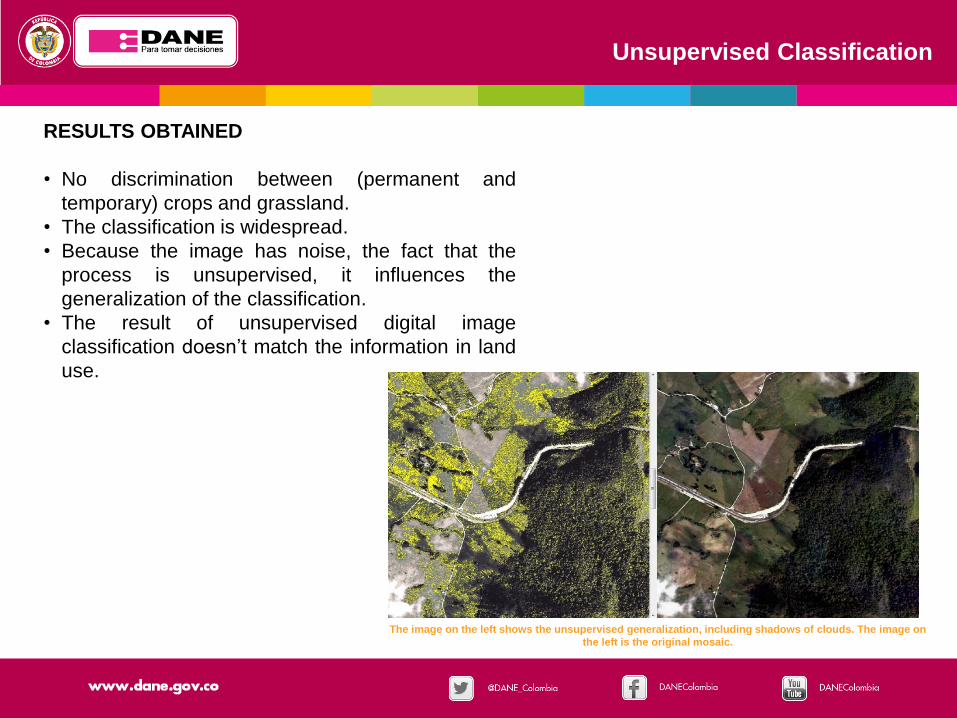
RESULTS OBTAINED
• No discrimination between (permanent and
temporary) crops and grassland.
• The classification is widespread.
• Because the image has noise, the fact that the
process is unsupervised, it influences the
generalization of the classification.
• The result of unsupervised digital image
classification doesn’t match the information in land
use.
Unsupervised Classification
The image on the left shows the unsupervised generalization, including shadows of clouds. The image on
the left is the original mosaic.
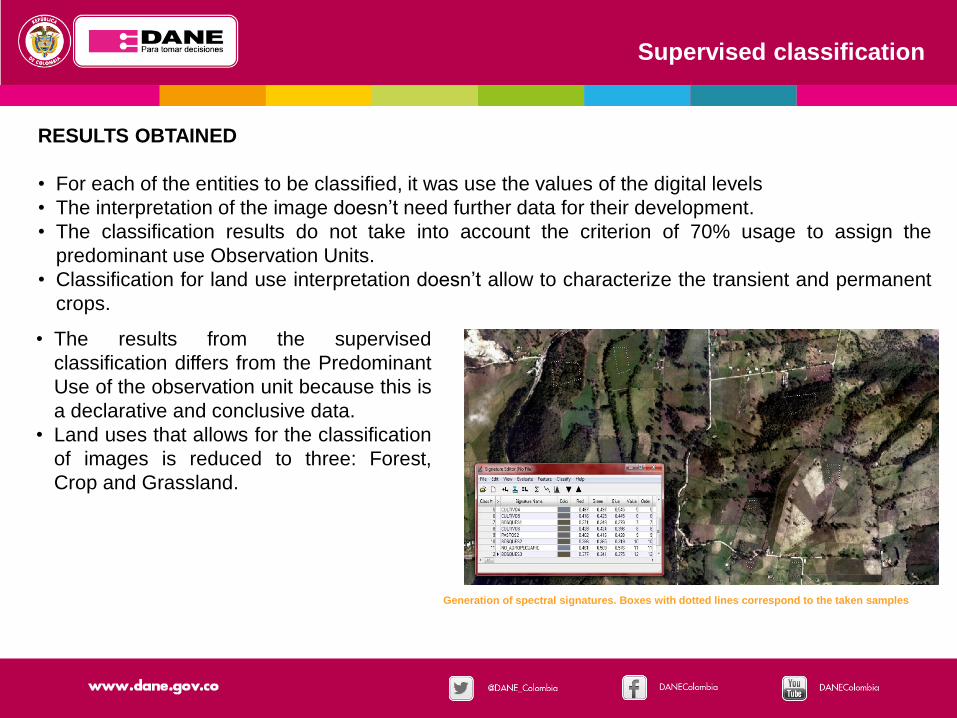
RESULTS OBTAINED
• For each of the entities to be classified, it was use the values of the digital levels
• The interpretation of the image doesn’t need further data for their development.
• The classification results do not take into account the criterion of 70% usage to assign the
predominant use Observation Units.
• Classification for land use interpretation doesn’t allow to characterize the transient and permanent
crops.
Supervised classification
Generation of spectral signatures. Boxes with dotted lines correspond to the taken samples
• The results from the supervised
classification differs from the Predominant
Use of the observation unit because this is
a declarative and conclusive data.
• Land uses that allows for the classification
of images is reduced to three: Forest,
Crop and Grassland.
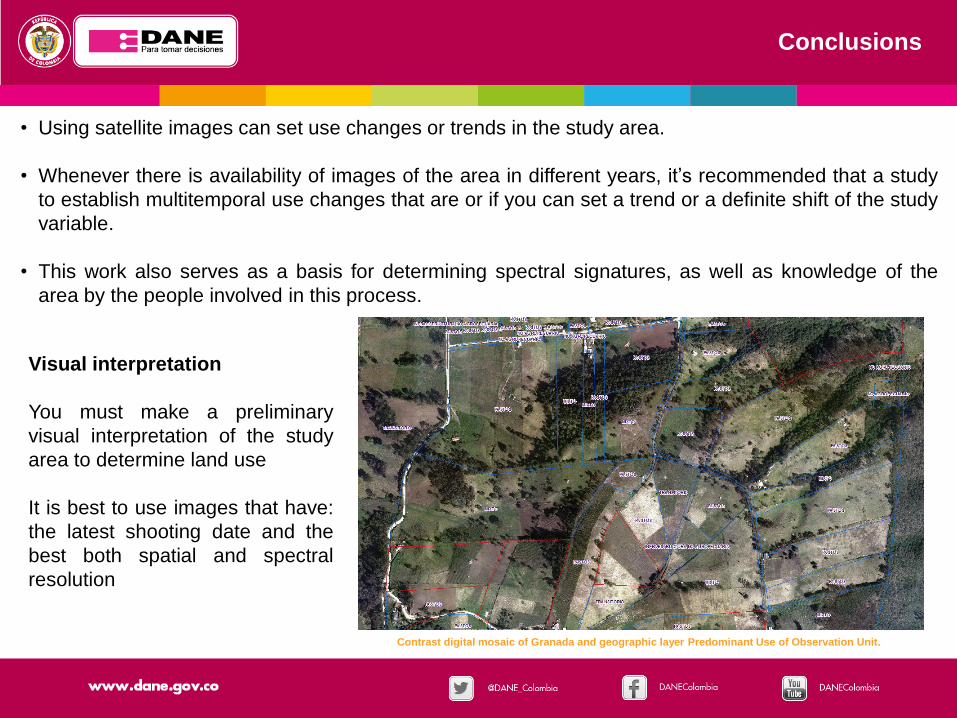
• Using satellite images can set use changes or trends in the study area.
• Whenever there is availability of images of the area in different years, it’s recommended that a study
to establish multitemporal use changes that are or if you can set a trend or a definite shift of the study
variable.
• This work also serves as a basis for determining spectral signatures, as well as knowledge of the
area by the people involved in this process.
Contrast digital mosaic of Granada and geographic layer Predominant Use of Observation Unit.
Conclusions
Visual interpretation
You must make a preliminary
visual interpretation of the study
area to determine land use
It is best to use images that have:
the latest shooting date and the
best both spatial and spectral
resolution

This image shows the result of the digital interpretation of images using the supervised
classification:
Conclusions
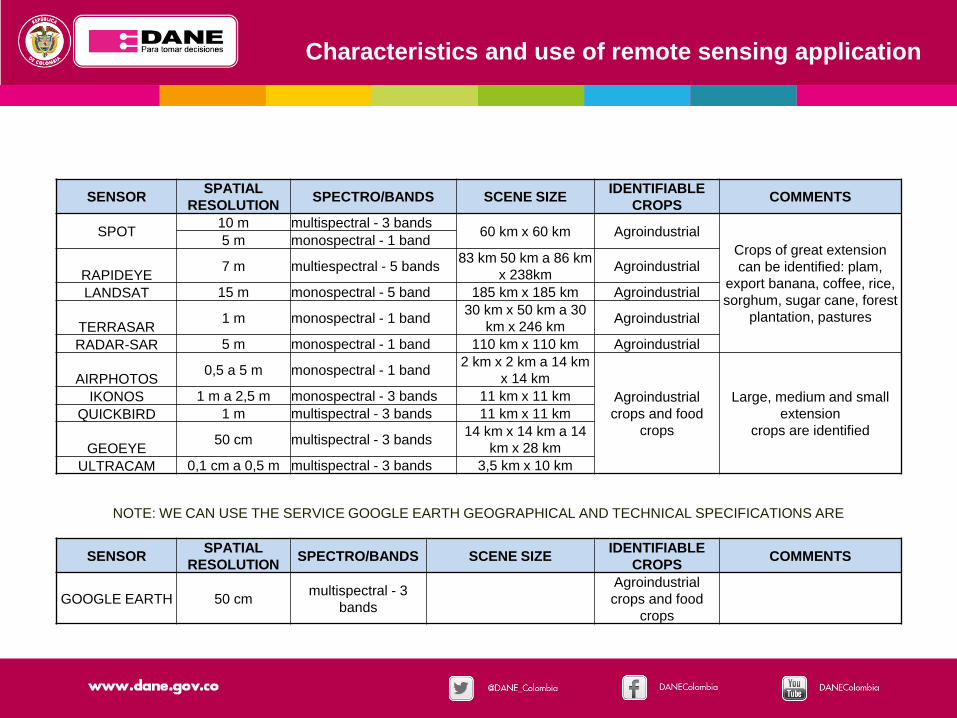
Characteristics and use of remote sensing application
SENSORSPATIAL
RESOLUTIONSPECTRO/BANDS SCENE SIZE
IDENTIFIABLE
CROPSCOMMENTS
SPOT10 m multispectral - 3 bands
60 km x 60 km Agroindustrial
Crops of great extension
can be identified: plam,
export banana, coffee, rice,
sorghum, sugar cane, forest
plantation, pastures
5 m monospectral - 1 band
RAPIDEYE7 m multiespectral - 5 bands
83 km 50 km a 86 km
x 238kmAgroindustrial
LANDSAT 15 m monospectral - 5 band 185 km x 185 km Agroindustrial
TERRASAR1 m monospectral - 1 band
30 km x 50 km a 30
km x 246 kmAgroindustrial
RADAR-SAR 5 m monospectral - 1 band 110 km x 110 km Agroindustrial
AIRPHOTOS0,5 a 5 m monospectral - 1 band
2 km x 2 km a 14 km
x 14 km
Agroindustrial
crops and food
crops
Large, medium and small
extension
crops are identified
IKONOS 1 m a 2,5 m monospectral - 3 bands 11 km x 11 km
QUICKBIRD 1 m multispectral - 3 bands 11 km x 11 km
GEOEYE50 cm multispectral - 3 bands
14 km x 14 km a 14
km x 28 km
ULTRACAM 0,1 cm a 0,5 m multispectral - 3 bands 3,5 km x 10 km
NOTE: WE CAN USE THE SERVICE GOOGLE EARTH GEOGRAPHICAL AND TECHNICAL SPECIFICATIONS ARE
SENSORSPATIAL
RESOLUTIONSPECTRO/BANDS SCENE SIZE
IDENTIFIABLE
CROPSCOMMENTS
GOOGLE EARTH 50 cmmultispectral - 3
bands
Agroindustrial
crops and food
crops


