AAPG Bulletin, v. 85, no. 2 (February 2001), pp. 295–308 295 Use of spectral gamma-ray signature to interpret stratigraphic surfaces in carbonate strata: An example from the Finnmark carbonate platform (Carboniferous–Permian), Barents Sea S. N. Ehrenberg and T. A. Sva ˚na ˚ ABSTRACT Spectral gamma-ray (GR) profiles were examined in well 7128/6-1, the stratigraphic reference section of the entirely subsurface Finn- mark carbonate platform. Detailed bulk-chemical profiling of se- lected GR peaks shows that potassium (K) and thorium (Th) are mutually correlated and are a direct index of siliciclastic (alumi- nosilicate) content, whereas uranium (U) is uncorrelated with K, Th, and all other chemical components measured. Uranium tends to be enriched in thin shale and argillaceous carbonate layers within otherwise carbonate-dominated intervals. Uranium is thus associ- ated with aluminosilicate minerals and is not particularly concen- trated in dolomite. Two types of GR peaks are observed. Potassium- thorium–dominated peaks are suggested to indicate relatively major transgressions during which aluminosilicate detritus was derived from sources interior to the Fennoscandian shield. Uranium- dominated peaks correspond with relatively minor transgressions within intervals of cyclic shallow-water carbonate deposits. Uranium-enriched aluminosilicate detritus is suggested to be the product of extended subaerial exposure of the platform, during which U was concentrated by groundwater movement. These re- sults can be useful as a basis for applying spectral GR signature as a tool for stratigraphic interpretation in uncored or incipiently un- derstood carbonate sections. Copyright 2001. The American Association of Petroleum Geologists. All rights reserved. Manuscript received August 25, 1999; revised manuscript received March 23, 2000; final acceptance June 30, 2000. AUTHORS S. N. Ehrenberg Statoil, N-4035 Stavanger, Norway; [email protected]Steve Ehrenberg has a Ph.D. from University of California–Los Angeles. He joined Statoil in 1985, where he does technical service projects in clastic and carbonate petrology. In between there is time for the occasional scientific article. T. A. Sva ˚na ˚ Statoil, Postboks 40, N-9401 Harstad, Norway; [email protected]Tore Sva ˚na ˚ received his Candidatus Scientiarium degree in geology (sedimentology) at the University of Oslo in 1984. He began his professional career as well site/operations geologist, first at Norsk Hydro and thereafter at Statoil. He has worked mainly on Barents Sea exploration, with particular emphasis on Upper Paleozoic carbonates. He has also been involved in the evaluation of Mideast opportunities, was the leader for Statoil’s former carbonate research program, and has co-authored several publications. ACKNOWLEDGEMENTS Helpful suggestions on the manuscript were contributed by L. Stemmerik, E. G. Purdy, and AAPG referees J. H. Doveton, S. C. Ruppel, and T. Elliott.
Transcript
AAPG Bulletin, v. 85, no. 2 (February 2001), pp. 295–308 295
Use of spectral gamma-raysignature to interpretstratigraphic surfaces incarbonate strata:An example from theFinnmark carbonate platform(Carboniferous–Permian),Barents SeaS. N. Ehrenberg and T. A. Svana
ABSTRACT
Spectral gamma-ray (GR) profiles were examined in well 7128/6-1,the stratigraphic reference section of the entirely subsurface Finn-mark carbonate platform. Detailed bulk-chemical profiling of se-lected GR peaks shows that potassium (K) and thorium (Th) aremutually correlated and are a direct index of siliciclastic (alumi-nosilicate) content, whereas uranium (U) is uncorrelated with K,Th, and all other chemical components measured. Uranium tendsto be enriched in thin shale and argillaceous carbonate layers withinotherwise carbonate-dominated intervals. Uranium is thus associ-ated with aluminosilicate minerals and is not particularly concen-trated in dolomite. Two types of GR peaks are observed. Potassium-thorium–dominated peaks are suggested to indicate relatively majortransgressions during which aluminosilicate detritus was derivedfrom sources interior to the Fennoscandian shield. Uranium-dominated peaks correspond with relatively minor transgressionswithin intervals of cyclic shallow-water carbonate deposits.Uranium-enriched aluminosilicate detritus is suggested to be theproduct of extended subaerial exposure of the platform, duringwhich U was concentrated by groundwater movement. These re-sults can be useful as a basis for applying spectral GR signature asa tool for stratigraphic interpretation in uncored or incipiently un-derstood carbonate sections.
Copyright �2001. The American Association of Petroleum Geologists. All rights reserved.
Manuscript received August 25, 1999; revised manuscript received March 23, 2000; final acceptanceJune 30, 2000.
AUTHORS
S. N. Ehrenberg � Statoil, N-4035Stavanger, Norway; [email protected]
Steve Ehrenberg has a Ph.D. from Universityof California–Los Angeles. He joined Statoil in1985, where he does technical service projectsin clastic and carbonate petrology. In betweenthere is time for the occasional scientificarticle.
T. A. Svana � Statoil, Postboks 40, N-9401Harstad, Norway; [email protected]
Tore Svana received his CandidatusScientiarium degree in geology(sedimentology) at the University of Oslo in1984. He began his professional career aswell site/operations geologist, first at NorskHydro and thereafter at Statoil. He hasworked mainly on Barents Sea exploration,with particular emphasis on Upper Paleozoiccarbonates. He has also been involved in theevaluation of Mideast opportunities, was theleader for Statoil’s former carbonate researchprogram, and has co-authored severalpublications.
ACKNOWLEDGEMENTS
Helpful suggestions on the manuscript werecontributed by L. Stemmerik, E. G. Purdy, andAAPG referees J. H. Doveton, S. C. Ruppel,and T. Elliott.
296 Spectral Gamma-Ray Signature in Carbonate Strata
Figure 1. Map of the Barents Sea, showing well location,boundary of Finnmark Platform, and zone of boundary disputebetween Norway and Russia (thin dashed lines).
INTRODUCTION
The natural gamma radiation of rocks is the compositeof emissions produced by isotopes of potassium (K),thorium (Th), and uranium (U) (Dypvik and Eriksen,1983). The relative contributions of these elements tothe total gamma ray (GR) log profile of a bore hole canbe differentiated by a spectral GR logging tool, andsuch patterns are commonly examined in hydrocarbonexploration wells as a means of estimating mineralogy,differentiating depositional environments, and recog-nizing significant stratigraphic surfaces (Schlumberger,1982; Davies and Elliott, 1996; North and Boering,1999). For carbonate strata, however, rather few stud-ies documenting spectral GR significance have beenpublished, although there appears to be widespreadappreciation that K and Th reflect clastic content,whereas U is determined by diagenetic processes in-volving changes in oxidation state (for example, Lucia,1999, p. 62–63). Most of the published carbonatespectral GR studies ascribe localized U enrichment tomovements of late diagenetic fluids (Hassan et al.,1975; Fertl et al., 1980; Luczaj, 1998).
The present article reports observations from anexploration well where spectral GR log patterns in car-bonate strata appear to have a distinctive relationshipto depositional facies and stratigraphic surfaces. A pro-gram of detailed analysis of several intervals containingprominent GR peaks was undertaken because it wasrealized that the recurrent spectral GR patterns asso-ciated with these peaks could yield general knowledgeuseful for interpreting stratigraphic relationships else-where. This article is part of a larger effort to providedetailed petrologic information on the Carboniferous–Permian Finnmark carbonate platform, as a basis forseismic interpretation and prospect evaluation (Ehren-berg et al., 1998a, b; 2000a, b).
STRATIGRAPHIC SETT ING
Petrologic studies have focused on well 7128/6-1 (Fig-ure 1), which is regarded as the stratigraphic referencesection for the Finnmark carbonate platform becauseof its extensive core coverage (445 m of the 527 mUpper Carboniferous through Upper Permian succes-sion) and the relatively complete stratigraphy pre-served in this location. Detailed sedimentologic anddiagenetic description of the 7128/6-1 section is pro-vided in Ehrenberg et al. (1998a, b). They define ninelithostratigraphic units (L-1 to L-9), which are inter-
preted as comprising seven major depositional se-quences (S-1 to S-7) and numerous higher frequencytransgressive-regressive cycles (Figure 2). Formal strati-graphic nomenclature has been proposed for upper Pa-leozoic strata of the Barents Sea subsurface (Larssen etal., 1999), but detailed application to individual wellsections remains uncertain and is not attempted here.
In the Late Carboniferous through the Permian,the Barents Sea was part of a vast province ofcarbonate-dominated deposition that extended fromthe Canadian arctic to northern Russia and thencesouthward to the Caspian Sea (Stemmerik and Wor-sley, 1995). The Finnmark carbonate platform is asegment of this province that is bounded to the southby the erosional subcrop onto the Fennoscandian cra-ton and to the north by a sharp increase in deposi-tional paleoslope, where platform carbonates pass lat-erally into evaporites and deep-water facies of theNordkapp Basin.
Following extension tectonism and accumulationof thick siliciclastic units in the Early Carboniferous(Visean), the Finnmark carbonate platform under-went four distinct stages of depositional evolution,which are correlated to the 7128/6-1 section asshown at the right margin of Figure 2. These stages
Ehrenberg and Svana 297
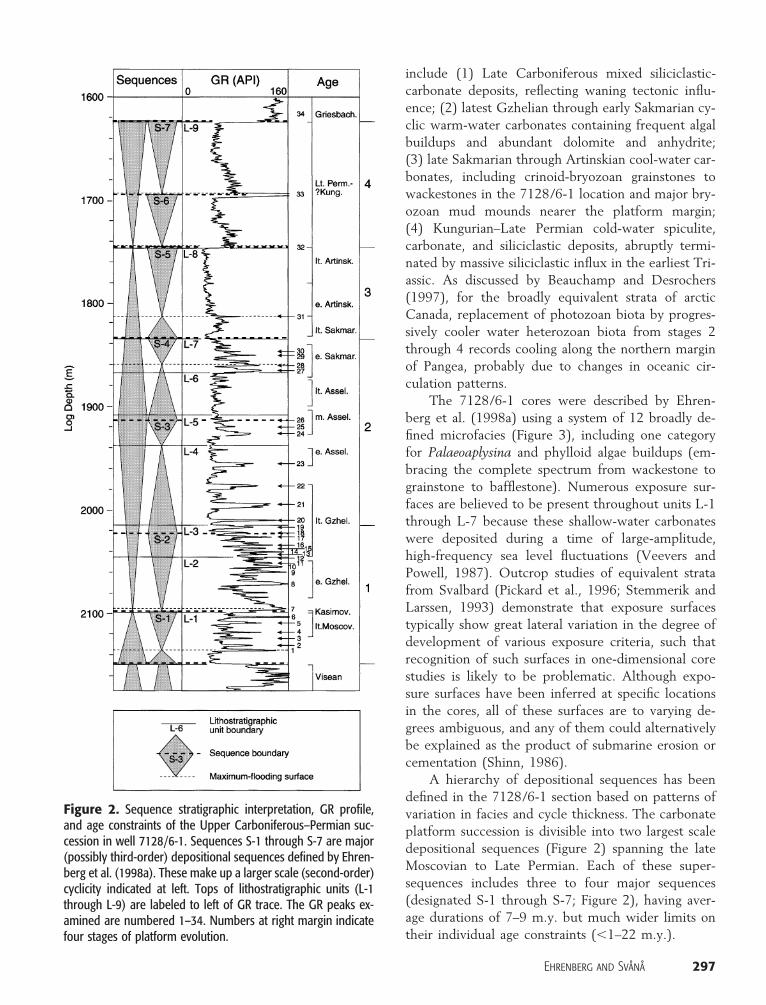
Figure 2. Sequence stratigraphic interpretation, GR profile,and age constraints of the Upper Carboniferous–Permian suc-cession in well 7128/6-1. Sequences S-1 through S-7 are major(possibly third-order) depositional sequences defined by Ehren-berg et al. (1998a). These make up a larger scale (second-order)cyclicity indicated at left. Tops of lithostratigraphic units (L-1through L-9) are labeled to left of GR trace. The GR peaks ex-amined are numbered 1–34. Numbers at right margin indicatefour stages of platform evolution.
include (1) Late Carboniferous mixed siliciclastic-carbonate deposits, reflecting waning tectonic influ-ence; (2) latest Gzhelian through early Sakmarian cy-clic warm-water carbonates containing frequent algalbuildups and abundant dolomite and anhydrite;(3) late Sakmarian through Artinskian cool-water car-bonates, including crinoid-bryozoan grainstones towackestones in the 7128/6-1 location and major bry-ozoan mud mounds nearer the platform margin;(4) Kungurian–Late Permian cold-water spiculite,carbonate, and siliciclastic deposits, abruptly termi-nated by massive siliciclastic influx in the earliest Tri-assic. As discussed by Beauchamp and Desrochers(1997), for the broadly equivalent strata of arcticCanada, replacement of photozoan biota by progres-sively cooler water heterozoan biota from stages 2through 4 records cooling along the northern marginof Pangea, probably due to changes in oceanic cir-culation patterns.
The 7128/6-1 cores were described by Ehren-berg et al. (1998a) using a system of 12 broadly de-fined microfacies (Figure 3), including one categoryfor Palaeoaplysina and phylloid algae buildups (em-bracing the complete spectrum from wackestone tograinstone to bafflestone). Numerous exposure sur-faces are believed to be present throughout units L-1through L-7 because these shallow-water carbonateswere deposited during a time of large-amplitude,high-frequency sea level fluctuations (Veevers andPowell, 1987). Outcrop studies of equivalent stratafrom Svalbard (Pickard et al., 1996; Stemmerik andLarssen, 1993) demonstrate that exposure surfacestypically show great lateral variation in the degree ofdevelopment of various exposure criteria, such thatrecognition of such surfaces in one-dimensional corestudies is likely to be problematic. Although expo-sure surfaces have been inferred at specific locationsin the cores, all of these surfaces are to varying de-grees ambiguous, and any of them could alternativelybe explained as the product of submarine erosion orcementation (Shinn, 1986).
A hierarchy of depositional sequences has beendefined in the 7128/6-1 section based on patterns ofvariation in facies and cycle thickness. The carbonateplatform succession is divisible into two largest scaledepositional sequences (Figure 2) spanning the lateMoscovian to Late Permian. Each of these super-sequences includes three to four major sequences(designated S-1 through S-7; Figure 2), having aver-age durations of 7–9 m.y. but much wider limits ontheir individual age constraints (�1–22 m.y.).
Figure 3. Spectral GR profiles of U and Th in upper part of unit L-1 and lower L-2 compared with total-GR log, lithologic descriptionof cores, and bulk chemical analyses of U and Th. The GR peak numbers (from Figure 2) and tops of lithostratigraphic unit L-1 andof sequence S-1 are indicated at left side of total-GR track. Total-GR profile recorded from slabbed core surface (dashed curve from2098 to 2105 m) shows more detail than wire-line GR log (solid curve). Plotting symbols in right-hand columns indicate samplegroupings defined in Figure 7.
Ehrenberg and Svana 299
ANALYTICAL TECHNIQUES
Careful attention has been given to accurate correc-tion between core depth (CD) and log depth (LD).These corrections are substantial in many places, andone 16 m interval of the core (2005.25–2021.60 mCD) was even found to have been mistakenly turnedupside down in the course of handling. Depth shiftswere determined mainly based on comparison be-tween the GR logs run in the well and along the sur-face of the core before slabbing. Additional adjust-ments of up to 1 m, however, were found to benecessary for several intervals where a second GR pro-file was run along the slabbed surface of the viewingcut of the core.
Wire-line logging of well 7128/6-1 was done byWestern Atlas International. Only the spectral U andTh curves were used in the present study because thespectral K curve appeared to have relatively low sen-sitivity, possibly due to the use of KCl polymer mud,and the bulk chemical data demonstrated linear cor-relation between Th and K, such that K variations areimplicit in the spectral Th curve.
Bulk chemical analyses were performed at fixed 1m spacing over most of the cored intervals and atcloser spacing around GR peaks selected for study. Allanalyses were done by XRAL, Ontario, Canada, usingtechniques described in Ehrenberg and Siring (1992).
SPECTRAL GR PATTERNS
Prominent GR peaks in the Moscovian–Upper Per-mian section of well 7128/6-1 are numbered 1–34from the base of the section upward (Figure 2). Threeintervals within the Moscovian–Sakmarian part of thesection (units L-1–L-7) were studied in detail (Figures3–5). To simplify the display of the spectral GR data,variations in K abundance have been assumed to beimplicit in the Th curve. This assumption is justifiedby the strong linear correlation observed between Kand Th in the bulk chemical analyses (Figure 6A).Only in one thin interval (discussed subsequently) isthere any marked departure from this correlation.
The GR peaks can be divided into two generaltypes based on relative spectral GR intensities.
K-Th–Dominated Peaks
The K-Th–dominated peaks occur in lithostratigraphicunits L-1, L-2, and L-7. Most of these peaks appear
to be composite, consisting of a U-rich (high-U/Th)lower part having minor to moderate total GR inten-sity, overlain by a K-Th–rich (low-U/Th) upper parthaving much greater total GR intensity. Several ofthese composite GR peaks correspond to sequence orcycle boundaries where transgressive shales overliesuspected exposure surfaces.
The best example of this is GR peak 7, whichcoincides with the top of sequence S-1 (Figure 3).This surface is interpreted as an unconformity basedpartly on truncational geometries visible on seismicand correlated to this approximate level in the well.Whether any section has been lost by erosion in thewell location, however, is unknown. Fusulinid datingsindicate a hiatus at this surface because unit L-1 is oflate Moscovian age and the basal bed of unit L-2 (at2099 m core depth) is middle Kasimovian (Figure 2).The top of unit L-1 (corresponding to the U-richlower part of GR peak 7) consists of thin cycles ofsandstone and phylloid algal buildups capped by ap-parent exposure surfaces (2099–2105 m). The bulkchemical analyses show that the high-U/Th GR re-sponse of this interval results from the cumulativecontributions of numerous thin (generally �20 cm)argillaceous carbonate beds and even thinner (�5 cm)layers of black shale within thicker (0.2–1 m) carbon-ate beds having generally low radioactivity (Figure 3).The low-U/Th upper part of GR peak 7 (2093–2099m) corresponds to an upward-coarsening interval ofshale to shaly siltstone at the base of unit L-2. Thelower meter of this interval is interpreted as contain-ing the maximum flooding surface of sequence S-2,immediately overlying the S-1 sequence boundary(Figure 2).
Similar relationships are observed for GR peak 8,where several meters of low-U/Th transgressive shaleoverlie an inferred exposure surface (cycle top) at2075 m, developed at the top of a phylloid algal-Palaeoaplysina buildup containing thin high-U/Thshale seams (Figure 3). The overlying GR peaks 9–11in the upper part of unit L-2 have similar spectral GRcharacteristics, but are not shown in the figures pre-sented here because this interval is not covered bybulk chemical analyses of U and Th.
Gamma-ray peak 27 in the lower part of unit L-7also has a composite spectral GR pattern (Figure 5)that has a dominant K-Th–rich upper zone (1864–1866 m) and a subordinate U-rich lower zone (1866–1868 m). The overlying GR peak 28 appears to havea simple K-Th–rich spectral GR log profile, but thebulk chemical analyses reveal that this peak also rests
Figure 4. Spectral GR profiles of U and Th in lower part of unit L-4 compared with total-GR log, lithologic description of cores, andbulk chemical analyses of U and Th. Total-GR profile recorded from slabbed core surface (dashed curve from 2010 to 2013 m) showsmore detail than wire-line GR log (solid curve). Plotting symbols in right-hand columns indicate sample groupings defined in Figure7. In the “Th (ppm)” column, two points that have Th � 20 ppm (group 5) are plotted with Th � 20 ppm. See Figure 3 for explanationof lithology symbols.
Ehrenberg and Svana 301
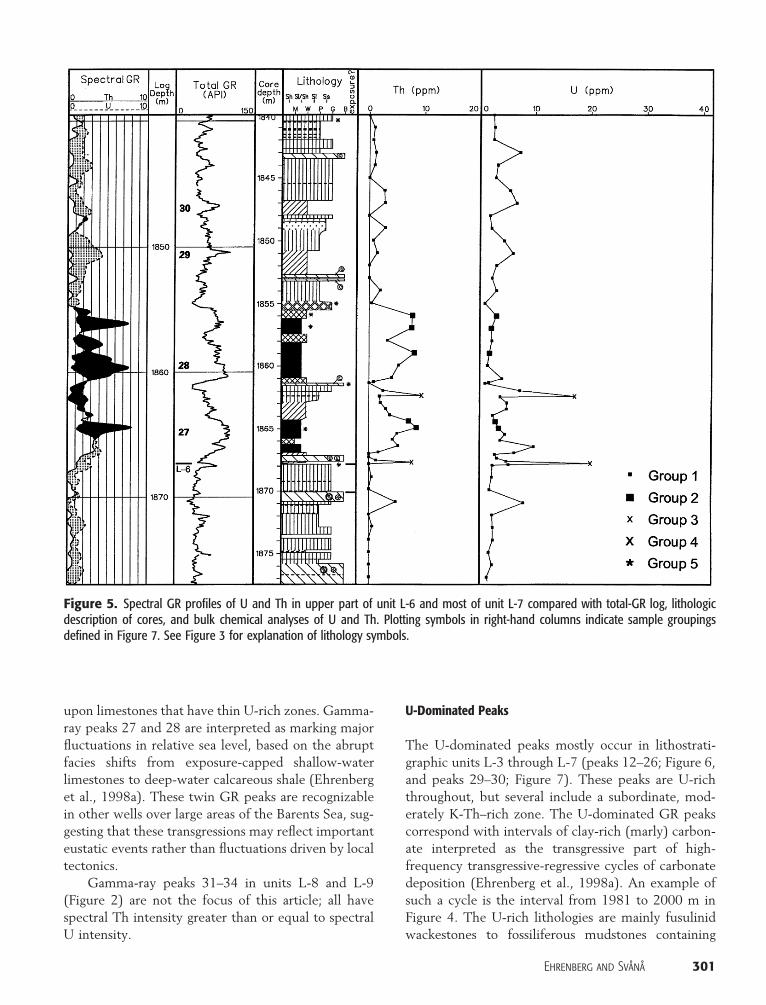
Figure 5. Spectral GR profiles of U and Th in upper part of unit L-6 and most of unit L-7 compared with total-GR log, lithologicdescription of cores, and bulk chemical analyses of U and Th. Plotting symbols in right-hand columns indicate sample groupingsdefined in Figure 7. See Figure 3 for explanation of lithology symbols.
upon limestones that have thin U-rich zones. Gamma-ray peaks 27 and 28 are interpreted as marking majorfluctuations in relative sea level, based on the abruptfacies shifts from exposure-capped shallow-waterlimestones to deep-water calcareous shale (Ehrenberget al., 1998a). These twin GR peaks are recognizablein other wells over large areas of the Barents Sea, sug-gesting that these transgressions may reflect importanteustatic events rather than fluctuations driven by localtectonics.
Gamma-ray peaks 31–34 in units L-8 and L-9(Figure 2) are not the focus of this article; all havespectral Th intensity greater than or equal to spectralU intensity.
U-Dominated Peaks
The U-dominated peaks mostly occur in lithostrati-graphic units L-3 through L-7 (peaks 12–26; Figure 6,and peaks 29–30; Figure 7). These peaks are U-richthroughout, but several include a subordinate, mod-erately K-Th–rich zone. The U-dominated GR peakscorrespond with intervals of clay-rich (marly) carbon-ate interpreted as the transgressive part of high-frequency transgressive-regressive cycles of carbonatedeposition (Ehrenberg et al., 1998a). An example ofsuch a cycle is the interval from 1981 to 2000 m inFigure 4. The U-rich lithologies are mainly fusulinidwackestones to fossiliferous mudstones containing
302 Spectral Gamma-Ray Signature in Carbonate Strata
Figure 6. Bulk-rock K vs. (A) Th and (B) alumina in Moscovian through Upper Permian samples (units L-1 through L-9) from well7128/6-1. Plotting symbols indicate sample groupings defined in Figure 7.
Figure 7. Bulk-rock U vs. Th in Moscovian through UpperPermian samples (units L-1 through L-9) from well 7128/6-1.Plotting symbols indicate the five fields of U vs. Th contentshown here (described in text). The diagonal line illustratesTh/U � 3, suggested to be a minimum detrital value for shalesthat have not experienced authigenic enrichment in U (Myersand Wignall, 1987).
abundant argillaceous laminations. The degree of do-lomitization of the U-rich intervals is widely variablebut generally low (the dolomitization log is presentedin Ehrenberg et al., 1998a).
BULK CHEMICAL COMPOSIT IONS
Abundances of K, Th, and aluminum (Al) are mutuallycorrelated in these Carboniferous–Permian strata (Fig-ure 6), as has been observed previously in other studies(Hassan et al., 1976; Schlumberger, 1982). Uraniumis uncorrelated with K, Th, and all other componentsmeasured, but it tends to be enriched in thin shale lay-ers having moderate to high K, Th, and Al (Figure 7).Low-alumina carbonate rocks immediately adjacent tothese thin U-rich shale layers tend to have low contentsof both U and Th, although a subordinate group ofthese samples has moderate U contents (12–25 ppm)(Figure 7).
Based on U and Th abundances (Figure 7),the bulk chemical analyses were subdivided intofive groups (identified by plotting symbols in Fig-ures 3–9):
Ehrenberg and Svana 303
Figure 8. Comparison of major-element composition of different U-Th sample groups. Plotting symbols indicate sample groupingsdefined in Figure 7. In terms of these and most other major-element components, U-rich and U-poor groups are not well differentiated.(A) Bulk-rock silica vs. alumina. These components define a crude triangular plot having the following end members: spiculite (high-silicon [Si] apex), shale (high-Al apex), and carbonates (low–Si-Al apex). (B) Bulk-rock calcium oxide (CaO) vs. magnesium oxide(MgO). These components define a crude triangular plot having the following end members: limestone (high-Ca apex), dolomite(high-Mg apex), and siliciclastics or spiculite (low–Ca-Mg apex).
• Group 1 (336 samples) has low U (�12 ppm) andlow Th (�6 ppm) and includes mainly limestones,dolostones, and spiculites.
• Group 2 (29 samples) has low U (�12 ppm U) andhigh Th (�6 ppm) and consists of shales and highlyargillaceous limestones.
• Group 3 (25 samples) has high U (12–40 ppm) andlow to high Th (�20 ppm).
• Group 4 (6 samples) has very high U (�40 ppm)and high Th. Both groups 3 and 4 include argilla-ceous carbonates and thin (0.5–5 cm) shale layerswithin carbonates. Groups 3 and 4 are believed tohave similar geochemical significance (unusual ura-nium enrichment) except that group 4 representsthe more extreme cases of enrichment.
• Group 5 (two samples) has very high Th (25–27ppm) and includes one calcareous shale and one ar-gillaceous limestone.
Various plots were examined to determinewhetherthere were any other bulk chemical characteristics dif-ferentiating these U-Th groupings. We were especiallyinterested to see what differences may exist correspond-
ing to the difference in U enrichment between group 2and groups 3 and 4. In terms of major element com-position, these groups each show considerable variationand mutual overlap (Figure 8) except that ratios ofboth iron/aluminum (Fe/Al) and titanium/aluminum(Ti/Al) appear to correlate with the U enrichment dif-ferentiating group 2 from groups 3 and 4 (Figure 9).
SIGNIF ICANCE OF K, Th , AND UENRICHMENT
Potassium is interpreted as a simple index of bulk al-uminosilicate content (clays, micas, and feldspars). Al-though not all aluminosilicate species are K rich, theaggregate assemblage of aluminosilicates present inthese strata is distinctly K rich. Thorium, however, isnot generally enriched in aluminosilicate minerals, butlinear correlation of Th with K is nevertheless typicalof siliciclastic strata (Schlumberger, 1982) and thus in-dicates a strong association between Th and alumino-silicates. Correlation between Th and zirconium (Zr)(Figure 10) suggests that this association may derive
304 Spectral Gamma-Ray Signature in Carbonate Strata
Figure 9. In contrast to most major elements (Figure 8), ratios of Fe and Ti to Al seem to separate U-rich from U-poor samplegroups. Plotting symbols indicate sample groupings defined in Figure 7. (A) U-enriched samples (X) tend to be lower in bulk-rockiron content (total Fe as FeO) for given alumina content compared with low-U samples (filled squares). One sample having 16% FeOhas been plotted at 6% FeO to increase plot scale. (B) U-enriched samples (X) tend to have slightly higher bulk-rock titanium forgiven alumina content compared with low-U samples (filled squares).
from the presence of Th in heavy minerals, such aszircon and monazite, which may be concentrated inlow-energy (aluminosilicate-rich) siliciclastic faciesdue to fine particle size (Hurst and Milodowski, 1996).The proposed association between heavy mineralgrains and aluminosilicates is also supported by thestrong correlation observed between alumina and Ti,Ti being concentrated mainly as detrital rutile and il-menite (Figure 9B). In previous spectral GR studies,wide variations in Th/K have been observed, havingpossible sequence stratigraphic and provenance signif-icance (Myers and Wignall, 1987; Myers and Bristow,1989; Davies and Elliott, 1996). In the present sampleset, however, there is little variation in Th/K, with thenotable exception of two Th-rich samples from GRpeak 23 (Figure 6A), the significance of which is pres-ently unknown.
Because U is typically uncorrelated with K and Th(Schlumberger, 1982; Figure 7), U content must becontrolled by other factors in addition to aluminosili-cate abundance. Based on the Th/U of an average of67 mudrocks (3.8) (Adams and Weaver, 1958) and ofthe average crust (3.5) (Adams et al., 1959), Myers and
Wignall (1987) suggested that there is a detrital(aluminosilicate-related) component of the total Ucontent of shales, which is roughly equivalent to one-third of the total Th content. They considered the frac-tion of the bulk U exceeding one-third of the Th con-tent to be authigenic U, interpreted to result fromsynsedimentary U fixation at the sediment-water in-terface due to sorption on organic matter under anoxicconditions. Nearly all of the 7128/6-1 samples, includ-ing many of the low-U Group-2 shales, have Th/U lessthan 3 (Figure 7). The average Th/U of the 398 sam-ples analyzed is 2.07/5.04 � 0.41. Thus most of theU in these Carboniferous–Permian strata is nondetritalin origin.
Uranium-enriched shales elsewhere have generallybeen interpreted as reflecting slow accumulation oforganic-rich marine sediments under deep-water,oxygen-poor conditions (Swanson, 1961; Myers andWignall, 1987; Saller et al., 1994). This seems unlikelyfor the U-rich zones in the 7128/6-1 section, however,which correspond to either thin clay layers in shallow-water carbonate facies or relatively minor transgressiveevents (shaly carbonates) that mark the basal zones of
Ehrenberg and Svana 305
Figure 10. Bulk-rock Th vs. Zr in Moscovian through UpperPermian samples (units L-1 through L-9) from well 7128/6-1.Plotting symbols indicate sample groupings defined in Figure 7.Correlation between these elements (and also correlation be-tween Th and Ti; implicit in the alumina-Ti correlation shown inFigure 9B) supports the interpretation that Th is containedmainly in heavy mineral grains, such as zircon and monazite.
high-order depositional cycles. The clearest candidatein the 7128/6-1 section for oxygen-poor conditions ofsedimentation is a 1 m zone of moderately organic-richshale (total organic carbon � 0.7–2.7 at a vitrinite re-flectance level of 0.6% Ro) at the base of unit L-9(high-GR interval 32 in Figure 2), but these sampleshave low U (3–5 ppm). Correlation between U andorganic carbon is typical of U-enriched sediments de-posited under oxygen-poor conditions (Swanson,1960; Schlumberger, 1982; Myers and Wignall, 1987).No such correlation is observed in the present data set,but this question cannot be properly evaluated at pres-ent because total organic carbon was not analyzed forany of the samples having U � 22 ppm.
Rather than marine anoxia, U-enrichment in the7128/6-1 strata appears to be associated with shallow-water carbonate environments probablyhavingoxygen-rich conditions, as indicated by near complete absenceof pyrite and many surfaces of inferred subaerial ex-posure. To account for this association, we suggestthat U may have been concentrated by groundwateroxidation-reduction processes on the exposed platformsurface during lowstands of sea level. Uranium is much
more soluble in its oxidized (VI) state than in its re-duced (IV) state, resulting in U mobility in oxidizedgroundwater followed by fixation and accumulation inthe vicinity of reducing conditions associated with de-caying organic matter (Hostetler and Garrels, 1962;Doi et al., 1975; Langmuir, 1978). Subsequent minorflooding events could then have caused reworking ofU-enriched argillaceous detritus and deposition as thinshale layers.
Larger degrees of subaerial exposure of the silici-clastic fraction contributing to the U-enriched samplesis consistent with the tendency of these samples tohave lower Fe/Al and higher Ti/Al compared with thelow-U samples (Figure 9), insofar as Fe is relatively sol-uble and Ti is relatively insoluble relative to Al duringsubaerial weathering (Gardner, 1980).
A similar model was proposed by Hoff et al. (1995,p. 226) for accumulation of U to form “hot dolostones”at a major unconformity in the Upper CarboniferousWahoo formation, Alaska. Lead isotopic dating showsthat U enrichment coincided with formation of thisunconformity in the middle Permian. As in the 7128/6-1 strata, U in the Wahoo dolostones is concentratedin thin clay-rich layers rather than in the enclosing car-bonate rock. Hassan et al. (1975) described similar re-lationships in Nummulitic Eocene limestones, Tunisia,where spectral GR signature is dominated by thin,highly U-enriched shale seams in otherwise U-poorlimestone.
Other examples of U-rich spectral GR peaks incarbonates have been suggested to result from late dia-genetic fluid movements. Fertl et al. (1980) presentedspectral GR profiles from the Cretaceous AustinChalk, Texas, where the coincidence of U-rich, K-Th–poor zones with good petroleum production charac-teristics was viewed as evidence for late diagenetic pre-cipitation of U in fractures. Luczaj (1998) showedspectral GR logs from carbonate-siliciclastic cycles ofthe lower Permian Chase Group, Kansas, where Upeaks occur within the carbonates and Th-K peaks cor-respond to siltstone-shale units, not unlike the overallpattern of U-Th-K distribution in well 7128/6-1. Uenrichment in the Chase Group, however, was inter-preted to have been a late diagenetic process related todolomitization.
PROVENANCE
Based on the preceding arguments, high U/Th com-positions in well 7128/6-1 are interpreted as reflecting
306 Spectral Gamma-Ray Signature in Carbonate Strata
derivation of aluminosilicate detritus from surfaces ofextended subaerial exposure where shallow meteoricgroundwater movements had caused U enrichment. Atthe other extreme, shales having low U/Th are viewedas the products of relatively major marine transgres-sions, during which much of the aluminosilicate detri-tus was derived from sources not affected by the pre-sumed process of subaerial U enrichment. None ofthese transgressions (at least in the inner-platform po-sition of well 7128/6-1) seem to have involved anoxicaccumulation of U-enriched organic matter, analogousto the phosphatic core shales that represent maximum-flooding events of the more principal cyclothems of themid-continent United States (Heckel, 1977; Saller etal., 1994).
The reason for the apparent lack of aluminosilicatederivation from U-enriched provenance during majortransgressions is unknown. A possible explanation isthat U mineralization took place mainly on the ex-posed platform surface, and this surface was simply notavailable as a source of aluminosilicate detritus duringmajor transgressions because it was then below sealevel. During these transgressions, detritus would havebeen derived more directly from highlands nearer theinterior of the Fennoscandian craton, where ground-water mobilization of U may have been less efficientbecause of differing hydrologic regimes. Another pos-sibility is that sea level lowstands may have been as-sociated with periods of relatively arid climate,whereas transgressions were associated with a morehumid climate, as has been documented for UpperCarboniferous–Permian cycles in the western UnitedStates (Rankey, 1997; Soreghan, 1997). Arid condi-tions could favor U mineralization due to evaporativefocusing of groundwater flow toward the surface (Raw-son, 1980).
The preceding model does not necessarily implythat there should be any fundamental difference in sili-ciclastic provenance between U-dominated and K-Th–dominated intervals. The essential difference betweenthese two categories is interpreted to be the degree ofsecondary enrichment in U, and this can be entirely afunction of residence time on the exposed platformsurface rather than the nature or location of the ter-ranes eroded to produce the siliciclastic detritus. Theabsence of any consistent difference in primary prov-enance between U-enriched and non–U-enriched in-tervals is indicated by a profile of samarium (Sm)-neodymium (Nd) isotopic analyses acquired throughthe 7128/6-1 section (Ehrenberg et al., 2000b). Shiftsin Nd provenance signature (143Nd/144Nd) appear to
have a much larger scale cyclicity than the variationbetween K-Th–rich and U-rich compositions. Unfor-tunately, however, this question can only be evaluatedrather indirectly, because none of the samples from thepresent article having especially high U/Th were se-lected for Nd isotopic analysis. Nevertheless, the Ndsample set does include samples from the K-Th–dominated transgressive shale intervals and samplesfrom adjacent carbonate intervals having U-dominatedGR peaks (sample points located between the thin U-enriched layers), and comparison of these two samplesettings does not reveal consistent differences in143Nd/144Nd.
CONCLUSIONS
Our model predicts that K-Th–dominated GR peaks,such as those that occur in units L-1, L-2, and L-7, arethe products of relatively major marine transgressions(aluminosilicate detritus derived mainly from sourcesinland of the platform surface), whereas the U-dominated GR peaks, such as those that characterizeunits L-3 through L-5, reflect more minor transgres-sions (aluminosilicate detritus derived mainly by re-working the subaerially exposed platform surface).
The composite low-U/Th over high-U/Th struc-ture of most of the K-Th–dominated GR peaks in well7128/6-1 is interpreted to indicate abrupt cycling fromminimum to maximum accommodation conditions.The basal, high-U/Th part of the GR peak reflects mul-tiple exposure and minor flooding events during latehighstand. The upper, low-U/Th part of the GR peakreflects transgression. Similar regressive-transgressiveturnaround is also represented in the U-dominated GRpeaks, but the distinctive K-Th–dominated transgres-sive shale zone is less clearly developed.
The results of this study are potentially useful forpetroleum exploration in frontier provinces wherelittle may be known about the carbonate stratapenetrated by initial drilling. Although spectral GRsignatures alone would not provide conclusiveinterpretations of depositional history, this type of evi-dence could nevertheless be of value to the overallevaluation. Uranium-dominated GR peaks should beconsidered as possibly indicating the influence of ex-tended subaerial exposure: either the presence of anexposure surface or the presence of sediment derivedby erosion and resedimentation from an exposed plat-form top. Care must be taken, however, to evaluatewhether the Finnmark Platform example is relevant to
Ehrenberg and Svana 307
other provinces and also to avoid confusing U-dominated GR signatures related to subaerial exposurewith possibly similar signatures related to deep-water anoxic sedimentation or late diagenetic fluidmovement.
REFERENCES CITED
Adams, J. A. S., and R. Weaver, 1958, Thorium-to-uranium ratio asan indicator of sedimentary process: examples of the conceptof geochemical facies: AAPG Bulletin, v. 42, p. 387–430.
Adams, J. A. S., J. K. Osmund, and J. J. W. Rogers, 1959, The geo-chemistry of uranium and thorium: Physical Chemistry of theEarth, v. 3, p. 299–328.
Beauchamp, B., and A. Desrochers, 1997, Permian warm- to verycold-water carbonates and cherts in northwest Pangea, in N. P.James and J. A. D. Clarke, eds., Cool-water carbonates: SEPMSpecial Publication 56, p. 327–347.
Davies, S. J., and T. Elliott, 1996, Spectral gamma ray characteriza-tion of high resolution sequence stratigraphy: examples fromUpper Carboniferous fluvio-deltaic systems, County Clare, Ire-land, in J. A. Howell and J. F. Aitken, eds., High resolutionsequence stratigraphy: innovations and applications: GeologicalSociety Special Publication 104, p. 25–35.
Doi, K., H. Shuichiro, and Y. Sokamaki, 1975, Uranium minerali-zation in groundwater in sedimentary rocks, Japan: EconomicGeology, v. 70, p. 628–646.
Dypvik, H., and D. Ø. Eriksen, 1983, Natural radioactivity of clasticsediments and the contributions of U, Th and K: Journal ofPetroleum Geology, v. 5, p. 409–416.
Ehrenberg, S. N., and E. Siring, 1992, Use of bulk chemical analysesin stratigraphic correlation of sandstones: an example from theStatfjord Nord field, Norwegian continental shelf: Journal ofSedimentary Petrology, v. 62, p. 318–330.
Ehrenberg, S. N., E. B. Nielsen, T. A. Svana, and L. Stemmerik,1998a, Depositional evolution of the Finnmark carbonate plat-form, Barents Sea: results from wells 7128/6-1 and 7128/4-1:Norsk Geologisk Tidsskrift, v. 78, p. 185–224.
Ehrenberg, S. N., E. B. Nielsen, T. A. Svana, and L. Stemmerik,1998b, Diagenesis and reservoir quality of the Finnmark car-bonate platform, Barents Sea: results from wells 7128/6-1 and7128/4-1: Norsk Geologisk Tidsskrift, v. 78, p. 225–251.
Ehrenberg, S. N., N. A. H. Pickard, T. A. Svana, I. Nilsson, and V. I.Davydov, 2000a, Sequence stratigraphy of the inner Finnmarkcarbonate platform (Upper Carboniferous–Permian), BarentsSea—correlation between well 7128/6-1 and the shallow IKUcores: Norsk Geologisk Tidsskrift, 80, p. 129–161.
Ehrenberg, S. N., T. A. Svana, B. Patterson, and E. W. Mearns,2000b, Neodymium isotopic profiling of carbonate platformstrata: correlation between siliciclastic provenance signatureand sequence stratigraphy: Sedimentary Geology, v. 131, p. 87–95.
Fertl, W. H., W. L. Stapp, D. B. Vaello, and W. C. Vercellino, 1980,Spectral gamma-ray logging in the Austin Chalk trend: Journalof Petroleum Technology, v. 32, p. 481–488.
Gardner, L. R., 1980, Mobilization of Al and Ti during weathering—isovolumetric chemical evidence: Chemical Geology, v. 30,p. 151–165.
Hassan, M., M. Selo, and A. Combaz, 1975, Uranium distributionand geochemistry as criteria of diagenesis in carbonate rocks:IX Congres International de Sedimentologie, Nice, France,v. 7, p. 69–75.
Hassan, M., A. Hossin, and A. Combaz, 1976, Fundamentals of thedifferential gamma ray log—interpretation technique: Societyof Professional Well Log Analysts 17th Annual Logging Sym-posium Transactions, paper H, 18 p.
Heckel, P. H., 1977, Origin of phosphatic black shale facies in Penn-sylvanian cyclothems of mid-continent North America: AAPGBulletin, v. 61, p. 1045–1068.
Hoff, J. A., J. Jameson, and G. N. Hanson, 1995, Application of Pbisotopes to the absolute timing of regional exposure events incarbonate rocks: an example from U-rich dolostones from theWahoo formation (Pennsylvanian), Prudhoe Bay, Alaska: Jour-nal of Sedimentary Research, v. A65, p. 225–233.
Hostetler, P. B., and R. M. Garrels, 1962, Transport and precipita-tion of uranium and vanadium at low temperatures, with spe-cial reference to sandstone-type uranium deposits: EconomicGeology, v. 57, p. 137–167.
Hurst, A., and Milodowski, A., 1996, Thorium distribution in someNorth Sea sandstones: implications for petrophysical evalua-tion: Petroleum Geoscience, v. 2, p. 59–68.
Langmuir, D., 1978, Uranium solution—mineral equilibria at lowtemperatures with applications to sedimentary ore deposits:Geochimica et Cosmochimica Acta, v. 42, p. 547–569.
Larssen, G. B., G. Elvebakk, L. B. Henriksen, S. E. Kristensen, I.Nilsson, T. J. Samuelsberg, and T. A. Svana, 1999, Lithostra-tigraphical nomenclature of the Upper Paleozoic rocks of thesouthwestern Barents Sea: Geonytt, January issue, p. 65.
Lucia, F. J., 1999, Carbonate reservoir characterization: Berlin,Springer-Verlag, 226 p.
Luczaj, J. A., 1998, Regional stratigraphic distribution of uranium inthe Lower Permian Chase Group carbonates of southwesternKansas: The Log Analyst, v. 39, p. 18–26.
Myers, K. J., and C. S. Bristow, 1989, Detailed sedimentology andgamma-ray log characteristics of a Namurian deltaic successionII: gamma-ray logging, in M. K. G. Whateley and K. T. Pick-ering, eds., Deltas: sites and traps for fossil fuels: GeologicalSociety Special Publication 41, p. 81–88.
Myers, K. J., and P. B. Wignall, 1987, Understanding Jurassic or-ganic-rich mudrocks—new concepts using gamma-ray spec-trometry and palaeoecology: examples from the KimmeridgeClay of Dorset and the Jet Rock of Yorkshire, in J. K. Leggetand G. G. Zuffa, eds., Marine clastic sedimentology: London,Graham and Trotman, p. 172–189.
North, C. P., and M. Boering, 1999, Spectral gamma-ray logging forfacies discrimination in mixed fluvial-eolian successions: a cau-tionary tale: AAPG Bulletin, v. 83, p. 155–169.
Pickard, N. A. H., F. Eilertsen, N.-M. Hanken, T. A. Johansen, A.,Lønøy, H. A. Nakrem, I. Nilsson, T. J. Samuelsberg, and I. D.Somerville, 1996, Stratigraphic framework of Upper Carbon-iferous (Moscovian–Kasimovian) strata in Bunsow Land, cen-tral Spitsbergen: palaeogeographic implications: Norsk Geolo-gisk Tidsskrift, v. 76, p. 169–185.
Rankey, E. C., 1997, Relations between relative changes in sea leveland climate shifts: Pennsylvanian–Permian mixed carbonate-sil-iciclastic strata, western United States: Geological Society ofAmerican Bulletin, v. 109, p. 1089–1100.
Rawson, R. R., 1980, Uranium in the Jurassic Todilto Limestone ofNew Mexico—an example of a sabkha-like deposit, in C. E.Turner-Peterson, ed., Uranium in sedimentary rocks: applica-tion of the facies concept to exploration: SEPM Short CourseNotes, p. 127–147.
Saller, A. H., J. A. D. Dickson, and S. A. Boyd, 1994, Cycle stratig-raphy and porosity in Pennsylvanian and Lower Permian shelflimestones, eastern Central Basin platform, Texas: AAPG Bul-letin, v. 78, p. 1820–1842.
Schlumberger, 1982, Natural gamma-ray spectrometry: essentials ofN. G. S. interpretation: Schlumberger, 69 p.
308 Spectral Gamma-Ray Signature in Carbonate Strata
Shinn, E. A., 1986, Modern carbonate tidal flats: their diag-nostic features: Colorado School of Mines Quarterly, v. 81,p. 7–35.
Soreghan, G. S., 1997, Walther’s Law, climate change, and UpperPaleozoic cyclostratigraphy in the Ancestral Rocky Mountains:Journal of Sedimentary Research, v. 67, p. 1001–1004.
Stemmerik, L., and G. B. Larssen, 1993, Diagenesis and porosityevolution of Lower Permian Palaeoaplysina build-ups, Bjør-nøya: an example of diagenetic response to high frequency sealevel fluctuations in an arid climate, in A. D. Horbury and A. D.Robinson, eds., Diagenesis and basin development: AAPGStudies in Geology 36, p. 199–211.
Stemmerik, L., and D. Worsley, 1995, Permian history of the BarentsSea area, in P. A. Scholle and T. M. Peryt, eds., Permian of thenorthern continents: Berlin, Springer-Verlag, p. 81–97.
Swanson, V. E., 1960, Oil yield and uranium content of black shales:U.S. Geological Survey Professional Paper 356-A, 44 p.
Swanson, V. E., 1961, Geology and geochemistry of uranium in ma-rine black shales, a review: U.S. Geological Survey ProfessionalPaper 356-C, p. 67–112.
Veevers, J. J., and C. M. C. A. Powell, 1987, Late Paleozoic glacialepisodes in Gondwanaland reflected in transgressive-regressivedepositional sequences in Euramerica: Geological Society ofAmerica Bulletin, v. 98, p. 475–487.