Heriot-Watt University Research Gateway Use of steam jet booster as an integration strategy to operate a natural gas combined cycle with post-combustion CO2 capture at part-load Citation for published version: Apan-Ortiz, JI, Sanchez Fernandez, E & González-Díaz, A 2018, 'Use of steam jet booster as an integration strategy to operate a natural gas combined cycle with post-combustion CO 2 capture at part-load', Energy, vol. 165, no. Part B, pp. 126-139. https://doi.org/10.1016/j.energy.2018.09.148 Digital Object Identifier (DOI): 10.1016/j.energy.2018.09.148 Link: Link to publication record in Heriot-Watt Research Portal Document Version: Peer reviewed version Published In: Energy General rights Copyright for the publications made accessible via Heriot-Watt Research Portal is retained by the author(s) and / or other copyright owners and it is a condition of accessing these publications that users recognise and abide by the legal requirements associated with these rights. Take down policy Heriot-Watt University has made every reasonable effort to ensure that the content in Heriot-Watt Research Portal complies with UK legislation. If you believe that the public display of this file breaches copyright please contact [email protected] providing details, and we will remove access to the work immediately and investigate your claim. Download date: 12. Oct. 2021
Transcript
Heriot-Watt University Research Gateway
Use of steam jet booster as an integration strategy to operate anatural gas combined cycle with post-combustion CO2 captureat part-load
Citation for published version:Apan-Ortiz, JI, Sanchez Fernandez, E & González-Díaz, A 2018, 'Use of steam jet booster as an integrationstrategy to operate a natural gas combined cycle with post-combustion CO
2 capture at part-load', Energy,
vol. 165, no. Part B, pp. 126-139. https://doi.org/10.1016/j.energy.2018.09.148
Digital Object Identifier (DOI):10.1016/j.energy.2018.09.148
Link:Link to publication record in Heriot-Watt Research Portal
Document Version:Peer reviewed version
Published In:Energy
General rightsCopyright for the publications made accessible via Heriot-Watt Research Portal is retained by the author(s) and /or other copyright owners and it is a condition of accessing these publications that users recognise and abide bythe legal requirements associated with these rights.
Take down policyHeriot-Watt University has made every reasonable effort to ensure that the content in Heriot-Watt ResearchPortal complies with UK legislation. If you believe that the public display of this file breaches copyright pleasecontact [email protected] providing details, and we will remove access to the work immediately andinvestigate your claim.
Use of steam jet booster as an integration strategy to operate a natural gas combined cycle with post-combustion CO2 capture at part-load
Jorge Igor Apan-Ortiza,b, Eva Sanchez-Fernándezb, Abigail González-Díazc* aUniversidad Nacional Autónoma de Mexico (UNAM), Ciudad de Mexico, Mexico
bResearch Centre for Carbon Solutions, School of Engineering & Physical Sciences, Heriot-Watt University, EH14 4AS, Edinburgh, UK
cInstituto Nacional de Electricidad y Energias Limpias, Reforma 113, col. Palmira, Cuernavaca Morelos, Mexico. C.P. 62490. [email protected]
Abstract This paper aims to evaluate the integration of the steam jet booster in a natural gas combined cycle with CO2 capture at low part-load operation. The steam ejector takes a high pressure motive steam flows in a supersonic nozzle while dragging a low pressure steam which comes from the crossover. Both flows mix into one at fixed pressure of 3.5 bar and sent to the reboiler. The results are compared with two integration alternatives: uncontrolled and controlled steam extraction control. Uncontrolled steam extraction provides better part-load performance than controlled. However, with sliding pressure, at 42.3% gas turbine load the low pressure steam turbine operates at 27% of its capacity compared with 66% when the energy plant operates without capture, this imposes a potential risk to the integrity of the turbine. When the steam ejector is integrated, there is no significant improvement in the efficiency compared with sliding pressure strategy. However, the used capacity of the low pressure steam turbine increases from 27% to 42.8%. Therefore, the use of the steam ejector represents a solution to avoid severe damage to the low pressure steam turbine, thus bringing more flexibility, and ensure that steam extraction will not impose any constraint to the energy plant with CO2 capture at part-load. Keywords: steam ejector, part-load, natural combined cycle, CO2 capture, steam extraction, control strategy Nomenclature
A1 Nozzle’s throat cross-section area A2 Injector’s nozzle outlet cross-section area A3 Diffuser’s Throat cross-section area DCC Direct Contact Cooler GHG Greenhouse Gas GT Gas Turbine HP High Pressure HRSG Heat Recovery Steam Generator IGV Inlet Guide Vanes IP Intermediate Pressure LP Low Pressure NGCC Natural Gas Combined Cycle PMV Pressure Maintaining Valve ST Steam Turbine P Pressure m Mass flow rate T Temperature TET Temperature at exhaust of the turbine TIT Temperature at inlet of the turbine w Entrainment ratio 𝛾𝛾 Heat capacity ratio 𝜂𝜂 Efficiency 𝜈𝜈 viscosity 𝜌𝜌 density
Subindex C Supply stream E Entrainment stream n nozzle P Motive stream
1. Introduction
Gas price reductions, lower capital costs, higher efficiency, and minimal SOx emissions have led to the construction of a significant number of natural gas combined cycle (NGCC) plants, which will have an important participation until 2050 in the electricity sector [Perspectives for the Energy Transition, Investment Needs for a Low-carbon Energy System, 2017]. This is of significance for countries such as UK, where a full shift from coal to natural gas has been implemented in the energy mix [BEIS report, 2016-2017], USA, and Mexico [PRODESEN 2017]. Although NGCC power plants do have relatively low carbon intensity, it is not zero and they will require CO2 capture technologies to mitigate GHG emissions due to their high participation in the electricity sector. An exponential increase in intermittent renewable energy in the electricity mix and the current installed capacity of NGCC power plants would require them to operate at part load even more frequently, as power plants have to fulfil the demand when the wind is not blowing or the sun is not shining in order to maintain the safety requirements of the electrical grid [Alcaraz-Calderon et al., 2017; Sanchez-Fernandez, et al., 2016] e.g. Mexico and UK. It is therefore necessary to evaluate and ensure continued flexibility in the operation of NGCC power plants integrated with carbon capture, which could play an important role in decarbonising the electricity grid [Sanchez-Fernandez, et al., 2016]. It is expected that the Mexican installed capacity will be increased from 63,380 MW (2018) to 130,292 MW in 2032; this increase is expected to be provided 55% by renewables and 42% by NGCC. The renewable energies will grow its share in the Mexican energy sector from 39% (2018) to 44% (2032). [PRODESEN 2018]. One important aspect that should be analysed is the integration of the capture plant with the power plant at part-load. The operating conditions of the CO2 capture plant have a strong connection with the power plant through the steam extracted from the IP/LP crossover to supply thermal energy to the reboiler. It is well-known that the pressure in the crossover drops at part-load operation. Unless measures are taken to prevent it, such as designing the steam cycle at a higher pressure than required at full load, using a pressure maintaining valve (PMV) [Kather et al., 2016] or using a steam ejector [Iron, 2013], the capture plant has to adapt to variations in steam flow and pressure at part-load [Gibbins and Crane, 2004; Lucquiaud et al., 2009]. The options suggested in literature to operate capture plants at part load differ in the steam extraction needs to maintain a pre-determined capture level (typically 90%) and, most importantly, the impact on the overall plant efficiency. For instance, [Sanchez Fernandez et al., 2016] evaluated two integration alternatives to part-load in a coal power plant: Controlled steam extraction (also referred to as fixed pressure) and uncontrolled steam extraction (known as sliding pressure). Sanchez Fernandez and co-workers show that uncontrolled steam extraction provides better part-load performance when compared to controlled extraction. On the other hand, [Kather et al., 2016] show that part-load performance with controlled extraction based on the use of PMV can be improved in new build coal power plants with high degree of heat integration. The part-load performance of conventional NGCC with carbon capture has been evaluated by [Rezazadeh et al., 2015]. The integration alternative in that study was purely sliding pressure steam extraction and the author concluded that it is viable to operate a NGCC plant with CO2 capture at part load down to 60% of the nominal load of the gas turbine with a penalty in power output and efficiency. However, to reach a part load capability below 60% GT load, a higher pressure in the crossover should be considered at design condition. [Karimi et al., 2012] analysed fixed and sliding pressure steam extraction. In order to be sure that the pressure is high enough for solvent regeneration at partial load conditions, the steam needs to be extracted at the higher pressure level at full load conditions rather than at fixed pressure strategy, resulting in a lower efficiency at full load.
3
1.1 Novelty
The original contribution of this paper is summarised as follow: 1. First, this paper consists in examining the relative merits of the use of steam jet booster compared
to fixed and sliding pressure integration strategies in a NGCC power plant to address the problem with the variation of the steam at part-load and to obtain a more flexible integration alternative when the power plant with CO2 capture operates at part-load.
2. Second, the paper evaluates how much steam extraction from the crossover could be reduced using the steam ejector in order to increase the load capacity of the LP steam turbine. Under severe low flow conditions, the LP stages will subtract net power due to windage and freewheeling causing a significant temperature rise in the materials of the rotating and stationary components. In a NGCC with CO2 capture at part-load, the used capacity of the LP steam turbine is reduced even more than without capture. For steam turbines of a NGCC the minimum stable load amounts to 22% to 40% of the maximum rated capacity [Koetzier et al., 2006; KEMA report, 2005; KEMA Report, 2004; DNV GL, 2006].
There is a lack of information relating to the incorporation of the steam jet booster in a NGCC integrated with CO2 capture at part load. [Irons, 2013] evaluated the use of the steam jet booster in a coal power plant. However, the performance using the steam jet booster was not compared to other part-load operation alternatives, such as fixed and sliding pressure.
2. Methodology
2.1 Power plant modelling
The part-load modelling of the NGCC power plant developed in this study consists of one 9FB GE gas turbine (268 MW at ISO conditions), with a Heat Recovery Steam Generator (HRSG), and one steam turbine. The flue gas exiting the gas turbine flows into a HRSG where steam is generated at subcritical pressure and feeds a single reheat steam cycle, as shown in Figure 1. Additional steam at low and intermediate pressures is generated in the HRSG in order to maximise the power output of the combined cycle. The steam cycle is designed with the capability to by-pass capture, following the guidelines highlighted in [Gibbins and Crane 2004; Chalmers et al. 2009b, Lucquiaud et al., 2009; Delarue et al. 2012]. This entails that the LP turbine swallowing capacity be designed to allow operation at full load without any CO2 capture. This design feature allows for maximum flexibility to balance power output and carbon emissions. However, strategies should be in place to operate with carbon capture at full gas turbine load and part gas turbine load, which are described in Section 2.5. The gas turbine performance is taken from Thermoflow data reported by [Gonzalez-Diaz, 2016] and validated with information from a thermal test of the 9FB published by [Ol’khovskii, G., et al., 2013]. Thermoflow is a suite of software, which includes GT PRO, GT MASTER and Thermoflex programmes. GT PRO utilises a database of gas turbines with mapped performance curves taken from the manufacturers [IEAGHG 2012]. The model for the HRSG and steam turbines of the NGCC is based on well-established modelling principles, such as Stodola's ellipse law for steam turbines, heat transfer fundamentals in the HRSG, and relevant pressure drop equations. The equation system developed from modelling principles is solved in Aspen Plus® to estimate the steady state performance at design and part-load conditions using an equation-oriented approach. In this approach, described in [Gonzalez-Diaz, 2016], the performance at full load conditions is used to estimate the characteristic parameters of the equipment, such as the Stodola's constants for the steam turbines or the heat transfer area for the heat exchangers, and subsequently used to estimate part-load performance by direct solving of the equation system.
4
Figure 1. Schematic process flow diagram of the conventional natural gas combined cycle
configuration with one 9FB GE gas turbine, one triple pressure HRSGs and one subcritical steam turbine with CO2 capture
2.1.1 Main assumptions related to the operation of the gas turbine
Main assumptions related to the operation of the gas turbine, used in this work, are shown in Figures from 2 to 5. Figure 2 shows the variation of the pressure ratio of the compressor used in this work at different mass flow for the gas turbine 9FB from Thermoflow. It is compared with information provided by [Ol’khovskii, 2013]. The reason for this difference between the two curves is because the information of the compressor 9FB given in [Ol’khovskii, 2013] is an upgraded version by General Electric; this has a higher compressor efficiency. Most new gas turbines are conservatively rated when introduced and are then periodically upgraded by their manufacturers by retrofitting new design technology [Gas turbine handbook, 2013]. In the 9FB GT the pressure ratio has been increased at the same air flow rate from 16.5 to 18. The compressor efficiency is shown in Figure 3. Figure 4 shows the path followed by the air/fuel ratio when the load of the gas turbine 9FB GE is changed from 100% to 40% and how it controls the variation of the exhaust gas temperature (TET). The air/fuel ratio of the gas turbine has an important role not only for controlling the load, but also for controlling the TET. The air/fuel ratio of this gas turbine is controlling by closing or opening the IGV.
The variation of the combustor outlet temperature or inlet gas turbine temperature (TIT) and the air/fuel ratio at different loads are shown in Figure 5. The air/fuel ratio is kept relatively constant around 46.4 (-) between 100% - 80% of the gas turbine load in order to keep the turbine inlet temperature constant. Then, the exhaust gas temperature starts increasing with decreasing load because of the reduction in the efficiency of the gas turbine. Below 80% the air/fuel ratio is increased to avoid a dramatic increment of the TET. Figure 4 shown that at approximately 50% load, the increment over the design TET is 45°C, which is in good agreement with the published data [Elmasri,
5
M., 2002; Kehlhofer R., et al, 2009]. The TET is reduced at expense of reducing the TIT, which results in a reduction of the efficiency of the gas turbine.
Figure 2. Variation of the pressure ratio at different mass flow for 9FB gas turbine compressor
[Ol’khovskii, 2013; Thermoflow, 2015]. Pressure ratio performance used in the simulation developed in Aspen Plus@ as an input data
Figure 3. Variation of the efficiency at different mass flow for 9FB gas turbine compressor. Efficiency
performance used in the simulation as an input data
Figure 4. Performance of the gas turbine using a variable inlet guide vanes (IGV) Exhaust gas
temperature (TET) and the load of the gas turbine vary with changes in the air/fuel ratio
8
10
12
14
16
18
20
350 400 450 500 550 600 650 700
Pres
sure
rat
io (-
)
Mass flow (kg/s)General electric Thermoflow
70
73
76
79
82
85
88
400 450 500 550 600 650 700
Eff
icie
ncy
com
pres
sor
(%)
Mass flow (kg/s)
560570580590600610620630640650
4546474849505152535455
40 50 60 70 80 90 100 Tem
pera
ture
exh
aust
GT
(°C
)
air
/fuel
(-)
GT load %
air/ fuel TET
Maximum temperature
6
Figure 5. Performance of the gas turbine using variable inlet guide vanes (IGV). Inlet gas
temperature (TIT) and the load of the gas turbine vary with changes in the air/fuel ratio
2.1.2 Steam turbine
Most steam turbines in combined cycle plants operate by sliding pressure operation and generally have no control stage with a nozzle group [Kehlhofer, et al., 2009; Rezazadeh et al., 2015]. The steam turbine with no extraction is defined by Equation 1 for its absorption capacity using Stodola's Law [Dixon and Hall, 2013].
�̇�𝑚�𝑇𝑇𝑖𝑖𝑖𝑖𝑃𝑃𝑖𝑖𝑖𝑖
= 𝐾𝐾�1 − �𝑃𝑃𝑜𝑜𝑜𝑜𝑜𝑜𝑃𝑃𝑖𝑖𝑖𝑖
�2
(1)
Where �̇�𝑚 is the steam mass flow [kg/s], 𝑃𝑃 is the pressure [bar], 𝑇𝑇 is the temperature [ºC] and K is the Stodola's constant for the turbine. Suffix in and out denote inlet and outlet of the steam turbine, the steam turbine could be the HP, IP, and LP. At part-load operation, the mass flow of steam generated is reduced and this equation is used to calculate the pressure drop across the turbine, and by extension the pump heads. The assumption of a constant efficiency at part-load is made in the model. [Kehlhofer, et al., 2009] indicates “At constant rotational speed, the efficiency depends only upon the enthalpy drop. In part-load no important changes occur in that drop except in the last stages. A big portion of the machine is operating at a constant efficiency" [Kehlhofer, 2009, p.367]. The LP steam turbine size is sized for operation without extraction, in order to ensure continuity of operation if the capture plant were off line.
2.1.3 HRSG
Two equations are needed to predict the behavior of all heat exchangers in the HRSG and the condenser [Rovira et al., 2010]. The first one is the energy balance between the streams, considering heat transfer by radiation and convection from the HRSG represented by Equation 2. The second equation is the heat transfer across the heat exchanger surface given by Equation 3 [Valdes et al., 2004].
𝑄𝑄 = 𝑚𝑚𝑣𝑣 (ℎ𝑣𝑣𝑜𝑜𝑜𝑜𝑜𝑜 − ℎ𝑣𝑣𝑖𝑖𝑖𝑖)= 𝑚𝑚𝑔𝑔 �ℎ𝑔𝑔𝑜𝑜𝑜𝑜𝑜𝑜 − ℎ𝑔𝑔𝑖𝑖𝑖𝑖� (2) If a counter-flow exchanger is used, the heat transfer equation allows the calculation of the product of the overall heat-transfer coefficient 𝑈𝑈 and the exchange surface A by means of a logarithmic mean temperature difference, as in Equation 3. 𝑈𝑈𝐷𝐷𝐴𝐴 is calculated at design condition and the new 𝑈𝑈𝐴𝐴 at part-load is calculated using the correlation shown in Equations 4 and 5.
Where 𝑄𝑄 heat transfer [kW], 𝑇𝑇𝑔𝑔 is the temperature gas side [K], 𝑇𝑇𝑣𝑣 is temperature vapour side [K], ℎ𝑔𝑔 Enthalpy gas side [kJ/kg], ℎ𝑣𝑣 is the enthalpy vapour side [kJ/kg], mg is the mass flow of the gas [kg/s], mv is the mass flow of the steam [kg/s], 𝑈𝑈𝐷𝐷 is the overall heat-transfer coefficient at design condition [kW/(m2·K)], 𝑈𝑈𝑜𝑜𝑜𝑜 is the overall heat-transfer coefficient at part-load [kW/(m2·K)]. Suffix in and out denote inlet and outlet of the heat exchange, and suffix D is design and op operation at part-load condition. The empirical coefficients m (gas side) and n (vapour side) depend on the geometry and the heat transfer mechanism as shown in Equations 6 and 7, and are dependent on the Nusselt number. [Steam its generation and use, 2005].
ℎ𝑣𝑣𝐷𝐷𝑖𝑖𝑘𝑘𝑣𝑣
= 0.023 �𝐷𝐷𝑖𝑖𝐺𝐺𝑣𝑣𝜇𝜇𝑣𝑣
�0.8𝑃𝑃𝑃𝑃𝑣𝑣0.33 (6)
ℎ𝑔𝑔𝐷𝐷𝑘𝑘𝑔𝑔
= 0.4 �𝐷𝐷𝐺𝐺𝑔𝑔𝜇𝜇𝑔𝑔
�0.6
𝑃𝑃𝑃𝑃𝑔𝑔0.33 (7)
Where ℎ𝑣𝑣 is the heat transfer coefficient of the steam in [W/(m2·K)],ℎ𝑔𝑔 is the heat transfer coefficient of the gas [W/(m2·K)], 𝐺𝐺𝑣𝑣 is the steam mass flux [kg/m2·s], 𝐺𝐺𝑔𝑔 is the gas mass flux [kg/(m2·s)], 𝐷𝐷𝑖𝑖 is the diameter inside the tube [m], 𝐷𝐷 is the tube diameter [m], 𝑘𝑘𝑣𝑣 is the thermal conductivity of the steam [W/(m·K)], 𝑘𝑘𝑔𝑔 is the thermal conductivity of the gas [W/(m·K)], 𝜇𝜇𝑣𝑣 is the viscosity of the steam [kg/(m·s)], 𝜇𝜇𝑔𝑔 is the viscosity of the gas [kg/(m·s)], 𝑃𝑃𝑃𝑃𝑣𝑣 is the Prandtl number steam side, 𝑃𝑃𝑃𝑃𝑔𝑔 is the Prandtl number gas side. In the evaporator, a phase transition from water to steam occurs, which means that the Equation 2 must be replaced by Equation 8.
𝑄𝑄 = 𝑚𝑚𝑣𝑣 �∆ℎ𝑓𝑓𝑔𝑔� (8)
Where ∆ℎ𝑓𝑓𝑔𝑔 is the evaporation enthalpy [kJ/kg]. The ∆ℎ𝑓𝑓𝑔𝑔 depends on the saturation pressure. The steam mass flow rate in the HRSG at part-load is calculated considering the capacity of the size of the evaporators to convert the water from saturated liquid to saturated vapor and the fact that the separation between the gas and the liquid phase in evaporators occurs through gravity. This is possible considering an additional assumption in the system: fully saturated vapour leaves the outlet of HP, IP, and LP boilers. Estimating pressure drops in the HRSG is also of importance for part-load operation. The pressure drop for each heat exchanger in the HRSG is estimated from a simple flow – pressure drop relationship given by Equation 9, where the equipment parameter is the loss coefficient k. At design condition the constant k is calculated using the pressure, temperature, and mass flow provided at full load after optimization. At part-load, k is kept constant and the calculated variable is the pressure at the outlet of the heat exchanger.
8
∆𝑝𝑝 = 𝑃𝑃𝑖𝑖𝑖𝑖 − 𝑃𝑃𝑜𝑜𝑜𝑜𝑜𝑜 = 𝑘𝑘𝑚𝑚2 �
1𝜌𝜌𝑔𝑔𝑔𝑔
+ 1𝜌𝜌𝑣𝑣𝑣𝑣𝑣𝑣
2� (9)
Where ∆𝑝𝑝 is the pressure drop of steam through the heat exchanger [Pa], m is the mass flow rate [kg/s], 𝜌𝜌𝑖𝑖𝑖𝑖 and 𝜌𝜌𝑜𝑜𝑜𝑜𝑜𝑜 are the densities at the inlet and outlet respectively [kg/m3], and k is a constant [1/m4]. The Equation 9 is also used to estimate the pressure drop from the cross-over pipe where steam is extracted for solvent regeneration to the solvent reboiler of the capture plant, which includes the pressure drop through the pipeline and de-superheater. The de-superheater is a heat exchanger that converts the steam going to the reboiler into saturation conditions. Information related to the pinch temperature and pressure losses of each heat exchanger is provided in Appendix C
2.1.4 Condenser
As the gas turbine load is reduced, the steam generation in the HRSG is reduced and less steam needs to be condensed in the condenser for a given condenser pressure. In this work the total amount of cooling water is calculated at full load to condense the saturated mixture of steam and water leaving the LP steam turbine and is kept constant at part-load. If the cooling water flow is maintained constant at part load, the vacuum is reduced even further due to a smaller pinch point in the condenser. It is also possible to regulate the cooling water flow by a regulation in the pump capacity or by shut-off one or more pumps, dependent of the number of pumps in the system [Halvorsen, 2012]. At design conditions, the condenser pressure used in this work is 48.3 mbar. This is in agreement with [Gonzalez et al, 2017] since a lower pressure would cause excessively high moisture contents causing erosion of the LP turbine last stage blades.
2.2 Steam jet booster modelling
The steam jet booster is an instrument widely used in the chemical industry, its purpose is either to mix two flows with different temperature, pressure and/or composition, or to create vacuum in a process. In this given case it is intended to mix the cross-over’s low pressure steam with a higher pressure steam extracted from another point in the NGCC. By changing the velocities and pressures of both flows after flowing through a system of nozzles and a sonic shock, steam at an intermediate pressure is delivered. The ejector is designed to deliver steam mass flow rate at the pressure needed in the reboiler at the lowest load, when the pressure in the cross-over drops considerably. A model developed by [El-Dessouky et.al. 2002; Aly, et al., 1999)] is used for designing and rating the steam jet ejector. The model consists in solving mass, energy, and momentum one-dimensional equations for compressible flow in steady state.
Assumptions considered in the design of the steam jet booster are the following:
1. The entrainment ratio 𝑤𝑤, defined in equation 10 [El-Dessouky et.al. 2002]. Higher 𝑤𝑤 is beneficial for the power plant because it means that less HP or IP steam is extracted from the power plant, thus maximizing the efficiency.
𝑤𝑤 =𝑚𝑚𝐸𝐸
𝑚𝑚𝑃𝑃 (10)
Where 𝑚𝑚𝐸𝐸 is the mass flow rate of the low pressure steam or entrainment steam (E), extracted from the cross-over, and 𝑚𝑚𝑃𝑃 is the mass flow rate of the HP steam or motive steam (P) as shown in Figure 6. A 𝑤𝑤 ≅ 2 is considered in this work based on the terms of available steam ejector vendors [GEA Wiegand GmbH; Schutte and Koerting].
9
Figure 6. Schematic of the inlets and outlet of the steam ejector applied to the plant integration. The needle valve is proposed as a way to finely tune the A1 (Nozzle’s throat cross-section area), being in
this case the effective annulus cross section area defined between the nozzle's throat body and the needle valve.
2. The ejector is designed to supply steam C at 3.5 bar. The ejector is evaluated at 40% and 50% GT load. The main reason for this is to ensure that the pressure and the mass flow required in the reboiler will be provided at low loads. It is important to note that at low loads, the pressure and the amount of steam decrease.
3. For each load, three design alternatives (F, G and H) to extract the steam for the steam jet ejector are analysed, as shown in Table 1.
Table 1.Alternatives for extracting HP steam for steam jet booster Case Design load(GT load) Point of extraction F
40% Steam at the inlet IP steam turbine
G Steam at the inlet HP steam turbine H Steam at the outlet of the HP evaporator (HPB) F
50% Steam at the inlet IP steam turbine
G Steam at the inlet HP steam turbine H Steam at the outlet of the HP evaporator (HPB)
The same equations used for the design of the ejector, described in [El-Dessouky et.al. 2002], were implemented in a different algorithm, to assess its performance given different inlet pressures. In order to deliver the required steam’s properties, the nozzle’s throat area was finely tuned using a needle valve. The needle valve moves in a linear motion, as a screw, causing the CD nozzle's throat to choke due to the decrease in the effective annulus cross-sectional area where the steam flows.
2.3 Capture plant
The Aspen Plus software (version 9) has been used to model the capture plant, which is based on the 30 wt% monoethanolamine (MEA) solvent. The applicability of Aspen Plus software to evaluate this
10
particular solvent system has been widely studied and validated at full load [Sanchez-Fernandez et al., 2014; Razi et al. 2013]. Therefore, only the approach to full load design optimisation and off-design performance are discussed here. The methodology to optimise the design of the CO2 capture plant at full load is as follows: 1. The lean solvent loading of the MEA solution is varied to find the minimum energy in the reboiler. 2. While studying the effect of different lean loading, the stripper reboiler pressure is varied to change the values of the lean loading and the temperature is kept constant at 120 ºC [Knudsen, 2011]. 3. The absorption solvent circulation rate is varied to achieve the targeted CO2 removal capacity (90%). The part-load operating strategy of the capture plant unit used in this work is summarised as follows [Mechleri et al., 2014; Sanchez-Fernandez et al., 2016]: 1. The size of the columns (height and diameter) is fixed in the model to reflect operation at off-design conditions. The heat transfer areas of all the heat exchangers in the plant are also fixed and the overall heat transfer coefficient is estimated at part-load based on correlations of Nusselt number similar to the ones discussed in section 2.1.2. 2. The optimum stripper pressure calculated in the design condition is kept fixed, since this type of operation is reported as most optimal [Sanchez-Fernandez et al., 2016] 3. The capture level of 90% at part-load is controlled by adjusting the solvent flow rate 4. At part-load the solvent side reboiler temperature falls below 120 ºC as a consequence of the pressure drop of the steam at the outlet of the IP turbine and in the crossover.
2.4 Compressor unit
The compressing plant is designed to increase the CO2 pressure from the outflow delivered by the stripper into supercritical conditions. The selected compressor is an integrally geared, 7 stages as shown in Figure 7, with intercooling into 40ºC, constant output pressure of 110 bar. The performance details and the characteristic graphs are not provided in this work, but comply with [Sanchez-Fernandez et al., 2016] based on the CAESAR Project [Energy Research Centre Of The Netherlands, 2013]. The part-load operation of the compressor train is based on optimal results of [Sanchez-Fernandez et al., 2016]:
1. Use of the variable IGV to deliver the CO2 at 110 bar. 2. In case the IGV do not meet the desired pressure, re-circulate a portion of the compressed
CO2 until the goal is achieved.
Figure 7. Selected internally geared compressor train for light transport of supercritical CO2
2.5 Part-load operation of NGCC with CO2 capture
Power generation gas turbines typically operate at part-load with varying airflow rates using inlet guide vanes (IGV). This is reported as the optimum mode to operate a NGCC plant at part-load [Kehlhofer et al., 2009] and is used in this work to decrease the gas turbine output. Since the steam cycle is designed to be able to by-pass capture, integration strategies between the power plant and the capture unit are needed for optimal operation of the power plant with capture. The strategies followed in this work are: - Controlled extraction by throttling the LP steam turbine, or fixed crossover pressure operation, and - uncontrolled extraction with a floating IP/LP crossover pressure
11
- Steam jet booster Part-load operating strategies of the various elements of NGCC power plant with carbon capture are summarised in Table 2. As shown, steam extraction strategies at part load are similar to the integration strategies at full load described above.
Table 2. List of option for part-load operation for the NGCC, CO2 capture, and compressor unit Gas turbine control Variable IGV HRSG No supplementary firing Steam cycle (Pressure, temperature) Subcritical Steam cycle control Sliding pressure Steam extraction Uncontrolled, controlled extraction, and the use of steam jet booster Capture plant Constant stripper pressure, variable reboiler Temperature and L/G
for all cases CO2 compressor IGV with CO2 recycle valve and constant pressure ratio (Pinlet and
Poutlet constant) IGV = Inlet Guide Vanes; HRSG = Heat Recovery Steam Generation; L/G = Liquid to gas ratio in the absorber; NGCC= Natural Gas Combine Cycle
3. Results and discussion
One of the comparison results of this set of simulations is the Net efficiency of the plant, which is calculated with the Equation 11.
Table 3 and 4 show the results of the optimisation of the steam ejector’s design at 40% and 50% GT load, respectively. Firstly, the steam ejector was designed at 40% GT load. The ejector was then used to bring steam to the reboiler at 50%. As shown in Table 3, the lowest efficiency penalty is presented when the HP steam for the ejector is extracted from the HP evaporator. This result is explained by the higher pressure of the HP steam at that particular location, resulting in less steam extracted. As less HP steam is extracted from the power plant, the pressure in the cross-over is higher too. Less mass flow of the HP steam extracted from the power plant means less penalization.
When the steam ejector is designed at 40% GT load and operated at 50% GT load, the operating pressure of the motive-steam is higher than the designed one. As a consequence, more steam expands across the nozzle, choking the diffuser throat and increasing the delivered pressure [Graham Corporation, 2018]. For this particular application, such increase is not undesirable. However, the ejector fails to meet the mass flow required by the reboiler given the conditions at 50% load. To increase the flow to the desired level the needle valve is opened to allow more steam into the ejector.
When the steam ejector is designed at 50% GT load and operated at 40%, the pressure of the motive-steam is lower than the designed pressure. Based on [Graham corporation, 2018], operating at lower pressure than design motive-steam pressure caused poor ejector performance. If the pressure falls below design pressure, then the motive nozzle will pass less steam, which is actually beneficial for this application since the reboiler requires less steam at 40%. However, the ejector does not have enough energy to entrain and compress a suction load to the designed discharge pressure (which in all cases is 3.5 bar). Steam pressure and temperature lower than design values increases the specific volume of the motive steam and reduces the amount of steam through a motive nozzle. One of the correcting actions is to permit the passage of more steam through the nozzle, which is possible by opening the needle valve. Since the pressures PP and PE are fixed by the NGCC and the other geometrical factors of the ejector are fixed, to deliver the required additional steam to bring 3.5 bar, the needle valve is opened to increase the amount of steam. This is in agreement with the results shown in tables 3 and 4, and with the physics of isentropic compressible flow expansion in nozzles [NASA, El-Dessouky et.al. 2002; Aly, et al., 1999)].
12
As can be seen in Table 3, the efficiency penalty is lower when the steam jet booster is designed at 40% GT load and operated at higher GT load. When the ejector designed at 50% is operated at 40% it draws an unnecessary extra amount of HP steam from the NGCC in order to meet the 3.5 bar PC pressure, which is what makes the difference of 1.44 points % of penalization between the ejector designed at 40% and 50% GT load. It is important to note that with the ejector; the discharge pressure at both loads is kept at minimum 3.5 bar. The results of the steam ejector designed at 40% and at 50% GT load are compared based in H extraction location since it is the most efficient.
Table 3. Results of the steam jet booster designed at 40% load, operating at 50% GT load for the three alternatives of HP steam extraction (motive steam)
Cas
e Efficiency Penalty % point
Motive mass flow [kg/s]
mC1
[kg/s] PP
[bar] PE
[bar] PC
[bar] A12
[m²] A23
[m²] A34
[m²]
Needle valve
opening [m²]
Des
ign
at 4
0% F 11.13 19.04 36.27 19.4 1.9 3.5 0.0073 0.0290 0.1183 NA
G 10.95 12.07 36.27 91.1 2.3 3.5 0.0011 0.0127 0.1263 NA H 9.98 11.81 36.27 84.3 2.4 3.5 0.0011 0.0127 0.1266 NA
H 9.59 13.09 40.40 92.5 2.7 3.8 0.0011 0.0127 0.1266 1.88E-05 1Mass flow at the outlet of the ejector 2Nozzle’s throat cross-section area 3Injector’s nozzle outlet cross-section area 4Diffuser’s Throat cross-section area
Table 4.Results of the steam jet booster designed at 50% load, operating at 40% GT load, with steam
extraction at point H
Cas
e Efficiency Penalty (% point)
Motive mass flow [kg/s]
mC1
[kg/s] PP
[bar] PE
[bar] PC
[bar] A12
[m²] A23
[m²] A34
[m²]
Needle valve
opening [m²]
Design at 50% H 9.58 12.9 40.40 92.8 2.7 3.5 0.0011 0.0142 0.1462
Operation at 40% H 11.42 13.98 44.47 82.6 2.4 3.5 0.0011 0.0142 0.1462 2.36E-04
1Mass flow at the outlet of the ejector 2Nozzle’s throat cross-section area 3Injector’s nozzle outlet cross-section area 4Diffuser’s Throat cross-section area The steam jet booster integrated to a NGCC with CO2 capture and extracting the motive-steam at the outlet of the HP evaporator (HPB), which represents the optimum alternative, is shown in Figure 8.
13
Figure 8. Steam jet booster integrated in the NGCC with CO2 capture, and extracting the motive-
steam at the outlet of the HP evaporator (HPB)
Once the ejector is designed and its operating parameters are defined, the results of the NGCC with CO2 capture and with integrated steam jet booster were compared with other alternatives: fixed and sliding pressure. Key performance indicators for part load operation of a NGCC with CO2 capture are described in Table 5 for controlled steam extraction (fixed pressure). In this study, the steam pressure in the reboiler was selected at 3 bar, taking into account the pressure losses from the extraction point in the crossover, which is maintained at 4 bar at part-load. The net power output decreases from 368.7 MW to 179.6 MW and the efficiency of the cycle from 47.8% to 39.8% when the GT load varies from 100% to 42.3% as shown in Figures 9 and 10. Compared with uncontrolled steam extraction or sliding pressure, the total power output varies from 368.7 MW to 182.64 MW and the efficiency from 47.8% to 40.2% as shown in Table 7. The main reason for the penalization is because the pressure is fixed at the outlet of the IP steam turbine and thus does not allow more expansion on the IP. According to our results, uncontrolled steam extraction (or floating pressure integration) provides better part-load performance compared to control by throttling (fixed pressure), which is in good agreement with the findings of [Karimi et al., 2012, and Sanchez-Fernandez et al., 2016]. Although fixed pressure represents higher penalization, less steam is extracted from the crossover because the reboiler duty is marginally reduced when comparing fixed versus sliding pressure approaches. The reboiler duty is marginally reduced because of the effect of the constant steam pressure in the reboiler at 3 bar at different load. With fixed pressure at 50%, the steam extracted for the capture plant is 36.1 kg/s and with sliding pressure, the steam extracted increases 13% because the pressure drops at part-load, lower pressure leads to reduced steam quality that leads to a reduction in reboiler temperature eventually leading to higher specific energy consumption due to a less favourable equilibrium. One important issue for a power plant with CO2 capture at part-load is the reduction in steam extraction pressure for solvent regeneration; the pressure varies from 4 bar to 2.71 bar in the cross-over at 100% and 42.3% respectively. In addition, lower steam generation in the HRSG, which happens at part-load, reduces the flow rate across the combined cycle and all operating steam pressures. This affects the operation of the capture plant as a result of the change in steam conditions for regenerating the amine.
14
The steam ejector integrates the NGCC and the capture plant between 51.5% and 42.3% GT load, when the steam in the cross-over is reduced significantly; at higher loads it is bypassed, operating at normal sliding pressure. Results are shown in Table 7. Although the reboiler duty is reduced from 4.57 GJ/tonCO2 (sliding pressure) to 3.98 GJ/tonCO2 (with steam jet booster), there is no significant improvement in the efficiency compared with the sliding pressure case because the contribution of the steam turbine to the overall efficiency is minimal, as shown in Figures 9 and 10. However, the total steam extracted from the power plant is 36.27 kg/s (mixture of HP and crossover’s steam) and from the crossover alone it is 24.46 kg/s, less than fixed and sliding pressure strategy. In the case of the NGCC with CO2 capture at 42.3% GT load, the steam mass flowing to the LP steam turbine is 69.51 kg/s (64.8% of its capacity) while with fixed pressure it goes down to 30% and with sliding pressure 27.6%, the steam ejector increases it to 35.8%. At load levels below 25% (with respect to full-load limits); steam turbines may experience undesirable damage [Cotton, 1994]. Under severe low flow conditions, the LP stages will subtract net power due to windage and freewheeling causing a significant temperature rise in the materials of the rotating and stationary components. Information of the allowable minimum steam flow steam turbine is commercial in confidence and is not provided by manufacturers in the public domain. Contrary to sliding pressure, the use of the steam ejector moves away the operation of the LP turbine from hazardous steam flow conditions [Moelling et. al, 2015], thus avoiding severe damage of the equipment. The ejector would ensure that the NGCC provides enough steam for the capture plant at low load, without damaging the LP steam turbine, which improves the flexibility of the NGCC with CO2 capture at off-design.
Table 5. Summary of key parameters of a NGCC with controlled steam extraction (fixed pressure) integration alternative with CO2 capture (90% capture)
GT Load [%] 100 80 70.5 51.5 42.3 Cycle load [%] 87.5 72.8 65.5 50.2 42.3 Net Power output [MW] 368.85 306.71 276.56 212.49 179.78 GT power [MW] 267.86 214.13 188.74 138.02 113.39 NET efficiency w/o capture [%] 56.34 54.72 53.91 51.81 50.46 NET efficiency w capture [%] 47.8 45.8 44.9 41.8 39.8 Crossover pressure [bar] 4.00 4.00 4.00 4.00 4.00 Total steam to the LP steam turbine [kg/s] 44.38 41.26 40.1 34.72 31.4 Crossover temp [°C] 278.93 299.46 307.09 326.36 338.49 Power consumption compressor [MW] 10.67 9.37 8.64 8.50 8.42 Gas composition [mol fraction]
Table 6. Summary of key parameters of a NGCC with uncontrolled steam extraction (sliding pressure) integration alternative with CO2 capture (90% capture)
GT Load [%] 100 80 70.5 51.5 42.3 Cycle load [%] 84.9 71.0 64.1 48.9 40.7 Net Power output [MW] 368.68 309.09 279.42 216.26 182.64 GT power [MW] 267.86 214.13 188.74 138.02 113.39 NET efficiency w/o capture [%] 56.34 54.72 53.91 51.81 50.46 NET efficiency w capture [%] 47.8 46.2 45.4 42.5 40.2 Crossover pressure [bar] 4.00 3.71 3.50 3.00 2.71 Total steam to the LP steam turbine[kg/s] 44.35 42.26 40.54 34.54 28.71 Crossover temp [°C] 278.93 285.76 285.59 285.07 284.98 Power consumption compressor [MW] 10.67 9.40 8.76 8.95 9.36 Gas composition [mol fraction]
Table 7. Summary of key parameters of a NGCC with steam jet booster integration alternative with
CO2 capture (90% capture) GT Load [%] 100 80 70.5 51.5 42.3 Cycle load [%] 84.9 71.0 64.1 48.6 41.0 Net Power output [MW] 368.76 309.23 279.56 214.43 182.63 GT power [MW] 267.86 214.13 188.74 138.02 113.39 NET efficiency [%] 47.8 46.2 45.4 42.2 40.5 Crossover pressure [bar] 4.068 3.71 3.50 3.00 2.71 Total steam to the LP steam turbine [kg/s] 44.35 42.26 40.54 41.05 37.27 Crossover temp [°C] 278.93 285.76 285.59 285.07 284.98 Power consumption compressor [MW] 10.67 9.40 8.76 8.50 8.42 Gas composition [mol fraction]
- H2O - N2 - O2 - CO2
0.054 0.746 0.142 0.058
0.053 0.746 0.143 0.058
0.053 0.746 0.143 0.058
0.052 0.747 0.146 0.055
0.050 0.747 0.149 0.053
Flue gas flow [kg/s] 662.33 574.98 530.59 449.02 410.57 Flue gas temp [°C] 110.69 110.94 111.15 111.52 112.13 Total steam extracted (mixture HP and crossover steam) [kg/s] 59.8 52.67 49.04 40.4 36.27 Crossover steam extracted [kg/s] 59.8 52.67 49.04 27.31 24.46 Reboiler temp [°C] 120.0 119.2 117.4 119.1 118.9 Reboiler steam press [bar] 3 2.87 2.73 3.01 3.00 Stripper top pressure [bar] 1.87 1.87 1.77 1.87 1.87 Lean solvent mass flow rate [kg/s] per train 429 420 405 322 300 Lean loading [molCO2/molMEA] 0.272 0.289 0.294 0.290 0.295 Rich loading [molCO2/molMEA] 0.457 0.453 0.451 0.451 0.447 CO2 mass flow to pipeline [kg/s] 35.15 30.44 27.99 22.84 20.08 Reboiler duty [kW] 64714 57143 53332 43752 39275 L/G ratio [mol/mol] 1.51 1.70 1.77 1.66 1.69 Specific reboiler duty [GJ/tonCO2] 3.75 3.82 3.88 3.90 3.98 Total PCC auxiliary power consumption [MW] 8.57 7.50 6.98 5.88 5.41
16
Figure 9.Variation of the efficiency of the NGCC with and without CO2 capture for different
integration strategies at different gas turbine load.
Figure 10. Variation of the net efficiency of the NGCC with and without CO2 capture for different
integration strategies at different load cycle
4. Conclusion
Three strategy alternatives for the integration of a NGCC with CO2 capture were analysed in this work: Fixed pressure, sliding pressure and the use of steam jet booster. Uncontrolled steam extraction (sliding pressure) provides better part-load performance compared to control by throttling (fixed pressure). However, with sliding pressure, the LP steam turbine operates at 27% of its capacity. It is unusual to operate a steam turbine at load levels below the typical 25% of its capacity because it may experience undesirable damage. When the steam jet booster is integrated, the steam extracted from the crossover is reduced from 40.8 kg/s (sliding pressure) and 31.1 kg/s (fixed pressure) to 24.46 kg/s at 42.3% GT load. Considering that the total steam in the crossover at that load is 69.5 kg/s, the LP steam turbine increases its operation
capacity from 27% (sliding pressure) and 31.6% (fixed pressure) to 42.8%. Therefore, the use of the steam jet booster could avoid severe damage in the last blades of the LP steam turbine because it reduces the amount of steam extracted from the crossover. This could justify the use of the ejector. With the incorporation of the ejector, there is no significant improvement in the efficiency compared with the sliding pressure strategy. However, the steam jet booster brings more flexibility to the NGCC with CO2 capture to operate at low loads i.e. 42.3% GT, as previously mentioned. The use of ejector can ensure that steam extraction from the crossover will not impose any constraint on the operation of the NGCC with CO2 capture at low loads. Considering that the total steam in the crossover at that load is 69.5 kg/s (67% of the designed LP turbine capacity), the LP steam flow is increased from 28.71% (sliding pressure) and 30% (fixed pressure) to 36% (ejector). Therefore, the use of the steam jet booster diminishes the possibility of severe damage in the blades of the LP steam turbine because it increases its amount of steam mass flow. In an energetic frame of analysis, this justifies the use of the ejector.
Acknowledgements
The authors would like to thank the Mexican National Council for Science and Technology (CONACyT) and Mexican and Applied Sciences and Technology Institute (ICAT UNAM) for financial support to Jorge Igor Apan Ortiz.
References
1. Alcaraz-Calderón, A., González-Díaz, M.O., Méndez, A., Gonzalez-Santalo, J., Gonzalez-Díaz, A., 2017. Natural gas combined cycle with exhaust gas recirculation and CO2 capture at part-load operation. Journal of the Energy Institute (2017) https://doi.org/10.1016/j.joei.2017.12.007
2. Aly, N. H., Karameldin, A., and Shamloul, M. (1999). Modelling and simulation of steam jet ejectors. Desalination, 123(1):1–8.
3. BEIS Annual Report and Accounts 2016-17 https://www.gov.uk/government/publications/beis-annual-report-and-accounts-2016-to-2017
4. Chalmers, H., Lucquiaud, M., Gibbins, J., Leach, M., 2009b. Flexible Operation of Coal Fired Power Plants with Postcombustion Capture of Carbon Dioxide. J. Environ. Eng. 135, 449–458.
5. Delarue, E., Martens, P., D’haeseleer, W., 2012. Market opportunities for power plants with post-combustion carbon capture. Int. J. Greenh. Gas Control 6, 12–20
6. Dixon, S. L. and Hall, C. (2013). Fluid mechanics and thermodynamics of turbomachinery.Butterworth-Heinemann.
8. El-Dessouky, H., Ettouney, H., Alatiqi, I., and Al-Nuwaibit, G. (2002). Evaluation of steam jet ejectors. Chemical Engineering and Processing: Process Intensification, 41(6):551–561.
9. GEA Wiegand GmbH. (n.d.). ÜberschlägigeBerechnungeinerDampfstrahl-Vakuumpumpe. Retrieved April 16, 2018, from http://83.169.19.56/jetpump/jetpump_en.jsp?p1=92.7792&t1=307&MW=99650&ML=&p0=2500&t0=290&p=3500
10. Gibbins, J. R., Crane, R.I., 2004. Scope for reductions in the cost of CO2 capture using flue gas scrubbing with amine solvents. Proceedings of the institution of mechanical engineers, part A. J. Power Energy 218, 231–239.
11. Knudsen, J.N. Results from Test Campaigns at the 1 t/h CO2 Post-Combustion Capture Pilot-plant in Esbjerg under the EU FP7 CESAR Project, in: PCCC1 Abu Dhabi, 2011.
12. Cotton, 1994. Evaluating and Improving Steam Turbine Performance.
13. González Díaz A., Alcaraz-Calderon M., Gonzalez-Díaz M., Mendez-Aranda A, Lucquiaud M, Gonzalez-Santalo J., 2017. Effect of the ambient conditions on gas turbine combined cycle power plants with post-combustion CO2 capture. Energy, 134 (2017) 221-233.
14. Halvorsen, B. J. 2012. Power plant with CO2 capture based on absorption – part-load performance. Thesis dissertation the Norwegian University of Science and Technology.http://daim.idi.ntnu.no/masteroppgaver/008/8304/masteroppgave.pdf
15. IEAGHG 2012. CO2 capture at gas fired power plants. International Energy Agency Greehouse Gas. Report number: 2012/8.
16. Irons R., 2013. Aspects of CCS at Maasvlakte 3 (ROAD), e-ON. 17. Kather, A., U. Liebenthal, and S. Ehlers, 23 - Power plant integration methods for liquid
absorbent-based post-combustion CO2 capture, in Absorption-Based Post-Combustion Capture of Carbon Dioxide, P.H.M. Feron, Editor. 2016, Woodhead Publishing. p. 555-588
18. Karimi, M., Hillestad M., and Svendsen H., 2012. Natural Gas Combined Cycle Power Plant Integrated to Capture Plant, Energy & Fuel, 26, 1805−1813.
19. Kehlhofer, P., Hannemann, F., Stirninmann, F., and Rukes, B., 2009. Combined-cycle gas and steam turbine power plant, 3rd edition. PennWellcorporation.
20. KEMA report: Plant and component performance test Report 06-7118 (November 2006) and Appendix B of Power and Water Purchase Agreement (March 2005)
21. KEMA Report: Performance Test Report 04-2042 (2004) 22. Koetzier, H., van der Veen, W., Mclnally, T., 2006. Setting of technical parameters for
LRMC of CCGT. KEMA report, 30630022-consulting 06-0923 final report Revision 1. 23. Lines J. Understanding ejector systems necessary to troubleshoot vacuum distillation, Graham
Corp. Batavia, NY. http://www.graham-mfg.com/ejectors-document 24. Lucquiaud, M., Chalmers, M., Gibbins, J., 2009. Capture-ready supercritical coal-fired power
plants and flexible post-combustion CO2 capture. Energy Procedia 1, 1411–1418. 25. Mechleri, E.D., Biliyok, C., Thornhill, N.F. Dynamic simulation and control of post-
combustion CO2 capture with MEA in a gas fired power plant, Computer Aided ChemEng (2014) 619-624.
26. Mitsubishi Heavy Industries, 2007. Ltd. Technical Review Vol. 44 No. 4 (Dec. 2007) 27. Moelling, D., Jackson, P., Malloy, J., et al. (2015). Protecting steam cycle components during
low-load operation of combined cycle gas turbine plants. Power, 159(3):42-45. 28. NASA (2017). Turbine thermodynamics.
https://www.grc.nasa.gov/www/k-12/airplane/powtrbth.html. Accessed: 2017-09-17 29. Ol’khovskii, G., et al, 2013. Thermal Tests of the 9FB Gas Turbine Unit Produced by General
Electric, Thermal engineering vol. 60 No. 9, pp 607-612. 30. Perspectives for the Energy Transition, Investment Needs for a Low-carbon Energy System,
31. PRODESEN, 2017. Programa de Desarrollodel Sistema Eléctrico Nacional (PRODESEN) 2017–2031 (Development Program for the National Electrical System 2017–2031). http://base.energia.gob.mx/prodesen/PRODESEN2017/PRODESEN-2017-2031.pdf
32. PRODESEN, 2018. Programa de Desarrollodel Sistema Eléctrico Nacional (PRODESEN) 2018–2032 (Development Program for the National Electrical System 2018–2032). www.gob.mx/cms/uploads/attachment/file/331770/PRODESEN-2018-2032-definitiva.pdf
33. Sanchez Fernandez, E., Lucquiaud M., Chalmers H., Khakharia P., Goetheer E., and Gibbins J., 2016. Operational flexibility options in power plants with integrated post-combustion capture. Int. J. Greenh. Gas Control 42 (part 2) (2016) 275-289.
34. Sanchez Fernandez, E., Goetheer, E.L.V., Manzolini, G., Macchi, E., Rezvani, S., Vlugt, T.J.H., 2014. Thermodynamic assessment of amine based CO2 capture technologies in power plants based on European Benchmarking Task Force methodology. Fuel 129, 318-329
35. Schutte&Koerting. (n.d.). Performance Data on Jet Compressors. Retrieved April 12, 2018, , from https://www.s-k.com/pdf/4FSUPP_steam_jet_compressors_supplement_brochure.pdf
36. Steam its generation and use, 2005. The Babcock & Wilcox Company, 2005. Edition 41.
37. Razi, N., Svendsen, H.F., Bolland, O., 2013. Validation of mass transfer correlations for CO2 absorption with MEA using pilot data. International Journal of Greenhouse Gas Control 19, 478-491.
38. Rezazadeh, F., Galea, W., Hughes, K., Pourkashania, M., 2015. Performance viability of a natural gas fired combined cycle power plant integrated with post-combustion CO2 capture at part-load and temporary non-capture operations. International Journal of Greenhouse Gas Control 39 (2015) 397–406
39. Rovira, A., Valdés, M., Duran, M., 2010. A model to predict the behaviour at part load operation of once-through heat recovery steam generators working with water at supercritical pressure. AppliedThermalEngineering 30(13):1652-1658.
40. Valdés, M., Rovira, A., Duran, M.D., 2004. Influence of the heat recovery steam generator design parameters on the thermoeconomic performances of combined cycle gas turbine power plants. Int. J. Energy Res. 28, 1255 - 1267.
20
Appendix A Ejector's main equations
1. Nozzle's cross sectional area
𝐴𝐴1 = 𝑚𝑚𝑃𝑃̇𝑃𝑃𝑃𝑃�𝑅𝑅𝑇𝑇𝑃𝑃𝛾𝛾𝜂𝜂𝑔𝑔
�𝛾𝛾+12��𝛾𝛾+1𝛾𝛾−1� (A1)
Being 𝐴𝐴1 the Nozzle's cross sectional area in [m4], 𝑅𝑅 the particular gas constant [J/(kg.K)], 𝑇𝑇𝑃𝑃 the
saturated temperature of the motive flow in [K], 𝑃𝑃𝑃𝑃 its pressure in [Pa] and 𝑚𝑚𝑃𝑃̇ the mass flow rate [kg/s]. 𝛾𝛾is the specific heat ratio [adim]. 𝜂𝜂𝑖𝑖is the nozzle's isentropic efficiency [adim]; this efficiency is defined as the ratio between the operation of the real nozzle against an ideal isentropic nozzle, thus it takes into account the generation of entropy along the nozzle which translates into a decrease in the expected kinetic energy delivered by the before mentioned device; it is not calculated in this research but rather taken as 0.9 from [El-Dessouky et.al. 2002].
2. Mach number related to the pressure change along a nozzle for isentropic compressible flow.
𝑀𝑀𝑜𝑜𝑜𝑜𝑜𝑜 = �2𝜂𝜂𝑔𝑔𝛾𝛾−1
�� 𝑃𝑃𝑔𝑔𝑔𝑔𝑃𝑃𝑣𝑣𝑣𝑣𝑣𝑣
��𝛾𝛾−1𝛾𝛾 �
− 1� (A2)
𝑀𝑀is the Mach number [adim]. The sub index out relates to the outflow of the nozzle, whereas in
indicates the inflow. 3. Mixing process in the diffuser
𝑀𝑀4∗ = 𝑀𝑀𝑃𝑃2
∗ +𝑏𝑏𝑀𝑀𝐸𝐸2∗ �𝑇𝑇𝐸𝐸/𝑇𝑇𝑃𝑃
�(1+𝑏𝑏)(1+𝑏𝑏𝑇𝑇𝐸𝐸/𝑇𝑇𝑃𝑃) (A3)
𝑀𝑀𝑥𝑥∗is the critical Mach number [adim] at 𝑥𝑥 stage of the ejector. 𝑤𝑤is the entrainment ratio [adim]
(defined previously).𝑇𝑇𝐸𝐸is the saturated temperature of the entrainment flow in [K]. 4. Pressure change through the shock wave in the diffuser 𝑃𝑃𝑔𝑔𝑔𝑔𝑃𝑃𝑣𝑣𝑣𝑣𝑣𝑣
= 1+𝛾𝛾𝑀𝑀𝑔𝑔𝑔𝑔2
1+𝛾𝛾𝑀𝑀𝑣𝑣𝑣𝑣𝑣𝑣2 (A4)
21
Appendix B Comparison of simulation results of the main parameters of the steam cycle of a conventional NGCC using Aspen Plus and Thermoflow is shown in Table B1, B2, B3, B4, and B5.
Table B.1. Validation of results from Aspen plus with Thermoflow data at 100% load 100%
Concept Unit ASPEN THERMOFLOW Deviation [%] Steam mass flow to deareator ton/h 7.07 7.07 0.00 HP steam ton/h 270.13 270.90 0.29 IP steam ton/h 329.18 319.10 -3.16 LP steam ton/h 376.69 373.10 -0.96 HP temperature in evaporator °C 331.00 331.00 0.00 IP temperature in evaporator °C 238.00 236.00 -0.85 LP temperature in evaporator °C 141.00 142.00 0.70 Inlet pressure HP turbine bar 124.00 124.00 0.00 Inlet pressure IP turbine bar 28.40 27.60 -2.90 Inlet pressure LP turbine bar 3.36 3.35 -0.16 condenser pressure bar 0.05 0.0483 -0.06
Table B.2. Validation of results from Aspen plus with Thermoflow data at 80% load
80% Concept Unit ASPEN THERMOFLOW Deviation [%]
Steam mass flow to deareator ton/h 5.19 5.80 10.43 HP steam ton/h 254.75 243.20 -4.75 IP steam ton/h 305.73 297.00 -2.94 LP steam ton/h 340.82 339.60 -0.36 HP temperature in evaporator °C 327.00 323.00 -1.24 IP temperature in evaporator °C 233.00 232.00 -0.43 LP temperature in evaporator °C 141.80 141.00 -0.57 Inlet pressure HP turbine bar 116.73 111.90 -4.32 Inlet pressure IP turbine bar 26.45 25.68 -2.99 Inlet pressure LP turbine bar 3.04 3.05 0.27 condenser pressure bar 0.05 0.04 -2.97
Table B3. Validation of results from Aspen plus with Thermoflow data at 70% load
70% Concept Unit ASPEN THERMOFLOW Deviation [%]
Steam mass flow to deareator ton/h 4.68 4.89 4.35 HP steam ton/h 233.68 228.00 -2.49 IP steam ton/h 293.15 283.90 -3.26 LP steam ton/h 320.20 322.30 0.65 HP temperature in evaporator °C 323.00 319.00 -1.25 IP temperature in evaporator °C 231.00 229.00 -0.87 LP temperature in evaporator °C 133.00 137.00 2.92 Inlet pressure HP turbine bar 111.84 105.30 -6.21 Inlet pressure IP turbine bar 25.36 24.55 -3.30 Inlet pressure LP turbine bar 2.86 2.90 1.26 condenser pressure bar 0.04 0.04 -2.30
22
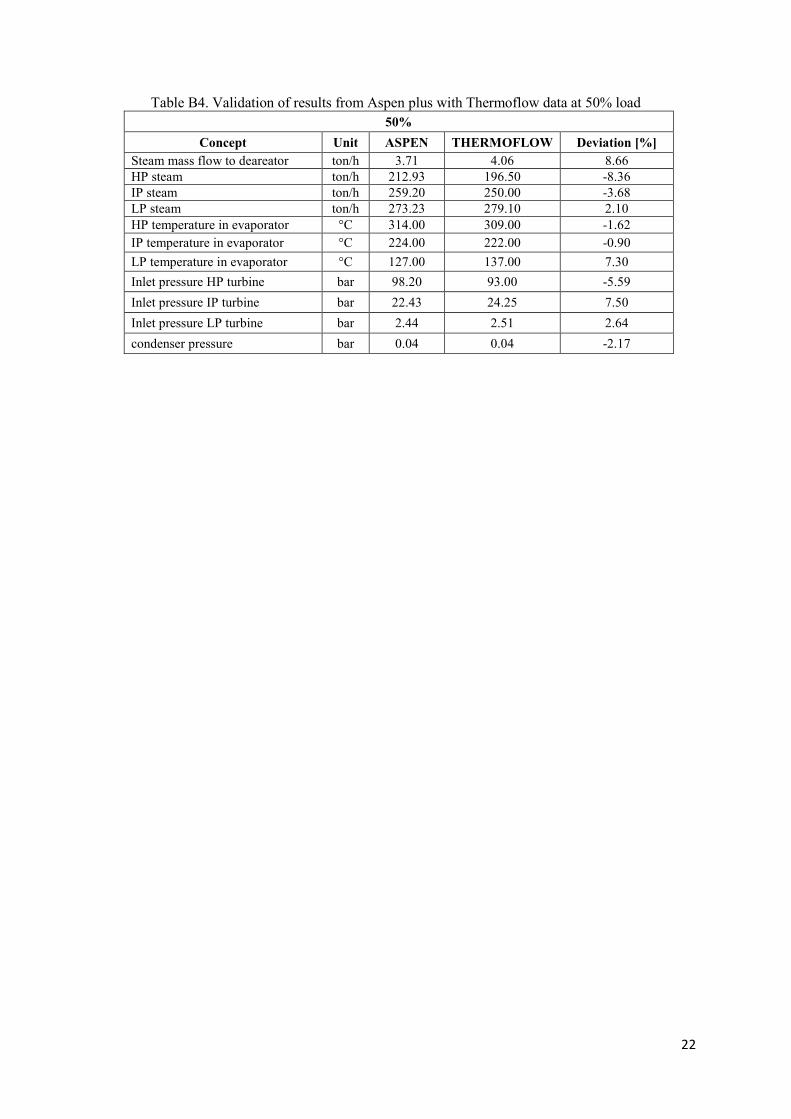
Table B4. Validation of results from Aspen plus with Thermoflow data at 50% load 50%
Concept Unit ASPEN THERMOFLOW Deviation [%] Steam mass flow to deareator ton/h 3.71 4.06 8.66 HP steam ton/h 212.93 196.50 -8.36 IP steam ton/h 259.20 250.00 -3.68 LP steam ton/h 273.23 279.10 2.10 HP temperature in evaporator °C 314.00 309.00 -1.62 IP temperature in evaporator °C 224.00 222.00 -0.90 LP temperature in evaporator °C 127.00 137.00 7.30 Inlet pressure HP turbine bar 98.20 93.00 -5.59 Inlet pressure IP turbine bar 22.43 24.25 7.50 Inlet pressure LP turbine bar 2.44 2.51 2.64 condenser pressure bar 0.04 0.04 -2.17
23
Table B5. Comparison of simulation results from Aspen Plus of the capture plant at part-load and Rezazadeh et al, (2015)
load %
Reference Concept Unit 100 90 80 70 60 50 Rezazadeh, et al, 2015 lean loading
0.21 0.21 0.21 0.21 0.21 This work lean loading 0.269 0.275 0.273 0.272 Rezazadeh, et al, 2015
Temperature reboiler °C 117.2 117.2 117.2 117.2 117.2
This work Temperature reboiler °C 120 120 119.5 118
Rezazadeh, et al, 2015
steam pressure bar 2.5 2.5 2.5 2.5 2.5
This work steam pressure bar 3 3 2.9 2.51
Rezazadeh, et al, 2015 L/G Mass/mass 1 0.985 0.98 0.972 0.963 This work L/G Mol/mol 1.470 1.530 1.500 1.6 Rezazadeh, et al, 2015 Rich loading 0.4761 0.4764 0.4766 0.477 0.4773 This work Rich loading 0.4721 0.4725 0.4725 0.4721 Rezazadeh, et al, 2015 Reboiler duty MJ/kgCO2 3.64 3.65 3.66 3.70 3.70 This work Reboiler duty MJ/kgCO2 3.56 3.58 3.60 3.65
Appendix C
Table C1. Assumptions of HRSG: Minimum temperature approach points, temperature in and out, and pressure drop of each heat exchanger
Heat exchanger Temperature in Temperature out Pressure