66
Use of Water for Agriculture in Pakistan: Experiences and Challenges Simi Kamal Conference on The Future of Water for Food 3 rd –5 th May 2009 University of Nebraska Lincoln, Nebraska

Use of Water for Agriculture in Pakistan: Experiences and Challenges
Simi Kamal
Conference onThe Future of Water for Food
3rd – 5th May 2009University of Nebraska
Lincoln, Nebraska

Framework of Paper
Water Resources Development and the Green Revolution
Best Practices Based on Technological Advances
Trends of Degradation
Infrastructure Inefficiencies
Best Practices Based on Governance Reforms
Challenges and Way Forward
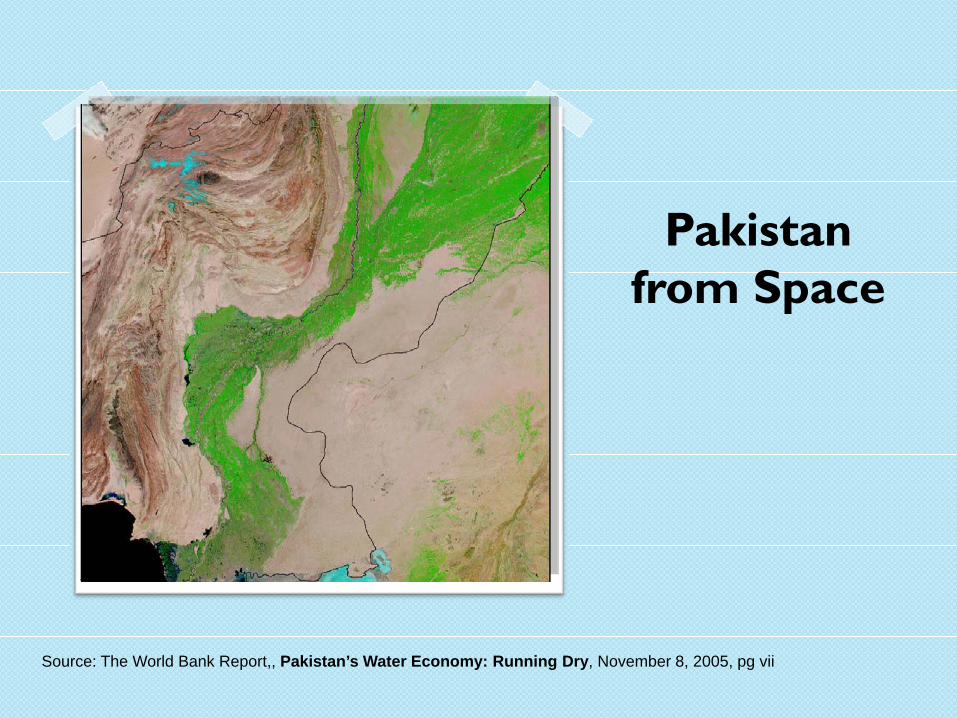
Pakistan from Space
Pakistan from Space
Source: The World Bank Report,, Pakistan’s Water Economy: Running Dry, November 8, 2005, pg vii

Agriculture92% of Pakistan’s land area is arid or semi arid
The Indus Plain covers about 25% of total land area
Most of the irrigated agriculture takes place in this area, which how supports 65% of Pakistan’s population
The irrigated area, which is about 80% of total cultivated area, produces 90% of Pakistan’s food and fiber requirements
About 25% of Pakistan’s GDP comes from Agriculture
Sources: Hasan M H and GoP BOS Sources, Presentation on The Case for Large Reservoirs,presented in SDPI seminar, Islamabad, 26th Dec 2005

History of Water Resources Development
1960- Indus Waters Treaty
1960’s- Irrigation System Expansion and Green Revolution
1980-90s- Opposition to New Dams
1991- Water Accord

Source: The World Bank, Report, Pakistan’s Water Economy: Running Dry, November 8, 2005, pg 8

Source: Hasan, quoted in Pakistan’s Water Economy: Running Dry, Report, The World Bank, November 8, 2005, pg 4
Gomal River
Kurram River
Kabul River
TarbelaReservoir
ChashmaReservoir
Indus River
Jhelum River
Chenab River
Rav
i Riv
er
Sut
lej R
iver
Arabian Sea
Nee
lam
R
iver
Kala Bagh Reservoir(proposed)
ManglaReservoir
Sehwan Reservoir(Proposed)
Thal
Can
al
Thalreservoir
(proposed)
JinnahBarrage
RasulBarrge
L.C.C
.W
est(Jhang)
L.C.C
.E
ast(G
ugera)
U.C
henabInternal
BRBD
Internal
C.B.D
.C
U. D
epalpurL. D
epalpur
L.B.D
.C
U.
Pakpattan
Fordwah
Eastern
Sadiqia
Dera G
hazi Khan
Muzaffargarh
KotriBarrage
SukkurBarrage
GudduBarrage
TaunsaBarrage
TrimmuBarrage
SidhnaiBarrage
BallokiBarrag
e
MaralaBarrage
KhankiBarrag
eQadirab
adBarrage
SulemankiBarrage
IslamBarrag
e
Che
nab
Jhel
um
WarsakDam
Ran
gpur
Can
al
C.R
.B.C
Indus Basin Irrigation System

Heading Number
Dams 3
Barrages 16
Headworks 2
Inter-link Canals 12
Canal Systems 44
Water Courses 107,000
Irrigation Infrastructure

Irrigated Area 36 million acres(14.56 million
hectares)Length of Canals 56,073km
Length of Water Courses 1.6 million km
Current Irrigated Area
A system of water sharing prevalent in northern parts of India and Pakistan where irrigation water is supplied as per crop assessment, size of landholding and cropped area
It is provided according to announced schedule, which changes from season to season depending on water availability
Warabandi System- An Established Practice

1960s- covering three five year plans
New high yielding varieties of wheat and rice
Agricultural growth rate reached 6 percent per annum in the period of third five year plan (1965-1970)
Per acre production increasedWheat and rice production doubled between 1960-1969
West Pakistan became self-sufficient in food grains
Catered to requirements of East Pakistan
Started exporting rice
Green Revolution

Scientific advances
Mexipak wheat variety
Technological advances
IRRI rice varieties
Mechanizations
Water resources development
Fertilizers, Chemicals and pesticides
Stages of Green Revolution
Source: Munich Personal RePEc Archive, Why The Green Revolution Was Short Run Phenomena In the Development Process Of Pakistan: A Lesson For Future, 2004, http://mpra.ub.uni-muenchen.de/9520

Agricultural advances
Increased yields, increased incomes, cropping changes
Support Actions
Support prices, favourable terms of trade, subsides and credit
Green Revolution not SustainedFarm practices remained largely unchanged
Flood irrigation methods remained unchanged
Poor marketing
Low storage capacities for agricultural produce
Agro-based industries not developed
Credits and subsides benefited big farmers and agricultural land owners
Source: Munich Personal RePEc Archive, Why The Green Revolution Was Short Run Phenomena In the Development Process Of Pakistan: A Lesson For Future, 2004, http://mpra.ub.uni-muenchen.de/9520

Based on:
114.35 MAF per year
3 MAF estimate for ungauged canals
Varies from year to year and is normally less than 117.35 MAF
Source: Pakistan Water Accord, 1991 (Agreement), March 1991 and Water Accord 1991, Section 6 (article), available from www.waterinfo.net.pk/pdf/wa.pdf andhttp://64.233.169.132/search?q=cache:DFk0lbKiB6cJ:www.waterinfo.net.pk/pdf/wa.pdf+1991+Water+Accord&hl=en&ct=clnk&cd=1&gl=us.
Water Accord of 1991

Division Among ProvincesPunjab 55.94 MAF
Sindh 48.76 MAF
NWFP 8.78
Balochistan 3.87 MAF
Total 117.35 MAF
• 10 MAF provision for downstream flow is demand of Sindh, but not yet finalized
Source: Pakistan Water Accord, 1991 (Agreement), March 1991 and Water Accord 1991, Section 6 (article), available from www.waterinfo.net.pk/pdf/wa.pdf and http://64.233.169.132/search?q=cache:DFk0lbKiB6cJ:www.waterinfo.net.pk/pdf/wa.pdf+1991+Water+Accord&hl=en&ct=clnk&cd=1&gl=us

Province-wise Irrigated Area
Sindh14% NWFP
5%
Punjab77%
Balochistan4%
Provincial Distribution of Irrigated Area

38 percent of Pakistan’s irrigated lands are waterlogged
14 percent saline
Only 45 percent of cultivable land is under cultivation at a given time
Salt accumulation in the Indus basin
Saline water intrusion into mined aquifers
Degradation of the Agricultural Resource Base(Current Situation)
Salinity Control and Reclamation Projects (SCARPS) between 1960-2000
18.3 million acres (7.40 million hectares) were reclaimed
The salt affected (saline/sodic) area was decreased in almost all the SCARPs
Water logging was also controlled
SCARPS for Reclaiming Degrading Resource Base
Source: Prof Khalid N A, Geography of Pakistan, Revised Edition, 2003

Crops yield increased
Socio-economic status of the farmers communities improved
The gross value of production (GVP) of SCARPs was enhanced substantially
The water of these tube wells was used in conjunction with canal water
Sources: International Waterlogging and Salinity Research Institute (IWASRI), Lahore, Pakistan

Groundwater and Conjunctive Use with
Surface Water

Conjunctive use of surface and ground water has been hailed as a giant step forward
The Indus basin also has fresh groundwater reserves of about 55 MAF
Groundwater now accounts for half of all on farm irrigation requirements (supplementing the 34 MAF of surface water that actually gets to the farm lands )
Indications of aquifer mining

0
100,000
200,000
300,000
400,000
500,000
600,000
700,000
1960
1965
1970
1975
1980
1985
1990
1995
2000
2003
Tube
wel
ls (t
hous
ands
)
The Growth in use of TubewellsSource: Steenbergen and Gohar, quoted in Pakistan’s Water Economy: Running Dry, Report, The World Bank, November 8, 2005, pg 15

Groundwater irrigation has been rapidly developed by the private sector
Groundwater quality is highly variable
Long-term use of groundwater may lead to secondary salinization
The knowledge of mixing ratios that can sustain the irrigated agriculture in the long run is usually lacking
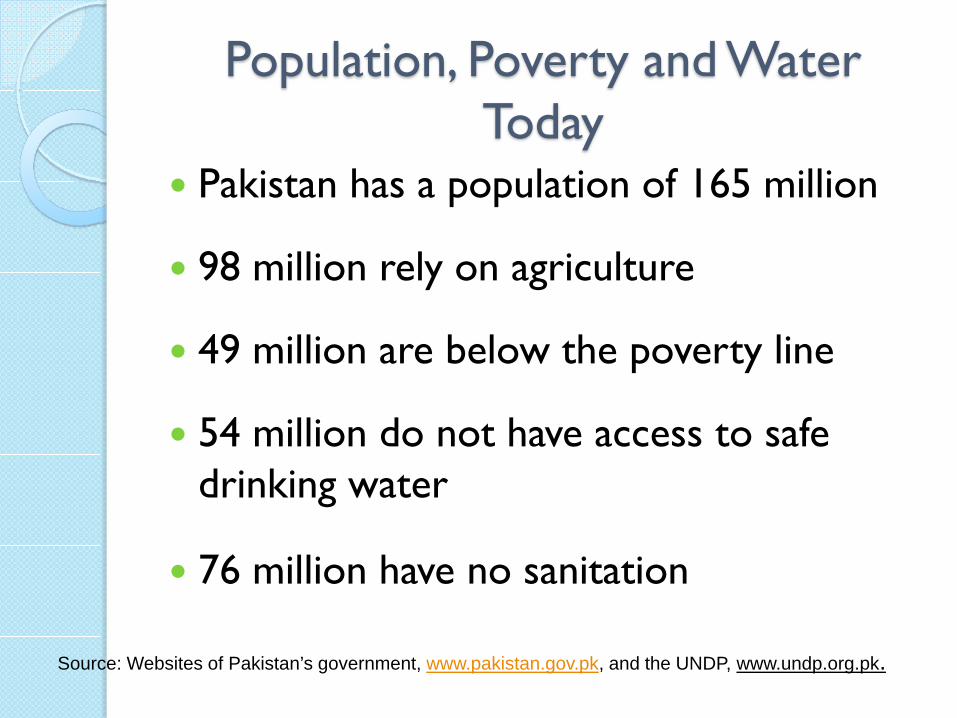
Pakistan has a population of 165 million
98 million rely on agriculture
49 million are below the poverty line
54 million do not have access to safe drinking water
76 million have no sanitation
Source: Websites of Pakistan’s government, www.pakistan.gov.pk, and the UNDP, www.undp.org.pk.
Population, Poverty and Water Today

Crop Area Wheat 8.6 Million Hectares
Rice 2.6 Million Hectares
Maize 1 Million Hectares
Sugarcane 1 Million Hectares
Cotton 3 Million Hectares
Jowar 0.3 Million Hectares
Source: Ministry of Food, Agriculture & Livestock (Economic, Trade & Investment Wing), Agricultural Statistics of Pakistan, 2006-2007, Government of Pakistan
Crop-wise Area Under Cultivation2006-2007

Crop Production Wheat 23.3 Million Tonnes
Rice 5.4 Million Tonnes
Maize 3.1 Million Tonnes
Sugarcane 55 Million Tonnes
Cotton 13 Million Tonnes
Jowar 0.18 Million Tonnes
Source: Ministry of Food, Agriculture & Livestock (Economic, Trade & Investment Wing), Agricultural Statistics of Pakistan, 2006-2007, Government of Pakistan
Crop-wise Production2006-2007

Deficit in grain production in relation to population is predicted to reach12 million tons by the year 2013
Water availability went down to 1500 m3 in 2002, making Pakistan a water stressed country
Water scarcity (1000 m3) expected in 2035
Water and food security are, therefore, Pakistani’s major issues this century
Source: United Nations Population Fund/ Ministry of Population Welfare, “Population Stabilization, a Priority for Development,” Government of Pakistan, undated and World Bank, Pakistan’s Water Economy: Running Dry. 2006
Water and Food Security

One of the Worlds most Water-stressed Countries
Source: www.UNEP.org, quoted in The World Bank, Report, Pakistan,s Water Economy: Running Dry,, November 8, 2005, pg 3

Projected Demands for Water
Source: Hasan, quoted in Pakistan’s Water Economy: Running Dry, Report, The World Bank, November 8, 2005, pg 29

Pakistan is using 97 percent of its surface water resources and mining its groundwater to support one of the lowest productivities in the world per unit of water and per unit of land

Productivity Per Unit of Land Productivity Per Unit of Water
France 7.60 Tons/hectare Canada 8.72 Kg/m3
Egypt 5.99 Tons/hectare America 1.56 Kg/m3
Saudi Arabia 5.36 Tons/hectare China 0.8 Kg/m3
Punjab (India) 4.80 Tons/hectare India 0.39 Kg/m3
Average Pakistan 2.24 Tons/hectare Pakistan 0.13 Kg/m3
Source: Tariq S, Presentation on Water Productivity, presented in National Seminar on Integrated Water Resources Management, Islamabad, Pakistan,, Dec 21-22- 2005
Comparison of Productivity per Unit of Land and Water

The storage capacity is very low at only 150 m3 per capita per year only 30 days of supply
Mangla and Tarbela have lost 25 percent of their storage capacity
Canals work on rotation
Water loss between canal heads and farms is 2/3
Little additional water that can be mobilized over and above what is currently used
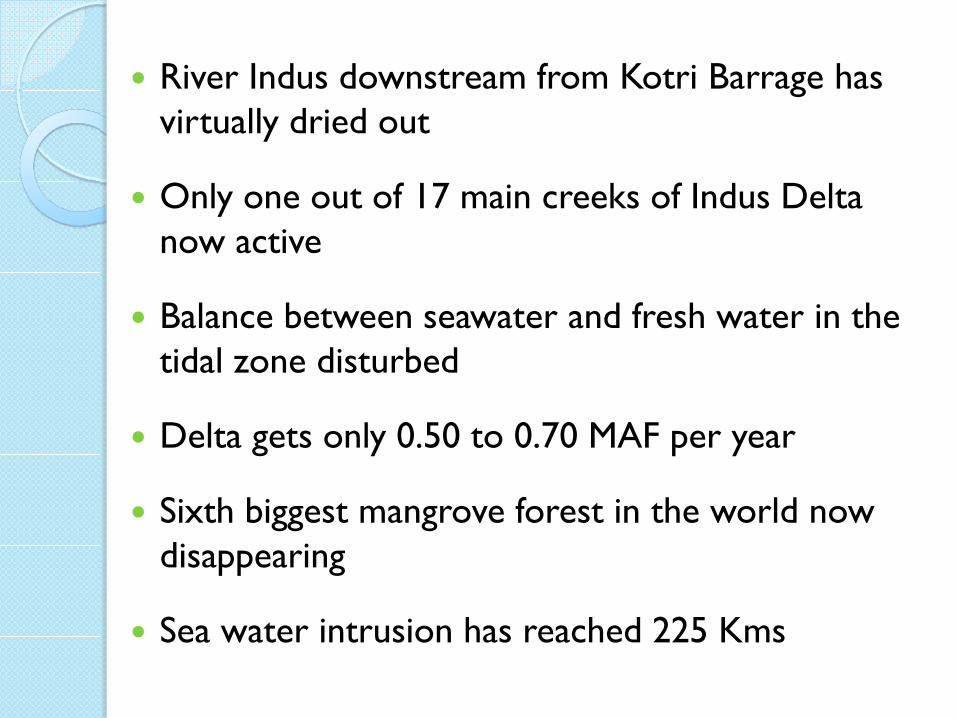
River Indus downstream from Kotri Barrage has virtually dried out
Only one out of 17 main creeks of Indus Delta now active
Balance between seawater and fresh water in the tidal zone disturbed
Delta gets only 0.50 to 0.70 MAF per year
Sixth biggest mangrove forest in the world now disappearing
Sea water intrusion has reached 225 Kms
Partially recognized in Pakistan that water does have ‘value’
Common perceptions do not include an awareness that irrigation water (and water for other uses) is currently provided far below its economic value
Very low irrigation service charges in Pakistan
Very low consumer charges in urban areas
Value of Water

a. Australia
Replace-ment
Interest
EfficientO & M
Financial Requirements Who pays
Taxpayers
Users
Excess man-power
O & M
Replace-ment
Interest Taxpayers
Taxpayers
Taxpayers
Users
Users
No one
b. Pakistan
Financial Requirements
Who pays
The Financing of Water Services in PakistanSource: The World Bank, Report, Pakistan’s Water Economy:Running Dry, November 8, 2005, pg 59

Ill-fated drainage projects designed to remove saline water from irrigated lands
Increased the danger and damage of tidal action and sea water intrusion
World Bank (the principle funder of the drainage projects) had to send its Inspection Panel
Drainage Projects

While the realities of water availability, water regime, climate and delta conditions have changed, the demand for more and more water for agriculture continues to grow in most parts of Pakistan

-10,000
0
10,000
20,000
30,000
40,000
50,000
60,000
70,00019
90-9
1
1991
-92
1992
-93
1993
-94
1994
-95
1995
-96
1996
-97
1997
-98
1998
-99
1999
-00
2000
-01
2001
-02
2002
-03*
Years
(000
Ton
s)
05101520253035404550556065707580859095100105110115
Mill
ion
Acr
e Fe
et
Canal Diversion
Sugarcane
Total Food Grain
Wheat
Ric
Cotton
Dro
ught
Ons
et
Crop Production and DroughtSource: World Bank 2003, quoted in Pakistan’s Water Economy: Running Dry, Report, The World Bank, November 8, 2005, pg 31
DROUGHT AND CROP PRODUCTION
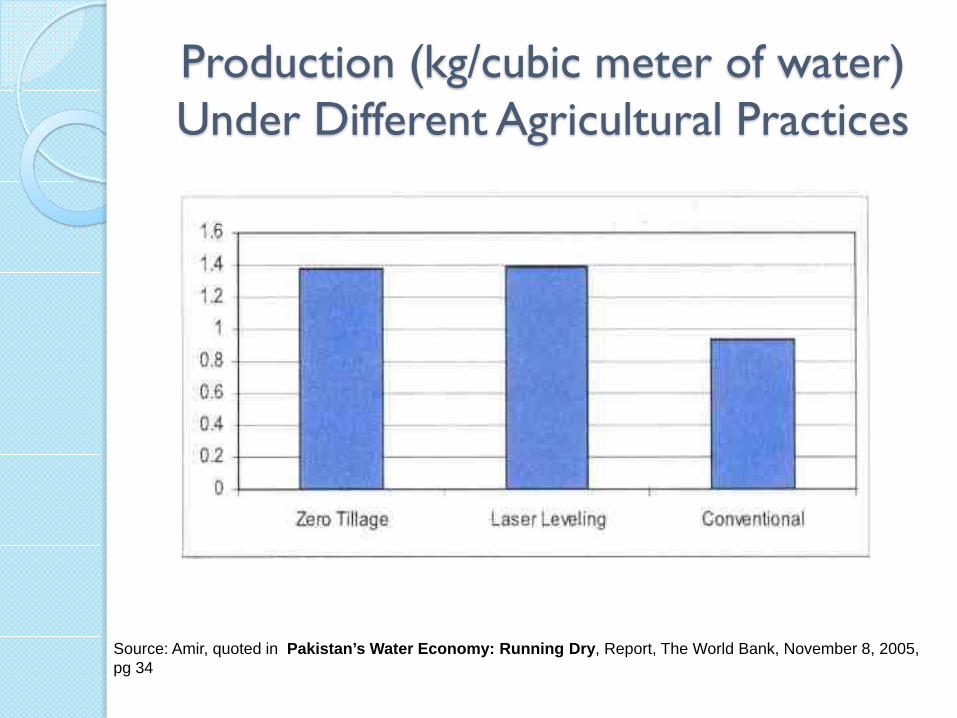
Source: Amir, quoted in Pakistan’s Water Economy: Running Dry, Report, The World Bank, November 8, 2005, pg 34
Production (kg/cubic meter of water) Under Different Agricultural Practices

0100020003000400050006000700080009000
Head Middle Tail
Net
Inco
me
(Rs/
ha)
How Returns to Irrigation vary by Location in a Canal
Source: Bhatia, quoted in Pakistan’s Water Economy: Running Dry, Report, The World Bank, November 8, 2005, pg 31

Not everyone in Punjab has excess, or even adequate, water
Not everyone in Sindh is deprived of water
Both provinces face the same issues in terms of equitable distribution among users
Discourse needs to be redefined in terms of head, middle and tail farmlands in irrigated areas
Water other than agriculture – for domestic use, for industry, for urban areas, and for the environment – should all be key components of discussion
Policy Debate

Ownership of land remains a proxy for water rights especially in agricultural areas
This excludes all landless people and landless farmers who are responsible for managing irrigation water
Few women own agricultural lands, and usually do not control the lands even if owned
Their ‘rights’ to water are ill-defined
Land Ownership as Proxy to Water Rights
Benefits of irrigation infrastructure and rehabilitation has directly enriched the landowners
Increased land values of 30 percent over the past decade
Landowners are likely to continue to receive the lion’s share of the benefits of low water charges and infrastructure improvement
Benefits of Irrigation

Pakistan does not have a comprehensive set of water laws that define:
Water rightsUsesPrinciples of pricingSubsidies ConservationPolluter penalties

National Water Policy (latest draft 2006)
The Pakistan Water Resources Strategy (Ministry of Water and Power, 2002)
Ten Year Perspective Plan (Planning Commission, 2001)
Vision 2025 (Water and Power Development Authority, 2001)
Pakistan Water Strategy (Ministry of Water and Power, 2000)
Medium Term Development Framework (MTDF, 2005-10)
Water Policy Framework
Reform-based Good Practice Example
Irrigation and Drainage Sector Reforms supported by the World Bank (2000 to date)

Implemented in parts of the irrigated areas of the two larger provinces, Punjab and Sindh
Reforms have combined irrigation and drainage functions into single Provincial Irrigation and Drainage Authorities supported by Water Management Ordinances 2002
Eventual take over the rehabilitation and maintenance of 10 canal command areas
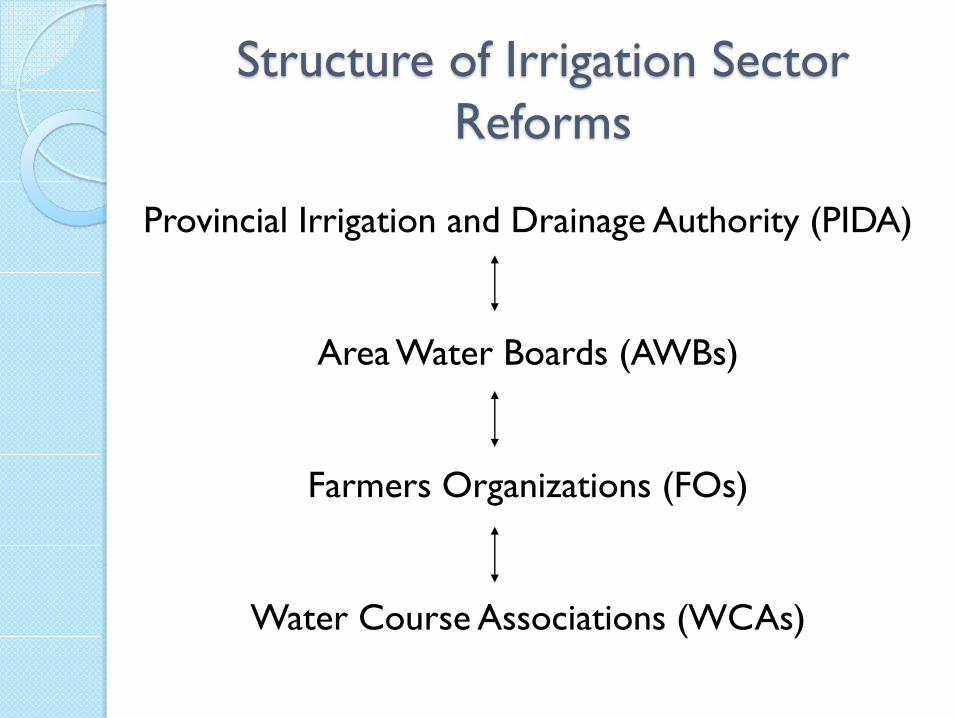
Provincial Irrigation and Drainage Authority (PIDA)
Area Water Boards (AWBs)
Farmers Organizations (FOs)
Water Course Associations (WCAs)
Structure of Irrigation Sector Reforms

Operate and maintain barrages and outlets assigned to it
Operate and maintain spinal drains and link drains
Carry out river flood protection and maintain the infrastructure in the Province of Sindh
Source: Raasta Development Consultants, SDSC University of Sindh, Mehran University of Engineering and Technology Jamshoro, Third Party Monitoring and Evaluation of Institutional Reforms in Water Sector in Sindh, conducted for National Drainage Programme Sindh
Functions of PIDA
Operate and maintain main canals and branch canals
Operate and maintain drainage tube-wells drains with capacity larger than 15 cusecs
Carry out flood protection and maintain infrastructure within its command areas
Promote the formation, development and growth of the FOs
Source: Raasta Development Consultants, SDSC University of Sindh, Mehran University of Engineering and Technology Jamshoro, Third Party Monitoring and Evaluation of Institutional Reforms in Water Sector in Sindh, conducted for National Drainage Programme Sindh
Functions of AWB

Operate and maintain the part of the irrigation system conferred on it
Ensure equitable/judicious distribution of water including small and tail end farmers
Supply non-agricultural users
Guarantee minimum drinking water
Carry out flood protection
Maintain infrastructure within its command areaSource: Raasta Development Consultants, SDSC University of Sindh, Mehran University of Engineering and Technology Jamshoro, Third Party Monitoring and Evaluation of Institutional Reforms in Water Sector in Sindh, conducted for National Drainage Programme Sindh
Functions of Farmer Organization (FO)

The way the Ordinance of 2002 defines a farmer as one who owns land
This leaves out the majority of farmers that actually deal with water and cultivation on a daily basis and till the land – the poor landless sharecroppers
Inequitable land distribution
Organization of production heavily dominated by sharecropping arrangements
Tenants are insecure
Benefits to all water users not guaranteed
Impeding Factors to Water Sector Reforms

Can Pakistan Meet its Water and Food
Production Challenges?
Question:

Yes, Pakistan can meet the challenges
But not through business as usual
A paradigm shift will be required to reframe the whole discourse on water for agriculture
Address the fundamental issues of rights and access to water

Design policy and reform from more inclusive and comprehensive perspectives
Shift from provincial distribution of water for agriculture to a comprehensive water use programme
Shift from the Sindh-Punjab debate to better managed water for all of Pakistan, in both irrigated and rain-fed areas

Shift from management of water supply to management of water demand
The argument for more irrigation infrastructure is based on uncritical capitulation to the demand for more irrigation water for agriculture
Focus on Managing Water Demand

Agriculture already absorbs 97 percent of the total mobilized surface water
Almost all the groundwater
Supports one of the lowest agricultural productivity in the world per unit of water and per unit of land
Unpacking of Demand for More Water in Agriculture

Can this demand be reduced through producing more by using less water?
Yes!
A useful framework to reorient water demands and improve water management
Economic efficiency
Environmental sustainability
Equity
Integrated Water Resources Management (IWRM)
A system of water entitlements within the irrigated areas
Options for increasing water supply by repairing and priming the canal system
Tremendous scope for increasing water productivity
Positive Traditions in Irrigation and Agriculture

Land holdings of more or less of the same size (and not skewed between some huge farms and many tiny ones)
Socio-economically homogeneous farmers (i.e. all hold land titles rather than some owning land while the others are landless and caught in a system of sharecropping land tenure)
Conditions for Significant Outcomes

Incentives in place for better managing service delivery and quality
Farmers pay for water based on satisfactory service delivery (ie service providers are made accountable)
Irrigation schemes and programmes specifically designed to benefit the poor by putting in specific conditions for investments, repairs and rehabilitation of water infrastructure

WAY FORWARD

Concept of agro-climatic zoning
Division of Indus basin into its sub-regions and targeted long-term water strategy and programming for each
Changes in agricultural practices
More crop per drop technologies
Micro irrigation techniques where feasible
Rehabilitate existing irrigation infrastructure and better maintain it

Improvement in water quality
Water quality standards and control of water pollution from all sources
Aggressive promotion of water conservation
Measures to rehabilitate the freshwater-seawater interface on coasts
Adaptation to climate change


