28
Used Electronic Products: An Examination of U.S. Exports Global E-Waste Management Network 3 rd Annual Meeting July 19, 2013 1
Used Electronic Products:
An Examination of U.S.
Exports
Global E-Waste Management Network
3rd Annual Meeting
July 19, 2013
1
Presentation Outline:
• USTR’s request
• Product scope of the investigation
• Major themes
• Questionnaire
• Key findings
2
International Trade Commission
• Small, independent, fact-finding agency
• ITC is not a policy-making agency
• ITC provides information on trade and
related topics to other U.S. government
agencies
3
USTR’s Request
• How much is exported
• Where it goes
• What types of products, and in what
condition
• Types of exporting and importing
enterprises
• Factors affecting trade in UEPs
4

Product Scope of the
Investigation • Computers and parts, computer peripherals, CRTs
• Mobile phones and other telecom equipment
• Televisions and other video equipment
• Audio equipment
• Office imaging equipment
• Medical imaging equipment
Not included:
• Stand alone batteries (car batteries, AA batteries)
• Auto parts
• White goods/home appliances
5
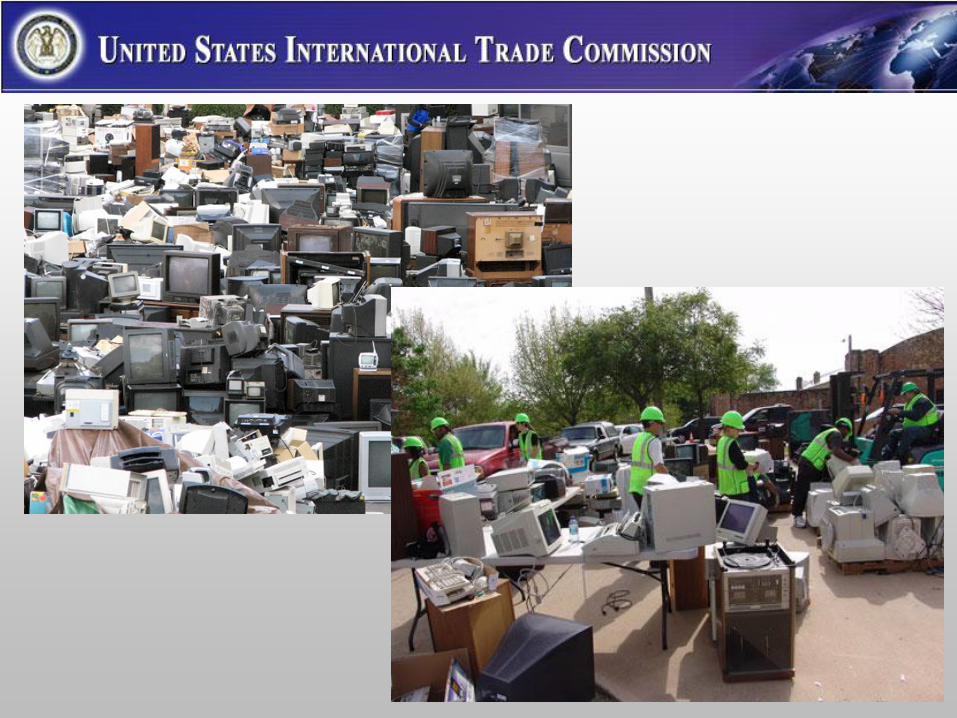
Important Themes
throughout the Report • Highly complex industry and supply chain (see handout)
• Industry (and study) split into two primary segments
– Refurbish/repair products for reuse
– Recycle/disassemble products for materials recovery
– Some disposal of material, which usually imposes a
cost
• Some exporting activity raises concerns
• OECD vs. non-OECD
• Role of industry certification programs (R2 and e-
stewards)
7
What Gets Exported
• Refurbished goods or parts, tested and working
• Whole products or parts, not tested/working
– Intended for repair and resale abroad
– Possibly destined for manual disassembly or disposal abroad
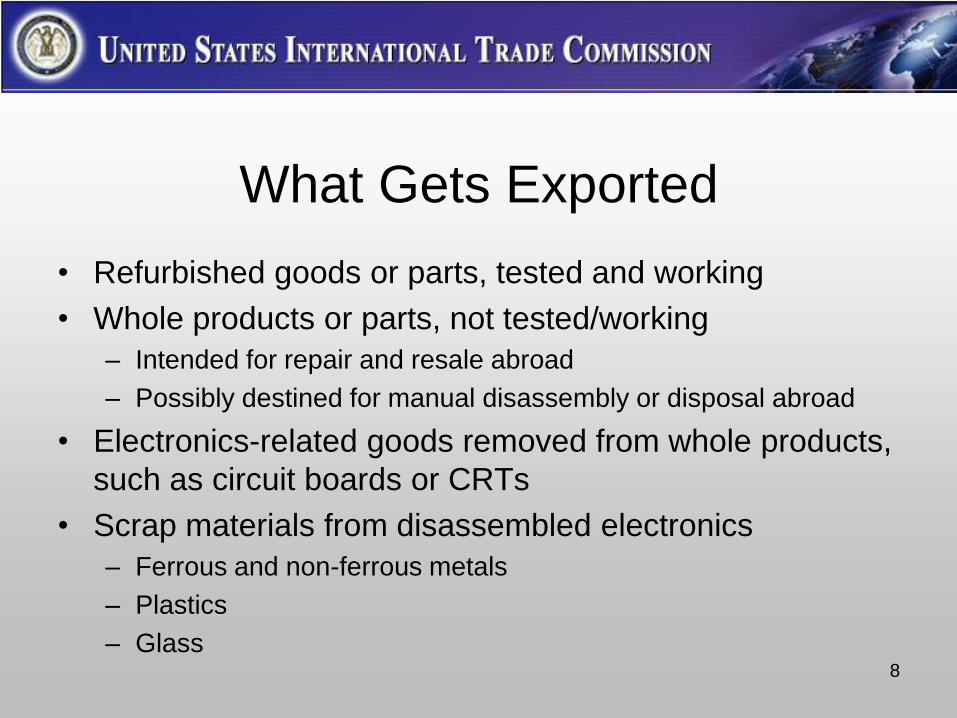
• Electronics-related goods removed from whole products,
such as circuit boards or CRTs
• Scrap materials from disassembled electronics
– Ferrous and non-ferrous metals
– Plastics
– Glass
8
9
Industry Questionnaire
• 2011 data only (no trend data)
• Stratified random sample of potential exporters in 6
industry segments (industry names chosen to match
NAICS definitions):
– waste management and remediation;
– smelting of nonferrous materials;
– electronic products manufacturing;
– wholesaling and brokering of electronic products and of
recyclable materials;
– repair and refurbishing of electronic products; and
– other services, such as IT asset management
10
Questionnaire & Results
• 5200 questionnaires sent to firms with >10 employees
• Total response rate: 57%
• Number of exporters: 1370 (weighted estimate)
• RSEs used to measure precision of data
• Results extrapolated to industry population
• Double counting:
• Likely to have some double counting in domestic sales
• Less likely to have double counting in exports
11
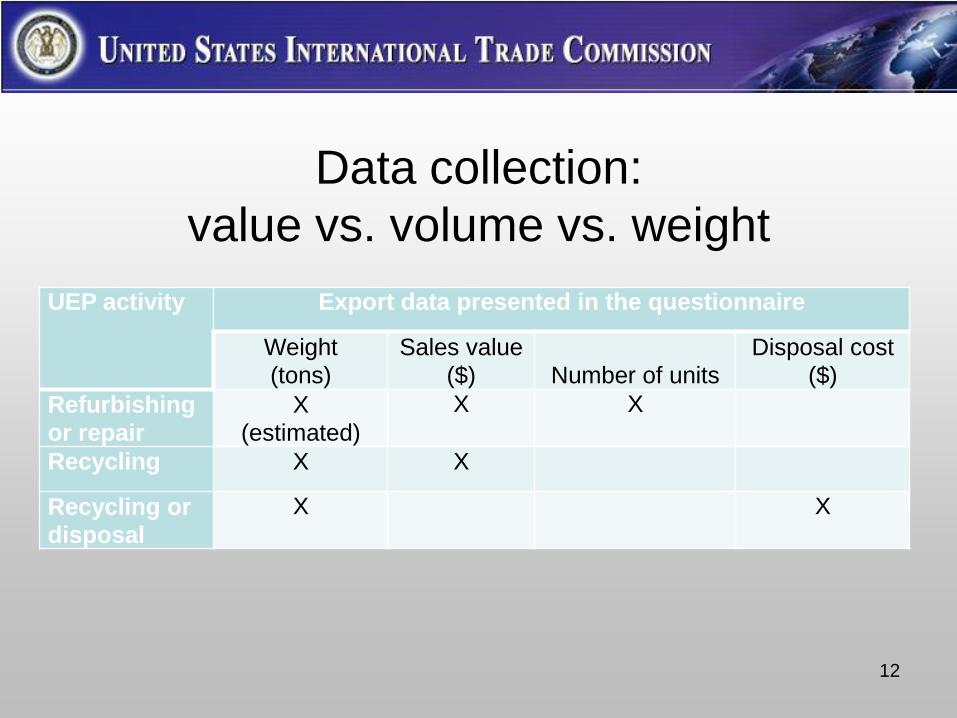
Data collection:
value vs. volume vs. weight
UEP activity Export data presented in the questionnaire
Weight
(tons) Sales value
($)
Number of units Disposal cost
($) Refurbishing
or repair X
(estimated) X X
Recycling X X
Recycling or
disposal X X
12
KEY FINDINGS
13

Domestic sales 93%
Exported refurbished sales 70%
Exported recycled sales 30%
Exports 7%
FIGURE ES-2 Exports were 7% of UEP sales in 2011
Source: USITC calculations of weighted responses to the Commission questionnaire.
Total = $20.6 billion dollars Total = $1.5 billion dollars
14
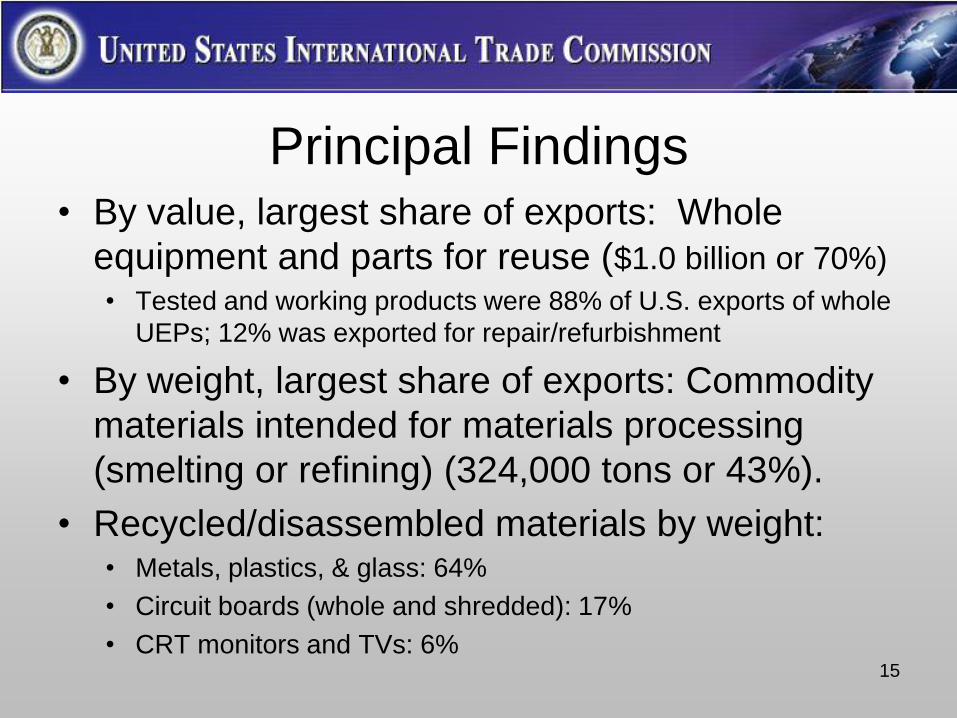
Principal Findings • By value, largest share of exports: Whole
equipment and parts for reuse ($1.0 billion or 70%)
• Tested and working products were 88% of U.S. exports of whole
UEPs; 12% was exported for repair/refurbishment
• By weight, largest share of exports: Commodity
materials intended for materials processing
(smelting or refining) (324,000 tons or 43%).
• Recycled/disassembled materials by weight: • Metals, plastics, & glass: 64%
• Circuit boards (whole and shredded): 17%
• CRT monitors and TVs: 6%
15

Top Markets for U.S. Exports of UEPs (by volume)
16

TABLE ES.4 Estimated U.S. exports of UEPs, by end use, 2011
End use
Export weight
Short tons
Percent
Materials processing (smelting, refining, sorting) 323,772 42.7
Recycling or disassembly a84,941 11.2
Resale of whole equipment or working parts with further
processing (recycle, repair, refurbish, etc.) a58,021 7.7
Resale of whole equipment or working parts without further
processing (tested/working in the United States) 47,071 6.2
Final disposal a5,768 0.8
Charitable donation (operational goods) a27 (b)
Other 102,295 13.5
Unknown 135,826 17.9
Total 757,721 100 Source: USITC calculations of weighted responses to the Commission questionnaire.
Note: The data presented here represent exporters’ estimates of the end use of their exported products at the export destination. These data are available only
on the basis of weight, not value. Data presented elsewhere in the report, and in this executive summary, represent exporters’ characterizations of their
exported products. Totals and breakdowns from the two sets of data are not comparable.
aLow-precision estimates, with RSE above 50 percent. bLess than 0.5 percent.
17
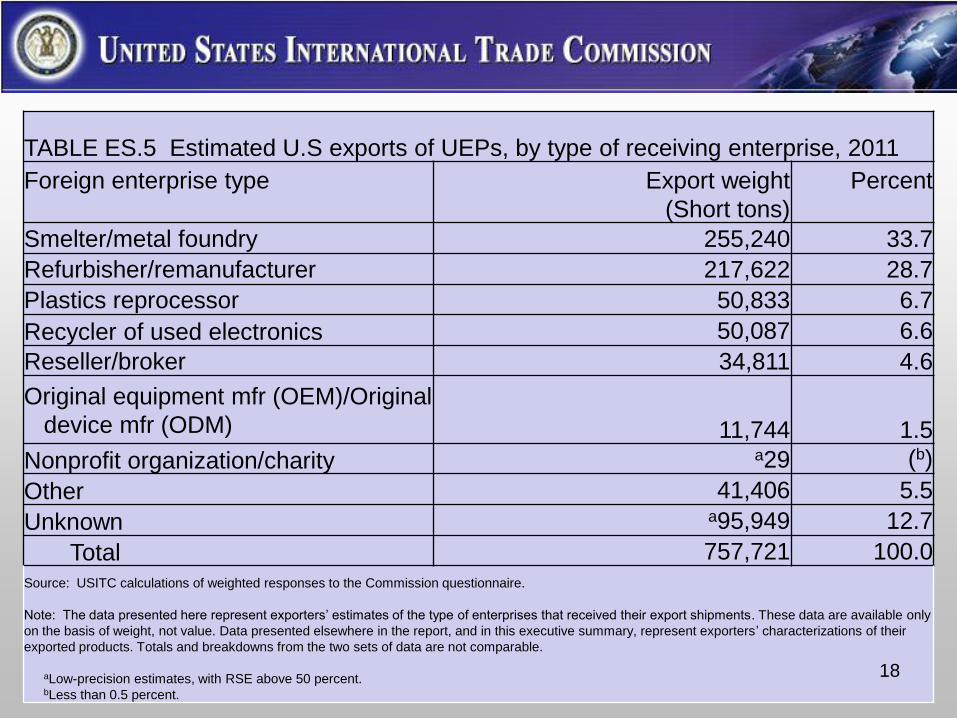
TABLE ES.5 Estimated U.S exports of UEPs, by type of receiving enterprise, 2011
Foreign enterprise type
Export weight
(Short tons)
Percent
Smelter/metal foundry 255,240 33.7
Refurbisher/remanufacturer 217,622 28.7
Plastics reprocessor 50,833 6.7
Recycler of used electronics 50,087 6.6
Reseller/broker 34,811 4.6
Original equipment mfr (OEM)/Original
device mfr (ODM) 11,744 1.5
Nonprofit organization/charity a29 (b)
Other 41,406 5.5
Unknown a95,949 12.7
Total 757,721 100.0
Source: USITC calculations of weighted responses to the Commission questionnaire.
Note: The data presented here represent exporters’ estimates of the type of enterprises that received their export shipments. These data are available only
on the basis of weight, not value. Data presented elsewhere in the report, and in this executive summary, represent exporters’ characterizations of their
exported products. Totals and breakdowns from the two sets of data are not comparable.
aLow-precision estimates, with RSE above 50 percent. bLess than 0.5 percent.
18
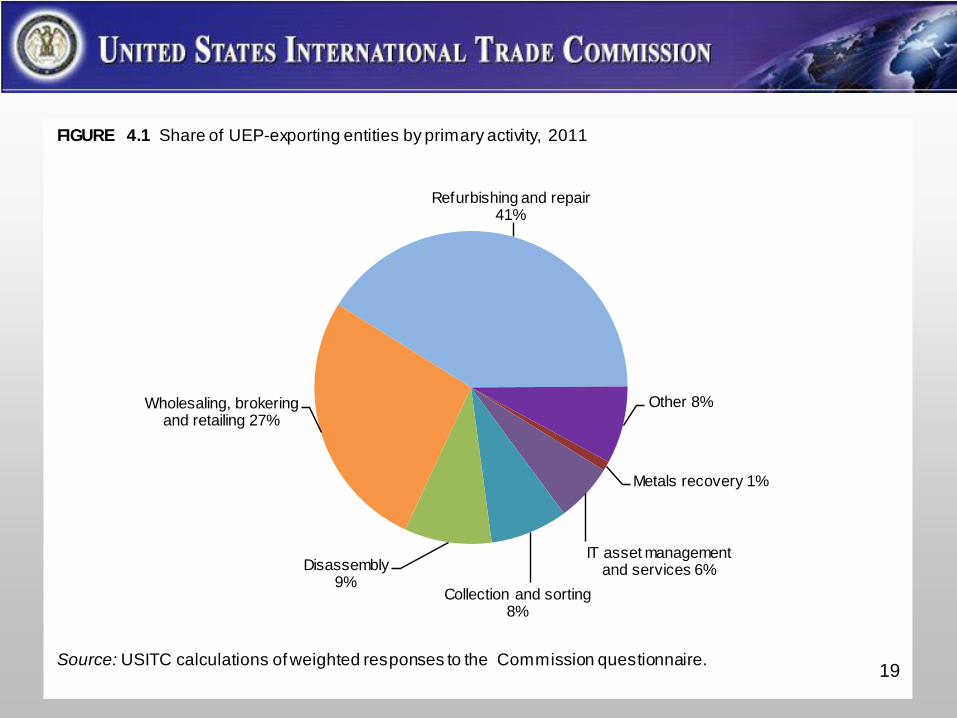
Refurbishing and repair 41%
Other 8%
Metals recovery 1%
IT asset management and services 6%
Collection and sorting 8%
Disassembly 9%
Wholesaling, brokering and retailing 27%
FIGURE 4.1 Share of UEP-exporting entities by primary activity, 2011
Source: USITC calculations of weighted responses to the Commission questionnaire.19

TABLE 4.3 Non-exporting UEP handlers that reported indirect exports, by primary
activity, 2011
Primary activity
Share of total UEP industry
made up of non-exporters
that believe some portion of
their output is
exported by another
organization (percent)
Metals recovery 54
Disassembly 49
IT asset management and services 37
Collection and sorting 36
Wholesaling, brokering, and retailing 25
Refurbishing and repair 20
All non-exporting UEP handlers 27
Source: USITC calculations of weighted responses to the Commission questionnaire.
20
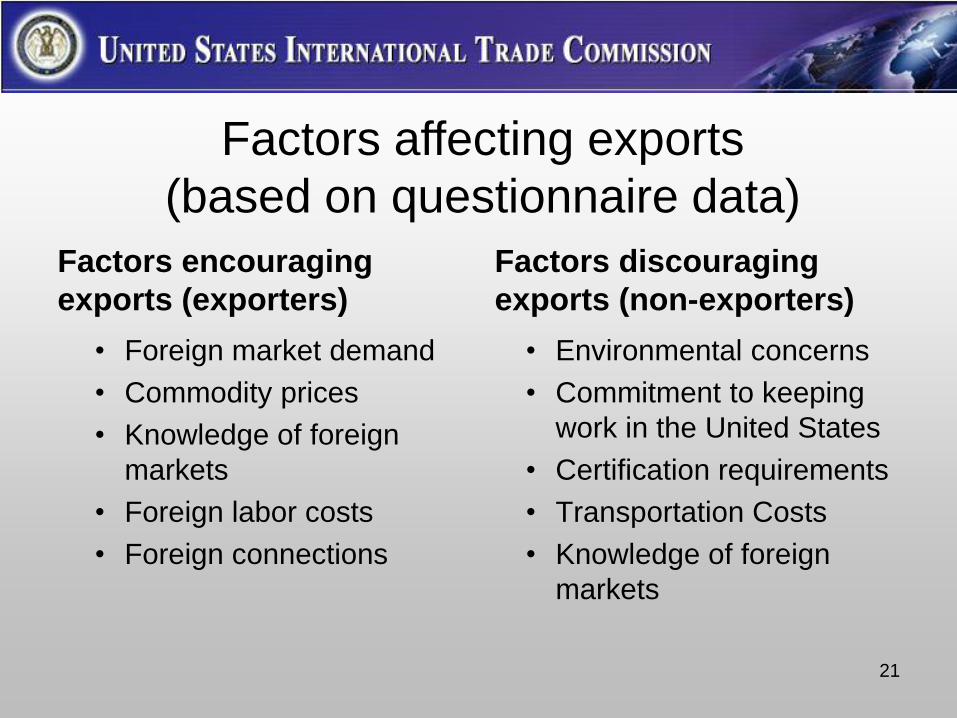
Factors encouraging
exports (exporters)
• Foreign market demand
• Commodity prices
• Knowledge of foreign
markets
• Foreign labor costs
• Foreign connections
• Environmental concerns
• Commitment to keeping
work in the United States
• Certification requirements
• Transportation Costs
• Knowledge of foreign
markets
Factors discouraging
exports (non-exporters)
Factors affecting exports
(based on questionnaire data)
21
• Regulations in 28 U.S. states tend to reduce exports by
changing the cost structure of the local UEP industry.
• Certification programs have become a significant factor
in the industry, and likely serve to limit UEP exports.
• There is demand for UEPs exported from the United
States in developing countries, but a number of
developing countries limit imports of nonworking UEPs,
including through their implementation of the Basel
Convention’s prior notification and consent system.
Additional factors affecting exports
(not based on questionnaire data)
22
Export data from U.S. Census Bureau
• Shipment-level data on exports of certain specific electronic products
• Separate from questionnaire data (aggregated product categories)
• Data not available elsewhere
• Used goods not identified, so we use the proxy of low average unit values (AUVs)
• Six products analyzed: Cell phones, laptops, desktops, CRTs, hard drives, flat screen monitors
23

Census data example: Cell phones
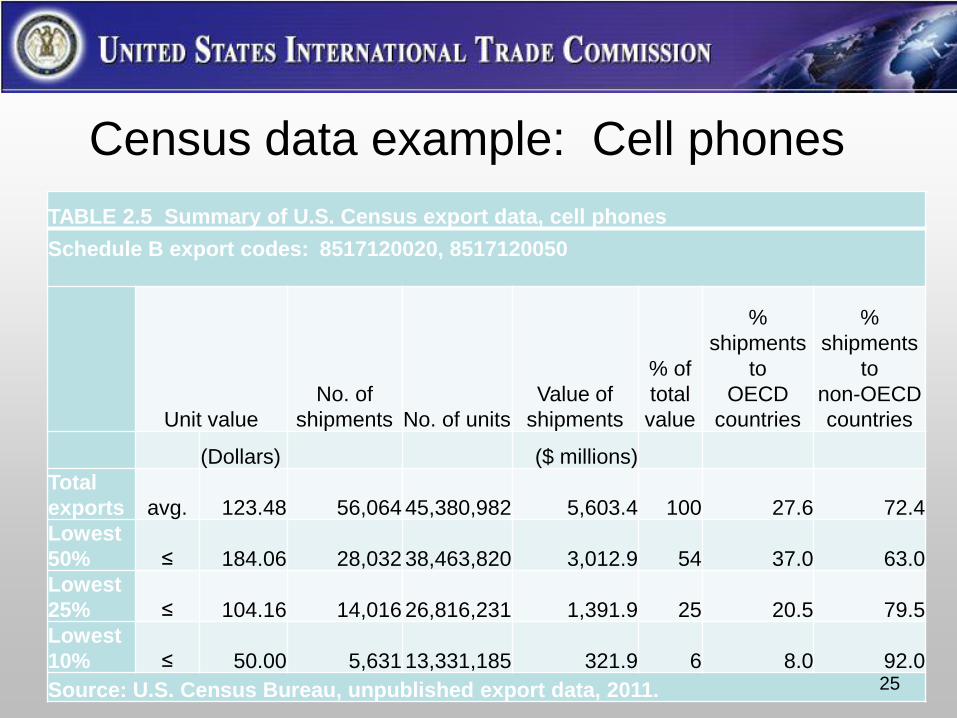
TABLE 2.5 Summary of U.S. Census export data, cell phones
Schedule B export codes: 8517120020, 8517120050
Unit value
No. of
shipments No. of units
Value of
shipments
% of
total
value
%
shipments
to
OECD
countries
%
shipments
to
non-OECD
countries
(Dollars) ($ millions)
Total
exports avg. 123.48 56,064 45,380,982 5,603.4 100 27.6 72.4
Lowest
50% ≤ 184.06 28,032 38,463,820 3,012.9 54 37.0 63.0
Lowest
25% ≤ 104.16 14,016 26,816,231 1,391.9 25 20.5 79.5
Lowest
10% ≤ 50.00 5,631 13,331,185 321.9 6 8.0 92.0
Source: U.S. Census Bureau, unpublished export data, 2011. 25

Census data example: Cell phones TABLE 2.6 Cell phones: U.S. exports with unit values in lowest 10 percent of shipments,
2011a
AUV No. of units
No. of
shipments
Export value
(US $)
Share of
total value
(percent)
Hong Kong 17.32 3,492,517 1,265 60,495,597 19
Venezuela 34.09 1,049,706 172 35,781,308 11
Paraguay 30.31 1,161,230 776 35,196,305 11
Mexico 23.28 1,329,494 255 30,944,120 10
Haiti 19.10 1,308,554 102 24,992,331 8
El Salvador 25.49 488,538 167 12,453,270 4
Dominican
Republic 35.26 348,058 176 12,271,154 4
Honduras 26.09 430,716 120 11,237,325 3
Jamaica 24.69 448,855 82 11,083,478 3
Philippines (b) (b) (b) (b) (b)
All other (b) (b) (b) (b) (b)
OECD countries 23.42 1,514,503 453 35,476,753 11
Developing
countries 24.24 11,816,682 5,718 286,422,050 89
Total 24.15 13,331,185 5,631 321,898,803 100
Source: USITC staff calculations based on U.S. Census Bureau, unpublished export data,
2011 (Schedule B codes 8517120020 and 8517120050).
26
Full Report Available Online at:
http://www.usitc.gov/publications/332/pub4379.pdf
27