38
≥ User Guide superior solutions through better understanding

≥ User Guide
superior solutions through better understanding

Librariespg 21 - Search
pg 21 - Saving a Standard Search
pg 22 - Saving a User-Defined Report/Ranking/
Matrix or Drill-down report
pg 23 - Report Wizard
pg 24 - Steps to create a report using Report Wizard
pg 25 - Sharing Reports
Appendix A: Key Search Fieldspg 26 - Key Search Fields for ECM Analysis
Appendix B: Field Glossarypg 27 - Field Glossary
Help and Supportpg 38 - ECM Analytics Help and Support
pg 38 - Calling the ECM Analytics Hotline
Getting Startedpg 3 - Designer
pg 3 - Portal
pg 3 - DealCal
pg 3 - News&Alerts
pg 3 - Dealogic ScoreCard
pg 3 - CapitalMap
pg 4 - MyReports
pg 4 - LookUp Search
DealCal pg 5
Deal Profile pg 6
News&Alerts pg 7
ScoreCardpg 8 - Selecting parameters
pg 9 - Drilling down to underlying data
pg 9 - Copy a ranking into Excel
CapitalMap pg 10
MarketMatrix pg 11
LookUp pg 12
MyReports pg 13
Designerpg 14 - Launching through Portal via modify buttons
pg 15 - Launching Designer as a standalone
pg 15 - Standard Search
pg 16 - Option 1: Tranche Report/User-Defined
pg 17 - Option 2: Ranking Table
pg 18 - Use Dates
pg 18 - Customise Ranking Drill-Down
pg 19 - Option 3: Matrix
pg 20 - Exporting to Excel
≥ Contents
New York: (+1) 212 577 4400 email: [email protected] London: (+44) 20 7379 5650 email: [email protected]
Hong Kong: (+852) 2804 1223 email: [email protected] Tokyo: (+813) 5157 1527 email: [email protected]
≥ www.dealogic.com
superior solutions through better understanding
≥ Getting Started
ECM Analytics (v.5.06) User Guide 3Dealogic www.dealogic.com
ECM Analytics is a competitive benchmarking system covering the Global Equity Capital Markets. Reporting packagesinclude Bookrunner and company rankings by Industry and Region, deal lists and profiles of individual transactions.
Custom reports can be saved in shared libraries set up specifically for defined user groups, which can be generated withup-to-date data from anywhere in the world using only a web browser. Output can be printed or copied/exported to Excel.
The platform is comprised of two primary components, the Designer and the Portal.
DesignerDesigner is a locally installed desktop application that enables a user to create, edit and save reports in personal librariesor to share to other users or groups. Designer is used to specify search parameters, including but not limited to:
- Date ranges- Products and sub-products- Regions and countries- Industries and sectors- Deal value ranges- Specific manager involvement
PortalThe Portal is a password protected website with several primary pages:
DealCal- Calendar of filed, expected, withdrawn/postponed and completed deals with drill-downs to individual profiles- Monthly, Weekly and Daily views- Filter preferences include dates, banks, deal status, deal type, deal execution, regions, deal size and target market
News&Alerts- ECM Squawk of breaking market information- ECM Alerts of all deals that have been revised, filed, priced and withdrawn- Daily ECM NewsSheets topical to the activity of the market
Dealogic ScoreCard- Rankings by time period for Bookrunner or Industry based on volume- Detail includes number of deals, aggregate deal volume, percentage share, aftermarket performance information- Yearly, quarterly, monthly, weekly and year-to-date views- Drill-down hyperlinks produce underlying deal lists for rankings- Modify buttons allow users to further customize queries using the Designer
CapitalMap- Snapshot of ECM activity by geographical region/nation- Analysis selection includes deal type, volume, number of deals, year-to-date, last-year-to-date and last year- Modify buttons allow users to further customize queries using the Designer

≥ Getting Started
ECM Analytics (v.5.06) User Guide 4
MyReports- Access to a library of saved reports that can be accessed on an individual, group or firm wide basis- Ability to share reports with designated individuals or groups- Reports created through the Designer can be easily posted to MyReports and executed on a recurring basis
LookUp Search- Company: List all deals for a given company or company parent- Bank: ECM bank profile by deal type, recently completed deals and deals in the backlog- Industry: ECM industry profile by deal type, recently completed deals and deals in the backlog for any Dealogic
General Industry Group (GIG)- Deal number: Go directly to full profile of deal with a specific deal number
Dealogic www.dealogic.com
≥ DealCal
ECM Analytics (v.5.06) User Guide 5Dealogic www.dealogic.com
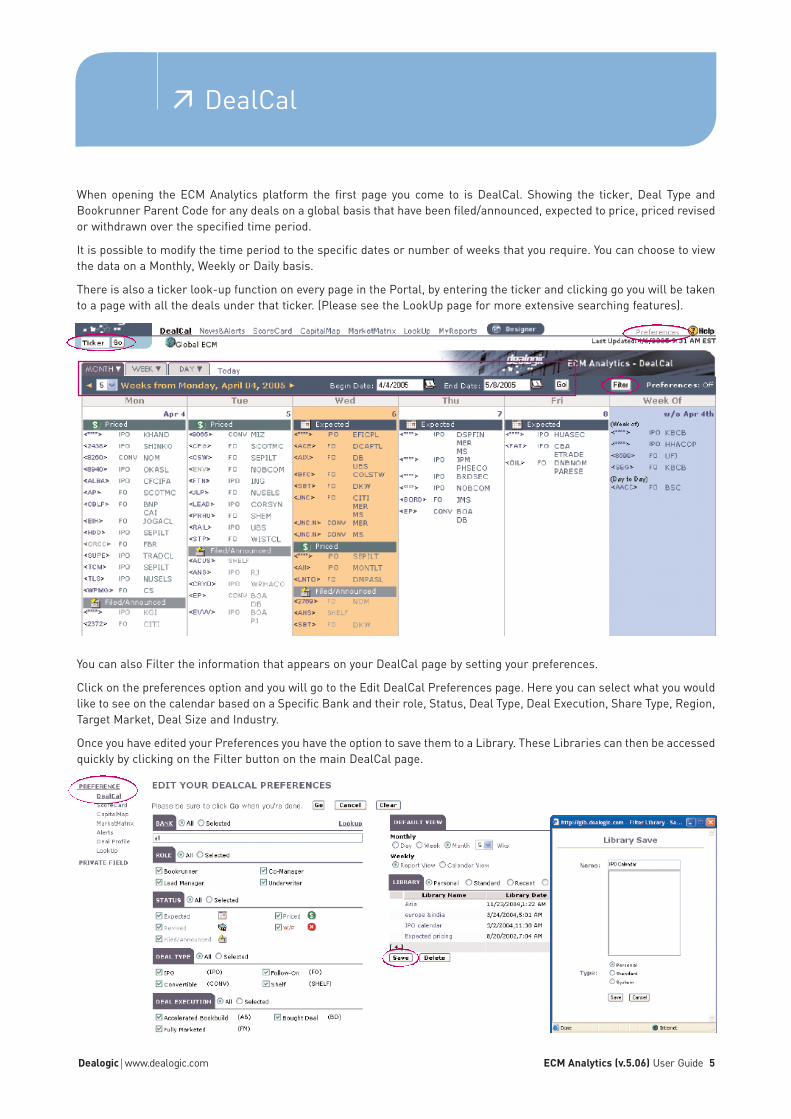
When opening the ECM Analytics platform the first page you come to is DealCal. Showing the ticker, Deal Type andBookrunner Parent Code for any deals on a global basis that have been filed/announced, expected to price, priced revisedor withdrawn over the specified time period.
It is possible to modify the time period to the specific dates or number of weeks that you require. You can choose to viewthe data on a Monthly, Weekly or Daily basis.
There is also a ticker look-up function on every page in the Portal, by entering the ticker and clicking go you will be takento a page with all the deals under that ticker. (Please see the LookUp page for more extensive searching features).
You can also Filter the information that appears on your DealCal page by setting your preferences.
Click on the preferences option and you will go to the Edit DealCal Preferences page. Here you can select what you wouldlike to see on the calendar based on a Specific Bank and their role, Status, Deal Type, Deal Execution, Share Type, Region,Target Market, Deal Size and Industry.
Once you have edited your Preferences you have the option to save them to a Library. These Libraries can then be accessedquickly by clicking on the Filter button on the main DealCal page.

≥ Deal Profile
ECM Analytics (v.5.06) User Guide 6Dealogic www.dealogic.com
By clicking on any of the tickers on the DealCal page you can drill down to see the Deal Profile of the underlying deal.
The Deal Profile provides an in-depth look at individual transactions, including structure, individual tranche details,pricing, syndicate group and disclosed gross fees. Click on the hyperlinked company to access detailed information on anytransaction underlying a search.
Also on the full profile you have access to source documentation via the EdgarDesk Link. The Ticker Search links intoYahoo Finance ticker information, and Web Search pulls up a Google search on the company name.

≥ News&Alerts
ECM Analytics (v.5.06) User Guide 7Dealogic www.dealogic.com
The News&Alerts page consists of ECM Squawk – a brief statement on pertinent issues, ECM Alerts – Further informationon deals that have filed/announced, priced or revised, providing further information than on the calendar, and theNewsSheet.
A NewsSheet is posted daily, giving a brief synopsis topical to the market, and providing regular standardized tables andbreakdowns.

≥ ScoreCard
ECM Analytics (v.5.06) User Guide 8Dealogic www.dealogic.com
Illustrates Bookrunner or Industry volume rankings at ECM level or Deal Type level over pre-defined periods. Displaysdeal volume, number of deals, % market share, aftermarket performance for the selected time period.
Tip: Dealogic’s Official Ranking Criteria is also available at the top of the ScoreCard page.
Selecting ParametersUsers can navigate between ECM deal types (ECM, Stock, IPO, Follow-on and Convertible) and time periods.
The tables will automatically regenerate upon making a selection.

≥ ScoreCard
ECM Analytics (v.5.06) User Guide 9Dealogic www.dealogic.com
Drilling down to underlying dataTo view a banks deal list and apportioned credit for each deal, click on the respective row to drill down to the underlyingdata, once you have the list of underlying deals it is then possible to drill down into the full profile.
Copy a ranking into ExcelAny ranking table on the ScoreCard (and any ranking or table within the Portal that has a copy button) can be copied intoExcel by pressing the Copy button and then pasting the data into Excel.

≥ CapitalMap
ECM Analytics (v.5.06) User Guide 10Dealogic www.dealogic.com
The CapitalMap gives a snapshot of the regional breakdown by volume and activity. The top deals across all regions arealso shown.
As with the previous pages it is possible to drill down and see the data underlying the tables.
At the bottom of the page in the Analysis Selection it is possible to modify the data for the whole page to display the timeperiod, deal type or the number of deals or volume as required.
ECM Analytics (v.5.06) User Guide 11
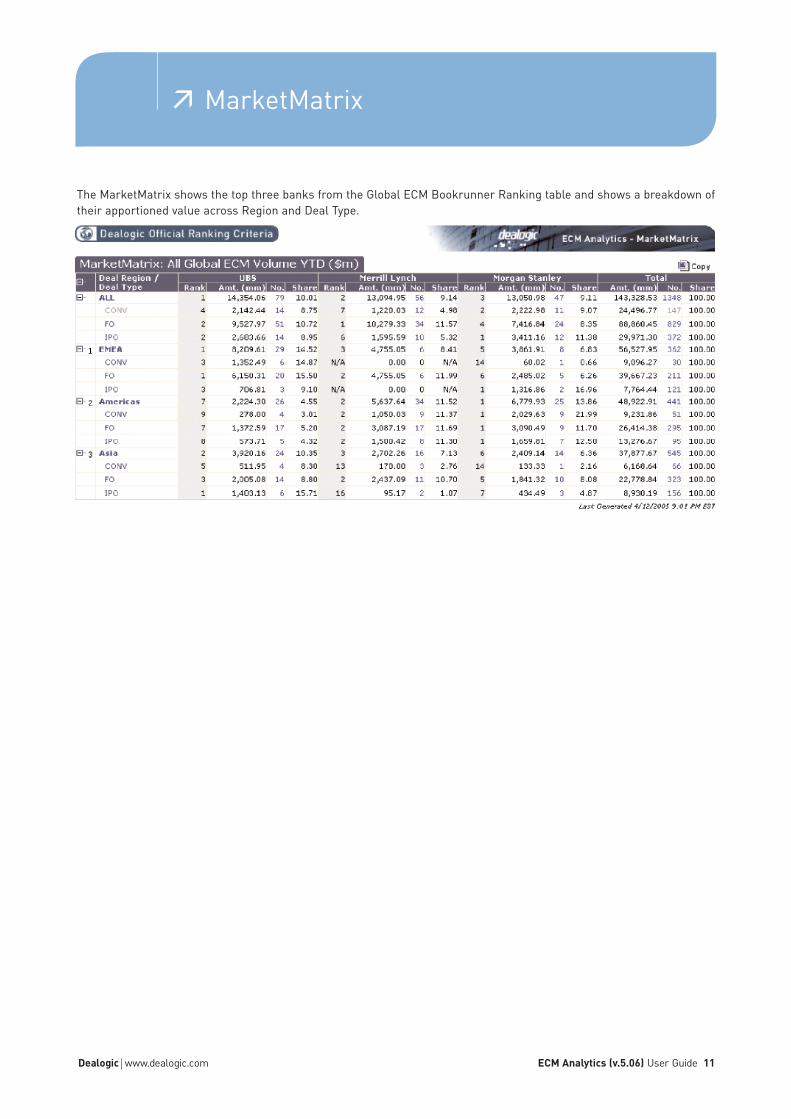
The MarketMatrix shows the top three banks from the Global ECM Bookrunner Ranking table and shows a breakdown oftheir apportioned value across Region and Deal Type.
Dealogic www.dealogic.com
≥ MarketMatrix

ECM Analytics (v.5.06) User Guide 12
LookUpThe LookUp page is a quick reference page that allows you to search for a specific Issuer, Bank, Industry, Deal or Region.
Dealogic www.dealogic.com
≥ LookUp

The MyReports page is where you can access a library of reports. These are either reports saved to your personal log-inor saved under a shared library. Reports created from the Designer can easily be posted to the MyReports page andexecuted on a recurring basis.
It is also possible to share existing reports with other users under the same Client ID.
To run the reports select the report from the list on the left, this displays the criteria for the selected report on the right.You then have the option to either Modify or run the report.
Modifying the report (see the Designer Section) launches the Designer with the set criteria allowing you to modify thesearch or the report as required.
Running the report; hitting the Run button allows the search and report to run without launching the Designer. Once thereport has run you again have the option to Modify, or you can Copy and Paste to Excel. The About option at the top of thereport allows you to view the search and report criteria.
ECM Analytics (v.5.06) User Guide 13Dealogic www.dealogic.com
≥ MyReports

≥ Designer
ECM Analytics (v.5.06) User Guide 14Dealogic www.dealogic.com
The Designer is a tool that enables you to modify parameters of the ScoreCard and CapitalMap or devise a new stand alonesearch. Access to the designer allows users to perform custom analysis, which can be saved in libraries and shared withother users.
Users can access the Designer from the Portal in one of two ways: clicking on a modify button associated with an existingranking/deal list or launching from the toolbar at the top of the page.
Lauching through Portal via Modify buttonsA key advantage to launching the Designer via the modify button is that the standard report parameters are alreadyconfigured to the tables on the ScoreCard. This allows the replication and modification of the report.
Hitting the modify button launches the screen below. Select “finish” to replicate the ScoreCard tables or to modify select“Back” twice until you reach the Standard Search screen where you can amend the search according to desired parameters.

≥ Designer
ECM Analytics (v.5.06) User Guide 15Dealogic www.dealogic.com
Launching Designer as a standaloneAn alternative to launching the Designer from a Modify button is to launch the Designer from the toolbar icon, or the iconon the MyReports page.
Standard SearchAfter launching the Designer either through the Modify button (as explained above) or the Designer icon you will get to theStandard Search page.
Standard Search – used to isolate a dataset of deals with a common set of properties.
• Select the Deal or Tranche button to specify the basis of your search. This selection determines whether a ranking reportsthe number of deals or the number of tranches.
• Select a field from the field dropdown box by typing part of the name or by scrolling through the list.• Choose the appropriate condition for your search e.g. equals, not equal to etc. (These conditions will alter the way that
a chosen field will act within the search).• Enter a value into the Value Box. Coded fields such as nationalities, banks, deal type etc. have a list of possible variables
which can be accessed by clicking on the value box next to the desired code or by pressing F9.
Tip: Searches can be saved in a shared or personal library for easy future access.
When running the Standard Search, you can display your results in a Tranche Report (User-Defined), Ranking Table ora Matrix.
Tip: When searching on Deal Value the field is in dollars/Euros, either enter in the full amount or “m” following the valuein millions i.e. 20m.

≥ Designer
ECM Analytics (v.5.06) User Guide 16Dealogic www.dealogic.com
Option 1: Tranche Report/User-DefinedEnables you to produce customized reports by choosing specific fields and sorting options. There are three ways ofselecting the Report Function:
• Click on the Report Fields button to ensure that it is selected. • Locate the required field by scrolling through the list or by typing part of the field name to limit the choices. • Click on the desired field to be reported. Other fields can be selected in a similar fashion. Use the Up and Down buttons
to adjust the postion of the field. • Click on Sort Order and select the desired fields to sort the report.• Select either ascending or descending under Field Attributes.• Save the User-Defined Report in a shared or personal library, if desired.
Tip: Use the check boxes under Field Attributes to provide totals and averages for numeric fields. Also select denominationsfrom the drop down menu to the right.
Note: If tranche-level fields are displayed, the report will display separate tranches on separate rows. If no tranche-levelfields are selected, the report will display each deal on a single row.

Option 2: Ranking TableA ranking table consolidates deal information to rank banks, issuers, industries, regions etc. Rankings are based upondeal volume and deal activity from a dataset generated by the previous search.
• Bookrunner Ranking Tables, according to standard Dealogic methodology, should be run on:- Bookrunner (also applies to other manager tables – Lead-manager, Co-manager, Underwriter, Lead/Co-manager.- Grouping On, consolidates bank subsidiaries to the bank parent.- From Basis select Deal Value to capture deal volume (this can be in either Euro’s or $).- Apportion: Gives two options one being Apportioned where the credit is equally split between all the bookrunner
on a tranche by tranche basis (Dealogics standard methodology). The second option is Full, where entire tranche credit is given to each bookrunner.
- Sort order allows you to sort rank based on amount or number of deals. (If ranking by a Date field, you will also have the option to sort Chronologically).
- Show top allows you to designate the number of banks that will be displayed in the ranking.
• Volume rankings can be viewed in one of several ways:- Company- Product Type- Deal Type- Issuer Nationality [single unique Nationality for each deal]- Pricing Date - Filing Date- Withdrawn/Postponed Date- Security Type- General Industry Group (GIG) [single unique GIG for each deal]- Specific Industry Group (SIG) [single unique SIG for each deal]- World Region [single unique nationality for each deal]- Region [single unique nationality for each deal]
≥ Designer
ECM Analytics (v.5.06) User Guide 17Dealogic www.dealogic.com

≥ Designer
ECM Analytics (v.5.06) User Guide 18Dealogic www.dealogic.com
Use DatesOption that allows you to see rankings across multipletime periods. Upon checking the Use Dates box, an optionswindow will appear. Specify the period length, number ofperiods, and the most recent period for your ranking. Youcan also modify the range to report on calendar year or ona rolling basis.
Customize Ranking Drill-DownThis allows you to configure a drill-down report, selecting the data items to display and the criteria by which to sortthe deals.
Steps:• Highlight the desired bank row or rows and right-click on the mouse.• Select “configure drill down report” option.• Locate the fields you require from the Field Selector, either by scrolling through the list or by typing part of the field
name to limit the list.• Select the fields you wish to report on. • Sort the report by clicking on the Sort Order tab. You can sort up to three different parameters, select the fields by which
you would like to sort and their order.• Click OK for the report to execute.
≥ Designer
ECM Analytics (v.5.06) User Guide 19Dealogic www.dealogic.com
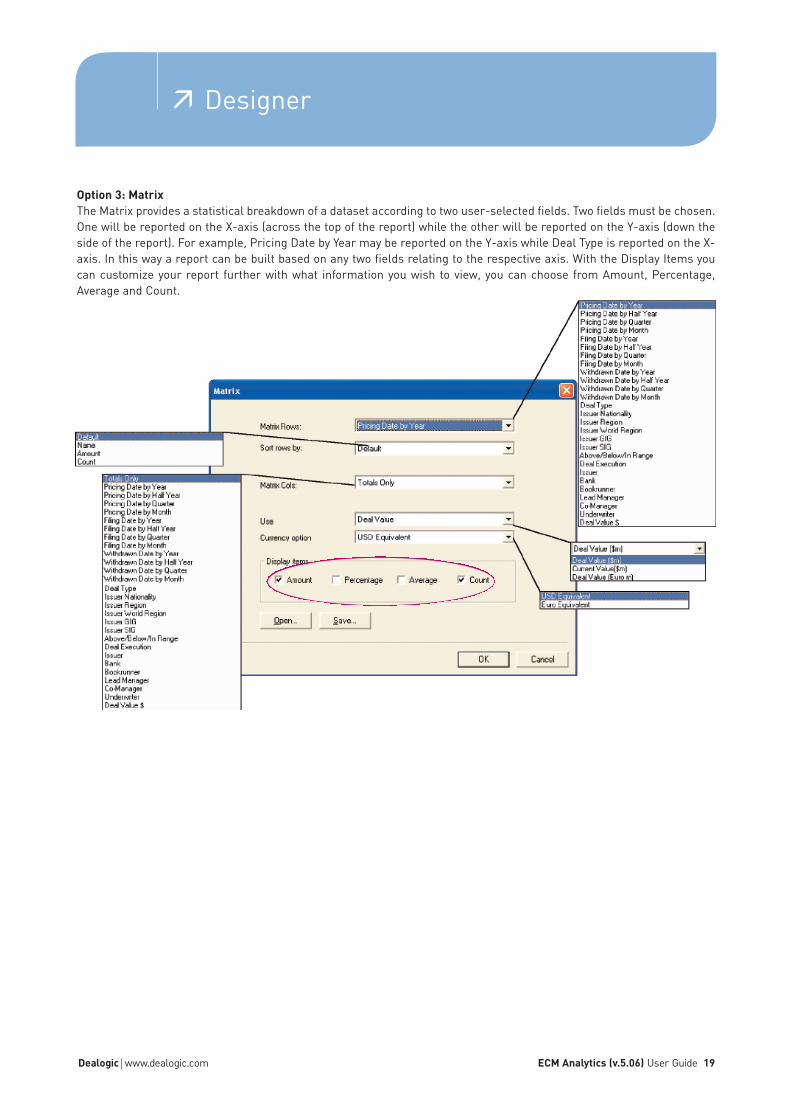
Option 3: MatrixThe Matrix provides a statistical breakdown of a dataset according to two user-selected fields. Two fields must be chosen.One will be reported on the X-axis (across the top of the report) while the other will be reported on the Y-axis (down theside of the report). For example, Pricing Date by Year may be reported on the Y-axis while Deal Type is reported on the X-axis. In this way a report can be built based on any two fields relating to the respective axis. With the Display Items youcan customize your report further with what information you wish to view, you can choose from Amount, Percentage,Average and Count.

ECM Analytics (v.5.06) User Guide 20
Exporting to ExcelThere are three ways to export any User-Defined Report,Ranking or Matrix to Excel from the Designer.
- Right click on the report and select Copy All or go toEdit/Copy All, then past into an Excel spreadsheet.
- From the Edit menu you can also Copy Selection based onany rows highlighted in your current report or table.
- You can export to Excel by pressing the Excel button fromthe tool bar. The advantage of exporting to Excel ratherthan copying the table is that you can retain the formattingas you see it on your screen. Also the criteria will beavailable on the second tab in the same worksheet.
Dealogic www.dealogic.com
≥ Designer

ECM Analytics (v.5.06) User Guide 21
Custom reports can be saved in individual or shared libraries and dynamically generated with up-to-date data using a webbrowser. Output can be printed or copied/exported to Excel.
- A library of saved reports can be accessed on an individual, group or firm-wide basis.- Allows user to share reports with designated individuals or groups. Reports created through the Designer can be
easily saved to MyReports via the Report Wizard, allowing them to be run on a recurring basis.
SearchAt any stage after setting search parameters in your Standard Search and running either a Ranking or User-DefinedReport, you can save one or each of these actions in your libraries for future reference.
This is especially useful when your analysis does not conform to any one of the searches on ScoreCard or frequentlyused reports.
Saving a Standard SearchSteps:• Modify search from ScoreCard – add in any extra criteria to your search or launch the Designer individually from the
Designer icon and create your search.• Save your Search by hitting the Save button, which pulls up a window that allows you to save your report in My Libraries,
it is also possible to create folders in your libraries if required.• Reports saved in the My Libraries folder can only be accessed with your login; reports saved in the Shared folder can be
accessed by other users under the same Client ID.• Name your search and click the Save button when complete.• Retreive this search by clicking the Open tab on the Standard Search screen, this allows you to access all saved reports.
Dealogic www.dealogic.com
≥ Libraries
ECM Analytics (v.5.06) User Guide 22
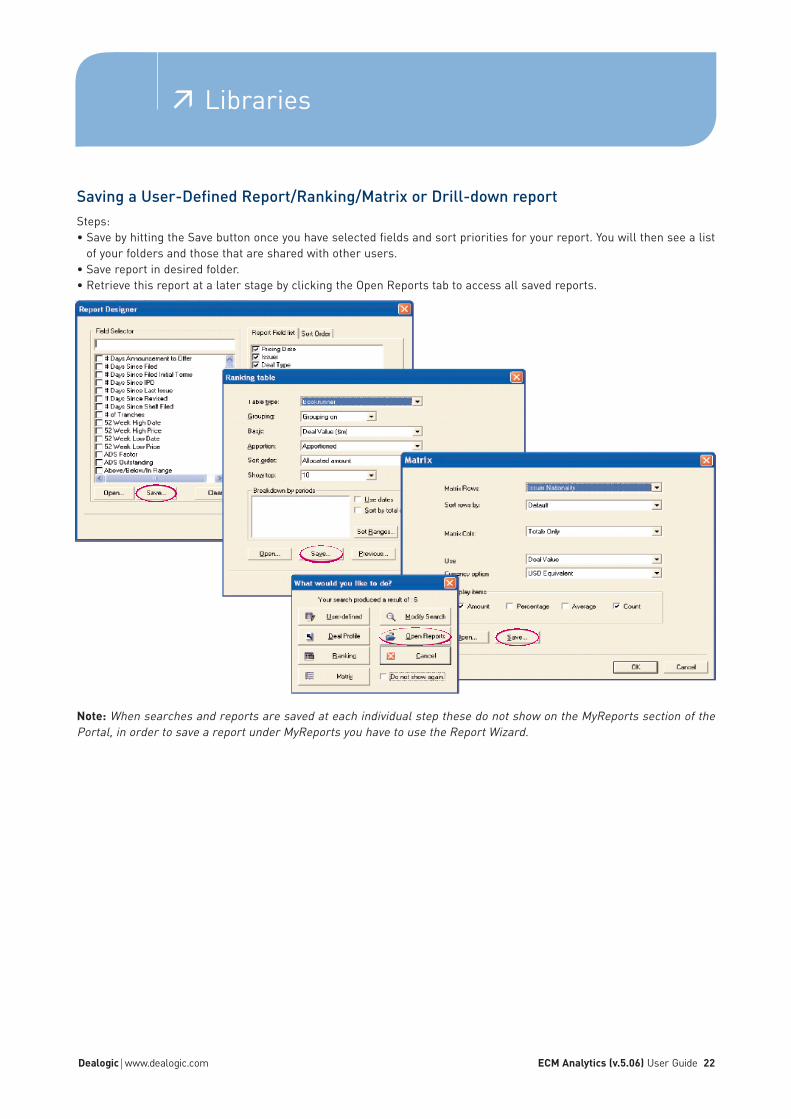
Saving a User-Defined Report/Ranking/Matrix or Drill-down reportSteps:• Save by hitting the Save button once you have selected fields and sort priorities for your report. You will then see a list
of your folders and those that are shared with other users.• Save report in desired folder.• Retrieve this report at a later stage by clicking the Open Reports tab to access all saved reports.
Note: When searches and reports are saved at each individual step these do not show on the MyReports section of thePortal, in order to save a report under MyReports you have to use the Report Wizard.
Dealogic www.dealogic.com
≥ Libraries
ECM Analytics (v.5.06) User Guide 23
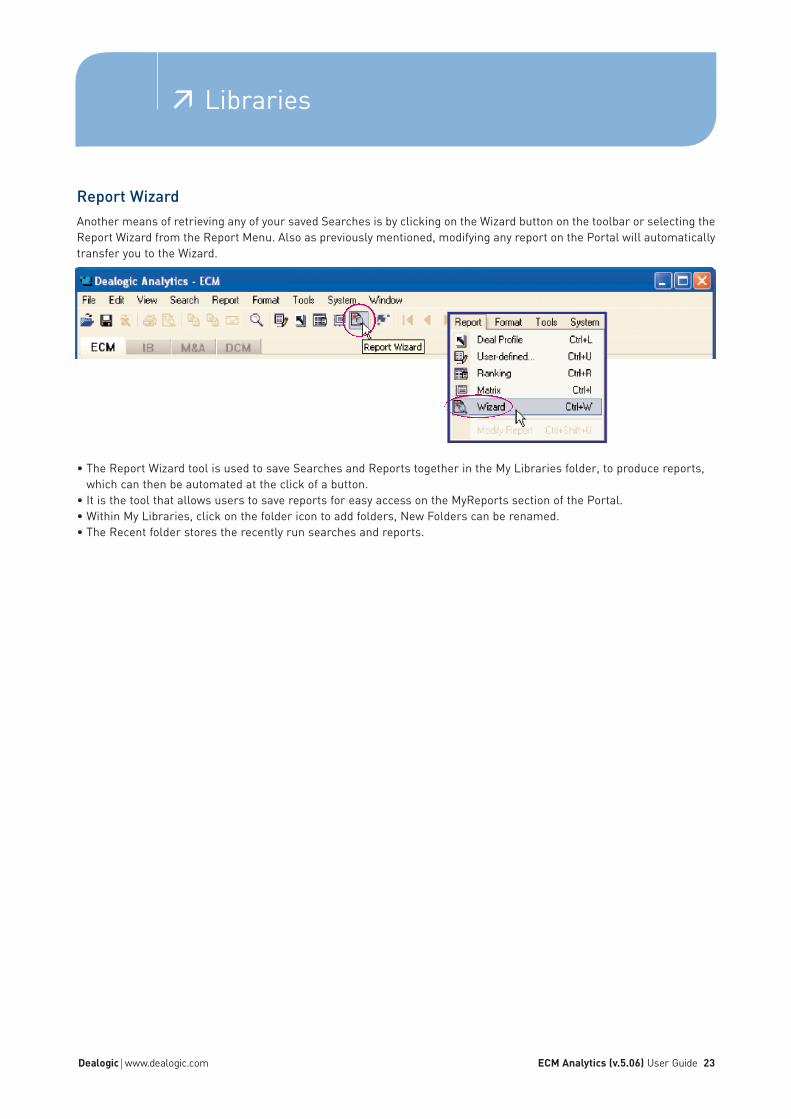
Report WizardAnother means of retrieving any of your saved Searches is by clicking on the Wizard button on the toolbar or selecting theReport Wizard from the Report Menu. Also as previously mentioned, modifying any report on the Portal will automaticallytransfer you to the Wizard.
• The Report Wizard tool is used to save Searches and Reports together in the My Libraries folder, to produce reports, which can then be automated at the click of a button.
• It is the tool that allows users to save reports for easy access on the MyReports section of the Portal.• Within My Libraries, click on the folder icon to add folders, New Folders can be renamed.• The Recent folder stores the recently run searches and reports.
Dealogic www.dealogic.com
≥ Libraries
ECM Analytics (v.5.06) User Guide 24
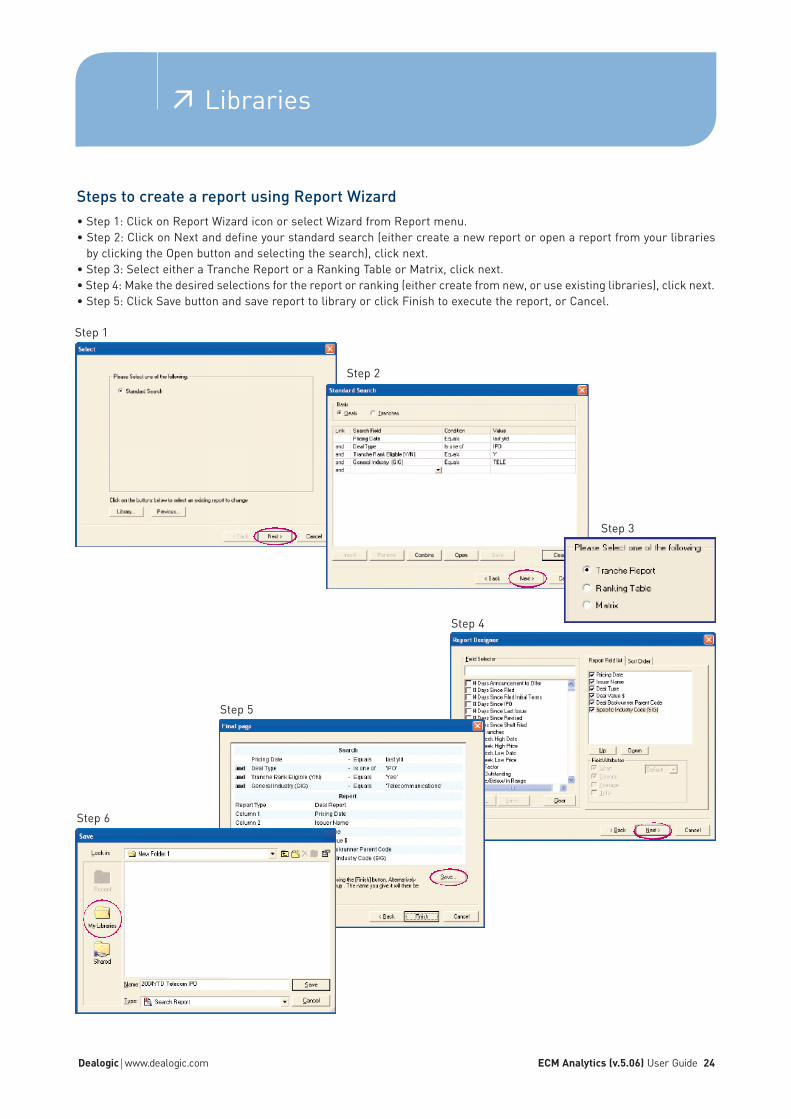
Steps to create a report using Report Wizard• Step 1: Click on Report Wizard icon or select Wizard from Report menu.• Step 2: Click on Next and define your standard search (either create a new report or open a report from your libraries
by clicking the Open button and selecting the search), click next.• Step 3: Select either a Tranche Report or a Ranking Table or Matrix, click next.• Step 4: Make the desired selections for the report or ranking (either create from new, or use existing libraries), click next.• Step 5: Click Save button and save report to library or click Finish to execute the report, or Cancel.
Dealogic www.dealogic.com
≥ Libraries
Step 1
Step 2
Step 3
Step 4
Step 5
Step 6

ECM Analytics (v.5.06) User Guide 25
Sharing ReportsOnce a you have created a report on MyReports it is possible to then share this with and individual or a group.
Steps to share a report:• Step 1: Either return to the Report Wizard and click on Library, or go to File/Open on the toolbar, or the blue folder on
the toolbar.• Step 2: Highlight the report and click the share folder icon with a hand underneath.• Step 3: You will then be given a list of current users. Highlight the user you wish to share the report with and click the
single arrow button to share. To share with the entire list click the double arrow button. • Step 4: Click on the Shared folder to view any reports, which have been shared with you from another user. This report
will also appear on you’re MyReports page, and any reports you have shared will appear on the MyReports page of the user you have shared with.
Dealogic www.dealogic.com
≥ Libraries
Step 2
Step 3
Step 4

ECM Analytics (v.5.06) User Guide 26
Key Search Fields for ECM Analysis1. Tranche Rank Eligible Y/N: All Dealogic standard reports use tranche rank eligible. This excludes the following:
- Closed End Funds - Spot Secondary- Best Efforts- Chinese A-shares- Pre-arranged placements- Accelerated Bookbuilds/Bought deals with undisclosed selling shareholders
2. Deal types: ECM breakdown into 4 top level product types- IPO- FO- CONV- SHELF
3. Pricing Date: Searches on specific dates or time periods. With the added functionality of options for this week, this ytd,last ytd etc that will, when saved in a search on the MyReports page will update accordingly.
4. Deal World Region: Allows top level breakdown of Global ECM into 3 regions (based on nationality of the issuer)- EMEA- Asia Pacific- Americas
5. Deal Region: Allows more granular world breakdown into 11 regions (based on nationality of the issuer).
6. US Marketed Y/N: Includes all deals totally or partially marketed in the US including SEC Registered and 144a (Akin toEquiDesk data).
7. Current Value: The expected amount to be raised on a transaction. This is the value that should be used in BacklogRankings.
Dealogic www.dealogic.com
≥ Appendix A: Key Search Fields

EECCMM AAnnaallyyttiiccss FFiieelldd NNaammee EExxppllaannaattiioonn
ECM Analytics (v.5.06) User Guide 27
DatesAnnouncement Date Date registration information is announcedFiling Date Date security was filed with the SECInitial Terms Date Date security's initial terms were filed with the SECRevision Date Date the latest material revision was filed with the SECLatest Filing Date Latest of filing date, initial terms date or material revision dateExpected Date Expected pricing datePricing Date Date the security is pricedTrade Date Offer date of an issueFirst Trade Date Security's first day of trading on the stock exchangeSettlement Date Date an executed transaction must be settledWithdrawn/Postponed Date Date on which a prospective offering is withdrawn from the market or the intended
issuance cancelledRegistration/Revision Date Latest revision filed with the SECProspectus Off Date For SEC registered deals, date by which point final prospectus must be delivered to investors.
180 days from Trade Date# Days Announcement to Offer Number of days from original SEC filing date to pricing date# Days Since Filed Number of days since the filing date# Days Since Filed Initial Terms Number of days since the issuer filed initial terms with the SEC# Days Since IPO Number of days since IPO priced# Days Since Last Issue Number of days since the last issue priced# Days Since Revised Number of days since the issue was last revised with the SEC# Days Since Shelf Filed Number of days since shelf was filed with the SEC
Share Price FieldsOffer Price Offer price in currency of issueOffer Price (US$) The price at which each security will be offered in US$Last Trade before Filing Last common stock price before filing dateLast Trade before Offer Last common stock price before offer dateLast Trade before Revision Last common stock price before revision dateAsk before Offer The quoted ask price prior to offerBid before Offer Quoted Bid on NASDAQ at last market close prior to pricingFiling Range Original pricing rangeFiling Range Low Low end of pricing range when issue is filedFiling Range High High end of pricing range when issue is filedInitial Mid Point Range Average price based on the filing rangeRevised Range Revised price rangeRevised Range Low Low end of pricing range in the latest revision statementRevised Range High High end of pricing range in the latest revision statementRevised Mid Point Range Midpoint of revised price rangeCurrent Range Pricing range in most recent registration statementCurrent Mid Point Range Midpoint of current price rangeCurrent Range Low Low end of pricing range in the latest revision statementCurrent Range High High end of pricing range in the latest revision statementRevision Direction Indicates what amount the revision specifies as compared to the original filingAbove/Below/In Range Level of offer price compared to initial rangeLast Trade Indicates the closing price of the security of the previous trading day.
For issues no longer trading indicates the last reported priceLast Trade Date Last trade date of the security in the market exchange % Change Price Initial/Offer Percentage change from initial price to the offer price Premium/Discount(Stock) Percentage change from last trade before offer price to offer price.
A negative value indicates a discount.% Change Price Offer/Open Change in security price from offer price to the first trade date opening price % Change Price Offer/1 Day Change in security price from offer date to 1 day later% Change Price Offer/1 Month Change in security price from offer date to 1 month later% Change Price Offer/1 Week Change in security price from offer date to 1 week later% Change Price Offer/2 Weeks Change in security price from offer date to 2 weeks later% Change Price Offer/3 Months Change in security price from offer date to 3 months later% Change Price Offer/6 Months Change in security price from offer price to 6 months later % Change Price Offer/1 Yr Change in security price from offer price to 1 year later % Change Price Offer/Last Quarter Change in security price from offer date to the last quarter% Change Price Offer/Last Year End Change in security price from offer price to the last year% Change Price Offer/Current Change in security price from offer price to current% Change Price 1 Day/Current Change in security price from one day after the offer to the last closing price
Dealogic www.dealogic.com
≥ Appendix B: Field Glossary
EECCMM AAnnaallyyttiiccss FFiieelldd NNaammee EExxppllaannaattiioonn
ECM Analytics (v.5.06) User Guide 28
52 Week High Date Date that 52 week high occurred52 Week High Price Highest common stock price in the past 52 weeks52 Week Low Date Date that 52 week low occurred52 Week Low Price Lowest common stock price in the past 52 weeksOpening Trade Security's open price for the first day of tradingClosing Price - 1 Day Security's closing price one day after the offerClosing Price - 1 Month Security's closing price 1 month after the offerClosing Price - 1 Week Security's closing price 1 week after the offerClosing Price - 2 Weeks Security's closing price 2 weeks after the offerClosing Price - 3 Months Security's closing price 3 month after the offerClosing Price - 6 Months The price for a given security after 6 monthClosing Price - 1 Yr The price for a given security after 1 yearClosing Price - Last Quarter Closing Price of security at the end of the quarterClosing Price - Last Year End The price for a given security at the end of last yearSplit Adjusted Offer Price Offer price adjusted for stock splitsSplit Factor Cumulative factor of all stock splits since the date of the offeringsSplit Date Date the stock split occurredSplit History History of stock splits for security
FeesGross Fee $ per share Gross spread fee expressed in dollars per securityGross Fee % (Disc) Gross spread fee (disclosed) as a percentage of the offer priceUnderwriting Fee $ The portion of gross fee paid to underwriters (lead and co-managers)Management Fees ($) Portion of the gross spread paid to investment managersSelling Concession $ Amount paid to the underwriters for selling the securitiesReallowance $ Portion of the selling concession which is passed on to another securities dealerAccounting Fees ($) Fees and expenses as declared in SEC filingBluesky Fees ($) Fees and Expense related to Blue-sky laws Legal Fees ($) Legal fees associated with the sale of the securityMarket Listing Fees ($) Fees associated with listing the issue on the market exchangeMiscellaneous Fees ($) Other fees associated with the issueNASD Filing Fees ($) Fee associated with filing issue with the NASDPrinting Fees ($) Fee charged by financial printer for red herring and prospectus printingSEC Registration Fee ($) Fee associated with registering issue with the SEC
Issuer FieldsIssuer Name or code of the issuerIssuer Name Full name of the issuerIssuer URL Home page URL of issuerNAICS North American Industry Classification System codeSIC Standard Industrial Classification (SIC) codeGeneral Industry (GIG) General industry code of the firm's primary businessSpecific Industry (SIG) Specific industry code of the firm's primary businessIssuer Business Description Business description for the issuerIssuer Type Classifies the issuer further, i.e. financial, government, industrial etc.Issuer City City in which the issuer is locatedIssuer State State (symbol) in which the issuer is locatedIssuer Nationality Nationality of the issuerDeal Nationality Nationality where the majority of the issuer's business takes placeDeal Subregion Full name of sub-region where the major part of an issuer's business takes place
(i.e. Eastern Europe)Deal Region Full name of region where the major part of an issuer's business takes placeDeal World Region Full name of world region where the major part of an issuer's business takes placeIssuer Parent Parent company of the issuerIssuer Parent Nationality The nationality of parent company to issuerShares Outstanding Number of outstanding shares after the offerMarket Value ($) / (Euro) Indicates the issuer's market capitalization upon completion of the offerFinancials Date Date of the financial statements that appear on the deal profileRevenue ($) Issuer revenue for the fiscal year displayed in the deal profileOperating Income ($) Issuer operating income for the fiscal year displayed in the deal profileNet Income ($) Issuer net income for the fiscal year displayed in the deal profileEPS (FD) Earnings per share (net income divided by shares outstanding)Total Assets ($) Issuer's total assets for prior 12 months (specified date in profile)
Dealogic www.dealogic.com
≥ Appendix B: Field Glossary

EECCMM AAnnaallyyttiiccss FFiieelldd NNaammee EExxppllaannaattiioonn
ECM Analytics (v.5.06) User Guide 29
Total Liabilities Issuer's total liabilities for prior 12 months (specified date in profile)Stockholders Equity ($) Stockholders equity for prior 12 months (specified date in profile)Market to Sales Ratio of a firm's market value to revenueDebt to Equity Ratio of a firm's total debt to its shareholders' equityP/E Ratio Price to earnings ratio from the end of the last fiscal yearDilution Change in EPS that will result from the issuance of new sharesTicker Symbol Ticker symbol of securityExchange Name of the market exchange on which the issue is listedExchange Nationality Nationality of the market exchange on which the issue is listedExchange Previously Traded Exchange in which the security previously was tradedQuote Type Specific underlying exchange or type of listing (OTC, Pink Sheets, Nat'l Mkt)IPO Exchange Exchange in which the IPO is listedIPO Quote Type Specific underlying exchange or type of listing for an IPO (OTC, Pink Sheets, Nat'l Mkt)IPO Ticker Symbol Ticker symbol of a company that makes its first share offering to the public, if availableGuarantor An institution guaranteeing the payment of a the security in the event of default by the issuerGuarantor Nationality The nationality of the institution guaranteeing the payment of a the security in the event of
default by the issuerREIT (Y/N) Indicates if the issuer is a Real Estate Investment TrustREIT Subsector Type of real estate a REIT corporation invests in Underlying Asset General Industry (GIG) General industry code of a security's underlying asset's primary businessUnderlying Asset Specific Industry (SIG) Specific industry code of a security's underlying asset's primary businessUnderlying Asset Parent Nationality The nationality of parent company to Security's underlying assetIssuer Delisted (Y/N) Indicates if the issuer has been delisted from an exchange marketIssuer Delisted Date Date the issuer was delisted
Deal FieldsDeal Type Type of offeringDeal Type of Security Type of security being sold in the offeringDeal Subtype Subtype offering category (i.e. IPO -Fixed Pricing, FO - Bought Deals)
IPO - Fixed Pricing Indicates the IPO is fix PriceIPO - Open Pricing Indicates the IPO is Open PriceFO - Accelerated Bookbuild Indicates the offering was structured as an Accelerated BookbuildFO - Accelerated Bookbuild (Rump placement) Indicates the offering is a rump placement (shares not taken by existing shareholders in
a rights issue)FO - Bought Deal Indicates the offering was structured as a Bought Deal/Block Trade FO - Cash Placing Indicates the offering was structured as a cash placing FO - Fully Marketed Indicates the offering was structured as fully marketed follow-onFO - PIPE Indicates the offering is a PIPE
(private investors under Reg D in the US investing in public companies ) FO - Guaranteed Preferential Allocation Indicates the offering was structured as a Guaranteed Preferential AllocationFO - Registered Direct Indicates the offering was structured as an offering of registered securities by an issuer to
a limited number of accredited investorsFO - Rights Offer Indicates whether or not issuer offers existing shareholder the right to buy more shares at
a discount to the trading price of their existing sharesFO - Top-up Placement Indicates whether the security is a top-up placement (Transaction normally marketed in
Hong Kong and Asia, where a group existing shareholders offer shares to another groupof existing shareholders)
CONV - Debt Indicates whether the convertible bond's instrument are sharesCONV - Preferred Indicates whether the convertible bond's instrument are preferred sharesCONV - PIPE Indicates whether the security is a PIPE (privately issued securities that are sold to
accredited investors under regulation D (US regulation) by public companiesPIPO Indicates whether the offering is a pre-IPO
SEC Registered (Y/N) Indicates if the issue is registered with the SECSEC File Form Type of Securities and Exchange Commission filingRegistration # Number assigned to the offering by the SEC# of Tranches Number of tranches involved in the offering% of Company Sold % of company's stakes, which have been offered in the dealBCC/SPAC (Y/N) Indicates whether the issuer is a Blank Check Company or Special Purpose Acquisition VehicleBDC (Y/N) Indicates whether the issuer is a Business Development CompanyBearer/Registered Whether the shares are held in Bearer or Registered formBest Efforts (Y/N) Non-underwritten offeringBought Deal (Y/N) Indicates if issue is a bought dealCanadian Income Trust Indicates whether issuer is a Canadian Income TrustCarve Out (Y/N) Parent company selling a minority share of a child while retaining a stake
Dealogic www.dealogic.com
≥ Appendix B: Field Glossary

EECCMM AAnnaallyyttiiccss FFiieelldd NNaammee EExxppllaannaattiioonn
ECM Analytics (v.5.06) User Guide 30
Carve Out Parent Name of the company that incorporated a child companyChinese A-shares (Y/N) Share available only to Chinese Nationals and QIFF investorsCompany Acquired (Y/N) Indicates if the company has been acquiredCumulative (Y/N) Arrangement in which a payment due is carried over to the following periodDeal Status Current status of dealDeal US Marketed (Y/N) Sold to US investors either SEC registered or 144ADemutualization (Y/N) A groupe mutuelle that becomes public so policyholders become shareholders Domestic Deal (non-US) Y/N Identifies a deal that has raised capital just in the domestic market Domestic Tranche Identify the tranche to a security, which has raised capital in the local market in the native
currency via a syndicate based in the home countryFirst Follow-On (Y/N) Issuers first follow-on following an IPOInitially Postponed (Y/N) Indicates if the issuer had postponed its pricing dateInitially Postponed Date Date at which the issuer postponed its pricing dateInternational Tranche (Y/N) Identifies the tranche which has raised capital in the international market Internet Related (Y/N) Indicates if the issuer's primary business is internet-relatedLegal Text Specific rules governing the sale of the securityLock-up Expiration Date Expiration date of the lock-up period, in case of multiple lock-up periods the shortest periodLock-up Provision Period of time following an IPO where options cannot be soldLock-up Shares Shares that cannot be sold within a determined time periodMLP (Y/N) Indicates whether issuer is a Master Limited PartnershipOriginal Exchange Move Date Date of transfer of the issuer's listingOvernight Y/N Indicates if the deal is an overnight offering (includes ABBs and Block Trades))Pipe (Y/N) Indicates if the issue is a PIPEPIPO (Y/N) Pre-IPO offering of an issuer expected to subsequently complete an IPOPOWL (Y/N) Public Offering Without Listing. For Japanese deals which are marketed in Japan but
not listed in JapanPrice before Offer (General) Last common stock price before the offer datePricing Fixed/Open Indicate if a security's price is open or fixedPrivatization Y/N A state/government owned entity, which does an equity offeringQuiet Period End Date The period during which the issuer cannot comment publicly on the offeringRank Eligible (Y/N) Filter searches so anything that is not eligible according to Dealogic criteria will be excludedRed Chip (Y/N) Companies incorporated and listed in Hong Kong whose main business is in mainland ChinaRegistered Direct (Y/N) Indicates whether offering is a SEC registered direct private placementRetail/Institutional Target investor baseRetail Tranche (Y/N) Identifies the tranche to a security, which has been offered to retail investorsRights Offer Y/N Indicates if the deal is a rights offer (includes rump placement)Rule 144a (Y/N) Indicates whether the deal is marketed within the United States only to qualified institutional
buyers pursuant to Rule 144A under the Securities Act of 1933Rule 415 (Y/N) Indicates if the offering is under the SEC rule allowing for shelf registrations to be issued
in the futureRump Placement (Y/N) Placement of shares left over from existing shareholders on a rights issueS Corporation (Y/N) Indicates if issuer is a small corporation which has the benefits of incorporation but taxed
as a partnershipSelling Shareholder Name of selling shareholder(s)Selling Shareholder Nationality Nationality of selling shareholder(s)Shares of Beneficial Interest (Y/N) Identifies transaction as consisting of shares of beneficial interestShelf Date Date the shelf was registered with the SECShelf Takedown (Y/N) Indicates if the security is being issued from a shelf registrationShelf Value $ Value of the shelf registrationSimultaneous Offering (Y/N) Indicates whether the issuer is simultaneously offering a different securitySpin Off (Y/N) Sale or distribution of a minority stake in an existing business/division by the parent
company for an IPO or rights offering Sponsor Related (Y/N) Sponsor backed dealsSpot Secondary (Y/N) Follow on which does not require SEC registrationSyndicated (Y/N) Transaction syndicated amongst an underwriting groupSyndicated Loan (Y/N) Banks had a prior lending relationship with the IssuerTarget Market The market (country) that the issue is offered toTarget Market Description Nationality, where the security has been offered to (for a specific tranche)Top-Up Placement (Y/N) Indicates whether the security is a top-up placement (Transaction normally marketed in
Hong Kong and Asia, where a group existing shareholders offer shares to another groupof existing shareholders)
Tracking Stock (Y/N) Stock which pays a dividend based on the performance of a part of a companyType of Derivative Indicates the specific type of derivativeUnit Trust (Y/N) Indicates whether issuer is a Unit TrustUS IPO (Y/N) Indicates whether the offering is the first time an issuer has made a public offering in the US
Dealogic www.dealogic.com
≥ Appendix B: Field Glossary
EECCMM AAnnaallyyttiiccss FFiieelldd NNaammee EExxppllaannaattiioonn
ECM Analytics (v.5.06) User Guide 31
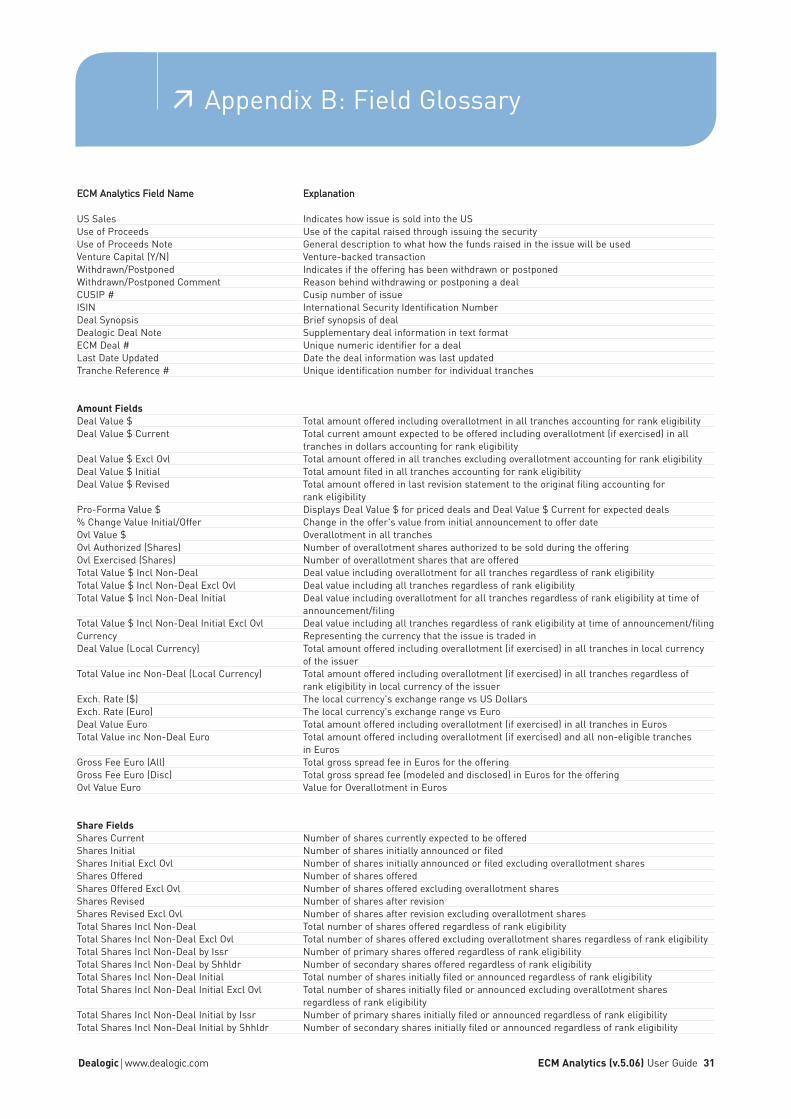
US Sales Indicates how issue is sold into the USUse of Proceeds Use of the capital raised through issuing the securityUse of Proceeds Note General description to what how the funds raised in the issue will be usedVenture Capital (Y/N) Venture-backed transactionWithdrawn/Postponed Indicates if the offering has been withdrawn or postponedWithdrawn/Postponed Comment Reason behind withdrawing or postponing a dealCUSIP # Cusip number of issueISIN International Security Identification NumberDeal Synopsis Brief synopsis of dealDealogic Deal Note Supplementary deal information in text formatECM Deal # Unique numeric identifier for a dealLast Date Updated Date the deal information was last updatedTranche Reference # Unique identification number for individual tranches
Amount FieldsDeal Value $ Total amount offered including overallotment in all tranches accounting for rank eligibilityDeal Value $ Current Total current amount expected to be offered including overallotment (if exercised) in all
tranches in dollars accounting for rank eligibilityDeal Value $ Excl Ovl Total amount offered in all tranches excluding overallotment accounting for rank eligibilityDeal Value $ Initial Total amount filed in all tranches accounting for rank eligibilityDeal Value $ Revised Total amount offered in last revision statement to the original filing accounting for
rank eligibilityPro-Forma Value $ Displays Deal Value $ for priced deals and Deal Value $ Current for expected deals% Change Value Initial/Offer Change in the offer's value from initial announcement to offer dateOvl Value $ Overallotment in all tranchesOvl Authorized (Shares) Number of overallotment shares authorized to be sold during the offeringOvl Exercised (Shares) Number of overallotment shares that are offeredTotal Value $ Incl Non-Deal Deal value including overallotment for all tranches regardless of rank eligibilityTotal Value $ Incl Non-Deal Excl Ovl Deal value including all tranches regardless of rank eligibilityTotal Value $ Incl Non-Deal Initial Deal value including overallotment for all tranches regardless of rank eligibility at time of
announcement/filingTotal Value $ Incl Non-Deal Initial Excl Ovl Deal value including all tranches regardless of rank eligibility at time of announcement/filingCurrency Representing the currency that the issue is traded inDeal Value (Local Currency) Total amount offered including overallotment (if exercised) in all tranches in local currency
of the issuerTotal Value inc Non-Deal (Local Currency) Total amount offered including overallotment (if exercised) in all tranches regardless of
rank eligibility in local currency of the issuerExch. Rate ($) The local currency's exchange range vs US DollarsExch. Rate (Euro) The local currency's exchange range vs EuroDeal Value Euro Total amount offered including overallotment (if exercised) in all tranches in EurosTotal Value inc Non-Deal Euro Total amount offered including overallotment (if exercised) and all non-eligible tranches
in EurosGross Fee Euro (All) Total gross spread fee in Euros for the offeringGross Fee Euro (Disc) Total gross spread fee (modeled and disclosed) in Euros for the offeringOvl Value Euro Value for Overallotment in Euros
Share FieldsShares Current Number of shares currently expected to be offeredShares Initial Number of shares initially announced or filedShares Initial Excl Ovl Number of shares initially announced or filed excluding overallotment sharesShares Offered Number of shares offeredShares Offered Excl Ovl Number of shares offered excluding overallotment sharesShares Revised Number of shares after revisionShares Revised Excl Ovl Number of shares after revision excluding overallotment sharesTotal Shares Incl Non-Deal Total number of shares offered regardless of rank eligibilityTotal Shares Incl Non-Deal Excl Ovl Total number of shares offered excluding overallotment shares regardless of rank eligibilityTotal Shares Incl Non-Deal by Issr Number of primary shares offered regardless of rank eligibilityTotal Shares Incl Non-Deal by Shhldr Number of secondary shares offered regardless of rank eligibilityTotal Shares Incl Non-Deal Initial Total number of shares initially filed or announced regardless of rank eligibilityTotal Shares Incl Non-Deal Initial Excl Ovl Total number of shares initially filed or announced excluding overallotment shares
regardless of rank eligibilityTotal Shares Incl Non-Deal Initial by Issr Number of primary shares initially filed or announced regardless of rank eligibilityTotal Shares Incl Non-Deal Initial by Shhldr Number of secondary shares initially filed or announced regardless of rank eligibility
Dealogic www.dealogic.com
≥ Appendix B: Field Glossary
EECCMM AAnnaallyyttiiccss FFiieelldd NNaammee EExxppllaannaattiioonn
ECM Analytics (v.5.06) User Guide 32
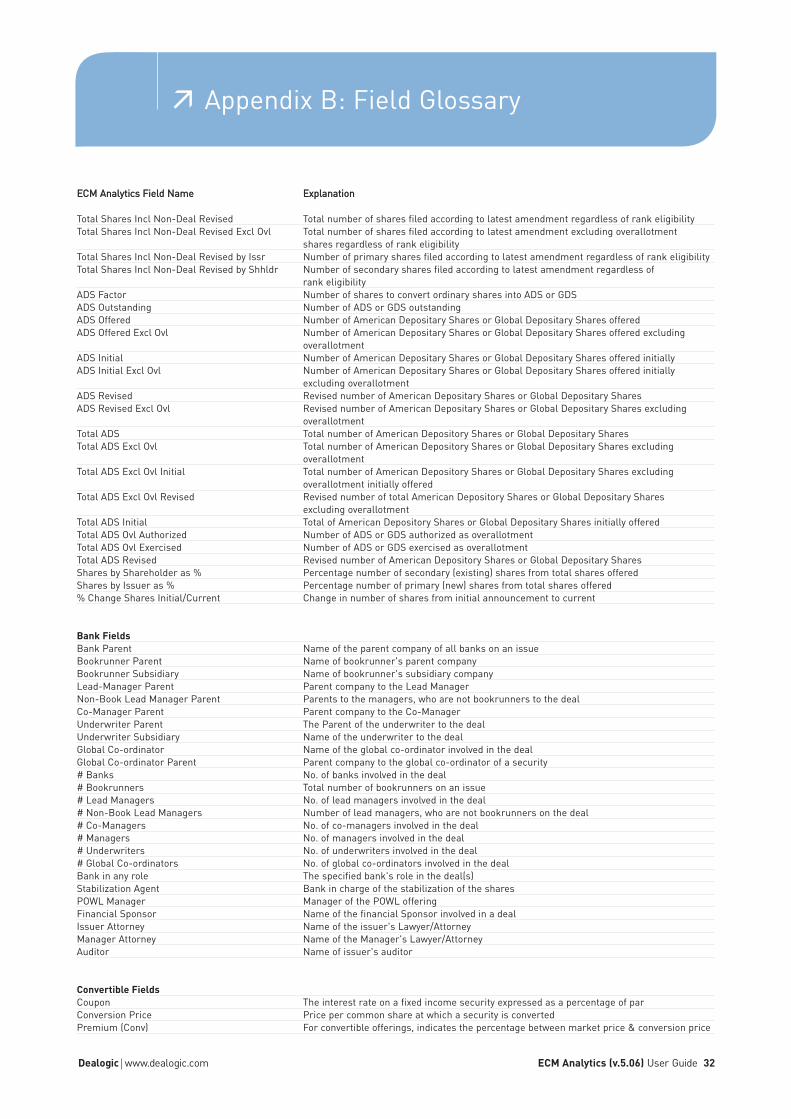
Total Shares Incl Non-Deal Revised Total number of shares filed according to latest amendment regardless of rank eligibilityTotal Shares Incl Non-Deal Revised Excl Ovl Total number of shares filed according to latest amendment excluding overallotment
shares regardless of rank eligibilityTotal Shares Incl Non-Deal Revised by Issr Number of primary shares filed according to latest amendment regardless of rank eligibilityTotal Shares Incl Non-Deal Revised by Shhldr Number of secondary shares filed according to latest amendment regardless of
rank eligibilityADS Factor Number of shares to convert ordinary shares into ADS or GDSADS Outstanding Number of ADS or GDS outstandingADS Offered Number of American Depositary Shares or Global Depositary Shares offeredADS Offered Excl Ovl Number of American Depositary Shares or Global Depositary Shares offered excluding
overallotment ADS Initial Number of American Depositary Shares or Global Depositary Shares offered initiallyADS Initial Excl Ovl Number of American Depositary Shares or Global Depositary Shares offered initially
excluding overallotmentADS Revised Revised number of American Depositary Shares or Global Depositary SharesADS Revised Excl Ovl Revised number of American Depositary Shares or Global Depositary Shares excluding
overallotmentTotal ADS Total number of American Depository Shares or Global Depositary SharesTotal ADS Excl Ovl Total number of American Depository Shares or Global Depositary Shares excluding
overallotmentTotal ADS Excl Ovl Initial Total number of American Depository Shares or Global Depositary Shares excluding
overallotment initially offeredTotal ADS Excl Ovl Revised Revised number of total American Depository Shares or Global Depositary Shares
excluding overallotment Total ADS Initial Total of American Depository Shares or Global Depositary Shares initially offeredTotal ADS Ovl Authorized Number of ADS or GDS authorized as overallotmentTotal ADS Ovl Exercised Number of ADS or GDS exercised as overallotmentTotal ADS Revised Revised number of American Depository Shares or Global Depositary SharesShares by Shareholder as % Percentage number of secondary (existing) shares from total shares offeredShares by Issuer as % Percentage number of primary (new) shares from total shares offered % Change Shares Initial/Current Change in number of shares from initial announcement to current
Bank FieldsBank Parent Name of the parent company of all banks on an issueBookrunner Parent Name of bookrunner's parent companyBookrunner Subsidiary Name of bookrunner's subsidiary companyLead-Manager Parent Parent company to the Lead ManagerNon-Book Lead Manager Parent Parents to the managers, who are not bookrunners to the deal Co-Manager Parent Parent company to the Co-ManagerUnderwriter Parent The Parent of the underwriter to the dealUnderwriter Subsidiary Name of the underwriter to the dealGlobal Co-ordinator Name of the global co-ordinator involved in the dealGlobal Co-ordinator Parent Parent company to the global co-ordinator of a security# Banks No. of banks involved in the deal# Bookrunners Total number of bookrunners on an issue# Lead Managers No. of lead managers involved in the deal# Non-Book Lead Managers Number of lead managers, who are not bookrunners on the deal# Co-Managers No. of co-managers involved in the deal# Managers No. of managers involved in the deal# Underwriters No. of underwriters involved in the deal# Global Co-ordinators No. of global co-ordinators involved in the dealBank in any role The specified bank's role in the deal(s)Stabilization Agent Bank in charge of the stabilization of the sharesPOWL Manager Manager of the POWL offeringFinancial Sponsor Name of the financial Sponsor involved in a dealIssuer Attorney Name of the issuer's Lawyer/AttorneyManager Attorney Name of the Manager's Lawyer/AttorneyAuditor Name of issuer's auditor
Convertible FieldsCoupon The interest rate on a fixed income security expressed as a percentage of parConversion Price Price per common share at which a security is convertedPremium (Conv) For convertible offerings, indicates the percentage between market price & conversion price
Dealogic www.dealogic.com
≥ Appendix B: Field Glossary

ECM Analytics (v.5.06) User Guide 33Dealogic www.dealogic.com
≥ Appendix B: Field Glossary
EECCMM AAnnaallyyttiiccss FFiieelldd NNaammee EExxppllaannaattiioonn
Conv Debt File Price % File price of a convertible debt instrumentConvertible Debt Offer Price % Offer price of a convertible debt instrumentIssue Price Price placed on a new bond expressed as percent of principal amountConvertible Note Specific rules governing the sale of the securityConvertible Preferred File Price Price of underlying common shares at time of Convertible Preferred filingConvertible Rank Indicates if the issue is senior or subordinatedMaturity Date The date on which a debt becomes due for paymentOriginal Talk Coupon % The original price talk couponOriginal Talk Premium % The original price talk premiumCurrent Talk Coupon Initial range of the coupon Current Talk Premium Initial range of the premiumRevised Coupon Coupon in the last revision statementRevised Premium Premium in the last revision statement Yield (Annual) The annual dividend a security will earn with the yield expressed as a percentage of the
amount paid for a securityYield (Semi-Annual) The semi-annual dividend a security will earn with the yield expressed as a percentage
of the amount paid for a securityCommon Price at Announcement Common stock price at filing dateCommon Price at Offer Common stock price at offer dateCommon Price at Revision Common stock price at revision dateReference Price For non-US deals. Common stock price used to calculate conversion premiumAssets Per Bond For convertibles and equity-related bonds, the number of shares or other assets into which
one bond is convertible or exercisableCall Frequency The frequency at which the call option can be exercisedCall Provision Clause granting the issuer the right to retire an issue prior to maturityCommon Dividend Dividend of underlying common stockCommon Yield Yield of common stockConversion Period The period of time at which a security can be converted into equity or a different type
of securityConvertible Rank Indicates if the convertible is senior or subordinatedCoupon Frequency Frequency of the coupon periodDenomination The denominations of a bond, which are available for purchaseExchangeable (Y/N) Indicates whether convertible securities are exchangeable into the common stock of
another corporationFirst Call Date The first date on which the issuer can redeem the bonds before their maturity,
at a specified priceFirst Call Price The price at which a call may be first exercisedFirst Coupon Payment Date First date the coupon will be paidFirst Put Date The first date on which the investor can sell securities back to the issuer at a
pre-determined priceGoverning Laws For convertibles. Region of governing laws.Mandatory Convertible (Y/N) Indicates if convertible has to be mandatory converted at maturityPut Frequency This is the frequency at which the put option can be exercisedPut Price The price at which a security may be sold back to the issuer on the indicated put datesRedemption Price The price at which bonds will be redeemed at maturityReference Price Price of the underlying asset used as reference to price securityYears to Break Even Years over which the conversion premium will be recoupedYears to Maturity Years until the issuer will redeem the issue by paying the principalUnderlying Asset Parent Parent company to the underlying asset for the securityUnderlying Asset Security's underlying assetUnderlying Asset Nationality Nationality for Security's underlying assetHigh Yield / Investment Grade Indicates if the convertible is high yield or investment gradeS & P Rating Issuer's S&P's bond ratingMoody's Rating Issuer's Moody's bond ratingEffective Rating (Launch) Average rating based on Issuer's S&P and Moody's bond rating
Cross System LinksLoanWare Reference # Identification number for deal in Dealogic LoanWare/Loan Analytics databaseM&A Desk Reference # Identification number for deal in Dealogic M&A Desk databaseTranche BondWare Deal # BondWare deal numberTranche EquiDesk Deal # EquiDesk deal number

EECCMM AAnnaallyyttiiccss FFiieelldd NNaammee EExxppllaannaattiioonn
ECM Analytics (v.5.06) User Guide 34
Tranche FieldsHead Tranche Gross Fee $ (Disc) Gross spread amount of head tranche given by bookrunner Tranche # Tranche numberTranche # Banks Number of banks assigned to a particular trancheTranche # Bookrunners Number of bookrunners assigned to a particular trancheTranche # Co-Managers Number of co-managers assigned to a particular trancheTranche # Global Co-ordinators Number of global coordinators participating in a dealTranche # Lead Managers Number of lead managers assigned to a particular trancheTranche # Managers Number of underwriters assigned to a particular trancheTranche # Non-Book Lead Managers Number of non-bookrunner lead managers assigned to a particular trancheTranche # Underwriters Number of underwriters assigned to a particular trancheTranche % Change Price 1 Day/Current Change in security price from 1 day post offer to the last closing priceTranche % Change Price Initial/Current Change in security price from initial price to the last closing priceTranche % Change Price Initial/Offer Change in security price from initial price to the offer priceTranche % Change Price Offer/1 Day Change in security price from offer date to the next dayTranche % Change Price Offer/1 Month Change in security price from offer date to 1 month laterTranche % Change Price Offer/1 Week Change in security price from offer date to 1 week laterTranche % Change Price Offer/1 Yr Change in security price from offer price to 1 year later (for a specific tranche)Tranche % Change Price Offer/2 Weeks Change in security price from offer date to 2 weeks laterTranche % Change Price Offer/3 Months Change in security price from offer date to 3 months laterTranche % Change Price Offer/6 Months Change in security price from offer price to 6 months later (for a specific tranche)Tranche % Change Price Offer/Current Change in security price from offer price to the last closing priceTranche % Change Price Offer/Last Quarter Change in security price from offer date to end of last quarterTranche % Change Price Offer/Last Year End Change in security price from offer price to last year (for a specific tranche)Tranche % Change Price Offer/Open Change in security price from offer price to open price (for a specific tranche)Tranche % Change Shares Initial/Offer Change in number of shares from initial announcement to the offerTranche % Change Value Initial/Offer Change in the offer's value from initial announcement to offer dateTranche Adjusted Offer Price (Local) Offer price, after stock split effects, in tranche's local currencyTranche ADS Excl Ovl Number of ADS offered in a tranch excluding overallotmentTranche ADS Initial Excl Ovl Number of ADS initially announced in a tranch excluding overallotmentTranche ADS Ovl Authorized Number of ADS authorized in overallotmentTranche ADS Ovl Exercised Number of ADS exercised in overallotmentTranche ADS Revised Excl Ovl Number of revised ADS in a tranch excluding overallotmentTranche Bank Parent Parent to the banks assigned to a particular trancheTranche Bank Parent Name Parent to the banks assigned to a particular trancheTranche Bank Subsidiary Subsidiary name of a Bank (not Parent Name)Tranche Bank Subsidiary Name Subsidiary name of a Bank (not Parent Name)Tranche Bank Subsidiary Row ID Unique numeric identifier for a bankTranche Bookrunner Parent Name of the Bookrunner's parent companyTranche Bookrunner Parent Name Name of the Bookrunner's parent companyTranche Bookrunner Participation Number of shares received by each bookrunnerTranche Bookrunner Participation % % of shares received by each bookrunner vs total shares (for a specific tranche)Tranche Bookrunner Subsidiary Name of bookrunner's subsidiary company (for a specific tranche)Tranche Bookrunner Subsidiary Name Name of bookrunner's subsidiary company (for a specific tranche)Tranche Closing Price - 1 Day The price for a given security after 1 day (for a specific tranche)Tranche Closing Price - 1 Month The price for a given security after 1 month (for a specific tranche)Tranche Closing Price - 1 Week The price for a given security after 1 week (for a specific tranche)Tranche Closing Price - 2 Weeks The price for a given security after 2 weeks (for a specific tranche)Tranche Closing Price - 3 Months The price for a given security after 3 months (for a specific tranche)Tranche Closing Price - 6 Months The price for a given security after 6 month (for a specific tranche)Tranche Closing Price - Last Quarter The price for a given security at the end of the last quarterTranche Closing Price - Last Year End Security's closing price for last year (for a specific tranche)Tranche Co-Manager Parent Name of co-managers' parent (for a specific tranche)Tranche Co-Manager Parent Name Name of co-managers' parent (for a specific tranche)Tranche Co-Manager Participation Number of shares received by each co-managerTranche Co-Manager Participation Number of shares received by each co-managerTranche Co-Manager Participation % % of shares received by each co-manager vs total shares (for a specific tranche)Tranche Co-Manager Subsidiary Name of the Co-Manager(s)Tranche Co-Manager Subsidiary Name Name of the Co-Manager(s)Tranche Currency Code Code representing the currency that the issue is traded inTranche Current Mid Point Range Midpoint of current rangeTranche Current Range Current price range (for a specific tranche)Tranche Current Range High High point of current rangeTranche Current Range Low Low point of current rangeTranche Estimated Expenses $ % of Underwriting Fee lost to stabilization and underwriting expenses (estimated)
Dealogic www.dealogic.com
≥ Appendix B: Field Glossary

EECCMM AAnnaallyyttiiccss FFiieelldd NNaammee EExxppllaannaattiioonn
ECM Analytics (v.5.06) User Guide 35Dealogic www.dealogic.com
≥ Appendix B: Field Glossary
Tranche Exch. Rate ($) The local currency's exchange range vs US Dollars (for a specific tranche)Tranche Exch. Rate (Euro) Exchange Rate to EuroTranche Filing Range Initial filing range for a securityTranche Filing Range High Initial filing top range for a securityTranche Filing Range Low Initial filing low range for a securityTranche Fund (Y/N) Investment Fund (Closed End Fund, Open End Fund)Tranche Gross Fee $ (Disc) Disclosed gross spread amount with Overallotment per tranche as given by bookrunner,
or estimated by Dealogic if emptyTranche Gross Spread % (Disc) Disclosed gross spread percent per tranche as given by bookrunner, or estimated by
Dealogic if emptyTranche Initial Mid Point Range The initial mid point range for an issueTranche Instrument Type Tranche type of instrument (i.e. ADS, ordinary shares, common stock, …) Tranche Last Trade Price at which the issue last traded on that tranche's market exchangeTranche Last Trade Date Last trade date of the security in the market exchange (for a specific tranche)Tranche Lead Manager Parent Parent Name to the lead manager(s) associated with a dealTranche Lead Manager Participation Number of shares received by each lead managerTranche Lead Manager Participation Number of shares received by each lead managerTranche Lead Manager Participation % % of shares received by each lead-manager vs total shares (for a specific tranche)Tranche Lead Manager Subsidiary Lead manager(s) associated with a dealTranche Lead/Co Manager Parent Parent to lead and co-manager(s) associated with a deal (for a specific tranche) Tranche Lead/Co Manager Subsidiary Lead and co-manager(s) associated with a deal (for a specific tranche) Tranche Non-Book Lead Manager Parent Parents to the managers, who are not bookrunners to the deal (for a specific tranche)Tranche Non-Book Lead Participation Number of shares received by managers who are not bookrunners to the deal
(for a specific tranche)Tranche Non-Book Lead Participation % % of shares received by each manager, who is not bookrunner vs total shares
(for a specific tranche)Tranche Offer Price Offer price for a trancheTranche Offer Price (US$) Tranche offer price in US DollarsTranche Opening Trade Security's open price on the first day of trading (for a specific tranche)Tranche Overnight (Y/N) Indicates if the tranche was an overnight transactionTranche Ovl Authorized $ Overallotment amount authorized per trancheTranche Ovl Exercised $ Overallotment amount exercised per trancheTranche Retail/Institutional Indicates if the tranche was marketed to retail or institutional investorsTranche Revised Mid Point Range The mid-point amount for the revised price range (for a specific tranche)Tranche Revised Premium Premium in the last revision statement (for a specific tranche)Tranche Revised Range Revised price range (for a specific tranche)Tranche Revised Range High The maximum offer in the revised price range (for a specific tranche)Tranche Revised Range Low The maximum offer in the revised price range (for a specific tranche)Tranche Revision Date Indicates the date, when the change to the price range happens (for a specific tranche)Tranche Revision Direction Indicates the direction of the change to the price range (for a specific tranche)Tranche Rights Offer (Y/N) Indicates whether or not issuer offers existing shareholder the right to buy more shares at
a discount to the trading price of their existing sharesTranche Rule 144a (Y/N) Indicates whether the deal is marketed within the United States only to qualified institutional
buyers pursuant to Rule 144A under the Securities Act of 1933Tranche Shares Initial Excl Ovl Shares filed per tranche in original filingTranche Shares Offered Excl Ovl Shares offered per trancheTranche Shares Revised Excl Ovl Shares filed per tranche in last revision statement to original filingTranche Target Market Nationality, where the security has been offered to Tranche Ticker Symbol Ticker symbol for tranche offeringTranche Total Bookrunner Participation % % of shares received by all bookrunners vs total shares (for a specific tranche)Tranche Total Co-Manager Participation % % of shares received by all co-managers vs total shares (for a specific tranche)Tranche Total Lead Manager Participation % % of shares received by all lead-managers vs total shares (for a specific tranche)Tranche Total Manager Participation % % of shares received by all managers vs total shares (for a specific tranche)Tranche Total Non-Book Lead Participation % % of shares received by all managers, who are not bookrunners vs total shares
(for a specific tranche)Tranche Total Underwriter Participation % % of shares received by all underwriters vs total shares (for a specific tranche)Tranche Type of Security Type of security being sold in the trancheTranche Underwriter Parent Parent company of the security's underwriterTranche Underwriter Parent Name The Parent of the underwriter to the deal (for a specific tranche)Tranche Underwriter Participation Number of shares received by each underwriterTranche Underwriter Participation Number of shares received by each underwriterTranche Underwriter Participation % % of shares received by each underwriter vs total shares (for a specific tranche)Tranche Underwriter Subsidiary Security's underwriter (for a specific tranche)Tranche Underwriter Subsidiary Name Full name of the underwriterTranche US Marketed (Y/N) Indicates if the tranche is marketed in the US
EECCMM AAnnaallyyttiiccss FFiieelldd NNaammee EExxppllaannaattiioonn
ECM Analytics (v.5.06) User Guide 36
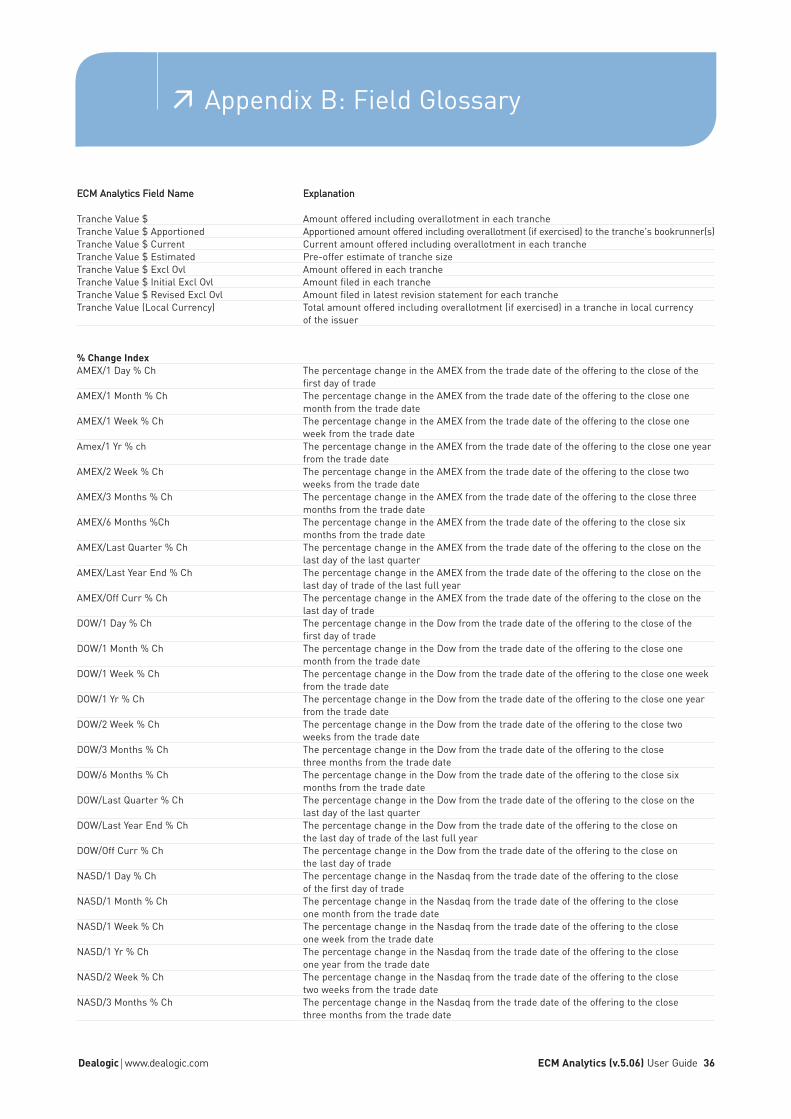
Tranche Value $ Amount offered including overallotment in each trancheTranche Value $ Apportioned Apportioned amount offered including overallotment (if exercised) to the tranche's bookrunner(s)Tranche Value $ Current Current amount offered including overallotment in each trancheTranche Value $ Estimated Pre-offer estimate of tranche sizeTranche Value $ Excl Ovl Amount offered in each trancheTranche Value $ Initial Excl Ovl Amount filed in each trancheTranche Value $ Revised Excl Ovl Amount filed in latest revision statement for each trancheTranche Value (Local Currency) Total amount offered including overallotment (if exercised) in a tranche in local currency
of the issuer
% Change IndexAMEX/1 Day % Ch The percentage change in the AMEX from the trade date of the offering to the close of the
first day of tradeAMEX/1 Month % Ch The percentage change in the AMEX from the trade date of the offering to the close one
month from the trade dateAMEX/1 Week % Ch The percentage change in the AMEX from the trade date of the offering to the close one
week from the trade dateAmex/1 Yr % ch The percentage change in the AMEX from the trade date of the offering to the close one year
from the trade dateAMEX/2 Week % Ch The percentage change in the AMEX from the trade date of the offering to the close two
weeks from the trade dateAMEX/3 Months % Ch The percentage change in the AMEX from the trade date of the offering to the close three
months from the trade dateAMEX/6 Months %Ch The percentage change in the AMEX from the trade date of the offering to the close six
months from the trade dateAMEX/Last Quarter % Ch The percentage change in the AMEX from the trade date of the offering to the close on the
last day of the last quarterAMEX/Last Year End % Ch The percentage change in the AMEX from the trade date of the offering to the close on the
last day of trade of the last full yearAMEX/Off Curr % Ch The percentage change in the AMEX from the trade date of the offering to the close on the
last day of tradeDOW/1 Day % Ch The percentage change in the Dow from the trade date of the offering to the close of the
first day of tradeDOW/1 Month % Ch The percentage change in the Dow from the trade date of the offering to the close one
month from the trade dateDOW/1 Week % Ch The percentage change in the Dow from the trade date of the offering to the close one week
from the trade dateDOW/1 Yr % Ch The percentage change in the Dow from the trade date of the offering to the close one year
from the trade dateDOW/2 Week % Ch The percentage change in the Dow from the trade date of the offering to the close two
weeks from the trade dateDOW/3 Months % Ch The percentage change in the Dow from the trade date of the offering to the close
three months from the trade dateDOW/6 Months % Ch The percentage change in the Dow from the trade date of the offering to the close six
months from the trade dateDOW/Last Quarter % Ch The percentage change in the Dow from the trade date of the offering to the close on the
last day of the last quarterDOW/Last Year End % Ch The percentage change in the Dow from the trade date of the offering to the close on
the last day of trade of the last full yearDOW/Off Curr % Ch The percentage change in the Dow from the trade date of the offering to the close on
the last day of tradeNASD/1 Day % Ch The percentage change in the Nasdaq from the trade date of the offering to the close
of the first day of tradeNASD/1 Month % Ch The percentage change in the Nasdaq from the trade date of the offering to the close
one month from the trade dateNASD/1 Week % Ch The percentage change in the Nasdaq from the trade date of the offering to the close
one week from the trade dateNASD/1 Yr % Ch The percentage change in the Nasdaq from the trade date of the offering to the close
one year from the trade dateNASD/2 Week % Ch The percentage change in the Nasdaq from the trade date of the offering to the close
two weeks from the trade dateNASD/3 Months % Ch The percentage change in the Nasdaq from the trade date of the offering to the close
three months from the trade date
Dealogic www.dealogic.com
≥ Appendix B: Field Glossary

EECCMM AAnnaallyyttiiccss FFiieelldd NNaammee EExxppllaannaattiioonn
ECM Analytics (v.5.06) User Guide 37
NASD/6 Months % Ch The percentage change in the Nasdaq from the trade date of the offering to the closesix months from the trade date
NASD/Last Quarter % Ch The percentage change in the Nasdaq from the trade date of the offering to the closeon the last day of the last quarter
NASD/Last Year End % Ch The percentage change in the Nasdaq from the trade date of the offering to the closeon the last day of trade of the last full year
NASD/Off Curr % Ch The percentage change in the Nasdaq from the trade date of the offering to the closeon the last day of trade
NYSE/1 Day % Ch The percentage change in the NYSE from the trade date of the offering to the closeof the first day of trade
NYSE/1 Month % Ch The percentage change in the NYSE from the trade date of the offering to the closeone month from the trade date
NYSE/1 Week % Ch The percentage change in the NYSE from the trade date of the offering to the closeone week from the trade date
NYSE/1 Yr % Ch The percentage change in the NYSE from the trade date of the offering to the closeone year from the trade date
NYSE/2 Week % Ch The percentage change in the NYSE from the trade date of the offering to the closetwo weeks from the trade date
NYSE/3 Months % Ch The percentage change in the NYSE from the trade date of the offering to the closethree months from the trade date
NYSE/6 Months % Ch The percentage change in the NYSE from the trade date of the offering to the closesix months from the trade date
NYSE/Last Quarter % Ch The percentage change in the NYSE from the trade date of the offering to the closeon the last day of the last quarter
NYSE/Last Year End % Ch The percentage change in the NYSE from the trade date of the offering to the closeon the last day of trade of the last full year
NYSE/Off Curr % Ch The percentage change in the NYSE from the trade date of the offering to the closeon the last day of trade
S&P/1 Day % Ch The percentage change in the S&P from the trade date of the offering to the close ofthe first day of trade
S&P/1 Month % Ch The percentage change in the S&P from the trade date of the offering to the closeone month from the trade date
S&P/1 Week % Ch The percentage change in the S&P from the trade date of the offering to the closeone week from the trade date
S&P/1 Yr % Ch The percentage change in the S&P from the trade date of the offering to the closeone year from the trade date
S&P/2 Week % Ch The percentage change in the S&P from the trade date of the offering to the closetwo weeks from the trade date
S&P/3 Months % Ch The percentage change in the S&P from the trade date of the offering to the closethree months from the trade date
S&P/6 Months % Ch The percentage change in the S&P from the trade date of the offering to the close sixmonths from the trade date
S&P/Last Quarter % Ch The percentage change in the S&P from the trade date of the offering to the close on thelast day of the last quarter
S&P/Last Year End % Ch The percentage change in the S&P from the trade date of the offering to the close onthe last day of trade of the last full year
S&P/Off-Curr % Ch The percentage change in the S&P from the trade date of the offering to the close onthe last day of trade
Dealogic www.dealogic.com
≥ Appendix B: Field Glossary

Dealogic www.dealogic.com ECM Analytics (v.5.06) User Guide 38
ECM Analytics Help and SupportIf you require assistance in performing tasks in ECM Analytics, our worldwide support staff will be pleased to guide youthrough the system, and to suggest the best ways to achieve your results. To help you to get the most out of ECM Analyticsin the future, we are always on hand to provide full training, either at your offices or our own.
Calling the ECM Analytics HotlineWhen you call, we can provide the fastest response to your queries if you are at your computer and running ECM Analytics.If an error should occur, please try to provide the exact wording of any error messages that may have appeared on thescreen, and a description of what you were doing when the problem occurred.
New YorkTel: (+1) 212 577 4400Fax: (+1) 212 577 4545Email: [email protected]
Hong KongTel: (+852) 2528 9111Fax: (+852) 2529 4377Email: [email protected]
≥ Help and Support
LondonTel: (+44) 20 7440 6484Fax: (+44) 20 7440 6481Email: [email protected]
TokyoTel: (+813) 5157 1527Fax: (+813) 5157 1528Email: [email protected]


