1 User Guide for ModuLand Cytoscape plug-in Created for the ModuLand plug-in version 1.4 (May 2012) This user guide is based on the following publications, where the ModuLand method and its versions have been described in detail (Kovacs et al.), and their Cytoscape plug-in has been introduced (Szalay-Bekő et al.). Please cite these publications, if publishing your results with this program. Kovács, I.A., Palotai, R., Szalay-Bekő, M. and Csermely, P. (2010) Community landscapes: a novel, integrative approach for the determination of overlapping network modules. PLoS ONE 7, e12528 Szalay-Bekő, M., Palotai, R., Szappanos, B., Kovács, I.A., Papp, B. and Csermely, P. (2012) ModuLand plug-in for Cytoscape: Determination of hierarchical layers of overlapping network modules and community centrality. http://arxiv.org/abs/1111.3033 Table of Contents System requirements ................................................................................................... 2 Installation instructions................................................................................................ 3 Step-by-step tutorial .................................................................................................... 4 Using the example networks .................................................................................... 4 Starting the plug-in .................................................................................................. 5 ModuLand dialog box.............................................................................................. 7 Running ModuLand modularization ........................................................................ 8 Merging the highly correlated modules .................................................................. 11 Completing all levels of the module hierarchy ....................................................... 12 Colouring the networks according to the module structure and exporting the module assignment data ................................................................................ 13 Visualizing and exporting the network topology measures ..................................... 17 Definitions of the ModuLand measures.................................................................. 19 Loading an existing ModuLand project and exporting a module level overview report ................................................................................................... 21 Updating the plug-in .................................................................................................. 24 Sending comment, feature request or bug report ........................................................ 27 References ................................................................................................................. 28
Transcript
1
User Guide for ModuLand Cytoscape plug-in Created for the ModuLand plug-in version 1.4 (May 2012)
This user guide is based on the following publications, where the ModuLand method and its versions have been described in detail (Kovacs et al.), and their Cytoscape plug-in has been introduced (Szalay-Bekő et al.). Please cite these publications, if publishing your results with this program.
Kovács, I.A., Palotai, R., Szalay-Bekő, M. and Csermely, P. (2010) Community landscapes: a novel, integrative approach for the determination of overlapping network modules. PLoS ONE 7, e12528
Szalay-Bekő, M., Palotai, R., Szappanos, B., Kovács, I.A., Papp, B. and Csermely, P. (2012) ModuLand plug-in for Cytoscape: Determination of hierarchical layers of overlapping network modules and community centrality. http://arxiv.org/abs/1111.3033
Table of Contents
System requirements ...................................................................................................2 Installation instructions................................................................................................3 Step-by-step tutorial ....................................................................................................4
Using the example networks ....................................................................................4 Starting the plug-in ..................................................................................................5 ModuLand dialog box..............................................................................................7 Running ModuLand modularization ........................................................................8 Merging the highly correlated modules ..................................................................11 Completing all levels of the module hierarchy .......................................................12 Colouring the networks according to the module structure and exporting the module assignment data ................................................................................13 Visualizing and exporting the network topology measures .....................................17 Definitions of the ModuLand measures..................................................................19 Loading an existing ModuLand project and exporting a module level overview report...................................................................................................21
Updating the plug-in..................................................................................................24 Sending comment, feature request or bug report ........................................................27 References.................................................................................................................28
System requirements The ModuLand plug-in is integrated to the platform-independent Java environment of the Cytoscape framework. However, calculations of the ModuLand plug-in are not entirely platform independent, since they were implemented in C / C++ language. These calculations were tested on the following operating systems:
Ubuntu Linux 11.4 (32 and 64 bit versions) Microsoft Windows Vista (32 bit) Microsoft Windows 7 (32 bit and 64 bit versions) Mac OS X v10.6 “Snow Leopard”
During the development the following additional software versions were used:
Java 1.6.23 Cytoscape 2.8.1
The ModuLand plug-in requires Java version 1.6 or above. If you have not installed this, or a later version of Java on your desktop, you can download the latest Java Standard Edition JRE from the following link: http://www.oracle.com/technetwork/java/javase/downloads/index.html The ModuLand Cytoscape plug-in requires a Cytoscape program (version 2.8 or later) installed on the host machine. The system requirement for the Cytoscape program is the following:
Small Network Visualization
Large Network Analysis/Visualization
Processor 1GHz As fast as possible
Memory 512MB 2GB+
Graphics Card On board Video Highend Graphics Card
Installation instructions For installing Cytoscape and the ModuLand plug-in, please follow the steps described below. Step 1: Download the latest Cytoscape from http://www.cytoscape.org/download.php
Step 2: Download the latest ModuLand plug-in file form the following link: http://linkgroup.hu/modules_bioinfo_download.php Step 3: Install the downloaded ModuLand plug-in to the Cytoscape program by using the Cytoscape Plugins menu and the Install Plugin from file command:
Step-by-step tutorial In the following chapters we will go through a step-by-step modularization process using the ModuLand Cytoscape plug-in.
Using the example networks
Several example networks are available on the ModuLand plug-in homepage: http://www.linkgroup.hu/modules.php The downloaded zip file contains the example networks in standard GML and Cytoscape compatible CYS format. The later files were saved by Cytoscape 2.8.1 after performing different layout operations on the networks. Both formats contain ‘weight’ attributes can be using for modularization. The current ModuLand plug-in does not support directed networks. We recommend loading the networks in a CYS format, since some Cytoscape versions do not visualize GML type files automatically before running any visual layout operation on the freshly loaded network. CYS format is recommendable all the more, since Cytoscape allows the reproduction of the very same network image only by saving the node-coordinates in the CYS format. This feature also helps to obtain the same images found in the paper describing the ModuLand Cytoscape plug-in [Szalay-Bekő et al. 2012] or in its Supplementary Information.
Throughout this User Guide we will use the E. coli Met-tRNA synthase protein structure network as a test-network, which contains 547 amino acids as nodes and their 3D physical contacts as 2,153 weighted edges.
During the step-by-step modularization process, you will find the numerical data obtained using the Escherichia coli Met-tRNA synthase protein structure network (one of the example networks) included in the plug-in package. We hope these numerical data may help the first-time-user to calculate the very same data and compare it to ours.
Step 1: Download the example networks, and open the following file in an empty Cytoscape session: ‘E-coli-Met-tRNA-synthase-protein-structure-network.cys’
Starting the plug-in
You can start a new ModuLand analysis by selecting any existing network in the Cytoscape Navigator (see “A” on the enclosed figure), and then using the “Starting ModuLand on current network” command from the Plugins menu (B) or clicking to the appropriate icon on the toolbar (C):
B: start ModuLand from the Plugins menu
C: start ModuLand from the toolbar
A: select the network
The loaded Cytoscape session (CYS) file contains one network with 547 nodes and 2,153 edges. The network view is also saved in the file. The nodes are organized by the Organic yLayout.
6
Step 2: Select the network in the Control panel (left side), and start the ModuLand analysis by clicking to the ModuLand icon (marked with ‘C’ on the figure above). After you started the ModuLand analysis, the plug-in will ask you to choose the directory, where all the modularization related data will be stored. Please do not modify the content of this directory later by hand! (If you delete or move some files from this directory, the project can be corrupted.) However, all the exported results and data files will be generated to this directory, so you can find all the reports here, after you closed Cytoscape.
Step 3: Choose an empty project directory. (It is important that your user must have permission to write to the given folder.) In the next dialog, the plug-in will ask you to define, if you wish to run the analysis on a weighted or unweighted network. The ModuLand plug-in takes the weight of the edges from Cytoscape attributes. If you wish to use specific weight values, first you need to import it into Cytoscape in the standard way. It is possible to use any integer, float or Boolean type attribute as ‘weight’ for the ModuLand plug-in and you can set default values in case an edge does not have the selected attribute (or in case the attribute is zero or a negative number).
7
Step 4: Choose the attribute called “weight” from the list. After you selected the weight attribute, the main ModuLand dialog box will open.
ModuLand dialog box
The ModuLand dialog box is showing general information about the module hierarchy and offering several functions to visualize or export the results calculated by the ModuLand plug-in. The dialog can be closed anytime. If you closed the dialog box, you can reopen by selecting the given network on the navigator and using the “Starting ModuLand on current network” button from the toolbar.
On the top of the ModuLand plug-in dialog box you can find a table showing basic information about the different levels of module hierarchy (A). Below the table there are four tabs grouping different buttons and other elements into feature categories (B). Using the “Running ModuLand” tab, you can manage (create and delete) the different levels of the module hierarchy. On the “Merge modules” tab you can merge the extremely overlapping modules (e.g. over the 90% threshold). The “Module Assignment” tab helps you to visualize or export the module structure of the selected network level, while on the “Measures” tab you can calculate and show various structural measures.
A: levels of the module hierarchy
B: operations on the selected level
8
Running ModuLand modularization
On the “Running ModuLand” tab you can run the module determination on the level you selected in the level list on the top of the dialog window. After running the ModuLand algorithms on the selected level by the “Run” button (A), a new level will be created, where the nodes will refer to the modules of the original level, and the edges are weighted according to the module overlaps. You can also open the project folder any time (B), and you can change the weight attribute of the original network (C).
In the first step the LinkLand version of the ModuLand method [Kovacs et al., 2010], which is implemented to the plug-in, is calculating the influence zone of each edge in the network. In the second step the community centrality value of each edge is determined by summing up all the influence-zones containing the given edge. According to our module definition, the module is the set of nodes, which mutually have a large influence on each other. Based on this definition, in the third step the plug-in identifies the overlapping modules as the hills on the community centrality landscape and assign each node of the network to the modules with different strength. The fourth step then is to create the meta-network of modules called the next hierarchical level. If you select option D, the plug-in will skip the first and second steps above, and will directly calculate the overlapping modules from the weights of the network using the weight values as community centrality values. Selection of option D is not recommended when calculating the modules of the original network. In case weights of the original network are representing centrality or density values already, then option D may be selected even for the calculation of modules of the original network. Option D is recommended when calculating the higher hierarchical levels (actually the plug-in uses option D as default in calculating the higher levels of hierarchy). Using option D at higher hierarchical levels will result in a more detailed module structure. Switching off option D and using the LinkLand influence zone (community centrality) calculation method instead at higher levels of hierarchy modules will coalesce more rapidly, which will cause less levels in the hierarchical structure before we reach the final level, where all modules have been coalesced into a single meta-node. By selecting the second option (E), ModuLand will omit the very small overlaps (caused by nodes belonging to a given module by less than 1%) during the creation of the new hierarchical level. This option (E) makes the running of the calculation quicker, and
A
D
E
F
G
B C H
9
results in much less very low intensity edges (e.g. with edge weight less than 0.000001) at the higher hierarchical level. In the usual cases the removal of these extremely weak edges are not changing the module structure too much. However, the influence of this option (E) on the modular structure depends on the network used. Therefore, this option (E) should be used carefully. The use of this option (E) is recommended especially in case of larger networks, where you would expect hundreds of modules. If you are using this option, it is possible that the higher level network will contain more than one component. With the “help” buttons (F and G) you may check the description of these two options any time. You can also delete the calculations on the selected level with the “Clean” button (H). This action will delete all the higher levels together with all exported data files and results. Step 5: Run the ModuLand plug-in on the original network. Press the Run button (do not select any of the two options). This step creates the first hierarchical module level above the original network, and creates a new network that contains nodes representing the modules of the original network. The plug-in summarizes the result of the just accomplished step in an Info window. After running the ModuLand method on the original network, the colour of the nodes will be changed according to the colours of the modules identified by the plug-in.
The Control Panel on the left side shows the list of the networks available in Cytoscape. The newly appeared first hierarchical level module network can be seen in the bottom of the list (A).
A: the new network level
10
Step 6: Close the info window, press double click on the Network tab of the Cytoscape Control Panel to the newly created line, and open the first module level network. By default, the new network is organized by the Grid layout of Cytoscape. Other layouts can be choosen from the Plugin menu (like force-directed layout or different yLayouts). The complex layouts provide a more pleasing view, but they can run for minutes in case of larger networks. Each of the meta-nodes in the new network represents a module, and its name is set to the name of the module centre node in the previous level of network hierarchy (which is in the current case the original network itself). All the meta-nodes of the new network are coloured with a unique colour. Unfortunately it is hard to separate the colours with human eyes, if you have more than 10 to 20 modules. If you select a meta-node in the new hierarchical level, it will select the node with the same name on the original network as well.
The plug-in found 96 modules and counted 2,290 overlaps between module pairs of the test-network, the E. coli Met-tRNA synthase protein structure network. The network visualization of these modules was created in Cytoscape.
11
Merging highly correlated modules
Step 7: Open the ModuLand dialog, select the first line in the level list (representing the original network) and click to the “Merge modules” tab.
You can see the explanation of this feature any time, if you click to the “help” button (A). By selecting this option the plug-in calculates the Module Correlation histogram (B), showing the number of module pairs with the given correlation (similarity) values. If a module pair has high correlation value (close to 1), it means that the two modules are similar, i.e. contain roughly the same nodes with the same intensity. You can also check (C) the correlation matrix containing the correlation values calculated for each module pair. You can decide to merge (E) the highly correlated modules by giving a correlation threshold (D). The merging procedure is always based on the original modules. If you give the threshold value 1, then no modules will be merged. According to our experience the threshold value 0.9 proved to be a reasonable choice in case of highly overlapping modules. If you merge the modules above the given threshold, all measures on the current level of network hierarchy and all information on all higher levels of network hierarchy will be removed automatically, since they were based on the module assignments you just changed by the merge command.
B
A
D
C
E
12
Step 8: Set the threshold value to 0.9, and merge the very similar modules by clicking to the Merge button. After the merging process, a new version of the first hierarchical layer of networks will be created by the plug-in. The plug-in summarizes the result of the processed step on an info window.
Completing all levels of the module hierarchy
Step 9: Close the info window, select the new network and perform the Organic layout option in the Layout / yFiles menu. Then bring the ModuLand plug-in dialog to the front by clicking to the ModuLand icon on the toolbar. Select the second line in the level list, and click on the ‘Running ModuLand’ tab.
Step 10: Click on the Run button to create the next hierarchical level (uncheck both of the two options circled by red dashed lines on the figure above). Run the ModuLand algorithm again on the new level.
49 modules remained in the E. coli Met-tRNA synthase protein structure network after merging of the highly correlated module pairs. The plug-in removed the previous network at the first hierarchical level containing 96 meta-nodes, and created a merged network at this hierarchical level having 49 meta-nodes and 490 edges.
13
Colouring the networks according to the module structure and exporting the module assignment data
On the “Module assignment” tab you can visualize the module structure of the selected level of the module hierarchy in Cytoscape. The four “show” buttons change the colour of the nodes (meta-nodes) either in the network, which belongs to the selected level (A, E), or in the original network (C, H). In both cases you can decide to ask for a discrete module assignment (A, C) where each node belongs to exactly one module. Alternatively, you may ask for the overlapping module assignments (E, H) where the colour of each node is mixed in ratio of the colours of modules, where the node belongs.
After performing this step consecutively, we obtain 4 hierarchical layers of the E. coli Met-tRNA synthase protein structure network. As we go higher and higher in the hierarchical levels, the number of meta-nodes becomes smaller and smaller (49, 5 and 1) until the whole network will finally coalesce into a single meta-node.
14
Step 11: Select the second line (level 1) in the module hierarchy list and go to the ‘Module assignment’ tab. Select the “change also the edge colours” (K) option and then click to the “show” button (H) besides the label “Overlapping module assignment (…) projected to the original level:”.
If you choose to visualize the overlapping module assignments, then you may decide to colour the edges according to the mixed colour of their two nodes (K). The colour of the edges then remains the same until you change them trough other Cytoscape functions, or re-colour the edges of the network without enabling the edge colour option. Please note, if you are saving the network into a Cytoscape session file (.cys), the module structure based colourings of the nodes or edges will not be saved. If you wish to restore these colourings, you will need to re-open the ModuLand project first (see step 14) and then you will be able perform the same colourings. You can also export and open the different module assignment matrixes using a “csv” or “txt” format. First you will see the “export” text on buttons (B), (D), (F) and (I), and after you clicked them and exported the module assignment information then the labels will change to “open”. The discrete module assignment information will be exported in “csv” format, while in the overlapping case the “txt” format is used due to the large amount of
A B
D C
E F
I J
G
K
H
15
data, which can overload some spreadsheet programs, like the earlier versions of Microsoft Excel. In overlapping case you can get extra statistics in “csv” format (buttons G and J). This file lists for every node of the network the module assignment values for the modules the given node mostly belongs. This csv statistics gives a more readable format than the module assignment matrix mentioned before.
Step 12: Click to the button (I) to export the projected overlapping module assignment. The text on the button changed now to “open txt”, and the button (J) become enabled. Open and check both the txt data file and the node info csv file.
After colouring the original E. coli Met-tRNA synthase protein structure network according to the overlapping 5 modules identified on the first hierarchical level, node colours will be mixtures in ratio of the colours of the modules, where the node belongs. Edges are coloured according to the mixed colour of their two nodes.
16
After opening the projected node info csv file exported in the last step, you will see the following table (screenshots taken from Microsoft Excel).
The ModuLand plug-in shows in the csv report file the name of the top 10 modules for each of the original nodes of the original network, decreasingly ordered by the module assignment values. The ModuLand plug-in determines the assignment value for all the node-module pairs. These assignment values are non-negative real numbers, which can be zero, if the given node does not belong to the given module at all. In the csv data file only those modules are listed, where the assignment values were higher than zero. The ten top modules are enough for the most of the cases to have a general overview about the module assignment of the given node.
If you are interested on all the module assignment data (and not just the top ten modules for each node), then you should choose the txt format. The exported txt file contains the complete module assignment data containing all modules, as can be seen on the following page (for visualization we used the Programmer’s Notepad program).
No more than 5 modules will be listed in the analysis of the Met-tRNA synthase, since on the given hierarchical level we have only 5 (meta)modules left.
17
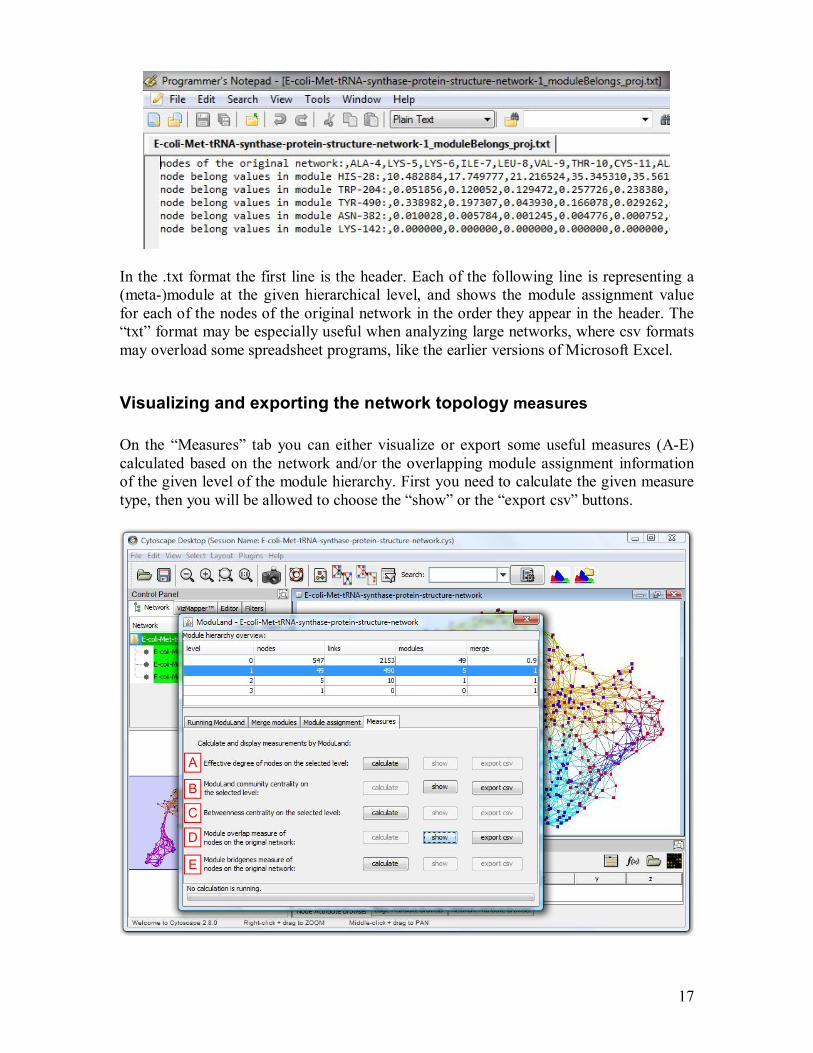
In the .txt format the first line is the header. Each of the following line is representing a (meta-)module at the given hierarchical level, and shows the module assignment value for each of the nodes of the original network in the order they appear in the header. The “txt” format may be especially useful when analyzing large networks, where csv formats may overload some spreadsheet programs, like the earlier versions of Microsoft Excel.
Visualizing and exporting the network topology measures
On the “Measures” tab you can either visualize or export some useful measures (A-E) calculated based on the network and/or the overlapping module assignment information of the given level of the module hierarchy. First you need to calculate the given measure type, then you will be allowed to choose the “show” or the “export csv” buttons.
A
B
C
E
D
18
On the selected level you can calculate the weighted effective degree (A), the ModuLand community centrality (B) and the Betweenness centrality (C) of the nodes. Based on the module structure of the selected level, the ModuLand plug-in can also calculate the “Module overlap measure” (D) and “Module bridgeness measure” (E) values for each node of the original network. If you click on the “show” button, the given measures will be added as attributes to the nodes, and the node colour will set based on the attribute to visualize values on a continuous scale from blue to red.
Step 13: Select the “Measures tab” and calculate the “Module overlap” values. Click to the enabled “show”, “export csv” and “open csv” buttons. Try the other measures as well. Since the data are organized in the same way in case of each measure of the csv file, you can easily merge (‘copy-paste’) into one table the three measures calculated on the selected hierarchical level (effective degree, ModuLand community centrality and betweenness centrality) and the two measures calculated for the nodes of the original network (ModuLand bridgeness and overlap).
After colouring the E. coli Met-tRNA synthase protein structure network according to the module overlap measures calculated on the first hierarchical level, you will see the colours of the nodes to be set according to the measure in blue-to-red scale. If you did not change the edge colours in Cytoscape since the previous steps, the edges are still coloured according to the overlapping module assignments of their nodes visualizing the modules identified on the first hierarchical level of the network.
19
Definitions of the ModuLand measures
To understand the measures calculated by the ModuLand plug-in deeper, it is necessary to understand the basic steps of the ModuLand algorithm [Kovacs et al., 2010]. The LinkLand modularization of a network used in the plug-in is starting by calculating the influence zone of each edge. The second step is to determine the community centrality value for each edge by summing up all the influence zones containing the given edge. According to our module definition, the module is the set of nodes, which mutually have a large influence on each other. Based on this definition, in the third step we identify the overlapping modules as the hills on the community centrality landscape, and assign each node of the network to the modules with different strength. The fourth step then is to create the next hierarchical level, where modules of the original network will be the meta-nodes of the next hierarchical level. Community centrality Community centrality values are reflecting the amount of influence zones containing the given edge. In the ModuLand plug-in the influence zone of an edge is defined by the LinkLand algorithm [Kovacs et al., 2010]. The plug-in uses this algorithm to determine the community centrality values, unless the user disables this option on the ModuLand dialog, and requests to use the weight values instead (see chapter ‘Running ModuLand modularization’).
The calculated measures of the Met-tRNA synthase are shown on the following figure. Since the data are organized in the same way in case of each measure of the csv file, you can easily merge (‘copy-paste’) into one table the three measures calculated on the selected level (effective degree, ModuLand community centrality and betweenness centrality values for each of the 49 meta-modules) and the two measures calculated for the nodes of the original network (ModuLand bridgeness and overlap values for the 547 amino acids).
20
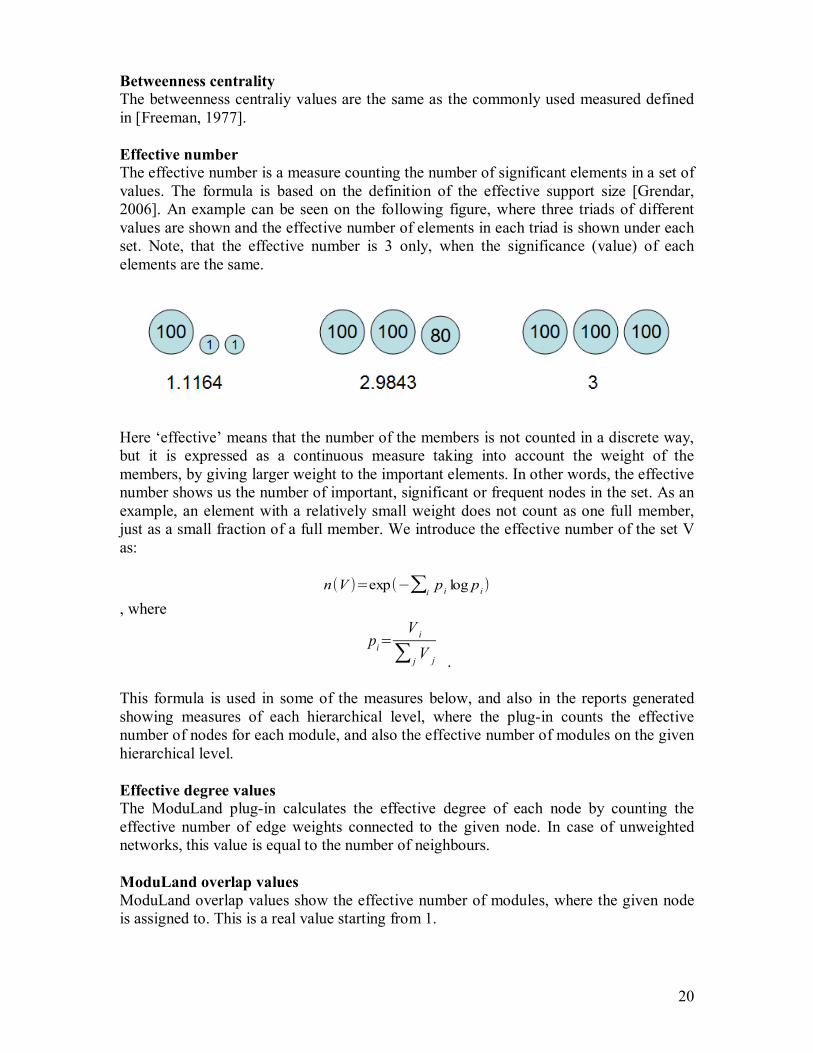
Betweenness centrality The betweenness centraliy values are the same as the commonly used measured defined in [Freeman, 1977]. Effective number The effective number is a measure counting the number of significant elements in a set of values. The formula is based on the definition of the effective support size [Grendar, 2006]. An example can be seen on the following figure, where three triads of different values are shown and the effective number of elements in each triad is shown under each set. Note, that the effective number is 3 only, when the significance (value) of each elements are the same.
Here ‘effective’ means that the number of the members is not counted in a discrete way, but it is expressed as a continuous measure taking into account the weight of the members, by giving larger weight to the important elements. In other words, the effective number shows us the number of important, significant or frequent nodes in the set. As an example, an element with a relatively small weight does not count as one full member, just as a small fraction of a full member. We introduce the effective number of the set V as:
n(V )=exp(−∑i
pilog p
i)
, where
pi=
Vi
∑ jV
j . This formula is used in some of the measures below, and also in the reports generated showing measures of each hierarchical level, where the plug-in counts the effective number of nodes for each module, and also the effective number of modules on the given hierarchical level. Effective degree values The ModuLand plug-in calculates the effective degree of each node by counting the effective number of edge weights connected to the given node. In case of unweighted networks, this value is equal to the number of neighbours. ModuLand overlap values ModuLand overlap values show the effective number of modules, where the given node is assigned to. This is a real value starting from 1.
21
ModuLand bridgeness values ModuLand bridgeness values are real numbers starting from 0. The formula giving bridge values is defined in the Supplementary Information of [Kovacs et al., 2010]. Bridge values are high, if the node has a large overlap between many module pairs.
Loading an existing ModuLand project and exporting a module level overview report
The ModuLand plug-in stores all the project related data in the project directory. If you wish to open an existing ModuLand analysis project, then you need to use the “Open ModuLand project folder” command from the Plugins menu or click on the appropriate icon on the toolbar (A).
Step 14: Create an empty Cytoscape session in the File / New / Session menu. Click the “Open ModuLand project” icon (A) and browse the project folder you defined at the beginning of the tutorial. By performing these options the plug-in will open the ModuLand project, with all of the previous calculations and module levels. Please note, if you are saving the network into a Cytoscape session (.cys) file, the module structure-based colourings of the nodes or edges will not be saved. If you wish to restore these colourings, you will need to re-open the ModuLand project first (see step 11).
A
22
You can generate a report file for the module structure of the current hierarchical level by using buttons (A) and (B) on the “Running ModuLand” tab. The second button (B) will provide information about the module structure of the given hierarchical level projected back to the original network. If you selected the original network level, the projected module structure is the same as the normal module structure. In this case button (B) is disabled. The report file contains general information about the network (number of nodes, edges, modules, etc.) and will list the modules with their central nodes and module size information. First you need to “export” the report files, then the label of the buttons will change to “open …” indicating you can open the generated reports any time.
Step 15: Select the first level (the second line) in the Module hierarchy overview table, then export and open both overview reports (A and B buttons). The screenshot shows the report file of the given hierarchical level projected back to the original network (button B). The report shows the basic information of the given hierarchical level (the number of nodes, edges and modules), the basic information of each module (about the different definitions of the module sizes) and for each module the report lists the top 10 module core nodes (the nodes are decreasingly ordered by their module assignment values).
A B
23
The following figure shows the projected overview report generated about the module structure identified on the first hierarchical level of the Met-tRNA synthase network.
24
Updating the plug-in It is highly recommended to always use the latest version of the ModuLand Cytoscape plug-in. If you wish to update the plug-in, please follow the next steps: Setp 1: Download the latest plug-in version from the http://www.linkgroup.hu/modules.php site. Step 2: Start Cytoscape, and select to the 'Plugins / Manage Plugins' menu item. You will see the ModuLand plug-in in the list: 'Currently Installed / Analysis / Moduland'
Step 4: Restart Cytoscape. Step 5: Install the new plug-in by the 'Plugins / Install Plugin from File' command.
26
Step 5: You can verify the version of the new plug-in in the 'Plugins / Manage Plugins' dialog.
27
Sending comment, feature request or bug report Please use the following link to send us your feedback about the ModuLand Cytoscape plug-in: http://www.linkgroup.hu/moduland_comment.php. Thank you very much for helping us to make this program better!
You can also start the webpage from the ModuLand plug-in, by using the “Send comment or bug report” button on the “Running ModuLand” tab of the main ModuLand dialog.
References Freeman,L.C. (1977) A set of measures of centrality based upon betweenness. Sociometry 40, 35–41. Grendar, M. (2006) Entropy and effective support size. Entropy 8, 169–174. Kovács, I.A., Palotai, R., Szalay-Bekő, M. and Csermely, P. (2010) Community landscapes: a novel, integrative approach for the determination of overlapping network modules. PLoS ONE 7, e12528. Szalay-Bekő, M., Palotai, R., Szappanos, B., Kovács, I.A., Papp, B. and Csermely, P. (2012) ModuLand plug-in for Cytoscape: Determination of hierarchical layers of overlapping network modules and community centrality. http://arxiv.org/abs/1111.3033.