Client TerminalClient Terminal is a part of the online trading system. It is installed on the trader's computer and intended for:· receiving quotes and news in the online mode;· performing trade operations;· controlling and managing open positions and pending orders;· conducting technical analysis;· writing expert advisors, custom indicators, scripts, and functions in MetaQuotes Language 4 (MQL 4);· testing and optimizing trading strategies.
For making a decision to trade, reliable on-line information is necessary. For that, quotes and news are delivered at the terminal in thereal-time mode. On basis of on-line delivered quotes, it is possible to analyze markets using technical indicators and line studies.Expert advisors allow to work off routine of observing markets and the own positions. Moreover, to ensure more flexible control overpositions, several order types are built into the terminal.
The Client Terminal can operate under Microsoft Windows XP/2003/Vista/2008/7. A processor that supports SSE2 instruction sets isrequired for operating as well. Other hardware requirements are limited with software ones.
Getting StartedThis section contains basic information you need to know when starting to work with the client terminal:· Terminal Installation· Terminal Start· Opening of Accounts· Authorization· Security System· Live Update
2 / 164
Client Terminal / Getting Started / Terminal Installation
Terminal InstallationTo install Client Terminal, it is necessary to download its distributive and launch it. Then it will be necessary to choose a directory forinstalling the program there and follow the Installation Wizard tips. After the terminal has been installed it will run automatically.
Terminal can also be installed over an installed version of it. At that, all terminal settings remain as they were in the preceding version.Exceptions can be: DEFAULT profile and template, as well as standard MQL4 programs included in the delivery set. This is why it is notrecommended to change standard templates or profiles, but to create MQL4 programs named uniquely.
If there is a need to work with several accounts simultaneously, the corresponding amount of terminals must be installed in differentdirectories. At that, each terminal has its individual settings, except for registration details and interface language, that are stored inthe Registry.
3 / 164
Client Terminal / Getting Started / Terminal Start
Terminal StartAfter installation has been completed, a group of Client Terminal programs will be created in the "Start" menu, and the program shortcutwill additionally appear on the desktop. They will help to start client terminal.
Attention: Two copies of the Client Terminal are prohibited to be started from the same directory simultaneously. To start severalterminals simultaneously, it is necessary to install the corresponding amount of programs in different directories.
Terminal can be started from the command line, certain parameters having been specified. The account number and profile name canbe used as a parameter. If the account number was specified as this, an attempt to authorize this account will be made at the programstart. If the profile was specified there, it will be downloaded automatically. For example, terminal.exe "123456-'British Pound'", where"123456" is the account number, and British Pound is the profile name. If there are spaces in the command line (like in the above profilename), the double quotation marks should be used. If no spaces occur, there is no need in double quotation marks. Single quotes areused for profile names. For example, terminal.exe 123456-'GBPUSD'. Either login only, or profile and login can be used in the commandline. The profile cannot be used without login.
The terminal can also be started with predefined settings. For more details, please look through the "Configuration at Startup" and"Datacenter.ini" sections.
4 / 164
Client Terminal / Getting Started / Opening of Accounts
Opening of AccountsTerminal allows to work with two 0types of accounts: demo accounts and real accounts. Demo accounts enable working under trainingconditions, without real money on them, but they allow to work out and test trading strategy very well. They possess all the samefunctionality as the real ones. The distinction consists in that demo accounts can be opened without any investments, though onecannot count on any profit from them.
Opening of a Demo AccountA demo account can be opened by the "File — Open an Account" menu command or by the same command of the "Navigator — Accounts"window context menu. Besides, the terminal will offer to open a demo account at the first program start to begin working immediately.
The following data will be requested to open an account:· Name — the user's full name;· Country — country of residence;· State — area (region, territory, state, etc.) of residence;· City — city of residence;· Zip code — zip code;· Address — exact mailing address (street name, house and apartment numbers);· Phone — contact telephone number;· Email — email address;· Account Type — account type to be selected from the list defined by the brokerage company;· Currency — the basic currency of the deposit to be set automatically depending on the account type selected;· Leverage — the ratio between the borrowed and owned funds for trading;· Deposit — the amount of the initial deposit in terms of the basic currency.
To activate the "Next" button and continue registration, it is necessary to flag "I agree to subscribe to your newsletters". Then a servermust be chosen to connect to. Addresses of available servers, their names and ping are listed there. The most preferable is the serverhaving the lowest ping. To perform additional checking the ping, you should press the "Scan" button. After that the ping informationbecomes refreshed. After the registration has successfully completed, a window will appear that contains information about the openaccount: "Login" — the account number, "Password" — the password for access, "Investor" — the investor's password (connection mode inwhich it is possible to check the account status, analyze the price dynamics, etc., but no trading is allowed). After registration has beencompleted, the new account will appear in the "Navigator — Accounts" window, and it is ready to work with. At that, the server sends amessage to the terminal containing login and passwords of this newly opened account. This message can be found in the "Terminal —Mailbox" window. Besides, after the account has been successfully registered, it will be authorized automatically.
Attention: If any problems occur at the account opening, technical support service of the brokerage company should be asked forhelp.
Opening of a Real AccountReal accounts, unlike demo accounts, cannot be opened from the terminal. They can only be opened by brokerage companies undercertain terms and conditions. Real accounts are marked correspondingly in the "Navigator — Accounts" window. To start working withthem, one must perform authorization.
5 / 164
Client Terminal / Getting Started / Authorization
AuthorizationAuthorization is connection of terminal to the server through a login and a password. It allows to manage a trading account. Twoaccesses to the account are possible in the terminal: a normal password and an investor password. Being authorized with the standardpassword, one gets full rights for working with the terminal. Investor authorization allows you to see the account status, analyze prices,and work with your own Expert Advisors, but not trade. Automated trading by Expert Advisors is not allowed either. Investor access is aconvenient tool used for demonstration of trading at the account.
To be authorized, it is necessary to execute the "Login" command of the context menu of the account (context menu is called by clickingwith the right mouse button at the account number) in the "Navigator" window or "File" menu. Then, the account number, one of itspasswords (standard or investor) should be given in the appearing window, and a server should be chosen. After all data have beenspecified, the "Login" button should be pressed.
Attention: If the "Keep personal settings and data at startup", option is enabled, the latest account used will be automaticallyauthorized at the next start of the terminal. The "Keep personal settings and data at startup" option in terminal settings carries outthe same action.
6 / 164
Client Terminal / Getting Started / Security System
Security SystemData exchange between the Client Terminal and the server is performed by encryption based on 128-bit keys. This is sufficient to ensuresecurity of trading. However, besides this system, terminal allows to use one more system: Advanced Security system based on digitalsignature algorithm of RSA. It is an asymmetric encryption algorithm that implies presence of a public and a private key. Public key canbe freely distributed and used for checking the authenticity of a message signed with a private key. Knowing of the public key isguaranteed not to be possible basis for decoding of the private one within an acceptable period of time. Decoding of the private key onthe basis of the public one will take tens or hundreds of years even with modern powerful computers.
Attention: The Advanced Security system based on electronic digital signatures can be enabled on the server.
In the Advanced Security mode, a special window will appear at the first connection to the server that is intended for generation of bothpublic and private keys. To generate keys, it is necessary to move the mouse cursor in the black area of the window in order to generatea random data sequence. Then keys will be generated based on this sequence. The RSA key pair generated is stored on the hard disk,and the public key will be sent to the trading server. Later on, the server will check the authenticity of signed information using thispublic key.
Attention:· If the Advanced Security system is enabled for a trading account, for working at another computer, it is necessary to transfer the
generated RSA keys into this other computer. The keys represent files with KEY extension and are stored in the /CONFIG folder;· if either key has been lost or damaged, it is necessary to refer to the brokerage company technical support service.
7 / 164
Client Terminal / Getting Started / Live Update
Live UpdateA live update system (LiveUpdate) is built into the terminal. It allows to get informed about and install new versions of the programpromptly. This system is always enabled, it is impossible to disable it.
The terminal checks for new versions of the program when it connects to the server. If a new version has been discovered, a newwindow named "Live Update" will appear, the client will be offered to download the update(s). To start downloading these updated files,the "Start" button must be pressed. The updating process and the list of files to be downloaded can be observed in this window. Afterthe updates have been downloaded, the new version of the terminal will be automatically installed and restarted.
Attention:· If there is no connection to the server, the live updating process will not start.· If any problems with live updating occur, the Technical Support Service should be referred to.· When updated, the examples of using expert advisors, indicators and scripts delivered together with the Client Terminal can be
overwritten.
8 / 164
Client Terminal / Client Terminal Settings
Client Terminal SettingsClient Terminal is generally set up in a special window that can be called by the "Tools — Settings" menu command or with acceleratingkeys Ctrl+O. All settings are grouped according to their tasks and located in the following tabs:· Server — setting up parameters of connection to the server, configuring of the used proxy server and Data Centers, as well as other
important settings;· Charts — general setting of the displaying of price charts. It is possible to detect whether period separators, Ask-price level, OHLC
line will be shown. Besides, the amount of bars stored and displayed on the chart can be defined in this tab;· Objects — setting up parameters of objects management. Selection of object after they have been created, their immediate setting,
and docking parameters are defined here;· Trade — parameters of opening new orders by default. They include: financial instrument (symbol), the amount of lots and deviation;· Expert Advisors — settings common for all experts. They include: locking of operation for expert advisors, enabling of importing
functions from external DLL libraries and advisors, as well as a number of other features;· Notifications — setting up sending of push notifications to mobile devices from the client terminal;· Email — setting up email parameters. If there is a necessity to send messages by email directly from the terminal, the parameters of
the mailbox to be used must be set up;· Publisher — setting up publishing reports in internet. The terminal allows to publish reports in the real-time mode that contain
information about the account status in internet. Connection through ftp is used for this purpose that can be set up in this tab;· Events — setting up signals informing about system events. Signals informing about connection unavailability, news incomes, and
others, simplify the work very much.
9 / 164
Client Terminal / Client Terminal Settings / Server
ServerThis tab contains the most important settings changes in which can cause serious troubles in the terminal operation as far as the fulldisconnection. The client terminal is initially configured in the way providing normal, trouble-free operation. Thus, it is highlyrecommended not to change any parameters in this window needlessly.
In the "Settings — Server" window, it is possible:· to choose a server to connect to;· to configure the proxy server;· to set up operation through Data Centers;· to specify and change passwords;· to enable export of quotes through DDE protocol;· to enable income of news.
ServerPractically, the entire work of the Client Terminal is based on data (news and quotes) continuously incoming from the server. If a clientterminal does not receive quotes, it is impossible to trade with it. In such a mode, the terminal allows just to analyze the existing datawith indicators and line studies and test expert advisors. This situation can emerge for a number of reasons, one of them is incorrectsetting of the server connection.
For connecting the client terminal to the server, the exact server IP address (or domain name) and port must be known. After theprogram has been installed, all these data will be specified, there is usually no need to change them. However, if there is a need toconnect to another server, its address and port must be given in the "Server" field. The data must be given in the following format:"[internet address of the server] : [port number]" (without spaces). For example: "192.168.0.1:443", where "192.168.0.1" is the serveraddress, and "443" is the port number. After the data have been input, the "OK" button must be pressed.
The newly set server address and port number are stored on the hard disk. These data do not influence the operation of the clientterminal until an attempt to open a new account is made. It is this moment when the terminal starts using of these given address andport number. The new server address will be added to the list of servers during account registration, and it can be chosen. If connectionto the server succeeds, the new account will be opened. Otherwise, it is recommended to check all settings and try to reconnect.
Attention: Incorrect connection setting is not the only reason for which a new account cannot be opened.
Proxy ServerConnection to internet through a proxy server can be another reason for which the server cannot be connected to. A proxy server is anintermediate between the trader's computer and the trading server. It is mostly used by internet providers or by local networks. If aconnection problem occurs, you should turn to your systems administrator or to the internet provider. If a proxy is used, the terminalmust be set up in a corresponding way. Setting of "Enable proxy server" checkbox will enable proxy server support and activate the"Proxy..." button. Pressing of this button will open the window where proxy server parameters should be specified (these data can begiven by the systems administrator or by internet provider):· Server — proxy server address and type (HTTP, SOCKS5, or SOCKS4);· Login — a user login for access to the proxy server. If login is not needed, this field must remain empty;· Password — a password for access to the proxy server. If password is not needed, this field must remain empty.
After the parameters have been specified, it is recommended to press the "Test" button to check how the settings work. If they havebeen tested successfully, the "OK" button must be pressed in order the settings to be effective. Error message means that the proxyserver was set up incorrectly. To find out about the reasons, the system administrator or internet provider must be contacted again.
Data Centers
Data Centers (access points) are a part of the trading platform and represent specialized proxy servers. They allow to save commontraffic: the same quotes and news are given to several client terminals at the same time. Access points are located between the serverand a client terminal. One server can have several access points through which all traders will connect to it. After a terminal has beeninstalled, connection to Data Centers is set up automatically. It is highly recommended not to change anything. Incorrect setting ofconnections to Data Centers can be the reason for no connection between the terminal and the server.
If there is a necessity to change settings of Data Centers, it is recommended to contact Technical Support Service first. All informationneeded to set up Data Centers correctly can be obtained there. In the most cases, it is sufficient just to flag "Data Center autoconfiguration". After that, the client terminal will choose the most preferable access points automatically.
For manual setting of access points, this option must be disabled. Then, in the activated "Data Center" field, the IP address (or domainname) and port number must be specified. The data must have the following format: "[Data Center internet address] : [port number]".The settings must be checked by pressing the "Test" button located to the left of this field. If settings are correct, the corresponding
10 / 164
The settings must be checked by pressing the "Test" button located to the left of this field. If settings are correct, the correspondingmessage will appear. After that, it will be possible to start working. If an error message appears, the Technical Support service must becontacted to solve the problem.
Attention: It is not recommended to set up access to Data Centers manually without a special need.
Account and LoginClient terminal can connect to the server and work only using an account. There are login (the account number), master and investorpasswords in the Client Terminal. To be authorized, one needs an account number and one of two passwords. The master passwordallows the full access to the account, while the investor one gives only a limited access. Being authorized with the investor passwordgives the right to look through charts, perform technical analysis and test expert advisors, but not trade. Investor password is aconvenient tool showing the trading process at this given account.
After the account has been opened and if "Keep personal settings and data at startup" option is enabled, its data (number, master andinvestor passwords) will be stored at the hard disk. At the program restart, these data will be used to connect the account automatically.If the option is disabled, a password must be entered manually at each restart of the terminal.
The current account number and password are specified in the fields of "Login" and "Password". Data of another account can be input inthese fields, then, after the "OK" button has been pressed, the terminal will try to authorize it. If authorization was not successfullycompleted, the data given should be checked and re-authorized. If this does not help, the Technical Support service should be contacted.
Having pressed the "Change" button, one can specify new passwords in the window appeared. Doing so, one has to know the currentpassword. It can be found in the message sent from the server after registration of a demo account. The new password is input in thecorresponding field. If the "Change investor (read only) password" option is enabled, the investor (not master) password will bechanged.
Data Export through DDE ProtocolQuotes delivered to the terminal can be exported to other applications through "DDE" (Dynamic Data Exchange) protocol. To enableexport of quotes, the "Enable DDE server" option must be enabled and the "OK" button must be pressed. Data delivery will startimmediately. More details about export of quotes can be found in the corresponding section.
NewsTerminal allows to receive financial news promptly. They start to income just after connection to the server. No news issued when theterminal was disconnected will income in it. To enable news delivering, it is necessary to flag "Enable news". In the "Terminal" window,the "News" tab will appear in which news will be delivered as they are issued.
Attention: If the "Enable news" option is enabled, but no news were issued, the "News" tab will not appear in the "Terminal" window.
ChartsCharts show the dynamics of symbol price changes. Charts settings and history data parameters are grouped in this tab. Changing ofparameters in this tab will not cause any global changes in operation of the terminal.· Trade Levels
Lines of open and pending orders placed directly in the chart visualize where exactly the position was opened, when the pending order,Stop Loss or Take Profit will trigger. This option saves traders' work and helps to avoid some mistakes caused by human emotions. Forit to be enabled, the "Show trade levels" must be checked, and the "OK" button must be pressed. At that, the lines corresponding withopen prices of positions and orders will appear in the chart. Of course, if no order or position are opened, no levels will be shown inthe chart. This option is active for open positions or orders only. No closed position will come within its action.
· Ask LineBars in the terminal are built and shown only for Bid prices. However, for opening of long positions and closing of short ones, Ask priceis always used. But it is not shown in the chart in any way, it cannot be seen. To control over one's trading activities more attentively,one can enable the "Show Ask line" parameter. After this command has been executed, an additional horizontal line corresponding withAsk price of the last bar will appear in the chart.
· OHLC LineCharts show the price dynamics, but it is often very difficult to determine exact parameters of the bar by eye. The "Show OHLC"option is very helpful in such situations. It places an additional information line in the upper left corner of each chart. Here, besidesthe symbol name and chart period, prices of the last bar are listed. They are formatted as follows: OPEN, HIGH, LOW and CLOSE(OHLC) — open price of the bar, the highest price of the bar, the lowest price of the bar, and close price of the bar, respectively. Thus,the exact value of the last bar can always be seen.
· Period SeparatorsDate and time of each bar are shown on the chart horizontal axis. The chosen timeframe is the value of this horizontal scale. The"Show period separators" option draws additional vertical lines in the chart that correspond with a larger timeframe. So, for chartshaving timeframe from M1 to H1, daily separators are built, for H4 — weekly, for D1 — monthly, and for W1 and MN1 — yearly ones.
· Color PrintTerminal allows to print not only black-and-white, but also colored charts. The latter ones are more appropriate for analysis thanblack-and-white ones. This option can be enabled by setting of the "Color print" checkbox and then pressing the "OK" button. Afterthat, if the printer allows it, all charts will be printed in color.
· Saving of Deleted Charts TemplatesTerminal allows to restore charts deleted from the workspace. If the "Save deleted charts to reopen" option is enabled, at deleting ofa chart, its template will be saved in the /DELETED directory. Later on, any deleted chart can be restored with the "File — Opendeleted" menu command. For example, it is possible to restore the four-hour chart of EURUSD after it has been deleted. The restoredchart will also be a four-hour one, and all its settings with imposed objects (indicators, line studies) will be restored, as well.
· Amounts of Bars in History and in ChartsBars stored in history and those shown in charts differ from each other. This difference is determined by the fact that any amount ofbars can be kept in the hard disk provided that it has enough space. But the amount of bars shown in the chart is limited by thecomputer resources. To calculate values of technical and custom indicators, bars shown in the chart are used, as well. When a greatamount of indicators and data to be shown are used simultaneously, computer free resources (central processor load and free RAM)can exhaust very soon. To avoid such problems, one can specify the amount of data shown in the charts independently. To do so, onemust choose the suitable value from the pop-up list or enter it manually in the "Max bars in chart" field. The amount of bars to bestored in the hard disk is specified in the "Max bars in history" field. In future, this value will be used for testing expert advisors. Anyamount of bars can be specified here.
Attention:· At the closing of a chart, the amount of bars to be saved will not exceed that given in the "Max bars in history" field.· At the opening of a chart, the amount of bars to be downloaded will not exceed that given in the "Max bars in chart" field. But the
amount of bars in the chart can exceed this value during pumping of quotes.· Values of "Show Ask line", "Show OHLC" and "Show period separators" specified in this window are default parameters. These
parameters can be specified independently for each specific chart in the setup window.· Values of "Show trade levels", "Color print" and "Save deleted charts to reopen" specified in this window influence all the charts
and become active immediately after the "OK" button has been pressed.
ObjectsSettings for working with graphical objects are grouped in this tab. Graphical objects are all line studies placed in the toolbar having thesame name and in the "Insert" menu. They consist of: technical indicators (including custom indicators) , line studies, geometricalfigures, texts, and icons. Parameters collected in this tab facilitate the work with graphical objects and cannot cause critical changes inthe terminal operation.· Show Properties after Creation
All graphical objects possess certain properties. For example, it can be thickness and color of the trend line, period of the indicatorsignal line, etc. The most traders use standard settings of all graphical objects, but it is sometimes necessary to set them upindividually. The "Show properties after creation" option allows to set up objects immediately after they have been imposed. It issuitable when there are many objects having individual settings on the chart.
· Select Object after CreationUnlike indicators, such objects as line studies, text, icons, and geometrical figures are positioned in charts manually. After an objecthas been imposed, there can a need occur to move it, for example, to precise the position of the trend line. To do so, the necessaryobject must be selected first. The "Select object after creation" option allows to do it immediately after the object has been imposedin the chart.
· Select Object by Single Mouse ClickGraphical objects in the terminal can be selected by single or double clicking of the left mouse button. This option allows to switchbetween methods of objects selection. If it is enabled, all objects will be selected by a single click. At that, the double click calls thewindow of the object properties. If this option is disabled, all objects will be selected by a double click.
· Magnet SensitivityThe terminal allows to "magnet" (anchor) checkpoints of objects to different bar prices to locate them more precisely. In the "Magnetsensitivity" field, the sensitivity of this option in pixels can be defined. For example, if the value of 10 is specified, the object willautomatically be anchored to the bar if a checkpoint of the object is located within a radius of 10 pixels from the nearest bar price(OHLC). To disable this option, it is necessary to input parameter 0.
TradeSettings used for orders opening are grouped in this tab. Parameters input here facilitate opening of orders and cannot cause criticalchanges in the terminal operation.· Symbol by Default
The "Symbol by default" option allows to define the symbol value in the "Order" window automatically when a trading operation isperformed. The "Automatic" parameter means that the active chart symbol will be set in this field, the "Last used" — the symbol ofthe latest trade operation. For the same symbol to be set repeatedly, the "Default" parameter must be enabled, and the necessarysymbol chosen from the list.
· Lots by DefaultIn the similar way, the initial amount of lots can be defined ("Lots by default" option): "Last used" is a parameter used in the previousoperation, and "by default" is a constant, manually set value.
· DeviationThe symbol price can change within the ordering time. As a result, the price of the prepared order will not correspond with the marketone, and position will not be opened. The "Deviation" option helps to avoid this. Maximum permissible deviation from the value givenin the order can be specified in this field. If prices do not correspond, the program will modify the order by itself what allows to opena new position.
Expert AdvisorsSettings of working with Expert Advisors are grouped in this tab. Expert Advisors in the terminal are programs written in MetaQuotesLanguage 4 and allowing to analyze and trade in the automatic mode (auto trading). The description of how to create and use experts isgiven in the "Auto Trading" section. The given section describes only settings common for all experts:· Enable Expert Advisors
This option allows to enable or disable the use of all expert advisors. If it is disabled, the start() function will not run for all expertadvisors when a new tick incomes. At that, daggers will appear instead of smileys opposite the names of experts in the upper rightcorner of the chart. To enable expert advisors, it must be enabled and the "OK" button must be pressed. As soon as a new tickincomes, expert advisors will start working, and daggers in the upper right corner of the chart will become smileys again.Experts can be enabled or disabled by pressing of the of the "Standard" toolbar.
Attention:· This option is intended only for expert advisors, and it does not allow to disable custom indicators and scripts automatically.· This option does not influence any experts already running, i.e., an expert will not be stopped during its execution of the start()
function.
· Disable experts when the account has been changedThis option represents a protective mechanism disabling expert advisors when the account is changed. It is useful, for example, whenone changes demo account for a real one. For the mechanism to be enabled, it must be enabled and the "OK" button must be pressed.
· Disable experts when the profile has been changedA large amount of information about the current settings of all charts in the workspace is stored in profiles. Particularly, profilescontain information about experts attached. Experts included into the profile will start working when a new tick incomes. Havingenabled this option, one can hinder the experts launching when the profile has been changed.
· Allow live tradingExpert advisors are able to work independently, without any trader's participation. They can both analyze the price changes and trade.This option is intended for limitation of trading performed by experts. This limitation can be useful to test analytical capacity of anexpert in the real-time mode (not to be confused with testing expert advisors on history data).
· Manual confirmationThe "Manual confirmation" option is enabled only if live trading is enabled for expert advisors. If manual confirmation is enabled andexpert attempts to perform a trade operation, it will be possible to confirm it or to interrupt manually. In other words, manualconfirmation allows to control the trading activity of the advisor. At that, the window of trade operations with all fields filled outappears. This can be useful for testing the expert advisor trading functions in the real-time mode (not to be confused with testingexpert advisors on history data).
· Allow DLL importsTo enlarge their functionality, expert advisors can use DLLs (dynamic-links libraries). If it is enabled, such libraries can be usedwithout any limitations. If this option is disabled, no expert can use external DLLs. It is recommended to disable import when workingwith unknown experts.
· Confirm DLL function callsThis option will only be enabled if DLL imports have been allowed. It allows to perform manual control over execution of each functioncalled. If it is disabled, import from external DLLs will not be controlled. It is recommended to enable this option when working withunknown libraries.
· Allow external experts importsIf there is a need to import functions from other experts or MQL4 libraries during the expert advisor operation, this option must beenabled. If it is disabled, no one of the running experts will be able to request functions from other MQL4 programs. It isrecommended to disable this option when working with unknown expert advisors.
Attention: Values of options named "Allow live trading", "Ask manual confirmation", "Allow DLL imports", "Confirm DLL functioncalls", and "Allow external experts imports" specified in this window are default parameters for MQL4 programs newly attached.They do not influence the operation of expert advisors, custom indicators and scripts already running.
NotificationsThe client terminal supports sending of notifications about various events to mobile devices powered by iOS and Android using pushmessages. With this feature, a trader can track all the updates.
Push notifications are short messages of up to 255 characters. Such notification are delivered immediately and are never lost.
There are two ways to send push notifications from the client terminal:
Through an MQL4 applicationThe MQL4 language provides a special SendNotification function which allows MQL4 programs to send push notifications to aMetaQuotes ID specified in the terminal settings.
Through the signals functionThe client terminal allows you to create signals for alerting you of events in the market. This feature is available in the Signals tab ofthe Terminal window. One of the event notification types is push notifications.
There is a limitation on the number of messages that can be sent: no more than 1 message per 0,5 second and no more that 10messages per minute.
To allow the client terminal to send notifications, enable the "Allow push notifications" option.
Next, enter one or more MetaQuotes IDs, separated by commas. To find your MetaQuotes ID, open your mobile terminal and go toSettings -> Messages.
To test the function notification sending, click Test. If your notification is successfully sent, you see an appropriate message, and thenotification will arrive on your mobile device.
To install the mobile version of the terminal, use the following links:· Mobile Terminal for iPhone· Mobile Terminal for Android
EmailIn this tab, the electronic mailbox is set up. Later on, these settings will be used to send message by the expert advisor command or bya triggered alert. To start setting up of email, the "Enable" must be enabled and the following fields must be filled out:· SMTP Server — address of the SMTP server and port used. This server will be utilized to send the message. The record must be made
in the following format "[server web address] : [port number]". For example, "smtp.your_email_provider.com:25" where"smtp.your_email_provider.com" is the server web address, "25" is the port number.
· SMTP Login — a login to be authorized on the trade server. Normally, it is an electronic mailbox. Example:your_name@your_email_provider.com
· SMTP Password — a password to be authorized (mailbox access password).· From — the email address, from which the message will be sent. In this field, there must be name and emailing address on the mail
server, the SMTP of which will be utilized. The name usually coincides with the first part of the electronic address, but the name canbe omitted. Example: your_name, your_name@your_email_provider.com
· To — the email address, to which the messages will be sent. The "Your Name" part of the address can be omitted. Generally, in the"To" field, any really existing email can be specified. Example: any_name, your_name@your_email_provider.com
Attention: Only one email address may be specified for either of fields "From" and "To". Several emails given with or withoutseparators will not be accepted.
The "Test" sends a test message using the settings specified to test their workability. If it has been tested successfully, the "OK" buttonmust be pressed to apply these settings. In case the test did not succeed, it is recommended to check all settings again, restart theterminal and resend the test message.
PublisherTerminal allows to publish reports about the account status in internet automatically. To do so, one has to set up internet connectionparameters through FTP (File Transfer Protocol). This can be done in the "Publisher" tab:· Enable — enable support reports publishing. If disabled, other fields are inaccessible;· Account — the account number the report for which should be published;
Attention: Reports of only active accounts can be published. If the account number given in this field does not match with thecurrent one, the reports will not be published.
· Refresh every — periodicity of sending reports to the web server (in minutes);· FTP server — FTP server address the report to be sent to. Example: ftp.your_domain_name.com· FTP path — name of the FTP server directory where the report will be placed. The path (starting with the root directory) for sending
reports must be given in this field. Example: /report_shots· FTP login — login for authorization at the FTP server;· FTP password — password for access to the FTP server;· Passive mode — switch between active and passive mode of data transfer.
In active mode, a free port (from dynamic range of 1024 to 65535) is allotted in the client terminal to which the server will connect inorder to set connection for transferring of data. The FTP server connects to the client's port with the given number using TCP port 20from its part to transfer data. In passive mode, the server informs the client about the TCP port number (from the dynamic range of1024 to 65535) to which the client can connect to set up data transfer. The main difference between active and passive FTP mode is the part that opens connection for data transferring. In active mode, itis the client who has to accept connection from the FTP server. In passive mode, the client initiates connection, and the serveraccepts it.
The "Test" button sends report about the current account status using the specified settings that allows to check their workability. If ithas been tested successfully, the "OK" button must be pressed to activate these settings. If the test did not succeed, it is recommendedto check all settings again and retest.
The client terminal publishes common reports on default. In order to publish a detailed report, you should rename the"StatementDetailed.htm" file located in the /TEMPLATES directory into "Statement.htm".
EventsSignals of system events can be set up in the terminal (not to be mixed up with alerts). It is a very convenient tool informing aboutchanges in the terminal status. Signals can be set up in this tab. For this to be done, the "Enable" option must be enabled first. At that,a table containing the list of system events and corresponding actions will become active. System events are:· Connect — connection to the server. Signal of successful connection to the server;· Disconnect — no connection to the server. Signal of interrupted connection to the server;· Email Notify — notifying by email. If this signal has triggered, it is recommended to check the "Terminal — Mailbox" window;· Timeout — a certain time range is predefined for performing trade operations. If this range has been exceeded for some reason, the
operation will not be performed, and this signal will trigger;· OK — trade operation has been successfully performed. No errors occurred when performing this operation;· News — receiving of news. If this signal has triggered, it is recommended to check the "Terminal — News" window;· Expert Advisor — this signal triggers when an expert advisor is performing a trade operation;· Expert Confirmation — request to experts for confirmation of a trade operation. Such signal can only trigger if the "Manual
confirmation" option is enabled;· Alert — performing the Alert() function by an expert advisor;· Requote — price changed during preparation of a trade operation;· Trailing Stop — triggering of the order of the same name.
If there is a need to disable any of the signals, it is necessary to double-click on its name or icon with the left mouse button. Anotherdouble click will activate it again. After the signal has been triggered, the file specified in the "Action" field of the corresponding eventwill run. A double click on the file name allows to change the file. After double-clicking a pop-up list of available files to be assigned forthe event will appear. You can also choose any other file by using the "Choose other..." item in the list. Selection of any file from this listand further Enter button pressing means that it is assigned to the corresponding event. To confirm all changes made, one has to pressthe "OK" button.
Attention: Any file executable in the operation system can be assigned to the event.
19 / 164
Client Terminal / User Interface
User InterfaceInterface of the terminal includes the following components:· Common Window Heading
The program heading includes the current account number, application name, as well as the active chart window name and its period(timeframe).
· Main MenuAll commands and functions that can be executed in the client terminal are collected in its main menu. It contains: "File", "View","Insert", "Charts", "Tools", "Window", "Help".More details can be found in the "Main Menu" section.
· ToolbarsFour toolbars are built into the terminal: "Standard", "Charts", "Line Studies", and "Periodicity". The toolbars contain duplicatedcommands and functions of the main menu. However, these toolbars are customizable, so one can collect only mostly used widgets inthem.More details can be found in the "Toolbars" section.
· Market WatchThis window contains the symbol list. Commands of this window allow to control trade positions and charts.More details can be found in the "Market Watch" section.
· Data WindowThis window shows information about prices, as well as indicators and expert advisors imposed. This data window does not allow toperform any actions.More details can be found in the "Data Window" section.
· NavigatorOpen accounts, expert advisors, indicators, and scripts are grouped in the navigation window. The "Navigator" can help to controlthem promptly.More details can be found in the "Navigator" section.
· TerminalTerminal is a multifunctional window intended for working with trade positions, news, account history, alerts, internal mail, and logsof the program and of expert advisors, as well. Moreover, the "Terminal" window allows to open and modify orders of different kindsand manage trade positions.More details can be found in the "Terminal" section.
· TesterThis window is intended for testing expert advisors. Besides testing and viewing of various reports, the expert parameters can beoptimized in this window, as well.More details can be found in the "Tester" section.
· Tick ChartsA tick chart is the basis of data analysis. Besides price changes, various analytical objects can be located in the chart: line studies,technical and custom indicators, texts, and geometrical figures.More details can be found in the "Working with Charts" section.
· Status BarFor additional information to be visualized, the status bar is used in the terminal. The status bar contains indicator of the serverconnection, amount of incoming and outgoing traffic, names of active template and profile, as well as command prompts and pricedata.
· Fast Navigation ToolsHot keys, acceleration keys, and fast navigation bar are intended for quick work with the terminal. Using of keys allows to executevarious commands of the program promptly, and the fast navigation bar makes it possible to move the chart along its time baseprecisely, change its timeframe, and even the symbol itself.More details can be found in the "Fast Navigation Tools".
20 / 164
Client Terminal / User Interface / Main Menu
Main MenuThe main menu of the terminal is located under the program heading and represents a set of sub-menus. Commands and functions to beexecuted in the client terminal are collected in it. The main menu consists of:· File
Working with charts, storing of history data and profiles, and print.· View
Setting toolbar, managing command windows ("Market Watch", "Data Window", "Navigator", "Terminal", "Tester") and the programinterface language.
· InsertManaging technical indicators, line studies, and other objects.
· ChartsSetting of bars displaying, scale, managing the imposed objects, presence of grid, chart properties.
· ToolsGeneral settings of the client terminal, History Center, global variables, and MetaEditor (MetaQuotes Language 4 editor).
· WindowThe list of open charts and their locations.
· HelpUserguide and information about the program.
21 / 164
Client Terminal / User Interface / Main Menu / File
FileCommands for working with charts, managing profiles, storing history data and charts are collected in this menu, as well as chartsprinting properties. The following commands are available in the menu:· New Chart — open a new chart window for the symbol. At the command execution, the list of available symbols will appear. Having
selected a symbol from the list, one can open a new chart.The same actions can be performed by the button of the "Standard" toolbar.
· Open Offline — open a symbol chart offline. By this command, one will be able to select a necessary file with its history data beingstored. At that, the new quotes for this symbol will not be shown in the chart. Offline chart opening can be useful at testing expertadvisors.
· Open Deleted — restore a deleted chart. The deleted charts will be restored if the "Save deleted charts to reopen" is enabled in theterminal settings. All deleted charts templates are stored in the /DELETED directory. At this command execution, these templates arecalled, and the corresponding chart will be opened.
· Profiles — open sub-menu for managing profiles. Profiles can be stored or deleted from this sub-menu, as well as previously storedones can be downloaded.This profile managing sub-menu can also be called by the button of the "Standard" toolbar.
More details can be found in the "Profiles and Templates" section.· Close — close the current chart.· Save As — save history data as a text file in "CSV", "PRN", or "HTM" format.· Save As Picture... — save the chart in "BMP" or "GIF" format. Once you have pressed it, the window containing the alternatives of a
terminal area to be saved appears: "Active workspace", "Active chart (as is)", and "Active chart" showing the specific size.The same actions can be performed by the chart context menu command of the same name.
· Open an Account — open a new demo account. Such accounts can be opened without placing of any money onto the deposit and allowto test the own trading system well.To open an account, one can also execute the context menu command of the same name of the "Navigator — Accounts" window orpress the Insert button.
· Login — authorize. At this command execution, the terminal tries to connect to the server using the account selected. Aftersuccessful authorization, quotes and news will start to income, and one can start trading.It is possible to authorize having executed the "Login" command of the context menu of the or double-click on the account name.
· Print Setup... — general setup of printing parameters — printing device, page size and orientation, etc.· Print Preview — preview the chart before printing it. The settings of the selected printer are used at this. This command helps to
preview before printing whether all desired data can be printed with the settings given.The same actions can be performed having pressed the button of the "Standard" toolbar or having executed the chart context
menu command of the same name.· Print... — print a chart. If the "Color Print" option is enabled in the program settings, the chart can be printed in color, not as a black-
and-white one.The same actions can be performed by pressing of the button of the "Standard" toolbar, accelerating buttons of Ctrl+P or by
execution of the "Print" chart context menu command.· Exit — the terminal shutdown.
Attention: If the terminal is shut down, the expert advisors and Trailing Stops will not be executed.
22 / 164
Client Terminal / User Interface / Main Menu / View
ViewCommands managing signal windows, toolbars, and the program interface language, are grouped in this window. Some of thesecommands are duplicated in the "Standard" toolbar. The following commands are available in the menu:· Languages — call the sub-menu managing languages of the Client Terminal. Having selected a desired language, one can switch the
terminal interface to this language. For the changes to take effect, the program must be restarted;· Toolbars — call the sub-menu managing toolbars. Active toolbars are checked. Selection of a toolbar allows to enable or disable it.
The "Customize..." command allows to assign any buttons for any toolbars. At that, a new window containing the list of toolbarelements available. The "Insert" and "Remove" buttons allow to add or remove an element from the toolbar. The "Up" and "Down"buttons are intended for defining the location of a button in the toolbar. To reset the toolbar to appear as initially, one has to pressthe "Reset" button.
· Status Bar — enable/disable status bar located in the lower part of the terminal window. This data bar contains (from left to right):menu managing profiles, time and prices of the bar selected, and indicator of server connection and amounts of incoming/outgoingtraffic. Having pressed on the current profile name, one can open the menu managing profiles. One can store or remove profiles inthis menu, as well as download those previously stored.The sub-menu for managing profiles can also be called by the "File — Profiles" menu command.
· Charts Bar — enable/disable the chart window names (tabs) bar located in the lower part of the workspace. Using this bar, one canswitch among open charts fast.
· Market Watch — open/close the "Market Watch" signal window where the current quotes are published.The same action can be performed by accelerating buttons of Ctrl+M or by pressing the button of the "Standard" toolbar.
· Data Window — open/close the "Data Window". Prices of the bar selected and information about indicators imposed are published inthis window.The same action can be performed with accelerating buttons of Ctrl+D or by the button of the "Standard" toolbar.
· Navigator — open/close the "Navigator" window. Lists of open accounts, technical indicators, experts, custom indicators and scriptsare located in the form of tree in this window.The same action can be performed with accelerating buttons of Ctrl+N or by the button of the "Standard" toolbar.
· Terminal — open/close the "Terminal" window. One can manage orders and signals in this window, look through the account history,news, emails, journal of events and that of expert advisors.The same action can be performed with accelerating buttons of Ctrl+T or by the button of the "Standard" toolbar.
· Strategy Tester — open/close the "Tester" window. This window is intended for testing and optimization of expert advisors.The same action can be performed with acceleration keys of Ctrl+R or the button of the "Standard" toolbar.
· Full Screen — enable/disable the full screen mode. As soon as this option is enabled, toolbars and status bar will be disabled and allsignal windows will be closed. The client terminal heading, main menu, workspace (charts) and the charts windows tabs remain in thescreen. The repeated execution of the command returns the terminal to the initial appearance.The same action can be performed with F11 button or by the button of the "Standard" toolbar.
23 / 164
Client Terminal / User Interface / Main Menu / Insert
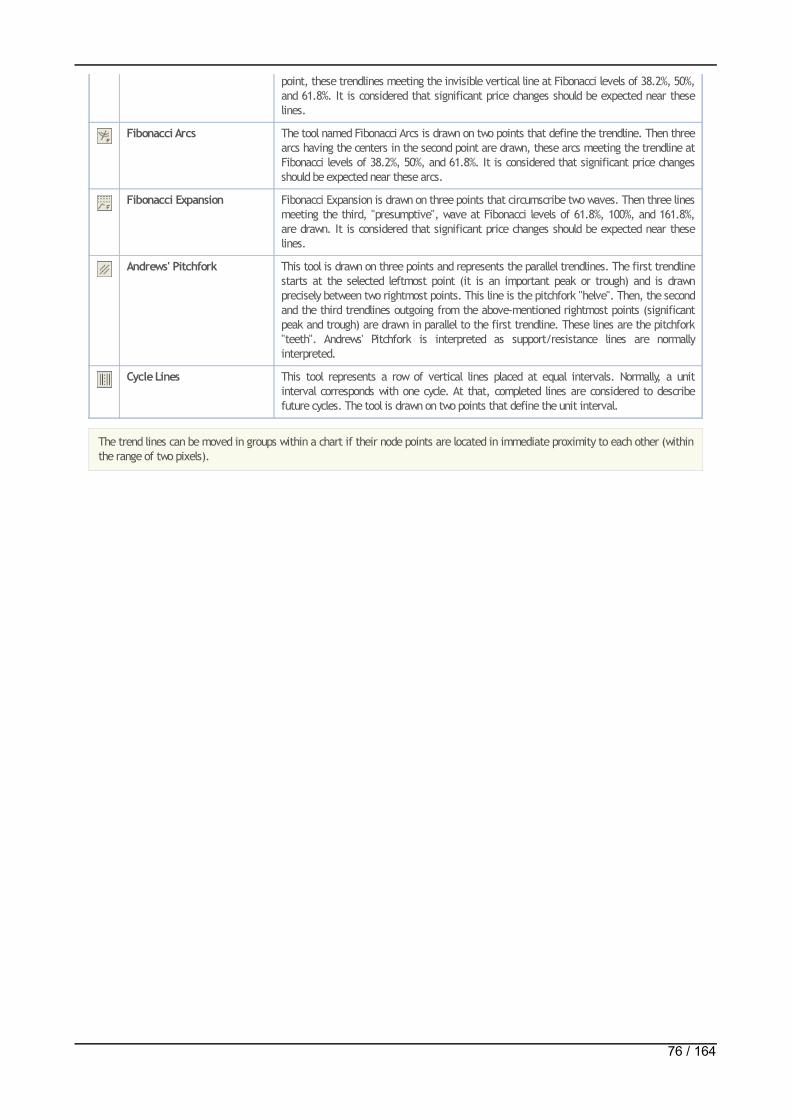
InsertObjects to be imposed on the chart are collected in the "Insert" menu. Among them are line studies and technical indicators, as well asgeometrical figures, arrows, and texts. In the "Indicators" sub-menu, all built-in technical indicators are grouped. Having selected aname in the list, one can impose the indicator into the active chart. Line studies are grouped in the corresponding sub-menu: "Lines" —various lines, "Channels" — a set of channels, "Gann" — Gann's tools, "Fibonacci" — tools based on Fibonacci numbers. Besides,"Andrews' Pitchfork" and "Cycle Lines" that do not belong to any group are placed at the end of the list. More details on working with linestudies can be found in the corresponding section.
Besides, the following can be imposed into the chart from this menu:· Shapes — geometrical figures (rectangle, triangle, ellipse) that allow to select various areas in the chart;· Arrows — symbols (arrows, check signs, stop signs, price signs) that allow to select the most important points in the chart;· Text — texts intended for adding of comments to the chart. They are anchored to the chart and move together with the chart when it
is scrolled;· Text Label — texts intended for adding of comments and anchored to the window coordinates, not to the chart. At the chart scrolling,
the text label will not move.
Attention: All commands of the "Insert" menu, except for the sub-menu managing indicators, are duplicated in the "Line Studies"toolbar.
24 / 164
Client Terminal / User Interface / Main Menu / Charts
ChartsCommands managing the chart and technical indicators imposed in it are collected in the "Charts" menu. The following commands areavailable in this menu:· Indicators List — call window managing indicators imposed in the active chart. The full list of indicators imposed (including Custom
Indicators) is given in the window appeared. Having selected an indicator, one can change its settings or remove it from the chart.The same action can be performed by the chart context menu command of the same name or by accelerating keys of Ctrl+I;
· Objects — call sub-menu managing imposed objects. The following commands are available in the sub-menu:· Objects List — call window managing the imposed objects. Objects include line studies, signs, shapes, and texts. The selected
object can be modified (the "Edit" button) or deleted by pressing of the button of the same name in this window. Besides, the "Show"command moves the active chart to the imposed object location;
· Delete Last — delete the last imposed object from the chart.The same action can be performed by pressing the Backspace button;
· Delete All Selected — delete all selected objects from the chart window.The same action can be performed by pressing the Delete button;
· Delete All Arrows — delete all objects from the chart window;· Unselect All — unselect all the objects imposed in the chart;· Undo Delete — return the deleted object back into the chart.
The same action can be performed by accelerating keys of Ctrl+Z;· Bar Chart — display the chart as a sequence of bars.
Execution of this command is the same as pressing of the button of the "Charts" toolbar or accelerating keys of Alt+1;
· Candlesticks — display the chart as a sequence of "candlesticks".Execution of this command is the same as pressing of the button of the "Charts" toolbar or accelerating keys of Alt+2;
· Line Chart — display the chart as a broken line connecting close prices of bars.Execution of this command is the same as pressing of the button of the "Charts" toolbar or accelerating keys of Alt+3;
· Foreground Chart — put the chart as a "foreground". If this function is enabled, all analytical objects (technical indicators andgraphical objects) will be placed "behind the chart", not over it;
· Periodicity — choose the chart timeframe. After this command has been executed, a sub-menu will appear where the active charttimeframe can be selected.The chart timeframe can also be changed with help of the "Periodicity" toolbar;
· Template — call the template managing sub-menu. From this sub-menu, one can impose any template into the active chart. Moreover,a new template can be stored based on the active chart, or an existing one can be deleted. More details about working w ith templates
can be found in the "Profiles and Templates" sect ion.
The sub-menu managing templates can also be called by pressing of the button of the "Charts" toolbaror by the chart context menu
command of the same name;
Attention: The DEFAULT template cannot be deleted.
· Refresh — refresh history data. At that, all missing data within the existing history will be downloaded. The same action can beperformed by the chart context menu command of the same name.
Attention: History outside the range of the existing data will not be added.
· Grid — show/hide grid in the chart window.The same actions can be performed by the chart context menu command of the same name and by pressing of the accelerating keysof Ctrl+G;
· Volumes — show/hide volumes in the chart.The same actions can be performed by the chart context menu command of the same name or by pressing of accelerating keys ofCtrl+L;
· Auto Scroll — enable/disable automatic shifting of the chart to the left after a new bar has started to form. If this option is enabled,the last bar will always be shown in the chart.Execution of this command is the same as pressing of the button of the "Charts" toolbar;
· Chart Shift — shift the chart from the left window border to the shift label of the chart. The shift label of the chart (a grey triangle inthe upper part of the window) can be moved with the mouse horizontally within 10 to 50% of the window size.Execution of this command is the same as pressing of the button of the "Charts" toolbar;
· Zoom In — zoom in the chart.The same action can be performed by pressing of the "+" key or the button of the "Charts" toolbar, as well as by moving thecursor to the right, the left mouse button being pressed on the horizontal scale;
25 / 164
· Zoom Out — zoom out the chart.The same action can be performed by pressing of the "-" key or the button of the "Charts" toolbar, as well as by moving the cursorto the left, the left mouse button being pressed on the horizontal scale;
· Step by Step — shift the chart by one bar to the left.The same action can be performed by pressing of F12;
· Properties... — setting up the chart parameters. At this command execution, the chart setup window will appear.The same actions can be performed by the chart context menu command of the same name or by pressing of F8.
Attention: The most of the "Charts" menu commands are duplicated in the toolbar of the same name and in the chart contextmenu.
26 / 164
Client Terminal / User Interface / Main Menu / Tools
ToolsHousekeeping instructions and terminal settings are collected in the "Tools" menu. In this menu, one can:§ New Order — call the window managing orders. One can place market or pending orders from this window. More details about working
with orders can be found in the corresponding section.The "Order" window can also be called by context menu commands of the "Market Watch" and "Terminal — Trading" windows, by mousedouble-click on the symbol in the "Market Watch" window, by F9 button or by pressing of the button of the "Standard" toolbar;
§ History Center — call the window managing history data. Quotes used for building of charts can be edited in History Center.This window can also be called by pressing of F2 button;
§ Global Variables — call the window containing the list of the terminal global variables. Global are variables common for all expertadvisors, custom indicators, and scripts. More details about global variables can be found in the corresponding section.The Global Variables window can also be called by F3 button;
§ MetaQuotes Language Editor — open MetaEditor of expert advisors. Using the MetaEditor, one can create and edit experts, customindicators, and scripts. More details on working with MetaEditor are given in the section of the same name.The MetaEditor can also be called by F4 button;
§ Options — call the client terminal setting window. One can set up parameters for connection, trades, charts, experts, and others, inthis window. More details can be found in the "Client Terminal Settings" section.The Options window can also be called by accelerating keys of Ctrl+O.
27 / 164
Client Terminal / User Interface / Main Menu / Window
WindowCommands managing the chart windows are collected in this menu. The way of charts arrangement in the workspace can be chosen or anew chart window can be opened from here:· New Window — create a new symbol chart window. At this command execution, a sub-menu will open that contains a list of symbols
available. Having selected a symbol name from this list, one can open the corresponding chart.A new window can also be opened by pressing the button of the "Standard" toolbar or by the command of the "File — New Chart"
menu;· Cascade — arrange the chart windows in stages;· Tile Horizontally — arrange the chart windows horizontally;· Tile Vertically — arrange the chart windows vertically;· Arrange Icons — arrange minimized windows. At that, windows of all open charts are minimized and located in the lower part of the
workspace. This is useful when one works with a number of charts at the same time.
A list of all open chart windows is located in the lower part of this menu. The current window is checked. To activate another chart, onehas to select the corresponding symbol from this list.
28 / 164
Client Terminal / User Interface / Main Menu / Help
HelpThe "Help" menu is auxiliary. Execution of this menu commands does not influence the terminal operation in any way. One can do thefollowing from this menu:· Help Topics — open the in-built help files containing this present "Userguide". All settings and functions of the Client Terminal are
described in it.F1 button performs the same action;
· MQL4.community — a link to the website of the MQL4 community, the community of Expert Advisors developers.· About... — open the "About..." window where one can find information about the company, its contact details, and the terminal
version, as well.
29 / 164
Client Terminal / User Interface / Toolbars
ToolbarsThere are four toolbars in-built into the terminal. The main commands used in the terminal are duplicated in the toolbars in form ofbuttons. Normally, the toolbars are placed under the main menu, but they can easily be moved in any program window area. Toolbars canbe shown or hidden by the "View — Toolbars" menu command. All toolbars are customizable, what allows to place only necessary, oftenused commands in them. To set up a toolbar, one has to open its context menu (right mouse-button click) and execute the"Customize..." command.
All commands are grouped in toolbars according to their functions:· Standard — general commands of terminal managing;· Charts — commands for managing charts;· Line Studies — managing objects to be imposed into charts;· Periodicity — managing the chart timeframes.
30 / 164
Client Terminal / User Interface / Toolbars / Standard
StandardGeneral commands managing the terminal are collected in this toolbar:· — create a new symbol chart window. The command opens the list of financial instruments (symbols). One can open a new chart
having selected a necessary name in this list.The same actions are performed after the "File — New Chart" and "Window — New Window" menu commands have been executed , aswell as the context menu commands of the "Market Watch — Chart Window" window;
· — menu used to manage profiles. One can activate a profile having selected it in this menu. A profile can be deleted in this
menu, and a new profile can be stored based on the current chart windows configuration. More details can be found in the "Profilesand Templates" section.To work with profiles, one can also execute the "File — Profiles" menu command;
Attention: the DEFAULT profile cannot be deleted.
· — open/close the "Market Watch" window. The current quotes for all available symbols are published in this window. This window
allows to open symbol charts and place orders. More details about working with this window are given in the "Market Watch" section.The "View — Market Watch" menu command and accelerating keys of Ctrl+M allow to open or close this window, as well;
· — open/close data window named "Market Watch". Information about prices and indicators imposed is published in this window.
More details about working with this window can be found in the "Data Window" section.The "View — Data Window" menu command and accelerating keys of Ctrl+D allow to open or close this window, as well;
· — open/close the "Navigator" window. All open accounts, available experts, technical indicators, and scripts are placed in this
window. More details about working with this window can be found in the "Navigator" section.The "View — Navigator" menu command and accelerating keys of Ctrl+N allow to open or close this window, as well;
· — open/close the "Terminal" window. This window allows to place trading orders, view the account history, get news, and many
other things. More details about working with this window can be found in the "Terminal" section.The "View — Terminal" menu command and accelerating keys of Ctrl+T allow to open or close this window, as well;
· — open/close the "Tester" window. This window is intended for testing and optimization of expert advisors. More details about
working with this window can be found in the "Strategy Testing" section.The "View — Strategy Tester" menu command and accelerating keys of Ctrl+R allow to open or close this window, as well;
· — place a new order. The command opens the window that allows to place a market or a pending order. More details can be found
in the "Trading" section.This window can also be opened by the "Tools — New Order" menu command, the "Market Watch — New Order" window or "Terminal —Trading — New Order" window context menu commands, as well as by pressing of F9;
· — launch MetaEditor. This editing program allows to create and edit expert advisors, custom indicators, scripts, and MQL 4
libraries. More details about working with this editing program can be found in the "MetaEditor" section and in its own help files.This action can also be performed by the "Tools — MetaQuotes Language Editor" menu command or by pressing of F4;
· — enable experts. If this option is disabled, no expert attached to the charts will be executed. Detailed description of working
with experts can be found in the "Auto Trading" section.The "Enable Experts" option in the terminal settings performs the same action;
· — call the window of terminal settings. All basic settings of the terminal are made in this window. More details can be found in
the section of the same name.The window of terminal settings can also be opened by the "Tools — Options" menu command or by pressing accelerating keys ofCtrl+O;
· — enable/disable the full-screen mode. When this option is enabled, toolbars and status bar are hidden, and all service windows
are closed. The client terminal name, main menu, workspace (charts), and chart windows tabs remain in the screen. The repeatedexecution of this command will result in return to the initial status.The same actions can be performed by pressing F11 or by the "View — Full Screen" menu command;
· — print the chart. If the "Color Printing" option is enabled in the program settings, the chart can be printed out in color, not as a
black-and-white one.The same action can be performed by the "File — Print..." menu command or by the chart context menu command of the same name;
· — chart preview before it is printed out. The settings of the selected printer will be used at that. Thus, one can check before
printing whether all desired data come onto the paper.The same action can be performed by the "File — Print Preview" menu command or by the chart context menu command of the samename;
· — call the help files. After this button has been pressed, one should click on the desired interface element to call the
corresponding help section.The help can also be called by the "Help — Help Topics" menu command or by pressing of F1.
31 / 164
The help can also be called by the "Help — Help Topics" menu command or by pressing of F1.
32 / 164
Client Terminal / User Interface / Toolbars / Charts
ChartsCommands for managing charts and technical indicators imposed in the charts are grouped in this toolbar. They include:· — display the chart as a sequence of bars (transform into the bar chart).
The same action can be performed by the "Charts — Bar Chart" menu command or by pressing accelerating keys of Alt+1;· — display the chart as a sequence of candlesticks (transform into the candlestick chart).
The same action can be performed by the "Charts — Candlesticks" menu command or by pressing accelerating keys of Alt+2;· — display the chart as a broken line (transform into the line chart).
The same action can be performed by the "Charts — Line Chart" menu command or by pressing accelerating keys of Alt+3;· — zoom in the chart.
The same action can be performed by the "Charts — Zoom In" menu command, the corresponding chart context menu command, or bypressing the "+" key;
· — zoom out the chart.The same action can be performed by the "Charts — Zoom Out" menu command, the corresponding chart context menu command, orby pressing the "-" key;;
· — automatic scrolling of the chart to the latest bars. If this option is enabled, the latest bars will always be displayed in thescreen.The same action can be performed by the "Charts — Auto Scroll" menu command;
· — shift the chart from the window right border to the shift label of the chart. The chart shift label (a grey triangle in the upperpart of the window) can be moved horizontally with the mouse within 10 to 50% of the window size.The same action can be performed by the "Charts — Chart Shift" menu command;
· — call the sub-menu to manage indicators. All built-in technical indicators are grouped in it. Having chosen a name in the list,
one can impose the indicator into the active chart. More details can be found in the "Technical Indicators" section.The same actions can be performed by the "Insert — Indicators" menu command;
· — sub-menu to manage the chart periods. When a period is selected in this sub-menu, the corresponding changes will appear inthe active chart.Switching among chart periods can be performed by the "Charts — Periodicity" menu command, the corresponding chart context menucommand, or the corresponding buttons of the "Periodicity" toolbar;
· — call the sub-menu to manage templates. Any template can be imposed into the active chart from this sub-menu. Moreover, anew template can be stored based on the active chart or an existing template can be deleted. More details about working withtemplates can be found in the "Templates and Profiles" section.The same actions can be performed by the "Charts — Template" menu command or the corresponding chart context menu command.
Attention: The most commands of the "Charts" toolbar are published in the menu of the same name and in the chart context menu.
33 / 164
Client Terminal / User Interface / Toolbars / Line Studies
Line StudiesLine Studies and graphical objects (geometrical shapes, signs, and texts) to be imposed into the chart are collected in the "LineStudies" toolbar. Commands of this toolbar (excluding the "Crosshair" and "Cursor") are duplicated in the "Insert" menu. Working withline studies is described in details in the corresponding section. Other icons in this toolbar are intended for working with graphicalobjects and for changing the cursor operation mode:· — draw an ellipse. This shape helps to select various areas in the chart. More details about working with objects can be found in
the section of the same name.The "Insert — Shapes — Ellipse" menu command allows to draw this figure, as well;
· — draw a triangle. This shape helps to select various areas in the chart. More details about working with objects can be found in
the section of the same name.The "Insert — Shapes — Triangle" menu command allows to draw this figure, as well;
· — draw a rectangle. This shape helps to select various areas in the chart. More details about working with objects can be found in
the section of the same name.The "Insert — Shapes — Rectangle" menu command allows to draw this figure, as well;
· — add a text label. After this button has been pressed, one should select a point in the chart where the label should be placed.
Unlike the text (described below), the text label is attached not to the chart, but to the chart window. When the chart is scrolled, thetext label does not move.The "Insert — Text Label" menu command will also add comment into the chart;
· — add a comment into the chart. It will be anchored directly to the chart. When the chart is scrolled, the text will move together
with it.The "Insert — Text" menu command will also add comment into the chart;
· — menu to manage graphical symbols. One can add graphical signs into the chart or delete all the imposed signs from it using this
menu.These objects can also be imposed into the chart by the "Insert — Arrows" menu command;
· — a crosshair. Cursor in this mode allows to highlight coordinates of the selected point in the chart or indicator window. This mode
can only work within the active chart window. If, being in the "Crosshair" mode, one keeps the left mouse button pressed and movesthe cursor, a line connecting these two points will be drawn. The distance between the points and the current price value will behighlighted to the right of the second point of the line. This will look as [amount of bars between two points] / [amount of pointsbetween two points] / [the current price value in the second point]. This tool is named electronic ruler.Cursor can also be switched to the crosshair mode by pressing accelerating keys of Ctrl+F or the third mouse button;
· — a standard cursor (selection mode). The cursor in this mode allows to select various objects in the chart.
34 / 164
Client Terminal / User Interface / Toolbars / Periodicity
PeriodicitySwitcher among the chart periods are grouped in this toolbar. The chart period will change in the active window after this toolbarbuttons have been pressed. Just after that, the uploading of data for the selected symbol and period will start what can take some time.
35 / 164
Client Terminal / User Interface / Market Watch
Market WatchThe securities (symbols) for which the Client Terminal gets quotes from the server are listed in the "Market Watch" window. The dataare represented in this window as a table having several fields. The "Symbol" field contains the security name, the fields of "Bid", "Ask",and "Time" show the corresponding prices and time of their income from the server. Values of the "Maximum" and "Minimum" fields arecalculated on basis of price changes within a day. The "Market Watch" window can be opened/closed by pressing of accelerating keys ofCtrl+M, by the "View — Market Watch" menu command, or by pressing of the button of the "Standard" toolbar.
This window allows to place market and pending orders and open new charts. At the right mouse button click in the "Market Watch"window, the context menu will appear where the following commands are available:· New Order — open the "New Order" window where one can prepare and place a market or a pending order for the symbol selected. At
the order preparation, one can specify the Stop Loss and Take Profit levels. More details can be found in the "Positions Opening"section.The "New Order" window can also be opened by double clicking on the security name in the "Market Watch" window, by the "Tools —New Order" menu command, by the "Terminal — Trade — New Order" window context menu command, the button of the
"Standard" toolbar, or by pressing of F9;· Chart Window — open the chart of the symbol selected. More details about working with chart windows are given in the section of
the same name.The symbol chart can also be opened by the "File — New Chart" and "Window — New Window" menu commands and by pressing of the
button of the "Standard" toolbar;
· Tick Chart — open the tick chart of the symbol selected. Unlike normal charts, the tick chart is located directly in the "Market Watch"window. The tick chart of the selected symbol can also be viewed by switching to the tab of the same name in the same window. Thetick data comes only when the account is connected. Thus, if an account was not active for a certain period of time, the tick chartmay appear empty in the beginning. The tick data is stored separately for each server;
· Hide — delete (hide) the symbol from the list. To minimize the traffic, it is recommended to hide unused securities from the quoteswindow by this command or by pressing of the Delete button.
Attention: If there are open positions or pending orders for the symbol, or its chart is open, the symbol cannot be deleted.
· Hide All — delete all symbols from the list. This command does not apply to securities for which there are open positions or the chartsof which were opened in the current working session;
· Show All — show the list of all available securities. After this command has been executed, quotes will income for all these symbols;· Symbols — call the window of the same name where there is a list of all available symbols. Symbols are grouped in the window
according to their types. The "Show Symbol" command allows to add necessary symbols to the quotes window, and that of "HideSymbol" — to delete a symbol from it. The "Properties" window command allows to view the symbol parameters;
· Sets — open the sub-menu that manages the symbol sets. The current set of symbols can be stored in this sub-menu, as well as deleteor select an already existing one. This is very comfortable when working with securities of different types;
· High/Low — add the highest and the lowest values of the daily price to the quotes displayed;· Time — show time of incoming quotes;· Auto Arrange — automatic arranging of columns when changing the window size.
Auto Arrange can also be enabled by pressing A button;· Grid — show/hide the grid separating columns.
The grid can also be shown by pressing G button;· Popup Prices — open an additional quotes window. You can also open this window by pressing F10 on your keyboard. The list of
symbols in this window is the same as that in the "Market Watch" window at the moment of the command execution. This means thatchanges in the symbol list in the "Market Watch" window does not influence that in the "Popup Prices". It is an information window, buttrading operations can also be performed from it. To do so, one has to double-click with the left mouse button on the desired security.In the context menu of this window, there are commands allowing to set up data displaying parameters, enable the full screen mode,or locate the window over all others.
36 / 164
Client Terminal / User Interface / Data Window
Data WindowThis window is intended for displaying of price information (OHLC), date and time of the bar, and the indicators (including custom ones)used. "Data Window" is an information window and it does not allow to perform any actions. The desired information about a certainbar and the imposed indicators can be obtained here promptly. To do so, it is sufficient to place the cursor over the necessary bar.
Context menu commands of this window allow:· Copy — copy data from this window into the clipboard for further use in other applications.
The same action can be performed by pressing of accelerating keys of Ctrl+C;· Last Data — show/hide the latest data column. At that, an additional column containing the last bar data will appear in the window;· Auto Arrange — set up the column size automatically when the window size changes;· Grid — show/hide grid to separate columns;· Show — show/hide information fields. Any of the bar prices (OHLC), date or volume can be selected in the sub-menu that appears. If
the element has not been checked, it will not be shown.
Attention: Any indicator can be set up (the "Visualization"tab in the indicator properties window) in such a way that its data will notbe shown in this window.
37 / 164
Client Terminal / User Interface / Navigator
NavigatorThis window allows to get a quick access to various features of the terminal. This window can be opened/closed by pressing acceleratingkeys of Ctrl+N, by the "View — Navigator" menu command, or by pressing of the button of the "Standard" toolbar.
The list of features is listed as a tree and contains five groups: "Accounts", "Indicators", "Expert Advisors", "Custom Indicators", and"Scripts". The "Accounts" group includes the list of open accounts. Using a context menu, one can open a new demo account or deletethe old one. An unlimited amount of demo accounts can be opened from the terminal. To do so, one has to execute the "Open anAccount" context menu command or press the Insert button. More details about opening of accounts can be found in the correspondingsection. To authorize an existing account (whether a demo or a real one), one has to execute the "Login" command or double-click withthe left mouse button on the desired account line.
Attention: Real accounts cannot be started from the terminal, they are opened only by a brokerage company.
The "Indicators" group includes the list of built-in technical indicators. They represent the main tools for analyzing the price dynamics.Double-clicking with the left mouse button or the "Attach to a chart" context menu command allows to impose the indicator selected intothe active chart. Besides, one can impose an analytical tool in any chart or window of an indicator already imposed, using the"Drag'n'Drop" technique. More details can be found in the "Technical Indicators" section.
The "Expert Advisors" group contains the list of all available expert advisors. Expert Advisors in the terminal are programs allowing toautomate analytical and trading activities. To create and modify them, the built-in editor, MetaEditor, is used. More details aboutcreation and working with experts can be found in the "Auto Trading" section.
The "Create" context menu command allows to create a new expert, "Modify" — to modify an existing one, and "Delete" — to delete anexpert from the terminal. The "Attach to a Chart" command or double-click with the left mouse button allow to impose the expert intothe active chart. After that, when a new tick incomes, the expert will start working. Experts can be imposed into any chart with the"Drag'n'Drop" technique. Experts' icons colored in grey mean that these experts cannot be used. Such expert must be compiled first.
The "Custom Indicators" group includes the list of all available custom indicators (counterparts of built-in technical indicators), and the"Scripts" group contains the list of available scripts (programs executed only once). Custom indicators and scripts are managed by usingof the context menu similar to that of experts. More details can be found in the sections of "Custom Indicators" and "Scripts". You cango to the "Online Library" section of the MetaEditor by pressing the "Online library" button in the context menu. There you can findvarious custom indicators published on the MQL4 Community website.
Hot keys can be assigned to call any elements of the "Navigator" window, except for those in the "Accounts" group. To set a hot key foran element, one has to execute the "Set hotkey" command of this element's context menu. The hot keys set have a higher priority beingcompared to those predefined. For example, Ctrl+O is predefined to call the terminal setting window. If this pair of keys is set to callthe On Balance Volume indicator, the terminal setting window will not be called by pressing of Ctrl+O anymore.
Favorites TabThe "Favorites" tab is intended for a quick access to objects mostly used. In this tab, for example, only necessary accounts, indicators,scripts, and experts can be placed. This allows to accelerate the trader's work, especially, if there is a need to act promptly. To move anecessary object into the "Favorites" tab, one has to execute the corresponding context menu command. If the object is not necessaryanymore, it can be deleted from the tab using the "Delete from favorites" context menu command.
Attention: All objects included in the "Favorites" can function without any limitations. All managing commands placed in the contextmenu can also be called directly from this tab.
38 / 164
Client Terminal / User Interface / Terminal
Terminal"Terminal" is a multifunctional window allowing to access to various terminal features. This window allows to control over tradingactivities, view news and account history, set up alerts, and work with the internal mail and system journal. The window can be openedby the "View — Terminals" menu command, by pressing of accelerating keys of Ctrl+T, or the button of the "Standard" toolbar. There
are several tabs in the window:· Trade — in this tab, one can view the status of open positions and pending orders, as well as manage all trading activities. Besides,
the total financial result for all open positions is published in this tab;· Account History — history for all performed trade operations and balance without taking open positions into consideration are
published here. The efficiency of all trade activities can be estimated with the results given in this tab;· News — all financial news incoming in the terminal can be viewed from this tab. This prompt information is indispensable for
fundamental analysis;· Alerts — various alerts can be viewed and set here. Any files executable in the operational environment (including wave files) and
messages to be sent by email can be used as alerts;· Mailbox — all message income in the terminal by internal email are stored here. Electronic messages are sent from here, as well;· Expert Advisors — information about functioning of the attached expert, including opening/closing of positions, order modifying, the
expert's own messages, etc., are published in this tab;· Journal — information about terminal launching and about events during its operation, including all trade operations performed, is
stored in the journal.
Attention: Some tabs of the "Terminal" window can be absent. This means that they are empty at the moment. For example, the"Expert Advisors" tab will be hidden until a message from MQL4 program incomes.
39 / 164
Client Terminal / User Interface / Terminal / Trade
TradeThe "Trade" tab contains information about the current status of the trading account, about open positions and pending orders placed.All open positions can be sorted by any field. Then there is a line of the account balance and financial result of open positions followedby the list of pending orders. When a pending order triggers, a new position will be opened and the pending order line will be replacedwith that of the position opened.
All trade operations are displayed as a table having the following fields (from left to right):· Order — the operation ticket number. It is a unique number of the trade operation;· Time — time of position opening. The time is represented as YYYY.MM.DD HH:MM (year.month.day hour:minute). This is the time at
which the position was opened;· Type — type of the trade operation. There are several types of trading operations that can appear here: "Buy" — long position, "Sell"
— short position, and pending orders named Sell Stop, Sell Limit, Buy Stop, and Buy Limit;· Size — the amount of lots participating in operation. The minimum amount of lots to participate in operations is defined by the
brokerage company, and the maximum is limited by the deposit size;· Symbol — this field displays the name of the security participating in the trade operation;· Price — price of position opening (no to be mixed up with the current price described below). This is the price at which the position
was opened;· S/L — the placed Stop Loss order level. If the order has not been placed, a zero value will be written in this field.
More details about working with orders can be found in the corresponding section;· T/P — the placed Take Profit order level. If the order has not been placed, a zero value will be written in this field.
More details about working with orders can be found in the corresponding section;· Price — the current price of the security (not to be mixed up with that of position opening described above);· Commission — commissions charged by the brokerage company at performing trade operations are written in this field;· Taxes — taxes charged when performing trade operations are written in this field;· Swap — charging of swaps is stored in this cell;· Profit — the financial result of the transaction made will be written in this field taking the current price into consideration. Positive
result means that the transaction was profitable, and negative one means that it was unprofitable;· Comments — comments on trade operations are stored in this column. A comment can only be written at the position opening or at
placing of a pending order. Comment cannot be changed at order or position modifying. Besides, the brokerage company can store acomment to a trade operation, as well.
This tab allows not only to view the open positions and placed orders, but to manage trading activities. One can do the following here:open a new position, place a pending order, modify or delete it, and close a position. To do all this, one has to use the following contextmenu commands:· New Order — a new order. The orders managing window will appear at this command. A new position can be opened and a pending
order can be placed in it. At that, the following must be specified: the security, amount of lots, order type (market order or a pendingone), as well as Stop Loss and Take Profit order levels. More details about placing of orders can be found in the "Control over TradePositions" section;
· Close Order — close a trade position. This command becomes active only if the context menu has been called at an open position.The order managing window appears at this command, as well. This window displays not only "Sell" and "Buy" buttons, but also the"Close#XXXXXXX ..." button (where XXXXXXX is the position ticket number). Besides, having executed this command, one can close theselected positions together with the hedged ones. More details about closing of positions can be found in the corresponding section;
· Modify or Delete Order — change the "Stop Loss" and "Take Profit" values of open positions or the pending order price. If the StopLoss and Take Profit levels specified are too close to the current price, the error message will appear, and the levels will not be placed.Their values must be changed to be not so close to the current price, and then they can be placed again. More details about modifyingof orders can be found in the section of the same name;
· Trailing Stop — place, modify, or delete the "Trailing Stop" level. Having selected the corresponding level in the menu, one canactivate the trailing stop with the given parameter. The "None" value is used for disabling of the order. "Delete All" — disable alltrailing stops. More details about trailing stops are given in the "Trailing Stop" section;
The "Trailing Stop" command may be missing in the context menu, in case using that function is disabled on the broker's side.
· Profit — show profit/loss as points, as term currency, or as deposit currency. Changes in this parameter are displayed in the "Profit"field. If the parameter of "show profit in the term currency" (quote currency) is selected had, there are, for example, open positionsfor USDJPY, the profit will be shown in Japanese Yens;
· Commissions — show/hide the "Commissions" column where the commission for each of the performed trade operations will bedisplayed;
· Taxes — show/hide the "Taxes" column to display the tax for each trade operation;· Comments — show/hide the "Comment" column. Comments to trade operations are written in this column. A comment can be written
only if a position is being opened or an order is being placed. It cannot be changed at modifying of an order or of a position. Besides,
40 / 164
only if a position is being opened or an order is being placed. It cannot be changed at modifying of an order or of a position. Besides,the brokerage company can write a comment to a trade operation;
· Auto Arrange — automatic arrangement of columns at changing of the window size;· Grid — show/hide grid to separate columns.
Accelerating keys of Ctrl+F9 switch the the focus in the "Terminal — Trade" window. After they have been pressed, one can trade withthe keyboard.
41 / 164
Client Terminal / User Interface / Terminal / Account History
Account HistoryInformation about all trade operations performed is stored in the "Account History" tab. The entire history is displayed as a table withthe following fields (from left to right):· Order — operation ticket number. It is the unique number of a trade operation;· Time — time of position opening. It is given in YYYY.MM.DD HH:MM (year.month.day hour:minute) format. This is the time when the
position was opened;· Type — trade operation type. Only three types of trade operations can be found here: "Balance" — entering of funds in the account,
"Buy" — a long position, and "Sell" — a short position;· Size — amount of lots participated in the operation;· Symbol — this field shows the name of the security participated in the operation;· Price — price of position opening. This is the price at which the position was opened;· S/L — level of the Stop Loss order placed. If a trade position was closed by this order, its corresponding cell will be colored in red, and
"[s/l]" will appear in the field of comments. If no order was placed, zero value will appear in this field. On the other hand, if the anorder was placed, but did not trigger, its value will still be shown in this field. At that, the cell will not be colored, and no "[s/l]" will beoutput in the field of comments. More details about working with orders are given in the corresponding section;
· T/P — level of the Take Profit order placed. If a trade position was closed by this order, its corresponding cell will be colored in green,and "[t/p]" will appear in the field of comments. If no order was placed, zero value will appear in this field. On the other hand, if thean order was placed, but did not trigger, its value will still be shown in this field. At that, the cell will not be colored, and no "[t/p]" willbe output in the field of comments. More details about working with orders are given in the corresponding section;
· Time — time of position closing. It is given in YYYY.MM.DD HH:MM (year.month.day hour:minute) format. This is the time when theposition was closed;
· Price — price of position closing. This is the price at which the position was closed;· Commission — commissions charged by the brokerage company at performing trade operations are written in this field;· Taxes — taxes charged when performing trade operations are written in this field;· Swap — the swaps charged are stored in this field;· Profit — the financial result of transaction will be written in this field. Positive number means that the transaction was profitable, and
the negative one does vice versa. The profit is shown only in the deposit currency here, unlike it is in the field of the same name inthe "Trade" tab.
· Comments — comments on trade operations are stored in this column. A comment can be input only at opening of a position orplacing an order. The comment cannot be changed when an order or a position are being modified. Besides, a comment to the tradeoperation can be input by the brokerage company.
You can easily display the history of performed trades on a chart. To do it, you should just drag the necessary trade on a chart via themouse. The entering and exiting points of the trade, connected with a line, will be shown with arrows. If you hold the Shift button whiledragging a trade, the entire history of trades will be placed on the chart.
Context MenuCommands allowing to manage the history range and data performance, as well as commands of history data export are grouped in thecontext menu:· All History — show the entire account history. At this command execution, the whole financial history of the account will appear in the
screen without any limitations by time;· Last 3 Months — show only the last 3-months history;· Last Month — show only the last month history;· Custom Period — show history for the selected period. At this command execution, the window that manages the history range will
appear where one can select one of the pre-defined ranges (the "Period" field) or specify them manually in the fields of "From" and"to";
· Save as Report — save the account history as a report in the form of the HTML file. At that, a window allowing to select a path forsaving of the file will appear;
· Save as Detailed Report — save the account history as a report in the form of the HTML file. A detailed report differs from a normalone for an additional set of parameters. After this command has been executed, a window allowing to select a path for saving the filewill appear;
· Commissions — show/hide the "Commissions" column;· Taxes — show/hide the "Taxes" column;· Comments — show/hide the "Comments" column. Comments to trade operations are stored in this column. A comment can only be
input at opening of a position or at placing of an order. Besides, the brokerage company can write a comment to the trade operation,as well;
· Auto Arrange — automatic arrangement of column sizes at changing of the window size;
42 / 164
· Grid — show/hide grid for separating of columns.
ReportsThe upper part of the report contains general information about the account. Then the trades details are given that are separated intoclosed trades (Closed Transactions), open trades (Open Trades) and pending orders (Working Orders). The number of the fields displayeddepends on the report type chosen (common or detailed).· Ticket — ticket number of a trading position;· Open Time — time of position opening;· Type — trade type (sell, buy, s/l, t/p, modify, close at stop, etc.);· Size — amount of lots traded;· Item — security traded;· Price — open price of a trading position;· S/L — the value of Stop Loss;· T/P — the value of Take Profit;· Close Time — time of position closing;· Price — price of position closing;· Commission — commissions charged by the brokerage company at performing the trade operation;· Taxes — taxes charged at performing trade operation;· Swap — swaps charged;· Profit — the financial result of the transaction.
For pending orders, an additional column, "Market Price", appears. The current market price as of the report generation is specified init.
The summary about the financial performance of the account is located below (Summary):· Deposit/Withdrawal — information about the deposits and withdrawals of the account;· Credit Facility — information about the credit funds on the account;· Closed Trade P/L — total profit/loss by all closed trades of the account;· Floating P/L — current profit/loss by all opened trades of the account;· Balance — balance of the account;· Equity — equity of the account;· Margin — the account margin for open trades;· Free Margin — the account free margin.
The report also contains the balance diagram and the statistical information about the account:· Total Net Profit — financial result of all trades. This index represents a difference between the "Gross Profit" and "Gross Loss";· Gross Profit — the sum of all profitable trades in terms of money;· Gross Loss — the sum of all unprofitable trades in terms of money;· Profit Factor — the ratio between gross profit and gross loss in per cents. The one value means that profit equals to loss;· Expected Payoff — the expected payoff. This statistically calculated index represents the average profit/loss factor of a trade. It can
also be considered for representing the expected profit/loss factor of the next trade;· Absolute Drawdown — the largest loss is lower than the initial deposit value;· Maximal Drawdown — maximal loss of the local maximum in the deposit currency and in percents of the deposit;· Relative Drawdown — the maximal loss in percents of the maximum balance value and its corresponding money value;· Total trades — the total amount of trade positions;· Short Positions (won %) — the amount of short positions and percentage of won thereof;· Long Positions (won %) — the amount of long positions and percentage of won thereof;· Profit Trades (% of total) — the amount of profitable trade positions and their percentage in the total trades;· Loss trades (% of total) — the amount of loss trade positions and their percentage in the total trades;· Largest profit trade — the largest profit among all profitable positions;· Largest loss trade — the largest loss among all unprofitable positions;· Average profit trade — average profit value for a trade (the sum of profits divided by the amount of profitable trades);· Average loss trade — average loss value for a trade (the sum of losses divided by the amount of unprofitable trades);· Maximum consecutive wins ($) — the longest series of profitable trade positions and the sum of their wins;· Maximum consecutive losses ($) — the longest series of unprofitable trade positions and the sum of their losses;· Maximal consecutive profit (count) — the maximum profit of a series of profitable trades and the amount of profitable trades
corresponding with it;· Maximal consecutive loss (count) — the maximum loss of a series of unprofitable trades and the amount of unprofitable trades
43 / 164
corresponding with it;· Average consecutive wins — the average amount of profitable positions in consecutive profitable series;· Average consecutive losses — the average amount of unprofitable positions in consecutive unprofitable series.
44 / 164
Client Terminal / User Interface / Terminal / News
NewsThe list of income news is stored in the "News" tab. The news topics are represented as a table and arranged according to the incomingtime. The news incoming time, its topic and category are published in the table. This list is updated automatically at incoming of thelatest news.
The following commands are available in the context menu:· View — view the selected news. One can also read news by double-click with the left mouse button on the topic;· Copy — copy the news to the clipboard;· Category — show/hide the "Category" column;· Auto Arrange — automatic arrangement of columns when changing of the window size;· Grid — show/hide grid to separate columns.
Attention:· If there is no "News" tab in the "Terminal" window, it means that no news have income yet.· If the "Enable news" option is disabled in terminal settings, news will not income.· If the given account has no appropriate rights, this can be one of the reasons why news do not income or cannot be viewed.
45 / 164
Client Terminal / User Interface / Terminal / Alerts
AlertsThis tab contains information about created alerts. The alerts are intended for signaling about events in the market. Having createdalerts, one may leave the monitor as the client terminal will automatically inform about the server event.
All alerts in this tab are represented as a table with the following fields:· Symbol — security the data on which are used to check for the condition specified. If the "Time=" parameter (alert triggering at the
pre-defined time) was selected as a condition, the symbol does not matter;· Condition — condition under which the alert will trigger. The following can be used as such a condition:· Bid> — the Bid price is higher than the specified value. If the current Bid price exceeds the given value, the alert will trigger;· Bid< — the Bid price is lower than the specified value. If the current Bid price goes under the given value, the alert will trigger;· Ask> — the Ask price is higher than the specified value. If the current Ask price exceeds the given value, the alert will trigger;· Ask< — the Ask price is lower than the specified value. If the current Ask price goes under the given value, the alert will trigger;· Time= — time is equal to the given value. As soon as this time comes, the alert will trigger.
· Counter — the amount of alert triggerings;· Limit — maximum permissible amount of the alert triggerings. Having triggered this given amount of times, the alert will stop
triggering;· Timeout — the period of time between alert triggerings;· Event — the action to be performed. This can be an audio signal, a file executable in operational environment, a message sent by
email or a push notification sent to a mobile device.
Alerts Management
The following context menu commands are intended for managing alerts:· Create — create a new alert. The same action can be performed by pressing of the Insert key;· Modify — edit the alert. The same action can be performed by double-clicking on the alert name in the table or by pressing of the
Enter key;· Delete — delete the alert. This action can also be performed by pressing of the Delete key;· Enable On/Off — enable/disable the alert. The alert will not be deleted when disabled, but it stops to trigger. It can be enabled later.
The same action can be performed by pressing the Space key or enabling in the alert setup window (described below).
Attention: To manage alerts with the keyboard, one should activate this window first. To do so, it is necessary to click with the leftmouse button in the window.
One can start modifying of the alert by double-clicking of the left mouse button in the alert information line. In this case, as well as atexecution of the "Modify" and "Create" context menu commands, the alert editor window will appear:· Enable — alert on/off. When the alert is off, it is not deleted, but it will stop functioning. This option is similar to the "Enable
On/Off" context menu command and pressing of the Space key;· Action — action performed when an event happens:· Sound — play a sound file;· File — run an executable file;· Email — send an email via the internal mail system.· Notification — send a push notification to a mobile device. Sending push notifications requires specification of the MetaQuotes ID in
the terminal settings. MetaQuotes ID is a unique identifier, which is assigned to each mobile terminal during installation on a device.Push notifications are an effective means to notify of events, they are instantly delivered to the mobile device and are never lost.The message text is specified in the "Source" tab.
· Symbol — security the values of which will be used to check the condition;· Condition — condition ("Time=", "Bid<", "Bid>", "Ask<", "Ask>") under which the alert will trigger;· Value — check value of the condition. If the symbol price is equal to this value, the alert will trigger;· Source — depending on the typy of action performed when an event occurs, one of the following is specified here:· a sound file in *.wav, *.mp3 or *.wma.· an executable file in the *.exe, *.vbs or *.bat format.· an email template. If you select "Email", a click on this field will open a window for writing a template of an email to be sent to the
address specified in the terminal settings. You can also just write an email text message in the format "email subject\n email text";· a text of a push message. The maximum message length is 255 characters.
· Timeout — the time period between alert triggerings;· Maximum iterations — maximum amount of times the alert repeats triggering.
46 / 164
The "Test" button allows to check the usability of the selected alert. For changes to come into effect, one must press the "OK" button.
Attention: To send messages about events happened, one has to set up mailbox parameters in the program settings.
47 / 164
Client Terminal / User Interface / Terminal / Mailbox
MailboxThe "Mailbox" is intended for working with the internal mailing system. It is in this window of the "Terminal" where all electronicmessages that income to the terminal are stored. They are represented as a table with the following fields:· Time — the time of the news incoming;· From — the sender name;· Headline — the headline of the message.
Using a double-click with the left mouse button on the necessary headline or the "View" context menu command, one can view thecontent of the selected message, and one can delete a message using the "Delete" command. Besides, if the brokerage companypermits it, one can send messages to the systems administrator or to technical support service from this tab. To do so, one has toexecute the "Create" context menu command, then select a receiver in the appearing window, head the message, write its text, andpress the "Send" button.
Attention: All messages are sent by internal mailing system and do not require any additional settings. If any problems occur whenusing the mailbox, it is recommended to refer to the technical support service.
48 / 164
Client Terminal / User Interface / Terminal / Experts
ExpertsThe "Experts" contains the entire information about the attached expert, including opening/closing of positions, modifying of orders,the expert's own messages, etc. There are only latest messages in the window. To view the earlier messages, one has to execute the"Open" context menu command and select the desired file. Files of the experts logs are stored in the /EXPERTS/LOGS directory,filenames correspond with the log date — YYYYMMDD.LOG. To copy a message to the clipboard, one has to execute the context menucommand of the same name.
49 / 164
Client Terminal / User Interface / Terminal / Journal
JournalThe "Journal" tab contains information about the stated actions of the trader and the client terminal within the current session.Information about terminal launching and about events during its working, including all trade operations, is stated in journal. There areonly the latest messages in the window. To view the earlier messages, one has to execute the "Open" context menu command and selectthe desired file. The files of the client terminal journal are stored in the /LOGS directory, the filename corresponds with the journaldate — YYYYMMDD.LOG. To copy the message to the clipboard, one has to execute the context menu command of the same name.
50 / 164
Client Terminal / User Interface / Tester
Tester"Tester" is a multifunctional window that allows to test strategies and optimize parameters of expert advisors. When being tested, theexpert is passed on the modeled data one time what allows to estimate its profitability and effectiveness. For optimization purposes,the mechanical trading system is passed many times in order to find out such parameters of the expert at which its profitability is thehighest.
The window can be called by the "View — Strategy Tester" menu command, by pressing of accelerating keys of Ctrl+R, or the button
of the "Standard" toolbar. There are several tabs in this window:· Settings — settings of testing and optimization. The parameters of expert advisors, period to be tested, the method of bars
modeling, and many other things, can be set up in this tab;· Results — the results of trade operations performed by the expert, as well as the direction of balance changes;· Graph — displaying of testing results in a graph;· Report — the detailed testing report. Many indications of testing and effectiveness of experts can be found here: the amount of bars
modeled, the total profit, the most profitable and unprofitable positions, the amount of profit and loss trades, etc.;· Journal — a log where all actions and internal messages of the expert are recorded;· Optimization Results — information about every pass, including inputs, profitability, drawdowns, and other data;· Optimization Graph — the results of expert optimization as a graph. Besides each pass profitability, the amount of profit and loss
trades is displayed in the graph.
As in the "Terminal" window, some tabs of the "Tester" window are hidden if they are empty. So, initially, only the tabs of "Settings" and"Journal" can be seen in this window. The tabs of "Results", "Graph", and "Report", will only appear after an expert has been tested.After it has also been optimized, the tabs of "Optimization Results" and "Optimization Graph" will appear. More detailed informationabout testing experts can be found in the section of the same name.
51 / 164
Client Terminal / User Interface / Tester / Setup
SetupTesting parameters and experts optimization parameters can be set up in this tab. At testing, the expert is passed on the modeled dataone time what allows to determine the profitability and efficiency thereof. At optimization, the mechanical trading system is passedseveral times with the purpose of determining of such expert parameters at which its profitability is the highest.
The following commands and options are available in this tab:· Expert Advisor — select the expert to be tested in the list. The expert must be compiled and placed in the /EXPERTS directory. All
newly created experts will be automatically placed into this directory;· Symbol — select one of the securities available;· Period — select the symbol timeframe;· Model — select the method of bars modeling:· Every tick (based on all available least timeframes with fractal interpolation of every tick);· Control points (based on the nearest less timeframe with fractal interpolation of 12 control points);· Open prices only (fastest method to analyze the bar just completed);
· Use date — use range of dates when testing. If this option is enabled, the data from the given range will be used during testing.Otherwise, all available data for the given symbol and period are used;
· Visual mode — enable the mode of the visual displaying the test process on a graph. You can adjust the speed of the testingvisualization using the lever located to the right. You can also specify a date in the "Skip to" field to skip visualizing the test till thatdate.
· Optimization — enable the expert parameters optimization mode. More details about expert parameters optimization can be found inthe section of the same name;
· Expert properties — open the "Expert Properties" window that allows to manage the expert parameters when testing and optimizing;· Symbol properties — view the symbol parameters. These data are given in the *.FXT file heading and used to emulate the server
operation;· Open chart — create a new chart window for the symbol selected for testing. When being tested, the expert works with a virtual
chart. Signs of opening and closing of positions, objects and indicators used by the expert, are imposed in this chart. This chart canbe opened only after the expert has been tested. For opening of a virtual chart, the TESTER.TPL template is used, and, if it is notavailable, the default settings are used. You can also give a template the same name as that of an Expert Advisor. In this case, thatexact template will be used when opening the chart of the Expert Advisor;
· Modify expert — open the "MetaEditor" and start to edit the selected expert. This is useful if there is a need to introduce smallchanges and recompile the expert fast;
· Start — start testing or optimization. After this button has been pressed, one can estimate the speed of testing or optimization inprogress bar in the lower part of the window. After the testing has been started, the "Start" button will be replaced with the "Stop"button. Having pressed this button during testing/optimization, one can stop the process.
More details about testing experts can be found in the section of the same name.
52 / 164
Client Terminal / User Interface / Tester / Properties
PropertiesParameters of the virtual account and the expert advisor under test can be set up in this window. These data will later be used fortesting or optimization of the expert parameters. There are three tabs in the window:· Testing — Parameters common for both testing and optimizations are placed in this tab. These are volume and currency of initial
deposit that are given in the fields of the corresponding names. Types of positions to be opened at testing can be selected, as well:"Only Long" — open only long positions; "Only Short" — only short ones; "Long and Short" — open both types of positions. Whateverexpert mechanisms are used, they will open positions only as set here. One can include an optimization genetic algorithm and select aparameter to be optimized (maximization by the balance value, the profit factor, expected payoff, or minimization by the maximaldrawdown value or drawdown percent).
· Inputs — the list of all inputs is given here as a table. Inputs are variables that influence the expert work and can be changed directlyfrom the client terminal. The amount thereof can vary from expert to expert. The current data to be used at testing an expert will bewritten in the "Value" field. Data to be written in the fields of "Start", "Step" and "Stop" do not influence the expert testing, and areonly used for its optimization. Initial value of the variable, step of change, and final value are written in this field. At optimization,expert with parameters within the range between initial and final values will be passed consecutively. Checking from the right of thevariable names allows to include the parameter into optimization process. If a variable has not been checked, it will not participate inoptimization. Its value will not be changed in the optimization process, and the parameter written in the "Value" field will be used. There is an opportunity to download a set of inputs already saved before (including the values of "Start", "Step", and "Stop"). This canbe done by pressing of the "Load" button and after the preliminarily saved set of inputs has been selected. The actual set of externalvariables can be saved by pressing of the button of the same name.
Attention: It is recommended to include only necessary variables into optimization process. If too many variables are included intoit, the amount of passes and total optimization time will rapidly increase.
· Optimization — this tab allows to manage optimization limits. If the real values meet those required in this tab, the current pass willbe stopped and the next pass will start. Parameters limiting testing at optimization of the expert are:· Balance minimum — minimum balance value in the deposit currency;· Profit maximum — maximal profit in the deposit currency;· Minimal margin level, % — minimal level of margin in per cents;· Maximal drawdown, % — maximal drawdown in per cents;· Consecutive loss — maximal total loss in one series of trades. A loss series is a certain amount of consecutive loss trades;· Consecutive loss trades — maximal amount of loss trades in one series;· Consecutive win — maximal total win in one series of trades. A win series is a certain amount of consecutive win trades;· Consecutive win trades — maximal amount of win trades in one series.
More details are given in the sections of "testing Expert Advisors" and "Optimization".
53 / 164
Client Terminal / User Interface / Tester / Results
ResultsThe testing results are represented as a table in this tab. Information about all trade operations performed within the testing processcan be found here:· # — the sequence number of the trade operation;· Time — time of the trade operation;· Type — the type of operation performed (sell, buy, s/l, t/p, modify, close at stop, etc.);· Order — the ticket number of a trading position or a pending order (not to be mixed up with the trade operation number described
above);· Size — the amount of lots that participated in the operation;· Price — the price of the security at the operation performing;· S/L — the Stop Loss order value. No entries in this field mean that no order was placed;· T/P — the Take Profit order value. No entries in this field mean that no order was placed;· Profit — profit/loss. The value of profit/loss will be entered only after positions have been closed;· Balance — the value of balance. This value will be entered only after positions have been closed.
Having clicked with the left mouse button on any column heading, one can sort all entries in the table in descending or ascending order.Using the "Copy" context menu command or accelerating keys of Ctrl+C, one can copy the selected lines of results to the clipboard forfurther use in other applications. If no line has been selected, the entire table will be copied to the clipboard. To copy the entire table tothe clipboard, one can execute the "Copy all" command. The report about testing results can be stored in a HTML file on the hard disk.To do so, one has to execute the "Save as Report" context menu command. The "Set Date "From"" and "Set Date "To"" commands allowto specify the time range for testing. At that, the dates of the selected operations will be written in the fields of "Use date from:" and"Use date to:" in testing settings. This useful if there is a need to test an expert thoroughly or to optimize its parameters within thisgiven range. You can enable or disable the grid and auto arrange the columns using the relevant context menu commands.
More details are given in the sections of "Tester" and "Optimization".
54 / 164
Client Terminal / User Interface / Tester / Graph
GraphIn the "Graph" tab, the graphs of the account balance (blue line — "Balance") and general account status considering open positions(green line — "Lots") are drawn automatically. If only balance line is shown in the graph, it means that "Balance" and "Lots" lines coincideduring the whole testing process. The graph allows to watch the trade results more pictorially when testing. If the lot sizes have beenchanged during testing, the bar chart showing these changes will appear in the lower part of the graph.
Double click with the left mouse button on any point of the graph will switch to the "Results" tab and select the corresponding line. Usingthe "Copy" context menu command or accelerating keys of Ctrl+C, one can copy the graph to the clipboard for further use in otherapplications. The graph can also be stored as a GIF file on the hard disk. To do so, one has to execute the "Save as Picture" contextmenu command or press the accelerating keys of Ctrl+S. The "Set Date "From"" and "Set Date "To"" commands allow to set the timerange of testing. At that, the dates of operations selected are written in the fields of "Use Date From:" and "Use Date To:" in theSettings tab. This is useful if there is a need to test an expert or to optimize its parameters for this given time range.
More details are given in the sections of "testing Expert Advisors" and "Optimization".
55 / 164
Client Terminal / User Interface / Tester / Report
ReportThe summarized results of experts testing and some key indices are represented in the "Report" tab. Such reports allow to comparedifferent experts to each other in a quick mode. The following data are published in reports:· Bars in test — the amount of the modeled history data in bars;· Ticks modeled — the amount of the modeled ticks;· Modeling quality — the quality of ticks modeled during testing in per cents. Modeling is schematically displayed as a band in the next
line of the report. This band can be of one of three colors:· Grey — this part of the data available was not tested at all. Grey color can appear, if the range of dates was given in tester settings;· Red — modeling was not performed within this subrange since no data of a smaller period were available. At that, only data from the
period selected in the tester settings were used;· Green — modeling was performed within this subrange. At that, the brighter the color is, the better in quality the modeling was. For
example, when testing at the period of H1, the dark-green band can mean that M30-period data were used for testing, and thebrightest means that those of M1 period were used;
Attention: If the fastest method ("by open prices") has been used for modeling in testing settings, the entire band will be red. Atthat, "n/a" — modeling has not been performed at all — will be written in the "Modelling quality" field;
· Initial deposit — the volume of the initial deposit;· Total net profit — financial result of all trades. This index represents a difference between the "Gross profit" and "Gross loss";· Gross profit — the sum of all profitable trades in terms of money;· Gross loss — the sum of all unprofitable trades in terms of money;· Profit factor — the ratio between gross profit and gross loss in per cents. The one value means that profit equals to loss;· Expected payoff — the expected payoff. This statistically calculated index represents the average profit/loss factor of a trade. It can
also be considered for representing the expected profit/loss factor of the next trade;· Absolute drawdown — the largest loss is lower than the initial deposit value;· Maximal drawdown (%) — maximal loss of the local maximum in the deposit currency and in percents of the deposit;· Relative Drawdown — the maximal loss in percents of the maximum equity value and its corresponding money value;· Total trades — the total amount of trade positions;· Short positions (won %) — the amount of short positions and percentage of won thereof;· Long positions (won %) — the amount of long positions and percentage of won thereof;· Profit trades (% of total) — the amount of profitable trade positions and their percentage in the total trades;· Loss trades (% of total) — the amount of loss trade positions and their percentage in the total trades;· Largest profit trade — the largest profit among all profitable positions;· Largest loss trade — the largest loss among all unprofitable positions;· Average profit trade — average profit value for a trade (the sum of profits divided by the amount of profitable trades);· Average loss trade — average loss value for a trade (the sum of losses divided by the amount of unprofitable trades);· Maximum consecutive wins (profit in money) — the longest series of profitable trade positions and the sum of their wins;· Maximum consecutive losses (loss in money) — the longest series of unprofitable trade positions and the sum of their losses;· Maximal consecutive profit (count of wins) — the maximum profit of a series of profitable trades and the amount of profitable
trades corresponding with it;· Maximal consecutive loss (count of losses) — the maximum loss of a series of unprofitable trades and the amount of unprofitable
trades corresponding with it;· Average consecutive wins — the average amount of profitable positions in consecutive profitable series;· Average consecutive losses — the average amount of unprofitable positions in consecutive unprofitable series.
This report can be copied to the clipboard or saved in the hard disk as an HTML file. To do so, one has to execute the "Copy" contextmenu command or that of "Save as Report", respectively. The report can also be copied to the clipboard by pressing of accelerating keysof Ctrl+C.
More details are given in the sections of "testing Expert Advisors" and "Optimization".
56 / 164
Client Terminal / User Interface / Tester / Journal
JournalMessages about the expert testing process, including all trade operations, are published in the "Journal" tab automatically. This journalis rather similar to that of the "Terminal — Expert Advisors" window, except for that messages informing about expert testing, but notits working at the market , are published in this Tester Journal. After the expert has been tested, these data will be output in theseparate /TESTER/LOGS directory. The tester journal files are stored in the /EXPERTS/LOGS directory, filenames being correspondentwith the date of logs — YYYYMMDD.LOG. To view the stored logs, one has to execute the "Open" contest menu command and select anecessary file. To copy the message to the clipboard, one has to execute the context menu command of the same name. The "Delete All"command allows to delete all the logs from the directory and cleans this tab. This can be useful to clean the hard disk of too many files.
More details can be found in the sections of "testing Expert Advisors" and "Optimization".
57 / 164
Client Terminal / User Interface / Tester / Optimization Results
Optimization ResultsUnlike testing, optimization is supposed to perform many passes for mechanical trading system (MTS) with different inputs. This isdone to determine the expert parameters with which its profitability is the highest. To optimize, one has to flag the "Optimization" fieldin the tab of tester setup and press the "Start" button. After that, two new tabs will appear in the window: "Optimization Results" and"Optimization Graph".
The "Optimization Results" tab, unlike Tester Report, publishes not the entire list of trades, but final reports of each pass. All data arerepresented in the table with the following fields:· Pass — the pass number;· Profit — net profit (gross profit minus gross loss);· Total trades — the total amount of open trade positions;· Profit factor — the ratio between total profit and total loss in per cents. One means that total profit is equal to total loss;· Expected Payoff — mathematical expectation of win. This statistically calculable figure shows average profitability/unprofitableness
of one trade. It is considered to show the estimate profitability/unprofitableness of the next trade;· Drawdown $ — maximum drawdown relating to the initial deposit in the deposit currency;· Drawdown % — maximum drawdown relating to the initial deposit in per cents;· Inputs — dynamic values of inputs at each pass.
After having clicked with the left mouse button on the heading of any column, one can sort all entries of the table in decreasing orincreasing order. Data of the selected pass will be entered as basic inputs of the expert (expert properties window, the "Inputs" tab)after the "Set Input Parameters" context menu command has been executed. At that, the program switches to the "Settings" tab, andoptimization mode will be stopped. Having pressed the "Start" button, one can test the expert advisor having the pre-defined inputparameters and variables. The same action can be done by a double click with the left mouse button on the pass line in the tab ofoptimization results. Using the "Copy" context menu command or accelerating keys of Ctrl+C, one can copy the selected results to theclipboard for further use in other applications. If no line has been selected, the entire table will be copied to the clipboard. The "CopyAll" command can be used to copy the entire table to the clipboard, as well. The report of the optimization results can also be stored inHTML format on the hard disk. To do so, one has to execute the "Save as Report" context menu command. Other context menucommands allow to set up displaying of results:· Skip Useless Results — show/hide the results of loss passes;· Show Input Parameters — show/hide the "Inputs" column;· Auto Arrange — automatic setting of column sizes when the window size changes.
The same action can be done by pressing of A;· Grid — show/hide grid to separate columns.
The same action can be done by pressing of G.
More details are given in the sections of "testing Expert Advisors" and "Optimization".
58 / 164
Client Terminal / User Interface / Tester / Optimization Graph
Optimization GraphUnlike testing, optimization is supposed to use many repeated passes of mechanical trading system (MTS) with different inputparameters. This is performed to determine such expert parameters at which its profitability is the highest. To perform optimization,one has to flag the field of the same name in the Settings tab and press the "Start" button. After that, two new tabs, "OptimizationResults" and "Optimization Graph", will appear in the window.
The profit graph of all passes will be drawn automatically in the "Optimization Graph" tab. The graph allows to estimate and visualizethe profitability of us of different combinations of inputs. A chart representing the amount of profit (green) and loss (red) trades ofeach pass is given in the lower part of the graph, as well.
Double click with the left mouse button on any point of the graph switches to the "Results" tab and selects the corresponding pass. Usingthe "Copy" context menu command or accelerating keys of Ctrl+C, one can copy the graph to the clipboard for further use in otherapplications. The graph can also be stored as a GIF file on the hard disk. To do so, one has to execute the "Save as Picture" contextmenu command or press accelerating keys of Ctrl+S. You can enable or disable displaying the grid on the chart using the correspondingcontext menu command.
More details can be found in the sections of "testing Expert Advisors" and "Optimization".
59 / 164
Client Terminal / User Interface / Fast Navigation
Fast NavigationThere are various methods used in the Client Terminal to accelerate working. The following can be used for this purpose:· fast navigation box — a small box that appears in the lower left corner of the chart and allows to manage it;· accelerating (hot) keys — key combinations that are intended for acceleration of working with various functions of the program.
Fast Navigation BoxThe fast navigation box is used for quick switching among charts and/or among chart periods, as well as for quick scrolling of the chartto the selected date. The fast navigation box of the active chart can be opened with the Enter key, then the fast navigation box willappear in the lower left part of the chart window. One can also move the cursor to the lower left part of the chart window and double-click the left mouse button after the icon has appeared.
Format of commands in the fast navigation box:
Format Example
[time (hours:minutes)] 08:30; 8:30;
[date] 2004.10.16; 16.10.2004; 16.10.04;
[date and time] 2004.10.16 8:30; 16.10.2004 8:30; 16.10.04 8:30;
Attention: It must be noted that only one of the above-listed commands can be executed in the fast navigation box.
To execute a command, one has to press the Enter key, and the Esc key - to close the box. To move the chart to a specific date andtime, one has to input this date and time. For example, the command that allows to move to the bar received at 8:30 on October, 162004, will appear as "2004.10.16 08:30". Along with YYYY.MM.DD and DD.MM.YYYY formats, one can also use the DD.MM.YY format, butnot the YY.MM.DD. The first zero in the time inputting can be skipped. For example, one can write "8:30" instead of "08:30". Whenchanging a symbol, one should specify its full name. When specifying the chart period, one may skip the "M". At the "GBPUSD 30"command, as well as at the "GBPUSD M30", the symbol and period will respectively change for a 30-minutes chart of Great Britain Poundvs US Dollar.
Hot KeysHot keys (accelerating keys) are keys and their combinations that allow to execute various commands fast and without using of menusor toolbars.· "Arrow Left" — chart scrolling to the left;· "Arrow Right" — chart scrolling to the right;· "Arrow Up" — fast chart scrolling to the left or, if the scale is defined, chart scrolling up;· "Arrow Down" fast chart scrolling to the right or, if the scale is defined, chart scrolling down;· Numpad 5 — restoring of automatic chart vertical scale after its being changed. If the scale was defined, this hot key will return the
chart into the visible range;· Page Up — fast chart scrolling to the left;· Page Down — fast chart scrolling to the right;· Home — move the chart to the start point;· End — move the chart to the end point;· "-" — chart zoom out;· "+" — chart zoom in;· Delete — delete all selected graphical objects;· Backspace — delete the latest objects imposed into the chart window;· Enter — open/close fast navigation window;· Esc — close the dialog window;· F1 — open this "Userguide";
60 / 164
· F2 — open the "History Center" window;· F3 — open the "Global Variables" window;· F4 — download MetaEditor;· F6 — call the "Tester" window for testing the expert attached to the chart window;· F7 — call the properties window of the expert attached to their chart window in order to change settings;· F8 — call the chart setup window;· F9 — call the "New Order" window;· F10 — open the "Popup prices" window;· F11 — enable/disable the full screen mode;· F12 — move the chart by one bar to the left;
· Shift+F12 — move the chart by one bar to the right;· Shift+F5 — switch to the previous profile;
· Alt+1 — display the chart as a sequence of bars (transform into bar chart);· Alt+2 — display the chart as a sequence of candlesticks (transform into candlesticks);· Alt+3 — display the chart as a broken line (transform into line chart);· Alt+A — copy all test/optimization results into the clipboard;· Alt+W — call the chart managing window;· Alt+F4 — close the client terminal;· Alt+Backspace or Ctrl+Z — undo object deletion;
· Ctrl+A — arrange all indicator windows heights by default;· Ctrl+B — call the "Objects List" window;· Ctrl+C or Ctrl+Insert — copy to the clipboard;· Ctrl+E — enable/disable expert advisor;· Ctrl+F — enable "Crosshair";· Ctrl+G — show/hide grid;· Ctrl+H — show/hide OHLC line;· Ctrl+I — call the "Indicators List" window;· Ctrl+L — show/hide volumes;· Ctrl+P — print the chart;· Ctrl+S — save the chart in a file having extensions: "CSV", "PRN", "HTM";· Ctrl+W or Ctrl+F4 — close the chart window;· Ctrl+Y— show/hide period separators;· Ctrl+Z or Alt+Backspace — undo the object deletion;· Ctrl+D — open/close the "Data Window";· Ctrl+M — open/close the "Market Watch" window;· Ctrl+N — open/close the "Navigator" window;· Ctrl+O — open the "Setup" window;· Ctrl+R — open/close the "Tester" window;· Ctrl+T — open/close the "Terminal" window;· Ctrl+F5 — switch to the next profile;· Ctrl+F6 — activate the next chart window;· Ctrl+F9 — open the "Terminal — Trade" window and switch the focus into it. After this, the trading activities can be managed with
keyboard.
There is a feature allowing to defined hot keys for calling any element of the "Navigator" window, except for those of the "Accounts"group. To define a combination of keys to an element, one has to execute the "Define a hot key" command of its context menu. Thedefined hot keys are of higher priority being compared to those pre-defined. For example, Ctrl+O combination meant initially the callingof the Terminal setup window. If one defines calling of the On Balance Volume indicator for the same combination, it will not be possibleto call the terminal setup window by pressing of Ctrl+O.
61 / 164
Client Terminal / Working with Charts
Working with ChartsA chart shows the price changes for a security with the time. Charts are necessary for performing technical analysis, working of expertadvisors and testing thereof. Up to ninety-nine charts can be opened in the terminal at the same time.
The client terminal allows to:· open up to 99 chart simultaneously;· set up their representation form and information shown;· print charts;· impose and delete various objects and indicators;· recover deleted charts;· use chart templates.
62 / 164
Client Terminal / Working with Charts / Chart Opening
Chart OpeningA chart shows the price changes for a security with the time. Charts are necessary for performing technical analysis, working of expertadvisors and testing thereof. Up to ninety-nine charts can be opened in the terminal at the same time.
A new chart can be opened by executing of the "File — New Chart" menu, "Window — New Window" menu command, or by pressing ofthe button of the "Standard" toolbar. The list of securities available will appear at performing any of the above actions. Having
selected the necessary symbol from this list, one can open its chart. New charts can also be opened from the "Market Watch" window,holding Ctrl and dragging the element of the list (the symbol) from the window into any point of the workspace of the terminal, orhaving executed the "Chart Window" command of the context menu. All new charts are opened with the DEFAULT.TPL template createdduring the terminal installation. This template cannot be deleted, but it can be modified.
History data used for drawing of charts are stored on the hard disk. At opening of a chart, the data are downloaded from the disk andthe last missing data are spooled from the trading server. If there are no history data for the symbol on the hard disk, the latest 512bars of history will be downloaded. To spool the earlier data, one has to move the chart to the desired area. After the chart has beenopened, information about the current quotes starts to income to the terminal. Thus, the further price changes will be shown in thereal-time mode. This information will be stored in the history file and used at the reopening of this chart in future.
Attention: The "Max. bars in history" and "Max. bars in chart" parameters are defined in the terminal settings. These parametersallow to control over the amount of history data displayed and stored on the hard disk.
Offline ChartsClient terminal allows to work with offline charts. These charts are opened on basis of data saved on the hard disk in HST format. Theyare not updated from the server. These charts turn out as very useful for working with non-standard securities or periods.
To open a new chart in offline mode, one has to execute the "File — Open Offline" menu command. Then, a symbol must be selected inthe window that appears, and the "Open" button must be pressed. The OFFLINE.TPL template is applied to the chart automatically. Atthat, the "(offline)" inscription will appear added in the heading of the offline chart.
At testing an expert, the data file in FXT format is created and used. It differs from a standard chart, but it can be opened offline.
63 / 164
Client Terminal / Working with Charts / Setup
SetupAppearance and properties of each chart in the terminal can be set up individually. To do so, one has to execute the "Charts —Properties..." menu command, the chart context menu command of the same name, or press F8. These actions result in appearing ofthe "Properties" window that can be used for setting of the color of various elements of the chart (the "Colors") tab:· Background — chart background color;· Foreground — color of axes, scales, OHLC line;· Grid — chart grid color;· Bar Up — bar up, shades and fringing of the Bull Candle body;· Bar Down — bar down, shades and fringing of the Bear Candle body;· Bull candle — color of the Bull Candle body;· Bear candle — color of the Bear Candle body;· Line graph — line chart and doji;· Volumes — volumes and levels of open positions;· Ask line — color of the Ask line;· Stop levels — levels of stop orders (Stop Loss and Take Profit).
The changes made are automatically shown in the left part of the window in the preview chart. Except for manual setting of variouscolor elements of the chart, one can choose pre-defined color diagrams in the field of the same name. There are three color diagramsavailable in the terminal: "Yellow on Black", "Green on Black", and "Black on White". After a color diagram has been chosen, the chartelements described above will change in the chart in the left part of the window. Custom color diagrams can be stored in templates.
Other chart settings can be defined in this window, as well. To do so, one has to switch to the "Common" tab and select the desiredoptions:· Offline chart — turn the chart offline. This option stops receiving and drawing of price data for the given chart. In future, after this
option is disabled, price data will be drawn in the chart again. After the chart has been opened offline, (the "File — Open offline"menu command), this option will be enabled automatically.
· Chart on foreground — place the chart in the "foreground". If this function is enabled, all analytical objects will be placed "under" theprice chart.This command is the same as that of "Charts — Foreground chart".
· Chart shift — shift the chart from the right border of the window to the shift mark. The chart shift mark (a gray triangle in the upperpart of the window) can be moved with the mouse horizontally within 10 to 50% of the window size.This option can also be enabled with the button of the "Charts" toolbar or by the "Charts — Chart Shift" menu command.
· Chart autoscroll — allow/forbid to shift the chart to the left automatically after the new bar has started to form. If this option isenabled, the latest bar will always be shown in the chart.This option can also be enabled by the button of the "Charts" toolbar and by the "Charts — Auto Scroll" menu command.
· Scale fix One to One — fix the chart scale as "one to one" (the size of one pip of the vertical axis in pixels is equal to the distancebetween the bars axes in pixels). At that, the "Scale fix" option will be enabled automatically, and a scroll bar will appear at the rightside of the window that allows to move the chart vertically. This mode is necessary for precise constructions.
· Scale fix — fix the current chart scale. If the scale has not been fixed, the chart will be automatically scaled vertically. This optiondisables automatic scaling and fixes the current scale. When this option is selected, the fields of additional scaling parameters "Fixedmaximum" and "Fixed minimum" are activated.
· Bar chart — display the chart as a sequence of bars.This action can also be performed with the button of the "Charts" toolbar, by the "Charts — Bar Chart" menu command or bypressing of accelerating keys of Alt+1.
· Candlesticks — display the chart as a sequence of candlesticks.This action can also be performed with the button of the "Charts" toolbar, by the "Charts — Candlesticks" menu command, or bypressing of accelerating keys of Alt+2.
· Line chart — display the chart as a broken line that connects the points of bar close prices.This action can also be performed by the button of the "Charts" toolbar, by the "Charts — Line Chart" menu command, or bypressing of accelerating keys of Alt+3.
· Show OHLC — show/hide OHLC line. If this action is done, an additional data line will appear in the upper left part of the window.Except for symbol name and chart period, the latest bar prices are listed in it. Price are recorded in the following format: OPEN,HIGH, LOW and CLOSE (OHLC) — bar open price, the highest bar price, the lowest bar price, and bar close price, respectively. Thus,precise value of the latest bar can always be seen. This option influences the data line of sub-windows of indicators, as well.
· Show Ask line — show/hide Ask price level of the latest quote. Bars are drawn and shown only on Bid prices in the terminal. However,at opening of long positions and closing of the short ones, the Ask price is always used. It is not shown in the chart in any way, so itcannot be seen. To control one's trading activities more precisely, one can enable the "Show Ask line" parameter. After this commandhas been executed, an additional horizontal line will appear in the chart that correspond with the Ask line of the latest bar.
64 / 164
has been executed, an additional horizontal line will appear in the chart that correspond with the Ask line of the latest bar.· Show period separators — show/hide period separators. Date and time of each bar are displayed on the horizontal axis of the chart.
And this horizontal scale interval is the selected timeframe. The "Show period separators" option draws additional vertical lines in thechart that correspond with the larger period (timeframe) borders. So, daily separators will be drawn for charts with periods of M1 toH1, weekly ones — for H4, monthly ones — for D1, and yearly ones — for W1 and MN1.
· Show grid — show/hide grid in the chart window.The same actions can be performed by the chart context menu and "Charts" menu command of the same name, as well as by pressingof accelerating keys of Ctrl+G.
· Show volumes — show/hide the volume chart in the lower part of the window. This option does not function when the scale is fixed.The same actions can be performed by the chart context menu and "Charts" menu command of the same name, as well as by pressingof accelerating keys of Ctrl+L.
· Show object descriptions — show/hide object descriptions in the chart. If this option is enabled and there are descriptions ofobjects imposed into the chart available, they will be shown directly in the chart.
65 / 164
Client Terminal / Working with Charts / Chart Management
Chart ManagementCharts allow to analyze price changes at the market and are used for graphical analysis, building of various indicators and line studies.Charts are a very valuable instrument for analyzing of financial markets, that is why a great attention is paid to them. Chartmanagement means:· Chart Type
A symbol chart can be of three types:· Bar Chart — the sequence of bars.
To make a chart of this type, one has to press the button of the "Charts" toolbar, accelerating keys of Alt + 1, the correspondingoption of the Charts Setup window, or execute the "Charts — Bar Chart" menu command.
· Candlesticks — the sequence of candlesticks.To make a chart of this type, one has to press the button of the "Charts" toolbar, accelerating keys of Alt + 2, the correspondingoption of the Charts Setup window, or execute the "Charts — Candlesticks" menu command.
· Line Chart — a broken line connecting the bar close prices.To make a chart of this type, one has to press the button of the "Charts" toolbar, accelerating keys of Alt + 3, the correspondingoption of the Charts Setup window, or execute the "Charts — Line Chart" menu command.
· SavingThe client terminal allows to save history data of the active chart as a text file in formats of "CSV", "PRN", and "HTM".To save them in one of these ways, one has to execute the "File— Save As" menu command or press accelerating keys of Ctrl + S.Besides, the chart can be saved as a picture in BMP or GIF format. To do so, one has to execute the "File—Save As Picture..." menucommand. The same actions can be performed by the chart context menu command of the same name.
· PrintTo print the active chart in color, one has to flag "Color print" in the chart settings, then execute the "File — Print..." menu command,the chart context menu command of the same name, press the button of the "Standard" toolbar or accelerating keys of Ctrl+P. If
the "Color Print" is disabled, or there is no color printer available, the chart will bee printed as black-and-white.· Full Screen
Execution of the "View — Full Screen" menu command or pressing of F11 will switch the chart to the full screen mode. Only chartwindows, main menu and chart switching bar will remain in the display. One can return to the initial mode using the same command.
· Attaching of MQL4 ProgramsBefore MQL4 starts to execute, it must be attached to the chart. To do so, one has to select the desired MQL4 program in the"Navigator" window and double-click on it or execute the "Attach to a chart" command of the context menu. The "Drag'n'Drop"technique can be used, as well.
· Working with IndicatorsIndicator is a mathematical manipulation with price and/or volumes of a security in order to forecast future price changes. Decisionsabout how and when to open or close a position are made on basis of signals from technical indicators. Indicators can be imposed intoa chart by the "Insert — Indicators" menu commands or those of indicators managing sub-menu that can be opened by pressing of the
button of the "Charts" toolbar. The "Drag'n'Drop" technique allows to impose indicators from the "Navigator" window into any
open window, as well. The list of indicators imposed into the chart can be viewed in the "Data Window" by executing of the "Charts —Indicators List" menu command, the chart context menu command of the same name, or by pressing accelerating keys of Ctrl+I.More details about working with technical indicators can be found in the section of the same name.
· Working with ObjectsTo analyze the market, one can impose various graphical objects into the chart. To do it, one has to use the "Insert" menu commandsor buttons of the "Line Studies" toolbar. Line Studies, geometrical shapes, signs, and texts, are grouped in the menu.More details can be found in the "Graphical Objects" section.
· Period ChangeThe client terminal allows to use nine different data periods, from a minute to a month long. This variety of periods is necessary foranalyzing the market with technical indicators and line studies.The desired period of the chart can be chosen with help of the "Period" toolbar, the button of the "Charts" toolbar, the "Charts —Period" menu, or by executing of the chart context menu command.
· ZoomingCharts can be zoomed horizontally, increasing or decreasing thereby the amount of bars shown in the screen simultaneously.To do it, one can use the buttons of / of the "Charts" toolbar, keys of "+"/"-", the commands of "Zoom In"/"Zoom Out" of thechart context menu and of the "Charts" menu.To zoom out a chart vertically, one can hold any point of vertical axis with the left mouse button and move it down. Double click onvertical axis or pressing of "5" in the keypad restores the scale. Besides, the chart can be zoomed precisely by defining of upper and lower borders in the Charts Setup window with the "Scale fix"option. The "Scale fix One to One" option of the same window allows to set the "one-to-one", i.e., one pip of vertical axis willcorrespond with one bar of the horizontal one.
66 / 164
· Scrolling, Auto Scrolling, and Shifting of the ChartScrolling is moving of price data to the right/left in the chart that can be performed by cursory keys of the keyboard. Besides, thechart can be scrolled with F12 (the "Step by Step" mode — scrolling the chart by one bar to the left) or Shift+F12 (scrolling the chart byone bar to the right), or with the mouse: one moves the cursor to the right/left when holding the left mouse button pressed on anypoint of the chart. Using the fast navigation box, one can have shown the necessary area of the chart having specified the specificdate and time. If the chart has been scrolled to the area where there are no price data, the missing bars will be downloadedautomatically. If the chart scale has been fixed, it can be scrolled vertically, as well. To do so, one has to move the mouse up/down while holding theslider on the vertical scale. To get the chart back into the visibility range, one has to press "5" in the keypad or double-click in thearea of the chart price scale. Auto scroll is intended for users to have the latest bars before their eyes constantly. If this option is enabled, the chart will beautomatically scrolled to its end part. This function can be enabled by pressing of the button of the "Charts" toolbar or by the"Charts — Auto Scroll" menu command. The "Chart Shift" option shifts the latest bar from the right screen border to the chart shift mark. The chart shift mark (a graytriangle in the upper part of the window) can be moved horizontally with the mouse within 10 to 50% of the window size. The chartshift can be enabled by the button of the "Charts" toolbar or by the "Charts — Chart Shift" menu command.
· Chart PositioningNormally, the chart datum point is located in the left part of the window. The specific time bar is anchored to it that can be movedthrough scrolling or with the use of fast navigation box. When a timeframe is changed, there will be an attempt to calculate the newanchoring bar corresponding with that of the previously used timeframe. I.e., the timeframe that is the nearest to this given pointwill be shown at the left side of the window. The datum point (a gray triangle at the lower border of the chart) can be moved withinthe chart window using the mouse. It appears only if the "Auto Scroll" is disabled. This mechanism is convenient when analyzing acertain period of time for different timeframes.
Attention: Positioning does not work if the "Auto Scroll" option is enabled.
· Working with TemplatesTemplates represent the chart window parameters stored in the memory. The following is saved in a template: chart type, period,scale, all settings of line studies, technical and custom indicators, and experts. Templates allow to unify the appearance of manycharts easily and fast.The menu that manages templates can be called by the "Charts — Template" menu command, the chart context menu command of thesame name and the button of the "Charts" toolbar. The "Save Template..." menu command allows to store a new template, andthat of "Remove Template" — to delete an existing one.More details can be found in the "Templates and Profiles" section.
· Working with ProfilesProfiles represent a convenient way of working with chart groups. At opening of a profile, each chart with all its settings will be foundin the same place where it was when the profile was being stored.The menu that manages profiles can be opened by the "File — Profiles" menu command, by pressing of the button of the
"Standard" toolbar, or by clicking with the mouse in the status bar containing the name of the current profile.More details can be found in the "Templates and Profiles" section.
· Data UpdatingData must be updated if any errors or "holes" occur in the price chart. In order to update the price data, one has to execute the"Charts — Refresh" menu command or the chart context menu command of the same name. After all these actions have beenperformed, the missing bars will be downloaded from the server automatically and drawn in the chart.
Use of MouseThe chart is directly managed with the mouse as follows:· clicking with the left mouse button on any point in the chart window and holding of it with the subsequent horizontal moving of the
cursor result in the chart scrolling;· clicking with the left mouse button on the chart vertical scale and holding of it with the subsequent vertical moving of the cursor
result in vertical chart scaling, and the double click with the mouse on the chart vertical scale will rescale the chart;· clicking with the left mouse button on the chart horizontal scale (but not the fast navigation box) and holding of it with the
subsequent horizontal moving of the cursor will result in the chart rescaling;· clicking with the right mouse button on any point in the chart window results in calling of the chart context menu (described below);· double-clicking with the left mouse button on elements of technical indicators (lines, signs, histogram bars, etc.) calls the setup
window of the corresponding indicator;· clicking with the right mouse button on elements of a technical indicator calls the context menu of the indicator;· single or double, depending on the terminal settings, clicking with the left mouse button on an object (line studies, texts or arrows)
will select the object;· clicking with the left mouse button on the selected object and holding of it with the subsequent moving allows to move the selected
object;
67 / 164
object;· Ctrl + clicking with the left mouse button on a selected trend line with the subsequent moving allows to draw a parallel trend line
(create a channel);· clicking with the middle mouse button in the chart window switches cursor to the "crosshair" mode;· clicking with the right mouse button on a selected object will open its context menu;· placing of cursor on the bar close price or on an element of an object or indicator will call the prompt.
Chart Management with Context Menu CommandsSome commands of the context menu are intended for chart management:§ Expert Advisors — sub-menu that manages expert advisors. Expert advisor is an MQL4 program that is executed with every new tick
and allows to automate analytical and trading activities. Commands that manage the expert imposed into the chart are grouped inthis menu, too. Using this sub-menu, one can change the expert properties, remove it, or start testing it.More details are given in the "Expert Advisors" section.
§ Remove Script — remove an executable script. Script is a program written in MetaQuotes Language 4 (MQL 4) and intended for asingle performing of some actions.
§ Indicators List — window that manages technical indicators attached to the chart window. Technical indicator is a mathematicalmanipulation of the symbol price and/or volumes in order to forecast future price changes. On signals received from technicalindicators, decisions are made about how and when to open or close a position.
§ Objects List — window that manages graphical objects. Graphical objects are those objects in the terminal that are imposedmanually. They are intended for analytical purposes.
§ Periodicity — sub-menu that manages the chart periods.Periods of charts can also be managed by the "Charts" menu and toolbar commands of the corresponding names.
§ Template — sub-menu that manages templates. Template is a set of chart window parameters that can be used for other charts.This sub-menu can also be called by the "Chart" menu command of the same name.
§ Refresh — refresh history data. At that, all data missing within the available history and new ones will be downloaded.The same action can be performed by the "Charts" menu command of the same name.
§ Auto Arrange — set the height of all indicators windows as default.The same action can be performed by pressing of accelerating keys of Ctrl+A.
§ Grid — show/hide grid.The same action can be performed by the "Charts" menu command of the same name or by pressing of accelerating keys of Ctrl+G.
§ Volumes — show/hide volumes chart.The same actions can be performed by the "Charts" menu command of the same name or by pressing of accelerating keys of Ctrl+L.
§ Zoom In — zoom in the chart horizontally by one step.The chart can also be zoomed in by the "Charts" menu command of the same name, by pressing of "+" or the button of the"Charts" toolbar.
§ Zoom Out — zoom out the chart by one step.The chart can also be zoomed out by the "Charts" menu command of the same name, by pressing of "-" or the button of the"Charts" toolbar.
§ Delete Indicator Window — delete indicator window from the chart. Some indicators are drawn in special sub-windows and have theirown scaling. This command allows to delete such a sub-window.More details about working with technical indicators can be found in the corresponding section.
§ Save As Picture — save the chart as a picture (GIF or BMP).The same action can be performed by the "File — Save As Picture..." menu command.
§ Print Preview — preview the chart image before printing.The same action can be performed by the "File — Print Preview" menu command or by pressing of the button of the "Standard"
toolbar.§ Print... — print the chart. If the "Color print" option is checked in the program settings, chart can be printed in color.
The same action can be performed by the "File — Print..." menu command, accelerating keys of Ctrl+P, or the button of the
"Standard" toolbar.§ Properties... — call the charts setup window.
The same action can be performed by pressing of F8.
Attention: The "Expert Advisors" sub-menu, as well as the commands of "Remove Script", "Indicators List", and "Objects List" areactivated only if the corresponding objects have been imposed into the chart.
68 / 164
Client Terminal / Working with Charts / Charts Print
Charts PrintThere are means to print out charts in the client terminal. A hart can be printed in black-and-white or in color. To print it in color, onehas to enable the "Color print" option in the client terminal settings window. After that, the chart will be printed out in color if theprinting device allows it. Otherwise, the chart will be printed out in black-and-white format.
The present printing device sometimes needs to be set up. To do so, one has to execute the File — Print Setup..." menu command. Tomake sure that all desired elements are included into the printing area, one can execute the "Print Preview" command of the samemenu, the same command of the chart context menu, or press the button of the "Standard" toolbar. The printing itself will be
performed by the "File — Print..." menu command, by the same command of the chart context menu, by pressing of the button of
the "Standard" toolbar, or accelerating keys of Ctrl+P.
69 / 164
Client Terminal / Working with Charts / Deleted Charts
Deleted ChartsSome charts become useless at some stages of work, and they need to be deleted. This can be done by the "File — Close" menucommand or by pressing of accelerating keys of Ctrl+F4. At that, the templates of deleted windows will be stored if "Save deleted chartsto reopen" is enabled in the client terminal settings window. These templates can be used in future. So, if a chart has been deletedoccasionally, it can be restored. To do so, one has to execute the "File — Open Deleted" menu command and select a symbol from thelist. After that, the chart window of the selected symbol will be fully restored with all its settings and objects imposed into it.
70 / 164
Client Terminal / Working with Charts / Templates and Profiles
Templates and ProfilesA template is a set of chart window parameters that can be applied to other charts. The following can be stored in a template:· chart type and color;· color diagram;· chart scale;· OHLC line shown or hidden;· the attached expert advisor and its parameters;· the imposed custom and technical indicators with their settings;· line studies;· separators of days.
When a template is imposed into a chart, the stored settings, as they are, will be attached to the security and period. For example, onecan create a template that includes indicators of MACD, RSI, and Moving Average, and then use it for other charts. In this case, chartswindows will have the same view for different symbols and periods.
Templates are stored in the /TEMPLATES directory as TPL files. A template created once can be used unlimited amount of times. A basictemplate (DEFAULT.TPL) is created during installation of the terminal. It will be applied automatically for creation a new chart window. Infuture, it can be changed by using of the active chart window properties.
To create a new template, one has to execute the "Charts — Template — Save Template..." menu command, the chart context menucommand of the same name, or by pressing of the button of the "Charts" toolbar. As a result, a new template will be created onbasis of the data of active chart window. The same actions must be performed to modify a template, but an existing template should beselected instead of entering of a new filename. To impose a template into the chart window, one has to select the desired file in thetemplates managing menu or in any available folder in the "Open" window that can be called by the "Charts — Template — LoadTemplate..." menu command. The "Charts — Template — Remove Template" menu command and the chart context menu command ofthe same name allow to delete templates.
Attention: The "DEFAULT.TPL" cannot be removed.
ProfilesProfiles offer a convenient way of working with groups of charts. When a profile opens, each chart with its settings is placed exactly inthe same location where it was before, at the profile saving. All changes in all chart windows of the given list are automatically saved inthe current profile. The list of all chart windows of the current profile can be found in the "Window" menu. The name of the currentprofile is displayed in one of the status bar windows and checked in the profile managing menu. When the terminal is installed, theprofile by default (DEFAULT) is created. Initially, four basic currency pairs are stored in it: "EUR/USD", "USD/CHF", "GBP/USD", and"USD/JPY".
Profiles are managed from a single menu that can be called by the "File — Profiles" menu commands, by pressing of the button of
the "Standard" toolbar, or by clicking with the mouse button on the current profile name in the status bar window. To use anotherprofile, one has to select the desired name from the list in this menu. At that, the new profile will be opened and become the current.The "Save Profile" command saves the current profile in its state by the moment of the beginning of the command execution under anew name. The new profile is a copy of the previous one and becomes the current. One can delete profiles using the "Remove Profile"command.
The "Next Profile" command and Ctrl + F5 open all available profiles one by one, and the "Previous Profile" and accelerating keys of Shift+ F5 allow to search profiles in the reverse direction.
Attention: The current profile and that by default (DEFAULT) cannot be deleted.
A pre-defined profile can be assigned to a trade account in the client terminal. This profile must have a name that coincides with thenumber of the trade account. If there is a corresponding profile when switching to the given trade account, it will be openedautomatically. If there is no pre-defined profile, the current profile will remain active.
71 / 164
Client Terminal / Analytics
AnalyticsTechnical indicators and line studies are built into the terminal for analytical purposes. These objects are imposed directly into the chartand allow to forecast further price changes. At that, indicators are imposed automatically, and line studies are attached manually. This iswhy, when working with line studies, one has to draw them properly. Parameters of indicators can be set up manually, as well. Technicalindicators can have different settings for different symbols or periods.
The use of technical indicators and line studies allows to open and close reasonable trade positions, place and modify pending orders.Moreover, using of analytical means allows to perform systematic trading activities and reduces in that way the influence of humanemotions. Along with technical indicators, custom indicators written in MetaQuotes Language 4 (MQL 4) can be used for analyticalpurposes. No line studies or similar tools can be written in MQL 4.
72 / 164
Client Terminal / Analytics / Graphical Objects
Graphical ObjectsGraphical objects are objects in the terminal that are imposed manually into the chart. These objects are used for analytical purposes.They include:· Line Studies — lines and various geometrical shapes to be imposed into the price or indicators charts. They include
support/resistance lines, trendlines, as well as Fibonacci, Gann, Andrews' tools, etc. More details about line studies can be found inthe section of the same name;
· Shapes — geometrical shapes (rectangle, triangle, and ellipse) that allow to mark various areas in the price chart;· Arrows — arrows and signs that allow to mark the most significant points in the chart;· Text — text intended for adding of comments to the chart;· Text Label — text intended for adding of comments and anchored to the chart window coordinates. Text label does not move when the
chart is scrolled.
All objects are grouped in the "Insert" menu and in the "Line Studies" toolbar. Having selected an object in the list and set a point in thechart (or in an indicator window), one can impose the tool.
Attention: To impose several objects, one has to set more than one point. The object will not appear in the chart until all necessarypoints are set.
After the object has been created, it can be moved or modified. To do so, one has to select the object first. If the "Select object bysingle mouse click" parameter is set in terminal settings, one has to click once with the left mouse button on any element of the object.If not, the double-click should be used. The object can be considered as selected if square markers or frames appear. The markers areintended for moving of objects and changing their drawing parameters. Thus, for example, to change the Fibonacci Fan location, onehas to hold its central marker with the left mouse button and move the cursor. And moving of any of the extreme markers will result inchanging of the object drawing parameters. Terminal allows to create copies of various object very fast. To do so, one has to select theobject and, holding Ctrl pressed, move it with the central marker.
All objects imposed into the chart become unnecessary sooner or later, and they can be removed by commands of the context menu.Besides, the Backspace key allows to remove objects in series. In future, all removed objects can be restored. To do so, it is necessaryto execute the "Undo Delete" command of the object context menu, the "Charts — Objects — Undo Delete" menu command, or useaccelerating keys of Ctrl+Z.
Object PropertiesEvery object has its specific properties. Properties can differ depending on the object. To manage the properties of an object, one hasto select the object and execute its context menu command of "Properties...", the "Charts — Objects — Objects List" menu command.After that, the window of the object name will appear that contains several tabs. General object settings are placed in the "Common"tab. The following is available here:· Name — the object unique name within one chart that is set for the object automatically. It can be changed if another name is
entered in this field. Such names make it easy to mark the object out among many others of the same type;· Description — description/text contents of the object that also serve for marking it out among many others of the same type.
Besides, these descriptions can be shown in the chart if the "Show object descriptions" option is enabled in the chart settings;· Style — object lines style. Color, forms and thickness of lines can be chosen here;· Draw object as background — draw object in the background, behind the chart. Being enabled, this option provides filling of the
objects like shapes or channels (excluding Fibonacci Channel) with color.
Coordinates of the object control points in the chart can be changed in the "Parameters" tab. Time coordinates of the object controlpoints should be entered in the "Time" fields, and coordinates of anchoring to vertical axis of a chart of indicator should be given in the"Value" fields. An object can have from one to three coordinates. For some objects, additional options are used in the "Parameters" tab:· Angle in degrees — angle of the object slope anticlockwise in degrees;· Scale — ratio between units of vertical (pips) and horizontal (bars) axes of the object. Normally, the number of pixels in a unit of the
horizontal axis (time) differs from that of the vertical axis (prices) when chart are drawn. One-to-one scale brings them to the samevalue. For certain objects, changing of this parameter changes the ratio;
· Arrow code — object code;· Ray — show the object trendlines as rays;· Anchor — one of the chart corners at which the text label is anchored;· X-distance — horizontal distance between the anchor corner of the window and the text label in pixels;· Y-distance — vertical distance between the anchor corner of the window and the text label in pixels.
The object visualization mode for different timeframes can be changed in the "Visualization" tab. The object will then be shown only forthe selected timeframes. This can be useful when the tool has different settings for different timeframes. The "Fibo Levels" tab isspecifically used only for Fibonacci tools. The list of the tool levels is given here in form of a table. The values of the levels can be
73 / 164
specifically used only for Fibonacci tools. The list of the tool levels is given here in form of a table. The values of the levels can bechanged or deleted (the "Delete" button). A new level can be added by pressing of the "Add" button. At that, if "(%$)" is entered in the"Description" field, the price value corresponding with this level will be shown in the chart. The "Defaults" button resets the initialvalues. The "Style" field that allows to set up the color, appearance, and thickness of levels of the object is located in the lower part ofthe tab.
74 / 164
Client Terminal / Analytics / Graphical Objects / Line Studies
Line StudiesLine studies are lines and various geometrical shapes that can be imposed into a price or indicator chart. They includesupport/resistance lines, trend lines, as well as Fibonacci's, Gann's, and Andrews' tools, etc.
Line studies are collected in the "Insert" menu and in the "Line Studies" toolbar in terminal. To impose an object, one has to press thecorresponding toolbar button (the buttons are given in the leftmost column of the table) or execute a menu command.
Menu Command Description
Horizontal Line Horizontal line can be used to mark various levels, particularly, those ofsupport/resistance. One point must be set for this object to be imposed.
Vertical Line Vertical line can be used to mark various borders in the time axis and to compare signals ofindicators to price changes. One point must be set for this object to be imposed.
Trendline Trendline helps to explore trends in price changes. Two points must be set through which atrendline will be drawn.
Trendline by Angle Trendline by angle helps to explore trends in price changes. Unlike for a simple trendline, anangle must be set for this line to be drawn. Two points must be set through which atrendline will be drawn.
Linear Regression Channel Linear regression is a statistical analysis tool used for forecasting of future values on basisof available data. If the trend is ascending, one can logically suppose that the next bar willbe a bit higher than the preceding one. The linear regression method allows to have astatistical demonstration of such logical conclusions. Two points must be set for this tool tobe drawn.
Equidistant Channel Lines of the equidistant channel are always parallel. Two points must be set for this tool tobe drawn.
Standard Deviation Channel Standard deviation is the way of volatility measuring based on statistical methods.Standard deviation influences the width of this channel. Two points must be set for this toolto be drawn.
Gann Line Gann Line represents a trendline drawn at an angle of 45 degrees. Two points must be setfor this tool to be drawn.
Gann Fan Gann Fan represents a set of trendlines drawn from one point at different angles. Gannconsidered the trendline of 1x1 (45 degrees) for a very important one. If the price curve isabove this line, the market should be considered as bull market, if it is below, it is bearmarket. Gann supposed the ray of 1x1 to be a powerful supporting line at an ascendingtrend, and breaking of this line — to be an important turn signal. One point must be set forGann Fan to be drawn.
Gann Grid Lines of the Gann Grid are drawn at an angle of 45 degrees. Two points must be set for thistool to be drawn.
Fibonacci Retracement Leonardo Fibonacci is considered to have discovered a number sequence where eachsuccessive number represents a sum of two preceding ones: 1, 1, 2, 3, 5, 8, 13, 21, 34,55, 89, 144, etc. Each number is approximately 1.618 times more than the preceding one,and each number makes approximately 0.618 of the successive one. The tool can be drawnon two points that determine the trendline. At that, horizontal lines that meet the trendlineat Fibonacci levels (retracement) as 0.0%, 23.6%, 38.2%, 50%, 61.8%, 100%, 161.8%,261.8%, and 423.6% are drawn automatically.
Fibonacci Channel To draw this tool, a channel is used the width of which is taken as one. Then, at thedistances defined by the Fibonacci sequence, parallels are drawn starting with the distanceof 0.618 of the channel width, then 1.000, 1.618, 2.618, 4.236, etc. Two points and thebasic channel width must be set for this tool to be drawn.
Fibonacci Time Zones Fibonacci Time Zones represent a row of vertical lines placed at Fibonacci intervals fromeach other: 1, 2, 3, 5, 8, 13, 21, 34, etc. It is considered that significant price changesshould be expected near these lines. The tool can be drawn on two points that define theunit interval.
Fibonacci Fan Fibonacci Fan is drawn on two points that define the trendline. Then an "invisible" verticalline is drawn through the second point. Then three trendlines are drawn from the firstpoint, these trendlines meeting the invisible vertical line at Fibonacci levels of 38.2%, 50%,
75 / 164
point, these trendlines meeting the invisible vertical line at Fibonacci levels of 38.2%, 50%,and 61.8%. It is considered that significant price changes should be expected near theselines.
Fibonacci Arcs The tool named Fibonacci Arcs is drawn on two points that define the trendline. Then threearcs having the centers in the second point are drawn, these arcs meeting the trendline atFibonacci levels of 38.2%, 50%, and 61.8%. It is considered that significant price changesshould be expected near these arcs.
Fibonacci Expansion Fibonacci Expansion is drawn on three points that circumscribe two waves. Then three linesmeeting the third, "presumptive", wave at Fibonacci levels of 61.8%, 100%, and 161.8%,are drawn. It is considered that significant price changes should be expected near theselines.
Andrews' Pitchfork This tool is drawn on three points and represents the parallel trendlines. The first trendlinestarts at the selected leftmost point (it is an important peak or trough) and is drawnprecisely between two rightmost points. This line is the pitchfork "helve". Then, the secondand the third trendlines outgoing from the above-mentioned rightmost points (significantpeak and trough) are drawn in parallel to the first trendline. These lines are the pitchfork"teeth". Andrews' Pitchfork is interpreted as support/resistance lines are normallyinterpreted.
Cycle Lines This tool represents a row of vertical lines placed at equal intervals. Normally, a unitinterval corresponds with one cycle. At that, completed lines are considered to describefuture cycles. The tool is drawn on two points that define the unit interval.
The trend lines can be moved in groups within a chart if their node points are located in immediate proximity to each other (withinthe range of two pixels).
Technical IndicatorsTechnical indicator is a mathematical manipulation of a security price and/or volumes aimed at forecasting of future price changes.Decisions about how and when to open or close positions can be made on basis of signals from technical indicators. According to theirfunctionalities, indicators can be divided into two groups: trend indicators and oscillators. Trend indicators help to assess the pricedirection and detect the turn moments synchronously or with a delay. Oscillators allow to find the turning moments ahead orsynchronously.
Indicators are imposed into the chart from the "Navigator" window by means of Drag`n Drop technique, by execution of the "Insert —Indicators" menu command, or by pressing of the button of the "Charts" toolbar. A technical indicator can be drawn in a separate
indicator window that has a specific vertical scale (for example, MACD) or it can be imposed directly into the price chart (for example,Moving Average). At that, indicators can be drawn not only for price data and derivatives thereof (Median Price, Typical Price, WeightedClose), but also for other indicators. For example, Moving Average for Awesome Oscillator can be drawn, and a signal line can beobtained additionally to AO in this way. To do so, one has to draw AO indicator first, and then, using Drag`n Drop technique, impose MAinto AO and select "Previous Indicator Data" option in its settings in the "Apply to" option. If the "First Indicator Data" option is selected,MA will be drawn on basis of data of the very first imposed indicator that can be other than AO.
Besides analytical parameters, one can set colors for various elements, thickness of lines, and sizes of signs used, at setting up of theindicator. Moreover, the visualization mode of the object for different timeframes can be changed in the "Visualization" tab. At that,indicator will be shown on at timeframes that have been selected. This function can be useful if the tool has different settings fordifferent timeframes. Using the "Show in the Data Window" option in the same tab, one can control over visualization of informationabout indicators in the "Data Window".
All settings can be changed. To do so, one has to select the desired indicator in the "Indicators List" window and press the "Edit" buttonor execute the "Properties..." command of the indicator context menu. Indicator context menu can be called by clicking with the rightmouse button on a line, sign, or diagram of the desired indicator. To remove an indicator, one has to execute the "Delete Indicator"indicator context menu command or the "Delete Indicator Window" command in the chart or indicator context menus. The "DeleteIndicator Window" command closes the indicator window.
Attention: Having placed cursor near a line, a sign, or a column border of an indicator histogram, one can determine precise valueof this given indicator in this point.
Accelerator/Decelerator OscillatorAcceleration/Deceleration Technical Indicator (AC) measures acceleration and deceleration of the current driving force. This indicatorwill change direction before any changes in the driving force, which, it its turn, will change its direction before the price. If you realizethat Acceleration/Deceleration is a signal of an earlier warning, it gives you evident advantages.
The nought line is basically the spot where the driving force is at balance with the acceleration. If Acceleration/Deceleration is higherthan nought, then it is usually easier for the acceleration to continue the upward movement (and vice versa in cases when it is belownought). Unlike in case with Awesome Oscillator, it is not regarded as a signal when the nought line is crossed. The only thing thatneeds to be done to control the market and make decisions is to watch for changes in color. To save yourself serious reflections, youmust remember: you can not buy with the help of Acceleration/Deceleration, when the current column is colored red, and you can notsell, when the current column is colored green.
If you enter the market in the direction of the driving force (the indicator is higher than nought, when buying, or it is lower thannought, when selling), then you need only two green columns to buy (two red columns to sell). If the driving force is directed against theposition to be opened (indicator below nought for buying, or higher than nought for selling), a confirmation is needed, hence, anadditional column is required. In this case the indicator is to show three red columns over the nought line for a short position and threegreen columns below the nought line for a long position.
CalculationAC bar chart is the difference between the value of 5/34 of the driving force bar chart and 5-period simple moving average, taken fromthat bar chart.
Accumulation/DistributionAccumulation/Distribution Technical Indicator is determined by the changes in price and volume. The volume acts as a weightingcoefficient at the change of price — the higher the coefficient (the volume) is, the greater the contribution of the price change (for thisperiod of time) will be in the value of the indicator.
In fact, this indicator is a variant of the more commonly used indicator On Balance Volume. They are both used to confirm price changesby means of measuring the respective volume of sales.
When the Accumulation/Distribution indicator grows, it means accumulation (buying) of a particular security, as the overwhelming shareof the sales volume is related to an upward trend of prices. When the indicator drops, it means distribution (selling) of the security, asmost of sales take place during the downward price movement.
Divergences between the Accumulation/Distribution indicator and the price of the security indicate the upcoming change of prices. As arule, in case of such divergences, the price tendency moves in the direction in which the indicator moves. Thus, if the indicator isgrowing, and the price of the security is dropping, a turnaround of price should be expected.
CalculationA certain share of the daily volume is added to or subtracted from the current accumulated value of the indicator. The nearer the closingprice to the maximum price of the day is, the higher the added share will be. The nearer the closing price to the minimum price of theday is, the greater the subtracted share will be. If the closing price is exactly in between the maximum and minimum of the day, theindicator value remains unchanged.
Where:CLOSE — the close price;LOW — the minimum price of the bar;HIGH — the maximum price of the bar;N — the quantity of periods used in the calculation.SUM (..., N) — the sum for N periods;VOLUME — the volume.
Alligator"Most of the time the market remains stationary. Only for some 15–30% of time the market generates trends, and traders who are notlocated in the exchange itself derive most of their profits from the trends. My Grandfather used to repeat: "Even a blind chicken willfind its corns, if it is always fed at the same time". We call the trade on the trend "a blind chicken market". It took us years, but wehave produced an indicator, that lets us always keep our powder dry until we reach the blind chicken market"
Bill Williams
In principle, Alligator Technical Indicator is a combination of Balance Lines (Moving Averages) that use fractal geometry and nonlineardynamics.· The blue line (Alligator’s Jaw) is the Balance Line for the timeframe that was used to build the chart (13-period Smoothed Moving
Average, moved into the future by 8 bars);· The red line (Alligator’s Teeth) is the Balance Line for the value timeframe of one level lower (8-period Smoothed Moving Average,
moved by 5 bars into the future);· The green line (Alligator’s Lips) is the Balance Line for the value timeframe, one more level lower (5-period Smoothed Moving
Average, moved by 3 bars into the future).
Lips, Teeth and Jaw of the Alligator show the interaction of different time periods. As clear trends can be seen only 15 to 30 per cent ofthe time, it is essential to follow them and refrain from working on markets that fluctuate only within certain price periods.
When the Jaw, the Teeth and the Lips are closed or intertwined, it means the Alligator is going to sleep or is asleep already. As it sleeps,it gets hungrier and hungrier — the longer it will sleep, the hungrier it will wake up. The first thing it does after it wakes up is to openits mouth and yawn. Then the smell of food comes to its nostrils: flesh of a bull or flesh of a bear, and the Alligator starts to hunt it.Having eaten enough to feel quite full, the Alligator starts to lose the interest to the food/price (Balance Lines join together) — this isthe time to fix the profit.
CalculationMEDIAN PRICE = (HIGH + LOW) / 2
ALLIGATORS JAW = SMMA (MEDEAN PRICE, 13, 8)
ALLIGATORS TEETH = SMMA (MEDEAN PRICE, 8, 5)
ALLIGATORS LIPS = SMMA (MEDEAN PRICE, 5, 3)
where:MEDIAN PRICE — median price;HIGH — the highest price of the bar;LOW — the lowest price of the bar;SMMA (A, B, C) — smoothed moving average. A parameter is for data to be smoothed, B is the smoothing period, C is shift to future.For example, SMMA (MEDIAN PRICE, 5, 3) means that the smoothed moving average will be calculated on the median price, smoothingperiod being equal to 5 bars and shift being 3;ALLIGATORS JAW — Alligator's jaws (blue line);ALLIGATORS TEETH — Alligator's teeth (red line);ALLIGATORS LIPS — Alligator's lips (green line).
80 / 164
Client Terminal / Analytics / Technical Indicators / Average Directional Movement Index
Average Directional Movement IndexAverage Directional Movement Index Technical Indicator (ADX) helps to determine if there is a price trend. It was developed anddescribed in detail by Welles Wilder in his book "New concepts in technical trading systems".
The simplest trading method based on the system of directional movement implies comparison of two direction indicators: the 14-period +DI one and the 14-period -DI. To do this, one either puts the charts of indicators one on top of the other, or +DI is subtractedfrom -DI. W. Wilder recommends buying when +DI is higher than -DI, and selling when +DI sinks lower than -DI.
To these simple commercial rules Wells Wilder added "a rule of points of extremum". It is used to eliminate false signals and decreasethe number of deals. According to the principle of points of extremum, the "point of extremum" is the point when +DI and -DI cross eachother. If +DI raises higher than -DI, this point will be the maximum price of the day when they cross. If +DI is lower than -DI, this pointwill be the minimum price of the day they cross.
The point of extremum is used then as the market entry level. Thus, after the signal to buy (+DI is higher than -DI) one must wait tillthe price has exceeded the point of extremum, and only then buy. However, if the price fails to exceed the level of the point ofextremum, one should retain the short position.
Where:N — the number of periods used in the calculation.
81 / 164
Client Terminal / Analytics / Technical Indicators / Average True Range
Average True RangeAverage True Range Technical Indicator (ATR) is an indicator that shows volatility of the market. It was introduced by Welles Wilder inhis book "New concepts in technical trading systems". This indicator has been used as a component of numerous other indicators andtrading systems ever since.
Average True Range can often reach a high value at the bottom of the market after a sheer fall in prices occasioned by panic selling.Low values of the indicator are typical for the periods of sideways movement of long duration which happen at the top of the marketand during consolidation. Average True Range can be interpreted according to the same principles as other volatility indicators. Theprinciple of forecasting based on this indicator can be worded the following way: the higher the value of the indicator, the higher theprobability of a trend change; the lower the indicator’s value, the weaker the trend’s movement is.
CalculationTrue Range is the greatest of the following three values:· difference between the current maximum and minimum (high and low);
· difference between the previous closing price and the current maximum;
· difference between the previous closing price and the current minimum.
The indicator of Average True Range is a moving average of values of the true range.
Awesome OscillatorAwesome Oscillator Technical Indicator (AO) is a 34-period simple moving average, plotted through the middle points of the bars(H+L)/2, which is subtracted from the 5-period simple moving average, built across the central points of the bars (H+L)/2. It shows usquite clearly what’s happening to the market driving force at the present moment.
Signals to buy
Saucer
This is the only signal to buy that comes when the bar chart is higher than the nought line. One must bear in mind:· the saucer signal is generated when the bar chart reversed its direction from the downward to upward. The second column is lower
than the first one and is colored red. The third column is higher than the second and is colored green.· for the saucer signal to be generated the bar chart should have at least three columns.
Keep in mind, that all Awesome Oscillator columns should be over the nought line for the saucer signal to be used.
Nought line crossing
The signal to buy is generated when the bar chart passes from the area of negative values to that of positive. It comes when the barchart crosses the nought line. As regards this signal:· for this signal to be generated, only two columns are necessary;· the first column is to be below the nought line, the second one is to cross it (transition from a negative value to a positive one);· simultaneous generation of signals to buy and to sell is impossible.
Two pikes
This is the only signal to buy that can be generated when the bar chart values are below the nought line. As regards this signal, please,bear in mind:· the signal is generated, when you have a pike pointing down (the lowest minimum) which is below the nought line and is followed by
another down-pointing pike which is somewhat higher (a negative figure with a lesser absolute value, which is therefore closer to thenought line), than the previous down-looking pike.
· the bar chart is to be below the nought line between the two pikes. If the bar chart crosses the nought line in the section between thepikes, the signal to buy doesn’t function. However, a different signal to buy will be generated — nought line crossing.
· each new pike of the bar chart is to be higher (a negative number of a lesser absolute value that is closer to the nought line) than theprevious pike.
· if an additional higher pike is formed (that is closer to the nought line) and the bar chart has not crossed the nought line, anadditional signal to buy will be generated.
Signals to sellAwesome Oscillator signals to sell are identical to the signals to buy. The saucer signal is reversed and is below zero. Nought linecrossing is on the decrease — the first column of it is over the nought, the second one is under it. The two pikes signal is higher thanthe nought line and is reversed too.
CalculationAO is a 34-period simple moving average, plotted through the central points of the bars (H+L)/2, and subtracted from the 5-periodsimple moving average, graphed across the central points of the bars (H+L)/2.
MEDIAN PRICE = (HIGH+LOW)/2
AO = SMA(MEDIAN PRICE, 5)-SMA(MEDIAN PRICE, 34)
Where:SMA — Simple Moving Average.
83 / 164
Client Terminal / Analytics / Technical Indicators / Bears Power
Bears PowerEveryday trading represents a battle of buyers ("Bulls") pushing prices up and sellers ("Bears") pushing prices down. Depending on whatparty scores off, the day will end with a price that is higher or lower than that of the previous day. Intermediate results, first of all thehighest and lowest price, allow to judge about how the battle was developing during the day.
It is very important to be able to estimate the Bears Power balance since changes in this balance initially signalize about possible trendreversal. This task can be solved using the Bears Power oscillator developed by Alexander Elder and and described in his book titledTrading for a Living. Elder based on the following premises when deducing this oscillator:· moving average is a price agreement between sellers and buyers for a certain period of time,· the lowest price displays the maximum sellers' power within the day.
On these premises, Elder developed Bears Power as the difference between the lowest price and 13-period exponential moving average(LOW - EMA).
ApplicationThis indicator is better to use together with a trand indicator (most frequently Moving Average):§ if trend indicator is up-directed and the Bears Power index is below zero, but growing, it is a signal to buy;§ it is desirable that, in this case, the divergence of bases were being formed in the indicator chart.
CalculationThe first stage of this indicator calculation is calculation of the exponential moving average (as a rule, it is recommended to use the 13-period EMA).
BEARS = LOW - EMA
Where:BEARS — Bears Power;LOW — the lowest price of the current bar;EMA — exponential moving average.
In the down-trend, LOW is lower than EMA, so the Bears Power is below zero and histogram is located below zero line. If LOW risesabove EMA when prices grow, the Bears Power becomes above zero and its histogram rises above zero line.
Bollinger Bands®Bollinger Bands Technical Indicator (BB) is similar to Envelopes. The only difference is that the bands of Envelopes are plotted a fixeddistance (%) away from the moving average, while the Bollinger Bands are plotted a certain number of standard deviations away from it.Standard deviation is a measure of volatility, therefore Bollinger Bands adjust themselves to the market conditions. When the marketsbecome more volatile, the bands widen and they contract during less volatile periods.
Bollinger Bands are usually plotted on the price chart, but they can be also added to the indicator chart (Custom Indicators). Just like incase of the Envelopes, the interpretation of the Bollinger Bands is based on the fact that the prices tend to remain in between the topand the bottom line of the bands. A distinctive feature of the Bollinger Band indicator is its variable width due to the volatility of prices.In periods of considerable price changes (i.e. of high volatility) the bands widen leaving a lot of room to the prices to move in. Duringstandstill periods, or the periods of low volatility the band contracts keeping the prices within their limits.
The following traits are particular to the Bollinger Band:1. abrupt changes in prices tend to happen after the band has contracted due to decrease of volatility.2. if prices break through the upper band, a continuation of the current trend is to be expected.3. if the pikes and hollows outside the band are followed by pikes and hollows inside the band, a reverse of trend may occur.4. the price movement that has started from one of the band’s lines usually reaches the opposite one. The last observation is useful for
forecasting price guideposts.
CalculationBollinger bands are formed by three lines. The middle line (ML) is a usual Moving Average.
ML = SUM [CLOSE, N]/N
The top line, TL, is the same as the middle line a certain number of standard deviations (D) higher than the ML.
TL = ML + (D*StdDev)
The bottom line (BL) is the middle line shifted down by the same number of standard deviations.
BL = ML — (D*StdDev)
Where:N — is the number of periods used in calculation;SMA — Simple Moving Average;StdDev — means Standard Deviation.StdDev = SQRT(SUM[(CLOSE — SMA(CLOSE, N))^2, N]/N)
It is recommended to use 20-period Simple Moving Average as the middle line, and plot top and bottom lines two standard deviationsaway from it. Besides, moving averages of less than 10 periods are of little effect.
85 / 164
Client Terminal / Analytics / Technical Indicators / Bulls Power
Bulls PowerEveryday trading represents a battle of buyers ("Bulls") pushing prices up and sellers ("Bears") pushing prices down. Depending on whatparty scores off, the day will end with a price that is higher or lower than that of the previous day. Intermediate results, first of all thehighest and lowest price, allow to judge about how the battle was developing during the day.
It is very important to be able to estimate the Bulls Power balance since changes in this balance initially signalize about possible trendreversal. This task can be solved using the Bulls Power oscillator developed by Alexander Elder and and described in his book titledTrading for a Living. Elder based on the following premises when deducing this oscillator:§ moving average is a price agreement between sellers and buyers for a certain period of time,§ the highest price displays the maximum buyers' power within the day.
On these premises, Elder developed Bulls Power as the difference between the highest price and 13-period exponential moving average(HIGH - EMA).
ApplicationThis indicator is better to use together with a trand indicator (most frequently Moving Average):§ if trend indicator is down-directed and the Bulls Power index is above zero, but falling, it is a signal to sell;§ it is desirable that, in this case, the divergence of peaks were being formed in the indicator chart.
CalculationThe first stage of this indicator calculation is calculation of the exponential moving average (as a rule, it is recommended to use the 13-period EMA).
BULLS = HIGH - EMA
Where:BULLS — Bulls Power;HIGH — the highest price of the current bar;EMA — exponential moving average..
In the up-trend, HIGH is higher than EMA, so the Bulls Power is above zero and histogram is located above zero line. If HIGH falls underEMA when prices fall, the Bulls Power becomes below zero and its histogram falls under zero line.
Commodity Channel IndexCommodity Channel Index Technical Indicator (CCI) measures the deviation of the commodity price from its average statistical price.High values of the index point out that the price is unusually high being compared with the average one, and low values show that theprice is too low. In spite of its name, the Commodity Channel Index can be applied for any financial instrument, and not only for thewares.
There are two basic techniques of using Commodity Channel Index:1.Finding the divergences
The divergence appears when the price reaches a new maximum, and Commodity Channel Index can not grow above the previousmaximums. This classical divergence is normally followed by the price correction.
2.As an indicator of overbuying/oversellingCommodity Channel Index usually varies in the range of ±100. Values above +100 inform about overbuying state (and about aprobability of correcting decay), and the values below 100 inform about the overselling state (and about a probability of correctingincrease).
Calculation1. To find a Typical Price. You need to add the HIGH, the LOW, and the CLOSE prices of each bar and then divide the result by 3.
TP = (HIGH + LOW +CLOSE)/32. To calculate the n-period Simple Moving Average of typical prices.
SMA(TP, N) = SUM[TP, N]/N3. To subtract the received SMA(TP, N) from Typical Prices.
D = TP — SMA(TP, N)4. To calculate the n-period Simple Moving Average of absolute D values.
SMA(D, N) = SUM[D, N]/N5. To multiply the received SMA(D, N) by 0,015.
M = SMA(D, N) * 0,015
6. To divide M by D
CCI = M/D
Where:SMA — Simple Moving Average;N — number of periods, used for calculation.
DeMarkerDemarker Technical Indicator is based on the comparison of the period maximum with the previous period maximum. If the currentperiod (bar) maximum is higher, the respective difference between the two will be registered. If the current maximum is lower orequaling the maximum of the previous period, the naught value will be registered. The differences received for N periods are thensummarized. The received value is used as the numerator of the DeMarker and will be divided by the same value plus the sum ofdifferences between the price minima of the previous and the current periods (bars). If the current price minimum is greater than thatof the previous bar, the naught value will be registered.
When the indicator falls below 30, the bullish price reversal should be expected. When the indicator rises above 70, the bearish pricereversal should be expected.
If you use periods of longer duration, when calculating the indicator, you’ll be able to catch the long term market tendency. Indicatorsbased on short periods let you enter the market at the point of the least risk and plan the time of transaction so that it falls in with themajor trend.
CalculationThe value of the DeMarker for the "i" interval is calculated as follows:· The DeMax(i) is calculated:
If high(i) > high(i-1) , then DeMax(i) = high(i)-high(i-1), otherwise DeMax(i) = 0· The DeMin(i) is calculated:
If low(i) < low(i-1), then DeMin(i) = low(i-1)-low(i), otherwise DeMin(i) = 0· The value of the DeMarker is calculated as:
EnvelopesEnvelopes Technical Indicator is formed with two Moving Averages one of which is shifted upward and another one is shifted downward.The selection of optimum relative number of band margins shifting is determined with the market volatility: the higher the latter is, thestronger the shift is.
Envelopes define the upper and the lower margins of the price range. Signal to sell appears when the price reaches the upper margin ofthe band; signal to buy appears when the price reaches the lower margin.
The logic behind envelopes is that overzealous buyers and sellers push the price to the extremes (i.e., the upper and lower bands), atwhich point the prices often stabilize by moving to more realistic levels. This is similar to the interpretation of Bollinger Bands®.
CalculationUpper Band = SMA(CLOSE, N)*[1+K/1000]
Lower Band = SMA(CLOSE, N)*[1-K/1000]
Where:SMA — Simple Moving Average;N — averaging period;K/1000 — the value of shifting from the average (measured in basis points).
89 / 164
Client Terminal / Analytics / Technical Indicators / Force Index
Force IndexForce Index Technical Indicator was developed by Alexander Elder. This index measures the Bulls Power at each increase, and the BullsPower at each decrease. It connects the basic elements of market information: price trend, its drops, and volumes of transactions. Thisindex can be used as it is, but it is better to approximate it with the help of Moving Average. Approximation with the help a shortmoving average (the author proposes to use 2 intervals) contributes to finding the best opportunity to open and close positions. If theapproximations is made with long moving average (period 13), the index shows the trends and their changes.· It is better to buy when the forces become minus (fall below zero) in the period of indicator increasing tendency;· The force index signalizes the continuation of the increasing tendency when it increases to the new peak;· The signal to sell comes when the index becomes positive during the decreasing tendency;· The force index signalizes the Bears Power and continuation of the decreasing tendency when the index falls to the new trough;· If price changes do not correlate to the corresponding changes in volume, the force indicator stays on one level, which tells you the
trend is going to change soon.
CalculationThe force of every market movement is characterized by its direction, scale and volume. If the closing price of the current bar is higherthan the preceding bar, the force is positive. If the current closing price if lower than the preceding one, the force is negative. Thegreater the difference in prices is, the greater the force is. The greater the transaction volume is, the greater the force is.
FORCE INDEX (i) = VOLUME (i) * ((MA (ApPRICE, N, i) - MA (ApPRICE, N, i-1))
where:FORCE INDEX (i) — Force Index of the current bar;VOLUME (i) — volume of the current bar;MA (ApPRICE, N, i) — any Moving Average of the current bar for N period:Simple, Exponential, Weighted or Smoothed;ApPRICE — applied price;N — period of the smoothing;MA (ApPRICE, N, i-1) — any Moving Average of the previous bar.
FractalsAll markets are characterized by the fact that on the most part the prices do not change too much, and only short periods of time (15–30percent) account for trend changes. Most lucrative periods are usually the case when market prices change according to a certain trend.
A Fractal is one of five indicators of Bill Williams’ trading system, which allows to detect the bottom or the top.
Fractal Technical Indicator it is a series of at least five successive bars, with the highest HIGH in the middle, and two lower HIGHs onboth sides. The reversing set is a series of at least five successive bars, with the lowest LOW in the middle, and two higher LOWs onboth sides, which correlates to the sell fractal. The fractals are have High and Low values and are indicated with the up and downarrows.
The fractal needs to be filtrated with the use of Alligator. In other words, you should not close a buy transaction, if the fractal is lowerthan the Alligator’s Teeth, and you should not close a sell transaction, if the fractal is higher than the Alligator’s Teeth. After the fractalsignal has been created and is in force, which is determined by its position beyond the Alligator’s Mouth, it remains a signal until it getsattacked, or until a more recent fractal signal emerges.
Gator OscillatorGator Oscillator is based on the Alligator and shows the degree of convergence/divergence of the Balance Lines (Smoothed MovingAverages). The top bar chart is the absolute difference between the values of the blue and the red lines. The bottom bar chart is theabsolute difference between the values of the red line and the green line, but with the minus sign, as the bar chart is drawn top-down.
CalculationMEDIAN PRICE = (HIGH + LOW) / 2
ALLIGATORS JAW = SMMA (MEDIAN PRICE, 13, 8)
ALLIGATORS TEETH = SMMA (MEDIAN PRICE, 8, 5)
ALLIGATORS LIPS = SMMA (MEDIAN PRICE, 5, 3)
Where:
MEDIAN PRICE — median price;HIGH — maximum price;LOW — minimum price;SMMA (A, B, C) — smoothed moving average. Parameter À — smoothed data, Â — smoothing period, Ñ — shift to future. For example,SMMA (MEDIAN PRICE, 5, 3) means that the smoothed moving average is taken from the median price, while the smoothing period isequal to 5 bars, and the shift is equal to 3 bars;ALLIGATORS JAW — the blue line;ALLIGATORS TEETH — the green line;ALLIGATORS LIPS — the red line.
Ichimoku Kinko HyoIchimoku Kinko Hyo Technical Indicator is predefined to characterize the market Trend, Support and Resistance Levels, and to generatesignals of buying and selling. This indicator works best at weekly and daily charts.
When defining the dimension of parameters, four time intervals of different length are used. The values of individual lines composingthis indicator are based on these intervals:· Tenkan-sen shows the average price value during the first time interval defined as the sum of maximum and minimum within this
time, divided by two;· Kijun-sen shows the average price value during the second time interval;· Senkou Span A shows the middle of the distance between two previous lines shifted forwards by the value of the second time interval;· Senkou Span B shows the average price value during the third time interval shifted forwards by the value of the second time interval.
Chinkou Span shows the closing price of the current candle shifted backwards by the value of the second time interval. The distancebetween the Senkou lines is hatched with another color and called "cloud". If the price is between these lines, the market should beconsidered as non-trend, and then the cloud margins form the support and resistance levels.§ If the price is above the cloud, its upper line forms the first support level, and the second line forms the second support level;§ If the price is below cloud, the lower line forms the first resistance level, and the upper one forms the second level;§ If the Chinkou Span line traverses the price chart in the bottom-up direction it is signal to buy. If the Chinkou Span line traverses the
price chart in the top-down direction it is signal to sell.
Kijun-sen is used as an indicator of the market movement. If the price is higher than this indicator, the prices will probably continue toincrease. When the price traverses this line the further trend changing is possible. Another kind of using the Kijun-sen is giving signals.Signal to buy is generated when the Tenkan-sen line traverses the Kijun-sen in the bottom-up direction. Top-down direction is the signalto sell. Tenkan-sen is used as an indicator of the market trend. If this line increases or decreases, the trend exists. When it goeshorizontally, it means that the market has come into the channel.
Market Facilitation IndexMarket Facilitation Index Technical Indicator (BW MFI) is the indicator which shows the change of price for one tick. Absolute values ofthe indicator do not mean anything as they are, only indicator changes have sense. Bill Williams emphasizes the interchanging of MFIand volume:· Market Facilitation Index increases and volume increases — this points out that: a) the number of players coming into the market
increases (volume increases) b) the new coming players open positions in the direction of bar development, i.e., the movement hasbegun and picks up speed;
· Market Facilitation Index falls and volume falls. It means the market participants are not interested anymore;· Market Facilitation Index increases, but the volume falls. It is most likely, that the market is not supported with the volume from
clients, and the price is changing due to traders’ (brokers and dealers) "on the floor" speculations;· Market Facilitation Index falls, but the volume increases. There is a battle between bulls and bears, characterized by a large sell and
buy volume, but the price is not changing significantly since the forces are equal. One of the contending parties (buyers vs. sellers)will eventually win the battle. Usually, the break of such a bar lets you know if this bar determines the continuation of the trend orannuls the trend. Bill Williams calls such bar "curtsying".
Calculation
To calculate Market Facilitation Index you need to subtract the lowest bar price from the highest bar price and divide it by the volume.
BW MFI = RANGE*(HIGH-LOW)/VOLUME
Where:RANGE — is the multiplication factor, which brings the difference in points down to whole numbers.
MomentumThe Momentum Technical Indicator measures the amount that a security’s price has changed over a given time span.
There are basically two ways to use the Momentum indicator:§ You can use the Momentum indicator as a trend-following oscillator similar to the Moving Average Convergence/Divergence (MACD).
Buy when the indicator bottoms and turns up and sell when the indicator peaks and turns down. You may want to plot a short-termmoving average of the indicator to determine when it is bottoming or peaking.If the Momentum indicator reaches extremely high or low values (relative to its historical values), you should assume a continuationof the current trend. For example, if the Momentum indicator reaches extremely high values and then turns down, you should assumeprices will probably go still higher. In either case, only trade after prices confirm the signal generated by the indicator (for example, ifprices peak and turn down, wait for prices to begin to fall before selling).
§ You can also use the Momentum indicator as a leading indicator. This method assumes that market tops are typically identified by arapid price increase (when everyone expects prices to go higher) and that market bottoms typically end with rapid price declines(when everyone wants to get out). This is often the case, but it is also a broad generalization.
As a market peaks, the Momentum indicator will climb sharply and then fall off — diverging from the continued upward or sidewaysmovement of the price. Similarly, at a market bottom, Momentum will drop sharply and then begin to climb well ahead of prices. Both ofthese situations result in divergences between the indicator and prices.
CalculationMomentum is calculated as a ratio of today’s price to the price several (N) periods ago.
MOMENTUM = CLOSE(i)/CLOSE(i-N)*100
Where:CLOSE(i) — is the closing price of the current bar;CLOSE(i-N) — is the closing bar price N periods ago.
Money Flow IndexMoney Flow Index (MFI) is the technical indicator, which indicates the rate at which money is invested into a security and thenwithdrawn from it. Construction and interpretation of the indicator is similar to Relative Strength Index with the only difference thatvolume is important to MFI.
When analyzing the money flow index one needs to take into consideration the following points:· divergences between the indicator and price movement. If prices grow while MFI falls (or vice versa), there is a great probability of a
price turn;· Money Flow Index value, which is over 80 or under 20, signals correspondingly of a potential peak or bottom of the market.
CalculationThe calculation of Money Flow Index includes several stages. At first one defines the typical price (TP) of the period in question.
TP = (HIGH + LOW + CLOSE)/3
Then one calculates the amount of the Money Flow (MF):
MF = TP * VOLUME
If today’s typical price is larger than yesterday’s TP, then the money flow is considered positive. If today’s typical price is lower than thatof yesterday, the money flow is considered negative.
A positive money flow is a sum of positive money flows for a selected period of time. A negative money flow is the sum of negativemoney flows for a selected period of time.
Then one calculates the money ratio (MR) by dividing the positive money flow by the negative money flow:
And finally, one calculates the money flow index using the money ratio:
MFI = 100 - (100 / (1 + MR))
96 / 164
Client Terminal / Analytics / Technical Indicators / Moving Average
Moving AverageThe Moving Average Technical Indicator shows the mean instrument price value for a certain period of time. When one calculates themoving average, one averages out the instrument price for this time period. As the price changes, its moving average either increases,or decreases.
There are four different types of moving averages: Simple (also referred to as Arithmetic), Exponential, Smoothed and LinearWeighted. Moving averages may be calculated for any sequential data set, including opening and closing prices, highest and lowestprices, trading volume or any other indicators. It is often the case when double moving averages are used.
The only thing where moving averages of different types diverge considerably from each other, is when weight coefficients, which areassigned to the latest data, are different. In case we are talking of simple moving average, all prices of the time period in question, areequal in value. Exponential and Linear Weighted Moving Averages attach more value to the latest prices.
The most common way to interpreting the price moving average is to compare its dynamics to the price action. When the instrumentprice rises above its moving average, a buy signal appears, if the price falls below its moving average, what we have is a sell signal.
This trading system, which is based on the moving average, is not designed to provide entrance into the market right in its lowestpoint, and its exit right on the peak. It allows to act according to the following trend: to buy soon after the prices reach the bottom, andto sell soon after the prices have reached their peak.
Moving averages may also be applied to indicators. That is where the interpretation of indicator moving averages is similar to theinterpretation of price moving averages: if the indicator rises above its moving average, that means that the ascending indicatormovement is likely to continue: if the indicator falls below its moving average, this means that it is likely to continue going downward.
Here are the types of moving averages on the chart:· Simple Moving Average (SMA)· Exponential Moving Average (EMA)· Smoothed Moving Average (SMMA)· Linear Weighted Moving Average (LWMA)
Calculation
Simple Moving Average (SMA)
Simple, in other words, arithmetical moving average is calculated by summing up the prices of instrument closure over a certain numberof single periods (for instance, 12 hours). This value is then divided by the number of such periods.
SMA = SUM(CLOSE, N) / N
Where:N — is the number of calculation periods.
Exponential Moving Average (EMA)
Exponentially smoothed moving average is calculated by adding the moving average of a certain share of the current closing price to theprevious value. With exponentially smoothed moving averages, the latest prices are of more value. P-percent exponential movingaverage will look like:
EMA = (CLOSE(i) * P) + (EMA(i - 1) * (100 - P))
Where:CLOSE(i) — the price of the current period closure;EMA(i-1) — Exponentially Moving Average of the previous period closure;P — the percentage of using the price value.
Smoothed Moving Average (SMMA)
The first value of this smoothed moving average is calculated as the simple moving average (SMA):
SUM1 = SUM(CLOSE, N)
SMMA1 = SUM1/N
The second and succeeding moving averages are calculated according to this formula:
PREVSUM = SMMA(i - 1) * N
97 / 164
SMMA(i) = (PREVSUM - SMMA(i - 1) + CLOSE(i)) / N
Where:SUM1 — is the total sum of closing prices for N periods;PREVSUM — smoothed sum of previous bar;SMMA1 — is the smoothed moving average of the first bar;SMMA(i) — is the smoothed moving average of the current bar (except for the first one);CLOSE(i) — is the current closing price;N — is the smoothing period.
The formula can be simplified as a result of arithmetic manipulations:
SMMA (i) = (SMMA(i - 1) * (N - 1) + CLOSE (i)) / N
Linear Weighted Moving Average (LWMA)
In the case of weighted moving average, the latest data is of more value than more early data. Weighted moving average is calculatedby multiplying each one of the closing prices within the considered series, by a certain weight coefficient.
LWMA = SUM(Close(i)*i, N) / SUM(i, N)
Where:SUM(i, N) — is the total sum of weight coefficients.
Moving Average Convergence/DivergenceMoving Average Convergence/Divergence is the next trend-following dynamic indicator. It indicates the correlation between two pricemoving averages.
The Moving Average Convergence/Divergence Technical Indicator is the difference between a 26-period and 12-period ExponentialMoving Average (EMA). In order to clearly show buy/sell opportunities, a so-called signal line (9-period indicators moving average) isplotted on the MACD chart.
The MACD proves most effective in wide-swinging trading markets. There are three popular ways to use the Moving AverageConvergence/Divergence: crossovers, overbought/oversold conditions, and divergences.
CrossoversThe basic MACD trading rule is to sell when the MACD falls below its signal line. Similarly, a buy signal occurs when the Moving AverageConvergence/Divergence rises above its signal line. It is also popular to buy/sell when the MACD goes above/below zero.
Overbought/oversold conditionsThe MACD is also useful as an overbought/oversold indicator. When the shorter moving average pulls away dramatically from the longermoving average (i.e., the MACD rises), it is likely that the security price is overextending and will soon return to more realistic levels.
DivergenceAn indication that an end to the current trend may be near occurs when the MACD diverges from the security. A bullish divergence occurswhen the Moving Average Convergence/Divergence indicator is making new highs while prices fail to reach new highs. A bearishdivergence occurs when the MACD is making new lows while prices fail to reach new lows. Both of these divergences are mostsignificant when they occur at relatively overbought/oversold levels.
CalculationThe MACD is calculated by subtracting the value of a 26-period exponential moving average from a 12-period exponential movingaverage. A 9-period dotted simple moving average of the MACD (the signal line) is then plotted on top of the MACD.
MACD = EMA(CLOSE, 12)-EMA(CLOSE, 26)
SIGNAL = SMA(MACD, 9)
Where:EMA — the Exponential Moving Average;SMA — the Simple Moving Average;SIGNAL — the signal line of the indicator.
99 / 164
Client Terminal / Analytics / Technical Indicators / Moving Average of Oscillator
Moving Average of OscillatorMoving Average of Oscillator is the difference between the oscillator and oscillator smoothing. In this case, Moving AverageConvergence/Divergence base-line is used as the oscillator, and the signal line is used as the smoothing.
On Balance VolumeOn Balance Volume Technical Indicator (OBV) is a momentum technical indicator that relates volume to price change. The indicator,which Joseph Granville came up with, is pretty simple. When the security closes higher than the previous close, all of the day’s volumeis considered up-volume. When the security closes lower than the previous close, all of the day’s volume is considered down-volume.
The basic assumption, regarding On Balance Volume analysis, is that OBV changes precede price changes. The theory is that smartmoney can be seen flowing into the security by a rising OBV. When the public then moves into the security, both the security and the OnBalance Volume will surge ahead.
If the security’s price movement precedes OBV movement, a "non-confirmation" has occurred. Non-confirmations can occur at bullmarket tops (when the security rises without, or before, the OBV) or at bear market bottoms (when the security falls without, or before,the On Balance Volume Technical Indicator).
The OBV is in a rising trend when each new peak is higher than the previous peak and each new trough is higher than the previoustrough. Likewise, the On Balance Volume is in a falling trend when each successive peak is lower than the previous peak and eachsuccessive trough is lower than the previous trough. When the OBV is moving sideways and is not making successive highs and lows, itis in a doubtful trend.
Once a trend is established, it remains in force until it is broken. There are two ways in which the On Balance Volume trend can bebroken. The first occurs when the trend changes from a rising trend to a falling trend, or from a falling trend to a rising trend.
The second way the OBV trend can be broken is if the trend changes to a doubtful trend and remains doubtful for more than three days.Thus, if the security changes from a rising trend to a doubtful trend and remains doubtful for only two days before changing back to arising trend, the On Balance Volume is considered to have always been in a rising trend.
When the OBV changes to a rising or falling trend, a "breakout" has occurred. Since OBV breakouts normally precede price breakouts,investors should buy long on On Balance Volume upside breakouts. Likewise, investors should sell short when the OBV makes a downsidebreakout. Positions should be held until the trend changes.
Calculation
If today’s close is greater than yesterday’s close then: OBV(i) = OBV(i-1)+VOLUME(i)
If today’s close is less than yesterday’s close then: OBV(i) = OBV(i-1)-VOLUME(i)
If today’s close is equal to yesterday’s close then: OBV(i) = OBV(i-1)
Where:
OBV(i) — is the indicator value of the current period;OBV(i-1) — is the indicator value of the previous period;VOLUME(i) — is the volume of the current bar.
101 / 164
Client Terminal / Analytics / Technical Indicators / Parabolic SAR
Parabolic SARParabolic SAR Technical Indicator was developed for analyzing the trending markets. The indicator is constructed on the price chart. Thisindicator is similar to the Moving Average Technical Indicator with the only difference that Parabolic SAR moves with higher accelerationand may change its position in terms of the price. The indicator is below the prices on the bull market (Up Trend), when it’s bearish(Down Trend), it is above the prices.
If the price crosses Parabolic SAR lines, the indicator turns, and its further values are situated on the other side of the price. When suchan indicator turn does take place, the maximum or the minimum price for the previous period would serve as the starting point. Whenthe indicator makes a turn, it gives a signal of the trend end (correction stage or flat), or of its turn.
The Parabolic SAR is an outstanding indicator for providing exit points. Long positions should be closed when the price sinks below theSAR line, short positions should be closed when the price rises above the SAR line. It is often the case that the indicator serves as atrailing stop line.
If the long position is open (i.e., the price is above the SAR line), the Parabolic SAR line will go up, regardless of what direction theprices take. The length of the SAR line movement depends on the scale of the price movement.
Where:SAR(i-1) — is the value of the indicator on the previous bar;ACCELERATION — is the acceleration factor;EPRICE(i-1) — is the highest (lowest) price for the previous period (EPRICE=HIGH for long positions and EPRICE=LOW for shortpositions).
The indicator value increases if the price of the current bar is higher than previous bullish and vice versa. The acceleration factor(ACCELERATION) will double at the same time, which would cause Parabolic SAR and the price to come together. In other words, thefaster the price grows or sinks, the faster the indicator approaches the price.
Relative Strength IndexThe Relative Strength Index Technical Indicator (RSI) is a price-following oscillator that ranges between 0 and 100. When Wilderintroduced the Relative Strength Index, he recommended using a 14-day RSI. Since then, the 9-day and 25-day Relative Strength Indexindicators have also gained popularity.
A popular method of analyzing the RSI is to look for a divergence in which the security is making a new high, but the RSI is failing tosurpass its previous high. This divergence is an indication of an impending reversal. When the Relative Strength Index then turns downand falls below its most recent trough, it is said to have completed a "failure swing". The failure swing is considered a confirmation ofthe impending reversal.
Ways to use Relative Strength Index for chart analysis:· Tops and bottoms
The Relative Strength Index usually tops above 70 and bottoms below 30. It usually forms these tops and bottoms before theunderlying price chart;
· Chart FormationsThe RSI often forms chart patterns such as head and shoulders or triangles that may or may not be visible on the price chart;
· Failure swing (Support or Resistance penetrations or breakouts)This is where the Relative Strength Index surpasses a previous high (peak) or falls below a recent low (trough);
· Support and Resistance levelsThe Relative Strength Index shows, sometimes more clearly than price themselves, levels of support and resistance.
· DivergencesAs discussed above, divergences occur when the price makes a new high (or low) that is not confirmed by a new high (or low) in theRelative Strength Index. Prices usually correct and move in the direction of the RSI.
CalculationRSI = 100-(100/(1+U/D))
Where:U — is the average number of positive price changes;D — is the average number of negative price changes.
Relative Vigor IndexThe main point of Relative Vigor Index Technical Indicator (RVI) is that on the bull market the closing price is, as a rule, higher, than theopening price. It is the other way round on the bear market. So the idea behind Relative Vigor Index is that the vigor, or energy, of themove is thus established by where the prices end up at the close. To normalize the index to the daily trading range, divide the change ofprice by the maximum range of prices for the day. To make a more smooth calculation, one uses Simple Moving Average. 10 is the bestperiod. To avoid probable ambiguity one needs to construct a signal line, which is a 4-period symmetrically weighted moving average ofRelative Vigor Index values. The concurrence of lines serves as a signal to buy or to sell.
CalculationRVI = (CLOSE-OPEN)/(HIGH-LOW)
Where:
OPEN — is the opening price;HIGH — is the maximum price;LOW — is the minimum price;CLOSE — is the closing price.
104 / 164
Client Terminal / Analytics / Technical Indicators / Standard Deviation
Standard DeviationStandard Deviation — value of the market volatility measurement. This indicator describes the range of price fluctuations relative tosimple moving average. So, if the value of this indicator is high, the market is volatile, and prices of bars are rather spread relative tothe moving average. If the indicator value is low, the market can described as having a low volatility, and prices of bars are rather closeto the moving average.
Normally, this indicator is used as a constituent of other indicators. Thus, when calculating Bollinger Bands®, one has to add the symbolstandard deviation value to its moving average.
The market behavior represents the interchange of high trading activity and languid market. So, the indicator can be interpreted easily:· if its value is too low, i.e., the market is absolutely inactive, it makes sense to expect a spike soon;· otherwise, if it is extremely high, it most probably means that activity will decline soon.
CalculationStdDev = SQRT (SUM ((CLOSE - SMA (CLOSE, N))^2, N)/N)
Where:SQRT — square root;SUM (..., N) — sum within N periods;SMA (..., N) — simple moving average having the period of N;N — calculation period.
Stochastic OscillatorThe Stochastic Oscillator Technical Indicator compares where a security’s price closed relative to its price range over a given timeperiod. The Stochastic Oscillator is displayed as two lines. The main line is called %K. The second line, called %D, is a Moving Average of%K. The %K line is usually displayed as a solid line and the %D line is usually displayed as a dotted line.
There are several ways to interpret a Stochastic Oscillator. Three popular methods include:· Buy when the Oscillator (either %K or %D) falls below a specific level (for example, 20) and then rises above that level. Sell when the
Oscillator rises above a specific level (for example, 80) and then falls below that level;· Buy when the %K line rises above the %D line and sell when the %K line falls below the %D line;· Look for divergences. For instance: where prices are making a series of new highs and the Stochastic Oscillator is failing to surpass
its previous highs.
CalculationThe Stochastic Oscillator has four variables:· %K periods. This is the number of time periods used in the stochastic calculation;· %K Slowing Periods. This value controls the internal smoothing of %K. A value of 1 is considered a fast stochastic; a value of 3 is
considered a slow stochastic;· %D periods. his is the number of time periods used when calculating a moving average of %K;· %D method. The method (i.e., Exponential, Simple, Smoothed, or Weighted) that is used to calculate %D.
The formula for %K is: %K = (CLOSE-LOW(%K))/(HIGH(%K)-LOW(%K))*100
Where:CLOSE — is today’s closing price;LOW(%K) — is the lowest low in %K periods;HIGH(%K) — is the highest high in %K periods.
The %D moving average is calculated according to the formula: %D = SMA(%K, N)
Where:N — is the smoothing period;SMA — is the Simple Moving Average.
Williams' Percent RangeWilliams’ Percent Range Technical Indicator (%R) is a dynamic technical indicator, which determines whether the market isoverbought/oversold. Williams’ %R is very similar to the Stochastic Oscillator. The only difference is that %R has an upside down scaleand the Stochastic Oscillator has internal smoothing.
To show the indicator in this upside down fashion, one places a minus symbol before the Williams Percent Range values (for example -30%). One should ignore the minus symbol when conducting the analysis.
Indicator values ranging between 80 and 100% indicate that the market is oversold. Indicator values ranging between 0 and 20% indicatethat the market is overbought.
As with all overbought/oversold indicators, it is best to wait for the security’s price to change direction before placing your trades. Forexample, if an overbought/oversold indicator is showing an overbought condition, it is wise to wait for the security’s price to turn downbefore selling the security.
An interesting phenomenon of the Williams Percent Range indicator is its uncanny ability to anticipate a reversal in the underlyingsecurity’s price. The indicator almost always forms a peak and turns down a few days before the security’s price peaks and turns down.Likewise, Williams Percent Range usually creates a trough and turns up a few days before the security’s price turns up.
Calculation
Below is the formula of the %R indicator calculation, which is very similar to the Stochastic Oscillator formula:
%R = - (MAX (HIGH (i - n)) - CLOSE (i)) / (MAX (HIGH (i - n)) - MIN (LOW (i - n))) * 100
Where:CLOSE (i) — is today’s closing price;MAX (HIGH(i-n)) — is the highest maximum over a number (n) of previous periods;MIN (LOW(i-n)) — is the lowest minimum over a number (n) of previous periods.
107 / 164
Client Terminal / Trading
TradingThe fundamental and simple rule of profitable trading at financial markets is to buy cheaper and sell dearer. Thus, the entire tradingactivities at financial markets come to the successive operations performed to sell or buy securities. To do so, one has to open, modify,and close trade positions. Trade position is a market commitment (order), the number of bought or sold contracts for which no set-offtransactions have been made. The entire trading in the terminal is implemented through trade positions.
To open a trade position, one has to make a transaction, and to close a position, one has to make an inverse operation. A position canbe opened by a brokerage company at a market order or at execution of a pending order. An open position can be modified if values ofthe Stop Loss and Take Profit orders levels attached to the position are changed. Positions can be closed on the trader's demand or atexecution of Stop Loss or Take Profit orders. Besides, positions can be opened, modified, or closed with an expert advisor — thismechanism is described in another section.
108 / 164
Client Terminal / Trading / Order Types
Order TypesClient terminal allows to prepare requests and request the broker for execut ion of trading operat ions. Moreover, terminal allows to control and
manage open posit ions. For these purposes, several types of trading orders are used. Order is a client 's commitment to brokerage company to perform
a trade operat ion. The follow ing orders are used in the terminal: Market order, Pending order, Stop Loss and Take Profit .
· Market Order
Market order is a commitment to the brokerage company to buy or sell a security at the current price. Execution of this order resultsin opening of a trade position. Securities are bought at ASK price and sold at BID price. Stop Loss and Take Profit orders (describedbelow) can be attached to a market order. Execution mode of market orders depends on security traded.
· Pending OrderPending order is the client's commitment to the brokerage company to buy or sell a security at a pre-defined price in the future. Thistype of orders is used for opening of a trade position provided the future quotes reach the pre-defined level. There are four types ofpending orders available in the terminal:· Buy Limit — buy provided the future "ASK" price is equal to the pre-defined value. The current price level is higher than the value of
the placed order. Orders of this type are usually placed in anticipation of that the security price, having fallen to a certain level, willincrease;
· Buy Stop — buy provided the future "ASK" price is equal to the pre-defined value. The current price level is lower than the value ofthe placed order. Orders of this type are usually placed in anticipation of that the security price, having reached a certain level, willkeep on increasing;
· Sell Limit — sell provided the future "BID" price is equal to the pre-defined value. The current price level is lower than the value ofthe placed order. Orders of this type are usually placed in anticipation of that the security price, having increased to a certain level,will fall;
· Sell Stop — sell provided the future "BID" price is equal to the pre-defined value. The current price level is higher than the value ofthe placed order. Orders of this type are usually placed in anticipation of that the security price, having reached a certain level, willkeep on falling.
Orders of Stop Loss and Take Profit can be attached to a pending order. After a pending order has triggered, its Stop Loss and TakeProfit levels will be attached to the open position automatically.
§ Stop LossThis order is used for minimizing of losses if the security price has started to move in an unprofitable direction. If the security pricereaches this level, the position will be closed automatically. Such orders are always connected to an open position or a pending order.The brokerage company can place them only together with a market or a pending order. Terminal checks long positions with BID pricefor meeting of this order provisions, and it does with ASK price for short positions.To automate Stop Loss order following the price, one can use Trailing Stop.
§ Take ProfitTake Profit order is intended for gaining the profit when the security price has reached a certain level. Execution of this order resultsin closing of the position. It is always connected to an open position or a pending order. The order can be requested only together witha market or a pending order. Terminal checks long positions with BID price for meeting of this order provisions, and it does with ASKprice for short positions.
Attention:· execution prices for all trade operations are defined by the broker;
109 / 164
· Stop Loss and Take Profit orders can only be executed for an open position, but not for pending orders;· history charts are drawn only for BID prices in the terminal. At that, a part of orders shown in charts is drawn for ASK prices. To
enable displaying of the latest bar ASK price, one has to flag the "Show Ask line" in the terminal settings.
110 / 164
Client Terminal / Trading / Trailing Stop
Trailing StopStop Loss is intended for reducing of losses where the symbol price moves in an unprofitable direction. If the position becomesprofitable, Stop Loss can be manually shifted to a break-even level. To automate this process, Trailing Stop was created. This tool isespecially useful when price changes strongly in the same direction or when it is impossible to watch the market continuously for somereason.
Trailing Stop is always attached to an open position and works in client terminal, not at the server like Stop Loss, for example. To setthe trailing stop, one has to execute the open position context menu command of the same name in the "Terminal" window. Then onehas to select the desirable value of distance between the Stop Loss level and the current price in the list opened. Only one trailing stopcan be set for each open position.
After the above actions have been performed, at incoming of new quotes, the terminal checks whether the open position is profitable.As soon as profit in points becomes equal to or higher than the specified level, command to place the Stop Loss order will be givenautomatically. The order level is set at the specified distance from the current price. Further, if price changes in the more profitabledirection, trailing stop will make the Stop Loss level follow the price automatically, but if profitability of the position falls, the order willnot be modified anymore. Thus, the profit of the trade position is fixed automatically. After each automatic Stop Loss ordermodification, a record will be made in the terminal journal.
Trailing stop can be disabled by setting "None" in managing menu. And trailing stops of all open positions and pending orders will bedisabled if the "Delete All" command of the same menu has been executed.
Attention: Trailing Stop works in the client terminal, not in the server (like Stop Loss or Take Profit). This is why it will not work,unlike the above orders, if the terminal is off. In this case, only the Stop Loss level will trigger that has been set by trailing stop.
111 / 164
Client Terminal / Trading / Types of Execution
Types of ExecutionThere are three order execution modes in the client terminal:· Instant Execution
In this mode, the order is executed at the price offered to the broker. At sending the order to be executed, terminal sets the currentprices in the order. If broker accepts the prices, the order will be executed. If not, the so-called "Requote" will occur: Broker returnsprices at which the order can be executed.
· Execution on RequestIn this mode, the market order is executed at the price previously received from the broker. Prices for a certain market order arerequested from the broker before the order is sent. After the prices have income, order execution at the given price can be eitherconfirmed or rejected.
· Execution by MarketIn this order execution mode, broker makes a decision about the order execution price without any additional discussion with thetrader. Sending of the order in such a mode means advance consent to its execution at this price.
Attention: Execution mode for each security is defined by the brokerage company.
112 / 164
Client Terminal / Trading / Trade Positions
Trade PositionsThe fundamental and simple rule of profitable trading at financial markets is to buy cheaper and sell dearer. Thus, the entire tradingactivities at financial markets come to the successive operations performed to sell or buy securities. To do so, one has to open, modify,and close trade positions. Trade position is a market commitment (order), the number of bought or sold contracts for which no set-offtransactions have been made. The entire trading in the terminal is implemented through trade positions. Client Terminal gives a largeamount of opportunities in controlling and managing trade positions. Trader gives instructions (orders), and brokerage company opensor closes a position. Managing trade positions consists in:· opening of a position — buying or selling of a security as a result of a market or a pending order execution;· modifying of a position — changing of the Stop Loss and Take Profit levels attached to the open position;· placing of pending orders — placing of pending orders like Buy Limit, Buy Stop, Sell Limit, or Sell Stop;· modifying and deletion of pending orders — modifying or deletion of pending orders that did not trigger;· closing of a position — buying or selling a security in order to close the existing open position.
113 / 164
Client Terminal / Trading / Trade Positions / Open Positions
Open PositionsOpening of a position, or entering the market, is the first buying or selling of a certain amount of the security traded. Position can beopened either by execution of a market order or by automatic triggering of a pending order.
Market OrderTo open a position using a market order, one has to execute the "Tools — New Order" menu command, press the button of the
"Standard" toolbar, press F9, or double-click on the symbol name in the "Market Watch" window. One can also execute the "New Order"context menu command of the windows of "Market Watch" and "Terminal — Trade". At that, the "Order" window will open that is used formanaging trade positions. When opening a position, one has to:· Symbol — select a security symbol for which the position is to be opened;· Volume — specify the trade volume (amount of lots);· Stop Loss — set the Stop Loss level (optionally);· Take Profit — set the Take Profit level (optionally);
Attention: Zero values of Stop Loss/Take Profit orders mean that the orders have not been placed at all.
· Comment — write a comment (optionally). The comment length may not exceed 25 characters. The brokerage company may add acomment not above 6 characters long, or it can completely replace the existing one. After a position has been opened, the commentcannot be changed;
· Type — the execution mode specified by the broker for the given symbol is displayed in this filed on default. You can also choose the"Pending order" in the list here, which allows you to go to placing a pending order.
· Enable maximum deviation from quoted price — enable/disable the use of deviation. If a broker requotes the price of orderexecution, the deviation of the new price from the quoted before will be calculated. At that, if the deviation is below or equal to thespecified parameter, the order will be executed at the new price without any additional notifying. Otherwise, the broker returns newprices at which the order can be executed;
· Maximum deviation — the value of maximum permissible deviation in pips.
Attention: Price deviation at placing of orders is used only in the instant execution mode.
After all necessary data have been specified, one has to press the "Sell" or "Buy" button. At that, the order for opening of a short or longposition, respectively, will be sent to the broker.
Attention: If orders for a given symbol are executed at request, it is necessary to press the "Request" button to receive quotesfirst. Quotes offered after requesting will be active for just a few seconds. If no decision is made within these seconds, "Sell" and"Buy" buttons will be locked again.
If the Stop Loss or Take Profit level is too close to the current price at opening of a position, the message of "Invalid S/L or T/P" willappear. It is necessary to shift levels from the current price and re-request for placing of the order. A trade position will be opened afterthe brokerage company has made a trade and set Stop Loss and Take Profit. At that, the status bar of the opened position will appear inthe "Terminal — Trade" tab, and open price, Stop Loss and Take Profit levels will be shown in the chart (if the "Show trade levels" optionis enabled).
Pending OrdersTo open a position with a pending order, one has to place it first as described in the "Placing of Pending Order" section. If the currentprices meet its provisions, the pending order will be executed automatically, i.e., a new trade position will be opened. At that, thestatus bar of the pending order will be deleted in the "Terminal — Trade" tab, and the newly opened position status bar will appear. IfStop Loss and Take Profit orders were attached to the pending order, they will be attached to the new position automatically.
Modifying of PositionsModifying of the current position consists in setting of new levels of Stop Loss or Take Profit attached to it. To modify a position, onehas to execute the "Modify or Delete Order" command of the opened position context menu or doulbe-click with the left mouse button inthe fields of "Stop Loss" or "Take Profit" of the opened position line in the "Terminal" window. Then, one has to set new values of StopLoss or Take Profit and press the "Modify" button.
To change the Stop Loss or Take Profit values, one has to enter the new values in the corresponding fields. To place the order in pointsfrom the current price, one has to set the desired value in the "Level" field and press the "Copy as" button. If values of these fields arezero, the minimum permissible deviation is used to be set by broker.
If Stop Loss or Take Profit level is too close to the current price, the "Modify" button will be locked. It is necessary to shift levels fromthe current price and re-request for position modifying. A trade position will be modified after the brokerage company has set a newvalue for Stop Loss or Take Profit, or both. Values in the fields of "S/L" and "T/P" will be changed in the opened position status bar inthe "Terminal — Trade" tab. At that, levels of the modified orders will be changed if the "Show trade levels" option is enabled.
Attention: Zero values in the fields of "Stop Loss" and "Take Profit" mean that these orders were not placed.
115 / 164
Client Terminal / Trading / Trade Positions / Position Close
Position CloseBuying or selling of a security opens a trade position. Then, in order to gain profit of the bid-and-ask price differences, one has to closethe position. The latter trade operation is reverse towards to former one. For example, if the former operation consisted in buying ofone lot of GOLD, then one lot of the same symbol must be sold to close the position. Positions can be closed differently in the clientterminal: It can be closing of a single position, closing of a position by an opposite position, and multiple close by several positions.
Single Position ClosingA single open trade position will be closed automatically if prices equal to values of Stop Loss or Take Profit.
Attention: When a long position is being closed, the Bid price must equal to the value of Stop Loss or Take Profit, and Ask pricemust do for short positions.
To close a position manually, one has to execute the opened position context menu command of the "Terminal — Trade" window ordouble-click with the left mouse button on this position. If trade operations for a certain symbol are executed on request, one has firstto receive quotes by pressing of the "Request" button. This activates the button that allows to close position.
Attention:· in the "Execution on request" mode, the offered quotes will be active for just a few seconds. If no decision has been made within
these seconds, the "Close... " button will be locked again;· client terminal allows to close positions partially. To do so, one has to specify the amount of lots less than that given for the
opened position in the "Volume" field before pressing of the "Close... " button;· broker can close positions, as well. For example, it can be done when prices reach the "Stop Out" level that was set by the broker;· history charts are drawn only on BID prices in the terminal. At that, a part of orders shown in charts is drawn on ASK prices. To
get ASK price of the latest bar shown, one has to flag "Show Ask line" option in the terminal settings.
Close by Opposite PositionsOpposite position towards the given one is a reverse position for the same symbol. If there is one or more opposite positions among theopen positions, one can close the selected position by and together with an opposite one. To do so, one has first to open the "Order"window (as described above). Then, the "Close by" must be selected in the "Type" field. After that, the list of all opposite positions willappear in the lower part of the window. One has to select an opposite position in this list, and after that the "Close... " button will beactivated. It allows to close two positions at the same time. Only one of two opposite positions with different amounts of lots to betraded will remain. The volume (amount of lots) of this position will equal to the difference between lots of the two closed positions,and its direction and open price (short or long) will correspond with those of the larger (in volume) of two closed positions.
Multiple Close by Opposite PositionsMultiple close of several opposite positions allows to close more than two opposite positions at the same time. To perform thisoperation, one has also to open the "Order" window (as described above). Then the "Multiple close by" must be selected in the "Type"window. At that, the list of all opposite positions will appear in the lower part of the window, and the "Multiple close by... " button will beactive. It allows to close opposite positions. Positions will be closed in pairs, according to the open time, and they will be closed asdescribed above for two opposite positions. If the difference between the sums of volumes is not zero, a new position will be opened asa result of the operation, the volume being equal to this difference. The newly opened position will participate in the multiple closeprocess, but according to its open time, and so on until all positions are closed or the last resulting position is opened.
Attention: After opposite positions have been closed, the corresponding records will be made in the "Terminal — Account History"window. At that, overhead information about closing of opposite positions will be entered in the "Comment" field.
Placing of Pending OrdersTo place a pending order, one has to open the "Order" window. This can be done by the "Tools — New Order" menu command, the
button of the "Standard" toolbar, by pressing of F9, by the "New Order" command of the "Market Watch" and "Terminal — Trade" windowcontext menus, as well as by double-clicking on the symbol name in the "Market Watch" window. "Pending Order" must be selected in the"Type" field of this window.
Further, a security (symbol) must be selected, the volume and values of Stop Loss and Take Profit orders must be specified. If necessary,a comment can be written in the field of the same name. In the "Pending Order" fields one has to:· Type — select a type of pending order: Buy Limit, Buy Stop, Sell Limit, or Sell Stop;· at price — set the price level at which the order must trigger;· Expiry — set the expiry time of the order. If the order has not triggered by this time, it will be deleted automatically.
Attention: Order may not expire earlier than in 10 minutes!
The "Place" button will send the order to be executed what is performed in two stages. First, the brokerage company places the orderafter it has been sent. At that, a line containing the number and status of the pending order will appear in the "Terminal — Trade" tab. Ifthe "Show trade levels" option is enabled, levels of the placed pending order (including levels of Stop Loss and Take Profit) will be shownin the chart. At the second stage, if prices correspond with the order provisions, it will be deleted and a trade position will be openedinstead of it. The trade position ticket will coincide with the pending order ticket. These changes will be shown in the "Terminal —Trade" window.
Attention: Stop Loss and Take Profit orders trigger only at open positions, but not at pending orders.
Modifying of Pending OrdersWhen working at the market, one often needs to modify or delete the placed pending order. To do so, one has to execute the pendingorder context menu command of "Modify or Delete Order" or double-click with the left mouse button on the pending order status bar inthe "Terminal — Trade" window. The window for order managing will open. New price of the pending order triggering, new levels of StopLoss and Take Profit, as well as expiry time of the order can be set in this window. After the order has been modified, one has to pressthe "Modify" button.
Attention: Setting of zero values for Stop Loss and Take Profit equals to disabling of these orders.
If the pending order has been successfully modified, the values of the corresponding fields in the "Terminal — Trade" window will bechanged. If the "Show trade levels" option in the terminal settings has been enabled, the pending order levels and those of Stop Lossand Take Profit attached to it will be shifted correspondingly in the chart, as well.
Deletion of Pending OrdersIf market situation has been changed, there can occur a necessity to delete a pending order. To do so, one has to execute the "Modify orDelete Order" pending order context menu command or double-click with the left mouse button on the status bar of the pending order inthe "Terminal — Trade" window. The window that manages orders will open. To delete an order, the button of the same name must bepressed in it. Pending orders can also be deleted automatically at the time that has been given in the "Expiry" field. When a pendingorder has been deleted, the corresponding record will appear in the "Terminal — Account History" window.
119 / 164
Client Terminal / Auto Trading
Auto TradingTo work at financial markets more effectively, one can develop one's own successful system of trading. It is very difficult to act within achosen system of trading in the manual mode due to significant influence of normal human emotions. Mechanical trading systems do notsuffer from this disadvantage.
Client Terminal gives a large range of means for development and use of mechanical trading systems (MTS, experts, advisors). Thedevelopment environment allows to create, debug, and test expert advisors. Experts are able not only alert about recommendationtrading signals, but undertake the complete control over trading activities online.
MetaQuotes Language 4, MetaEditor and strategy testing tools are built in the terminal. One can create the following using thesemeans:· Expert Advisors — mechanical trading systems that allow complete automation of analytical and trading activities;· Custom Indicators — independently written technical indicators intended for analyzing of price changes;· Scripts — programs to be executed only once, on request.
120 / 164
Client Terminal / Auto Trading / MQL 4
MQL 4MetaQuotes Language 4 (MQL 4) is the language for programming of trade strategies built in the client terminal. It allows to writecustom expert advisors that automate trade processes and ideally suit for implementation of traders' own strategies. Moreover, traders'own custom indicators, scripts and DLL's can be created in MQL 4.
Syntax of MQL 4 is quite similar to that of C language. A large amount of functions necessary to analyze quotes, manage positions, calltechnical indicators, and others, are included in MQL 4. The MetaEditor, an editor for expert advisors, is used for writing the sourcecode of programs. The MetaQuotes Language Dictionary that contains descriptions of all language constructions and functions is built inthe editor.
Programs written in MQL 4 are different in tasks and properties:· Expert Advisor is a mechanical trading system (MTS) to be run when a new tick incomes. It can work not only in the mode alerts, but
also perform trade operations independently. Terminal allows to test trading strategies on history data in order to detect the expertfeatures under different market conditions;
· Custom Indicator is a technical indicator written individually. Custom indicators are used only for analyzing of price changes;· Script is a program that is intended for a single execution of some actions. Unlike experts, scripts are launched not tick by tick, but
on a command.
121 / 164
Client Terminal / Auto Trading / MetaEditor
MetaEditorMetaEditor is a constituent of the client terminal. It is intended for creation, editing, and compilation of program source codes writtenin MetaQuotes Language 4 (MQL4). It can be used in developing of experts, custom indicators, scripts and DLL's.
Expert Advisors Wizard is built in the editor to assist in fast creation of new MQL4 programs. The new file will be saved in thecorresponding folder of the client terminal automatically. Templates can be used in creation of an MQL4 program, as well. After that,one can start writing the program text. The supplemental information can be found in MQL4 Dictionary. The full description of thelanguage with examples of how to use it is given there. After the program has been written, one has to compile it in MetaEditor. As aresult of successful compiling, the executable program code will be created that can be launched or tested in the terminal.
A detailed description of MetaEditor can be found in its Help Files.
122 / 164
Client Terminal / Auto Trading / Expert Advisors
Expert AdvisorsExpert Advisors (experts) are programs in the terminal that have been developed in MetaQuotes Language 4 (MQL 4) and used forautomation of analytical and trading processes. They allow to perform prompt technical analysis of price data and manage tradingactivities on basis of signals received. The entire routine work of technical analysis and trading can be given to experts. An expert canperform analytical and trading operations for any symbols or periods independent on whether the corresponding chart was opened ornot.
Working with experts means:· Creation of an Expert
To create and compile an expert, one has to use the built-in "MetaEditor". It is a constituent of the client terminal and represents aconvenient development environment of MQL4 programs.
· Expert SetupBefore using of experts, one has to set up them first. Working parameters common for all experts are set in the client terminalsettings. Besides, each expert can have its own settings.
· Launch of an ExpertTo launch an expert, one has to impose it into the chart. As soon as a new tick incomes, the expert will start executing.
· Expert ShutdownAn expert advisor is shut down after it has been removed from the chart.
123 / 164
Client Terminal / Auto Trading / Expert Advisors / Creation
CreationTo create experts, one has to use MetaQuotes Language 4 (MQL 4) and MetaEditor. To launch the expert editing program, one has toexecute the "Create" command of the "Navigator — Expert Advisors" window context menu, or the "Tools — MetaQuotes LanguageEditor" menu command, or press F4 or the button of the "Standard" toolbar. After that, the Expert Creation Wizard will be opened
automatically that allows to immediately start working at a new MQL4 program. One has to flag the "Expert Advisor" as a type of objectto be created and fill out the following fields:· Name — expert name;· Developer — the developer's name;· Link — link to the developer's site;· Inputs — the list of expert inputs. To add a new parameter, one has to press the "Add" button or the "Delete" button to delete a
parameter.
After that the new expert window with the defined inputs will open in editor. The source file (*.MQ4) of the expert will be saved in the/EXPERTS folder of the client terminal automatically. At this moment, one can start to write the expert code.
After the expert development has been completed, it must be compiled. To do so, one has to execute the "File — Compile" command inthe expert editor, or press F5 or the button of the toolbar. As a result of successful compilation an executable program file with*.EX4 extension will be created and saved in the /EXPERTS folder automatically. The list of compiled experts can be viewed in the"Navigator — Expert Advisors" window in the client terminal. If the expert has not been compiled successfully, its icon will be gray. Thismeans that this expert cannot be used.
Editing of ExpertsTo start editing of the existing expert from the terminal, one has to execute the "Modify" command of the "Navigator — ExpertAdvisors" window context menu. At that, the experts editor will open where the source code of the selected expert. After the expertsource code has been modified, one has to recompile it and get a new executable EX4 file. Otherwise, terminal will use the previousversion of the expert, the non-modified one.
Attention: If the expert has not been compiled successfully, its icon will be gray. This means that this expert cannot be used.
124 / 164
Client Terminal / Auto Trading / Expert Advisors / Setup
SetupBefore using of experts, one has to set them up first. Working parameters common for all experts are defined in the client terminalsettings window. This window can be opened by the "Tools — Options" menu command or by pressing of accelerating keys of Ctrl+O. Toset up expert parameters, one has to select the "Expert Advisors" tab. The following settings are available in it:· Enable Expert Advisors
This option allows to enable or disable the use of all experts. If it is disabled, the start() function will stop execute for all expertswhen a new tick incomes. At that, the smileys at the expert names in the upper right corners of charts will be replaced with daggers.To enable experts, one has to flag this option and press "OK". They will start functioning when a new tick incomes, and daggers in theupper right corners will be replaced with smileys again.
Attention:· the expert will start function when a new tick incomes, and it often completes its work before the next tick incomes.
Disabling of experts does not interrupt working of those that are active already;· this option covers only expert advisors and does not allow to disable custom indicators and scripts automatically.
· Disable experts when the account has been changedThis option represents a safety tool that disables experts when the account has been changed. It can be useful, for example, whenone switches from a demo account to a real one. To enable it, one has to flag it and press "OK".
· Disable experts when the profile has been changedA large amount of information about the current settings of all charts of the workspace is saved in profiles. Particularly, informationabout the attached experts is saved in profiles. Experts included into a profile will start working when a new tick incomes. Havingenabled this option, one can disable launching of experts when the profile has been changed.
· Allow live tradingExperts can work automatically, without trader's participation. They can both analyze price changes and trade. This option is intendedfor limiting of trading functions of experts. These limitations can be useful for testing analytical capacities of an expert in the real-time mode (not to be mixed up with testing an expert on history data).
· Ask manual confirmationThis option will only be enabled if experts are allowed to trade. If this option is enabled and the expert tries to trade, one will be ableto confirm the trade or interrupt it manually. In other words, trading activities of experts can be managed through this manualconfirmation option. This can be useful for testing trading functions of an expert in the real-time mode (not to be mixed up withtesting an expert on history data)..
· Allow DLL importsExperts can use DLLs to enlarge their functionalities. If this option is enabled, the libraries can be used without any limitations.Disabling of the option results in that no expert can use any external DLLs. It is recommended not to allow DLL imports when workingwith unknown experts.
· Confirm DLL function callsThis option will only be enabled if DLL imports are allowed. It allows to control over execution of each called function manually. If it isdisabled, the imports from external libraries will not be controlled. This option is recommended to be enabled when working withunknown experts.
· Allow external experts importsIf there is a need to export functions from other experts or MQL4 libraries during the expert functioning, one has to enable thisoption. If it is disabled, no expert already launched will be able to call functions from other MQL4 programs. This option isrecommended to be disabled when working with unknown experts.
125 / 164
Client Terminal / Auto Trading / Expert Advisors / Launch
LaunchAfter general parameters have been set up, experts can be launched. To do so, it is enough just to attach the expert to the chart. The"Attach to a chart" command of the "Navigator — Expert Advisors" window context menu or double click with the left mouse button onthe selected expert in the same window allows to impose it into the active chart. "Drag'n'Drop" technique allows to impose the expertinto any chart. At that, the window of the expert special settings will appear. In its "Common" tab, it is possible:· Positions — select the direction of position opening:· Long&Short — in both directions;· Only Long — only for buying;· Only Short — only for selling.
· Enable alerts — enable/disable the expert to alert;· Disable alert once hit — disable alerts after the first alert has been given;· Allow live trading — enable/disable live trading;· Ask manual confirmation — request for manual confirmation of position opening when trading;· Allow DLL imports — enable/disable imports of functions from DLL files;· Confirm DLL function calls — request for confirmations at each function call from DLL files;· Allow import of external experts — enable/disable calling of functions from external experts.
External variables of the expert can be changed in the "Inputs" tab. these are variables of extern class. To save an input, one has todouble-click with the left mouse button on its value and write the new one. At that, one can change the value of each variable ordownload the set of inputs already saved (the "Load" button). One can save the current set of external variables using the button of thesame name.
The "Reset" button returns all default settings. Parameters defined in the terminal settings are given in the "Common" tab. Andparameters defined in the program source code are set as inputs. To attach the expert with the new parameters to a chart, one has topress "OK". To cancel the expert imposing, one has to press the button of the same name.
Attention: Only attached experts can be set up individually. However, while current executing, the window of the expert propertiescannot be opened. This can be done only during intervals between calls of the start() function. At that, the expert will not belaunched until its properties window is closed. If the expert inputs were changed, the expert will be re-initialized with its new inputsat pressing of "OK".
After an expert has been set up, it will be initialized and, as soon as a new tick incomes, execute. Expert is attached if its name and asmiley can be seen in the upper right corner of the chart. If live trading is disabled in the expert settings, a L will appear instead of thesmiley. A dagger (û) means that all experts are disabled.
Attention: Only one expert can be attached to a chart. If another expert is imposed, the previous one will be deleted from thechart.
126 / 164
Client Terminal / Auto Trading / Expert Advisors / Shutdown
ShutdownTo shut down an expert, one has to remove it from the chart. Expert must have been deinitialized before it is shut down. To remove anexpert from the chart, one has to execute the chart context menu "Expert Advisors — Delete" command or attach another expert to thesame chart. Besides, the expert can be removed from the chart at profile or template change.
Attention:· at client terminal shutdown, all experts are shut down, too;· at chart closing, the expert attached to this chart will be shut down;· at imposing of another expert, the previous one will be removed after confirmation;· deletion of the expert from the "Navigator" window does not shut down the expert of the same name imposed in the chart;· disabling of experts in the client terminal settings does not provide complete disabling of experts. This option stops launching of
the start() function of each expert, but the init() will continue to execute.
127 / 164
Client Terminal / Auto Trading / Strategy Testing
Strategy TestingThe terminal allows not only write expert advisors, but also test them before using. This useful function allows to check operativenessand efficiency of the trading system on history data. Testing allows to start automated trading with the full knowledge about expertconduct under different market conditions. The special "Tester" window was built into the terminal for this purpose. Using this window,one can optimize expert inputs, as well.
128 / 164
Client Terminal / Auto Trading / Strategy Testing / Setup
SetupBefore starting to test expert advisors, one has to perform the setup. This means that one has to:· select an expert and set up its inputs· select a symbol and its period· select one of three modeling methods· set the testing time range (optional)
To test and optimize experts, a special "Tester" window is used in the terminal. All above parameters are set in the "Settings" tab of thiswindow.
An Expert Advisor and Its ParametersOne has to select an expert to be tested in the "Tester — Expert Advisor" field. One cannot select any expert file in this field. Only thoseexperts that are available in the client terminal can be selected here. To be selected, they must be compiled and located in the/EXPERTS folder.
After an expert has been selected, one has to perform additional setting of testing parameters and inputs. This can be done by pressingof the "Expert properties" button. A new window with three tabs will appear then:· Testing — general testing parameters are set in this tab. These are volume and currency of the initial deposit to be given in the
corresponding fields. It is this deposit that will be operated by the expert during testing. Types of positions to be opened at testingare defined here, as well: Only Long — open only long positions; Only Short — open only short ones; Long and Short — open both longand short positions. Whatever expert algorithm is, it will open positions only in the defined directions. One can include anoptimization genetic algorithm and select a parameter to be optimized (maximization by the balance value, the profit factor,expected payoff, or minimization by the maximal drawdown value or drawdown percent).
· Inputs — the list of all inputs is given here as a table. Inputs are variables that influence the expert operation and can be changeddirectly from the client terminal. There is no need to change the expert code in order to change these parameters. The amount ofinput variables can change depending on the expert. At testing, the expert inputs are defined in the "Value" field. Data written in thefields of "Start", "Step", and "Stop" do not influence expert testing and are necessary just for optimization of its parameters. How towork with these parameters is described in the "Optimization Setup" section.
· Optimization — settings in this tab allow to limit testing passes at optimization. Changing of parameters in this tab does notinfluence single testing passes of the expert.
Symbol and Its PeriodTo start testing, it is not enough just to select an expert and set it up. One has to select a symbol and a period (timeframe) for testing.These are data that will be used for testing. At testing, one can select an available in terminal symbol or use an external data file.History data files of *.FXT format stored in the /TESTER directory are used in testing. These file are created automatically at testing ifan available in the terminal symbol was selected.
The symbol is defined in the field of the same name, and timeframe is in the "Period" field. If no data file for this symbol, period andmodeling method does not exist yet, it will be created automatically. If there are no history data for the symbol or period, the tester willdownload the last 512 history bars automatically.
Attention: If there are some data outside the latest 512 bars for the symbol, the history data will be downloaded automatically, upto the last available one. This can cause sharp increase of the incoming traffic.
Methods of ModelingHistorical data are saved in the terminal only as bars and represent records appearing as TOHLCV (HST format). These data can be usedfor modeling of price changes at testing experts. In some cases, such information is not enough for testing. For example, for the dailytimeframe, price changes within a bar can result in triggering of the expert. At the same time, no triggering can occur at testing. Inother words, testing an expert based on only bars can be inaccurate and give a false idea about the expert efficiency.
The trading terminal allows to test experts by various methods of historical data modeling. Using historical data from smaller periods, itis possible to see price fluctuations within bars, i.e., price changes will be emulated more precisely. For example, when an expert istested on one-hour data, price changes for a bar can be modeled on one-minute data. Thus, modeling brings historical data near thereal price fluctuations and makes expert testing more authentic.
One of three methods of historical data modeling can be chosen for testing:· Open prices only (fastest method to analyze the bar just completed)
Some automated trading systems do not depend on properties of modeling within a bar, they trade on completed bars. The bar iscompleted if the next one has appeared. These are such experts for that this modeling method was developed.In this mode, the bar opening is modeled first (Open = High = Low = Close, Volume=1) what allows the expert to identify thecompletion of the preceding bar precisely. It is this incipient bar that is used to start testing the expert. At the next step, the fully
129 / 164
completion of the preceding bar precisely. It is this incipient bar that is used to start testing the expert. At the next step, the fullycompleted current bar will be given, but no testing is performed on it!
· Control points (the nearest less timeframe is used)The control points modeling method is intended for a crude estimate of experts efficiency that trade within the bar. The historicaldata of the nearest less timeframe must be available to apply this method. In some cases, the available data of the less timeframe donot completely cover the time range of the timeframe under test. If the data of the less timeframe are missing, the bar evolution isgenerated on the basis of predefined wave templates as it was in the preceding, third version of MetaTrader 3 Client Terminal. As soon as historical data of the less timeframe appear, these new data will be interpolated. However, the really existing OHLC pricesappear as control points. In the most cases, the results of testing experts by method of control points can also be considered asestimated ones, not as final ones. Such results are of intermediate, estimated nature.
· Every tick (based on all available least timeframes)This is the most accurate method of modeling prices within a bar. Unlike that of "control points", this method uses for generation notonly data of the nearest less timeframe, but also those of all available nearest timeframes. At that, if there are data of more thanone period for the same timeframe at the same time, the data of the least timeframe will be used for modeling. Like in the precedingmethod, control points are generated on the basis of OHLC data of the least available timeframe. To generate price movementsbetween control points, interpolation based on predefined templates is also used, so one-minute data are highly desirable to beavailable that would cover the entire testing range. It is possible that several similar ticks are modeled one after another. In thiscase, the doubled quotes will be filtered out, and the volume of the last of them will be fixed. One has to consider the possible large amount of tick data modeled. This can influence the consumed resources of the operationsystem and testing speed.
Attention:· it is not recommended to launch testing on every tick if there are no available less timeframes that completely cover the period
under test, otherwise, the results will not be accurate;· modeling on control points is basically used at optimization of experts, and all ticks modeling is for a close testing.
The modeling quality can be checked in the "Report" window. The "Modeling quality" field and a colored band are intended for this. Theband is a scheme of the modeling process. It can be of three colors:1. Gray — this part of available data did not participate in testing. Gray color can appear if the date range was specified for testing
(described below);2. Red — modeling was not performed in this space because of missing data of a less timeframe. At that, only data of the timeframe
selected for testing were used;3. Green — modeling was performed in this space. And the brighter is the color, the higher the modeling quality was. For example, at
testing on H1 period, the deep-green band can mean that data of M30 period were used for testing, and the brightest one does thatM1-period data are used.
After modeling parameters and date range (described below) have been changed, the data file must be created afresh. To do so, onehas to flag the "Recalculate". If the above setting were not changed, there is no need to recalculate. In this case, it is recommended todisable the above option in order to reduce the testing time.
Time RangeThe range of dates allows to test experts not on all available data, but within a certain time space only. This can be useful if there is aneed to test a certain part of history data. Date range can be used not only for expert testing, but also for modeling of the testingsuccession of bars (file of data modeled to be used for testing). It is often no need to model data of the entire history, especially forevery-tick modeling where the amount of unused data can be very large. That is why, if data range was allowed to be set at the initialmodeling of testing succession, bars that are beyond this range will not be modeled, but just transcribed into the output succession.The data will not be excluded from the succession in order the correct calculation of indicators on the entire received history to bepossible. It must be noted that the first 100 bars will not be modeled either. This limitation does not depend on the date range defined.
To enable date range limitation, one has to flag "Use date" and specify the necessary values in the fields of "From" and "To". After allsettings have been made, one can press the "Start" button and start testing. After testing has started, the approximate time ofcompleting of this process can be viewed in the lower part of the window.
Testing VisualizationIf the ""Visualization"is flagged, after the "Start" button has been clicked, the chart will be opened automatically, on which the modeledtick sequence will be played. The playback speed can be regulated. The playback can be suspended by clicking the "||" button. Therepeated click on this button resumes the income of the modeled ticks. Pressing of F12 causes immediate appearance of the next tickeven in the suspension mode. Visualization can be skipped up to a certain date. After the desired date is set and the "Skip to" button isclicked, visualizing will stop and then resumed after the tester reaches the defined date.
Attention: If "Optimization" is enabled, expert parameters will be optimized, not tested, after the "Start" button has been pressed.
130 / 164
131 / 164
Client Terminal / Auto Trading / Strategy Testing / Results
ResultsAfter the testing has been completed, one can see the results thereof in the tabs of "Results", "Graph", "Report", and "Journal".
ResultsInformation about all trade operations performed is given in this tab as a table:· # — the trade operation sequence number;· Time — time at which the operation was performed;· Type — type of the operation (sell, buy, s/l, t/p, modify, close at stop, etc.);· Order — ticket number of trade position or pending order (not to be mixed up with the trade operation sequence number described
above);· Size — amount of lots traded;· Price — symbol price during operation;· S/L — the Stop Loss order value. No entries in this field mean that the order was not placed;· T/P — the Take Profit order value. No entries in this field mean that the order was not placed;· Profit — profit/loss. The profit/loss value is entered only at closing of positions;· Balance — balance value. The balance value is recorded only at closing of positions.
Having clicked with the left mouse button on any column header, onl can sort out all entries in the table in increasing or decreasingorder. Using the "Copy" context menu command or accelerating keys of Ctrl+C, one can copy the selected lines of results to the clipboardfor further use in other applications. If no line has been selected, the entire table will be copied to the clipboard. As well, to copy theentire table to the clipboard, one can execute the "Copy All" command. The report of results can be saved in the hard disk as an HTMLfile. To do so, one has to execute the "Save as Report" context menu command. The commands of "Set Date "From"" and "Set Date "To""allow to set the time span for testing. At that, the selected operations dates will be written in the fields of "Use date from:" and "Usedate to:" in the testing settings. This can be useful if there is a need to test an expert closely or to optimize its parameters within thisrange of dates.
GraphThe graph representing the account balance (the blue line is "Balance") and general account status considering open positions (the greenline is "Lots") is drawn in the "Graph" tab automatically. If only balance line is displayed in the graph, it means that the lines of "Balance"and "Lots" coincide during the entire testing period. Graph allows changes in trading results during testing even more visualized. If lotsizes were changed during testing, the chart of lot size changes will be shown in the bottom of the graph.
A double click with the left mouse button on any point in the graph will switch to the "Results" button, the corresponding line beingselected. Using the "Copy" context menu command or accelerating keys of Ctrl+C, one can copy the graph to the clipboard to be used inother applications. A graph can also be saved in the hard disk as a GIF file. To do so, one has to execute the "Save as Picture" contextmenu command or press the accelerating keys of Ctrl+S. The commands of "Set Date "From"" and "Set Date "To"" allow to set the timespan for testing. At that, the selected operations dates will be written in the fields of "Use date from:" and "Use date to:" in the testingsettings. This can be useful if there is a need to test an expert closely or to optimize its parameters within this range of dates.
ReportGeneralized results of the expert testing and some key data are represented in the "Report" tab. Such reports allow to quickly comparevarious experts to each other. The following data are published in reports:· Bars in test — the amount of history data modeled in bars;· Ticks modeled — the amount of ticks modeled;· Modeling quality — the quality of ticks modeled during testing, in per cents. Modeling is shown elementarily as a band in the next
line of the report. The band can be of one of three colors:· Gray — this part of available data was not involved into testing. Gray color can appear if there was a date range specified in the
testing settings;· Red — modeling was not performed in this space because of missing available data of a less timeframe. At that, only data of the
timeframe selected in the testing settings were used;· Green — modeling was performed in this space. And the brighter is the color, the higher modeling quality was. For example, at
testing on the H1 period, the deep-green band means that data of M30 period were used for testing, and the brightest one does thatM1 data were used;
Attention: If the fastest method ("Open prices only") was selected in the testing settings, the entire band will be red. At that, "n/a"(no modeling was performed) will be written in the "Modeling quality" field;
· Initial deposit — the amount of initial deposit;
132 / 164
· Total net profit — financial result of all trades. This parameter represents the difference between "Gross profit" and "Gross loss";· Gross profit — the sum of all profitable trades in monetary units;· Gross loss — the sum of all unprofitable trades in monetary units;· Profit factor — the ratio between the gross profit and the gross loss in per cents. One means that these sums are equal;· Expected payoff — mathematical expectation of win. This parameter to be calculated statistically represents average profit/loss
factor of one trade. It can also be considered as showing the expected profitability/unprofitability of the next trade;· Absolute drawdown — the largest loss is below initial deposit value;· Maximal drawdown — the largest loss of the local maximum in the deposit currency and in per cents of the deposit;· Relative drawdown — the maximal loss in percents of the maximum equity value and its corresponding money value;· Total trades — total amount of trade positions;· Short positions (won %) — amount of short positions and the profit percentage thereof;· Long positions (won %) — amount of long positions and the profit percentage thereof;· Profit trades (% of total) — the amount of profitable trade positions and their part in the total trades, in per cents;· Loss trades (% of total) — the amount of unprofitable trade positions and their part in the total trades, in per cents;· Largest profit trade — the largest profit among all profitable positions;· Largest loss trade — the largest loss among all unprofitable positions;· Average profit trade — average profit value within a trade (sum of profits divided into the amount of profitable trades);· Average loss trade — average loss value within a trade (sum of losses divided into the amount of unprofitable trades);· Maximum consecutive wins (profit in money) — the longest series of profitable trade positions and sum of their wins;· Maximum consecutive losses (loss in money) — the longest series of unprofitable trade positions and sum of their losses;· Maximal consecutive profit (count of wins) — the maximal profit within one series of profitable trades and the corresponding
amount of profitable trades;· Maximal consecutive loss (count of losses) — the maximal loss within one series of unprofitable trades and the corresponding
amount of unprofitable trades;· Average consecutive wins — average amount of profitable positions in consecutive profitable series;· Average consecutive loss — average amount of unprofitable positions in consecutive unprofitable series.
The report can be copied to the clipboard or saved in the hard disk as an HTML file. To do so, one has to execute the context menucommands of "Copy" and "Copy as Report", respectively. The report can also be copied to the clipboard by pressing of accelerating keysof Ctrl+C.
"Journal" TabInformation about testing process with all trade operations is automatically published in the "Journal" tab. This journal is the same asthat of the "Terminal — Experts" window, except for that messages published in the tester window inform about testing the expert, butnot about its operation at the market. After testing has been completed, these data will be output in a separate directory named/TESTER/LOGS. The testing journal files are stored in the /EXPERTS/LOGS directory, file names corresponding with the data of journal— YYYYMMDD.LOG. To view the journals stored, one has to execute the "Open" context menu command and select the desired file. Tocopy the message to the clipboard, one has to execute the corresponding command of the context menu. The "Clear All Journals"command allows to remove all journals from the directory and clears the tab. This can be useful to clear the hard disk of too many files.
133 / 164
Client Terminal / Auto Trading / Strategy Testing / History Files in FXT Format
History Files in FXT FormatIn its operation, tester uses an *.FXT file with generated succession of bars. Each record of the generated succession represents the barstatus at either moment within one bar. When modeling bars, tester takes other bars from this file and updates the current bar or addsanother one if it has just begun to be formed.
A short description of the format is given below. It begins with the header:
//+------------------------------------------------------------------+//| |//+------------------------------------------------------------------+struct TestHistoryHeader { int version; // 404 char copyright[64]; // copyright char symbol[12]; int period; int model; // for what modeling type was the ticks sequence generated int bars; // amount of bars in history time_t fromdate; // ticks generated from this date time_t todate; // ticks generating stopped at this date double modelquality; // modeling quality //---- general parameters char currency[12]; // currency base int spread; int digits; double point; int lot_min; // minimum lot size int lot_max; // maximum lot size int lot_step; int stops_level; // stops level value int gtc_pendings; // instruction to close pending orders at the end of day //---- profit calculation parameters double contract_size; // contract size double tick_value; // value of one tick double tick_size; // size of one tick int profit_mode; // profit calculation mode { PROFIT_CALC_FOREX, PROFIT_CALC_CFD, PROFIT_CALC_FUTURES } //---- swap calculation int swap_enable; // enable swap int swap_type; // type of swap { SWAP_BY_POINTS, SWAP_BY_DOLLARS, SWAP_BY_INTEREST } double swap_long; double swap_short; // swap overnight value int swap_rollover3days; // three-days swap rollover //---- margin calculation int leverage; // leverage int free_margin_mode; // free margin calculation mode { MARGIN_DONT_USE, MARGIN_USE_ALL, MARGIN_USE_PROFIT, MARGIN_USE_LOSS } int margin_mode; // margin calculation mode { MARGIN_CALC_FOREX,MARGIN_CALC_CFD,MARGIN_CALC_FUTURES,MARGIN_CALC_CFDINDEX }; int margin_stopout; // margin stopout level int margin_stopout_mode;// stop out check mode { MARGIN_TYPE_PERCENT, MARGIN_TYPE_CURRENCY } double margin_initial; // margin requirements double margin_maintenance; // margin maintenance requirements double margin_hedged; // margin requirements for hedged positions double margin_divider; // margin divider char margin_currency[12];// margin currency //---- commission calculation double comm_base; // basic commission int comm_type; // basic commission type { COMM_TYPE_MONEY, COMM_TYPE_PIPS, COMM_TYPE_PERCENT } int comm_lots; // commission per lot or per deal { COMMISSION_PER_LOT, COMMISSION_PER_DEAL } //---- for internal use int from_bar; // fromdate bar number int to_bar; // todate bar number int start_period[6]; // number of bar at which the smaller period modeling started int set_from; // begin date from tester settings int set_to; // end date from tester settings //---- int freeze_level; // order's freeze level in points //---- int reserved[61]; };
Then, the array of modeled bars follows:
#pragma pack(push,1)struct TestHistory { time_t otm; // bar time double open; // OHLCV values double low; double high; double close; double volume; time_t ctm; // the current time within a bar int flag; // flag to launch an expert (0 - bar will be modified, but the expert will not be launched) };#pragma pack(pop)
134 / 164
Client Terminal / Auto Trading / Expert Optimization
Expert OptimizationOptimization represents successive passes of the same expert advisor with different inputs on the same data. At that, such parameterscan be sorted out at which the expert efficiency will be maximal. Terminal possesses some built-in means that allow to automate thisprocess. To optimize an expert, one has to flag the option of the same name in the "Tester" window and press the "Start" button.
135 / 164
Client Terminal / Auto Trading / Expert Optimization / Setup
SetupOptimization represents consecutive passes of the same expert with different inputs on the same data. At that, such parameters can betaken that make the expert efficiency maximal. The terminal possesses in-built means that allow to automate this process. Beforebeginning to optimize expert parameters, one has to set them up. It means that one has to:· select an expert and its inputs· select a symbol and its timeframe· select one of three bar modeling methods· set up the time span for optimization (optional)
A special window named "Tester" is used for testing and optimization of experts in the terminal. All settings listed above can be made inthe "Settings" tab of this window.
Expert Advisor and Its ParametersOne has to select expert the parameters of which should be optimized in the "Tester — Experts" window. Not any expert file can beselected in this field, but only those that are available in the client terminal. For this, they must be compiled and placed in the/EXPERTS folder.
After the expert has been selected, one has to make an additional setup and set the inputs. This can be done by pressing of the "Expertproperties" button. At that, a new window containing the following three tabs will appear:· Testing — general optimization parameters are set in this tab. They include the initial deposit volume and currency to be specified in
the corresponding fields. It is this deposit that will be operated by the expert during optimization. Types of positions to be opened areselected in this tab, as well: Only Long, Only Short, or Long and Short. Whatever expert algorithm is used, it will open positions onlyin the directions defined here; One can include an optimization genetic algorithm and select a parameter to be optimized(maximization by the balance value, the profit factor, expected payoff, or minimization by the maximal drawdown value or drawdownpercent.
· Inputs — all inputs are listed here as a table. Inputs are variables that influence the expert operation and can be changed directlyfrom the client terminal. For these parameters to be changed, there is no need to change the expert code. The amount of inputs canvary depending of experts. At optimization, the expert inputs are set in the fields of "Start", "Step", and "Stop". Initial values, changeinterval, and final values of external variables will be set in these fields, respectively. There are checkboxes to the left of variablenames that include the parameter into optimization process. If a variable is not checked in this checkbox, it will not be involved intooptimization. Its value will not be changed within the optimization process, and the parameter given in the "Value" field will bewritten here. The amount of expert passes depends on these parameters directly. Data written in the "Value" field do not influence theexpert optimization and are necessary only for its testing. The set of inputs already saved before (including those given in the fields of "Start", "Step", and "Stop") can be downloaded. This canbe done by pressing of the "Load" button and having selected the preliminarily saved set of parameters. The current set of externalvariables can be saved by pressing of the corresponding button.
· Optimization — this tab allows to manage limitations during optimization. If any of conditions is met during a separate pass, thispass of the expert will be interrupted. To enable a limit in condition, one has to flag it in the checkbox to the left of it. Double clickwith the left mouse button in the "Value" field can be used to change the existing parameter.Limiting parameters are:· Balance minimum — the smallest balance value in the deposit currency;· Profit maximum — the largest profit in the deposit currency;· Minimal margin level % — the lowest margin level in per cents;· Maximal drawdown % — the largest drawdown in per cents;· Consecutive loss — the largest loss within a series. Loss series is a number of consecutive loss trades;· Consecutive loss trades — the largest amount of loss trades within a series;· Consecutive win — the largest total profit within a series. Profitable series is a number of consecutive profitable trades;· Consecutive win trades — the largest amount of profitable trades within a series.
Symbol and Its PeriodIt is not enough just to select an expert and set it up to start optimization: a symbol and its period (timeframe) must be selected fortests. These are the data on which all tests will be made. A symbol available in the terminal or an external data file can be used fortests. History data files in *.FXT format to be stored in the /TESTER directory are used in tests. These files are created at testsautomatically if the corresponding symbol available in the terminal was selected.
Symbol is defined in the "Symbol" field, and timeframe is in the "Period". If there is no data file for this symbol, period, and modelingmethod, it will be created automatically. If there are no history data for the symbol and period, the tester will download 512 latesthistory bars automatically.
136 / 164
Attention: If there are any data outside the latest 512 bars for a symbol, the data will be downloaded automatically up to the lastavailable bar. This can cause sharp increase of incoming traffic.
Modeling methodsHistory data are saved in the terminal only as bars and represent records appearing as TOHLCV (HST format). These data can be usedfor modeling of price changes at testing experts. In some cases, such information is not enough for testing. For example, for the dailytimeframe, price changes within a bar can result in triggering of the expert. At the same time, no triggering can occur at testing. Inother words, testing an expert based on only bars can be inaccurate and give a false idea about the expert efficiency.
Terminal allows to test experts by various methods of history data modeling. Using history data from smaller periods, it is possible tosee price fluctuations within bars, i.e., price changes will be emulated more precisely. For example, when an expert is tested on one-hour data, price changes for a bar can be modeled on one-minute data. Thus, modeling brings history data near the real pricefluctuations and makes expert testing more authentic.
One of three history data modeling methods can be chosen for testing:· Open prices only (fastest method to analyze the bar just completed)
Some mechanical trading systems do not depend on properties of modeling within a bar, they trade on completed bars. The bar iscompleted if the next one has appeared. These are such experts for which this modeling method was developed. In this mode, the bar opening is modeled first (Open = High = Low = Close, Volume=1) what allows the expert to identify thecompletion of the preceding bar precisely. It is this incipient bar that is used to start testing the expert. At the next step, the fullycompleted current bar will be given, but no testing is performed on it!
· Control points (based on the nearest less timeframe with fractal interpolation of 12 control points)The control points modeling method is intended for a crude estimate of experts efficiency that trade within the bar. The history dataof the nearest less timeframe must be available to apply this method. In the most cases, the available data of the less timeframe donot completely cover the time range of the timeframe under test. If the data of the less timeframe are missing, the further bardevelopment will be generated on close prices of 12 preceding bars. It means that the changes within the bar are the same as thoseof price within the last 12 periods. It is fractal interpolation. As soon as history data of the less timeframe appear, fractal interpolation will be applied to these new data. But there will be used not12, but just 6 preceding bars. It means that really existing Open, High, Low, Close prices are reproduced, and two generated pricesmore. Values and locations of these two generated prices depend on that on 6 preceding bars.
· Every tick (based on all available least timeframes with fractal interpolation of every tick)This is the most accurate method of modeling prices within a bar. Unlike that of "control points", this method uses for generation notonly data of the nearest less timeframe, but also those of all available nearest timeframes. At that, if there are data of more thanone period for the same timeframe at the same time, the data of the least timeframe will be used for modeling. Like in the precedingmethod, control points are generated by fractal interpolation. It is also used for modeling of price changes between control points. Itis possible that several similar ticks are modeled one after another. In this case, the doubled quotes will be filtered out, and thevolume of the last of them will be fixed. One has to consider the possible large amount of tick data modeled. This can influence the consumed resources of the operationsystem and testing speed.
Attention:· it is not recommended to launch testing on every tick if there are no available less timeframes that completely cover the period
under test, otherwise, the results will not be accurate;· modeling on control points is basically used at optimization of experts, and all ticks modeling is for a close testing.
Time RangeThe range of dates allows to test experts not on all available data, but within a certain time space only. This can be useful if there is aneed to test a certain part of history data. Date range can be used not only for expert testing, but also for modeling of the testingsuccession of bars (file of data modeled to be used for testing). It is often no need to model data of the entire history, especially forevery-tick modeling where the amount of unused data can be very large. That is why, if data range was allowed to be set at the initialmodeling of testing succession, bars that are beyond this range will not be modeled, but just transcribed into the output succession.The data will not be excluded from the succession in order the correct calculation of indicators on the entire received history to bepossible. It must be noted that the first 100 bars will not be modeled either. This limitation does not depend on the date range defined.
To enable date range limitation, one has to flag "Use date" and specify the necessary values in the fields of "From" and "To". After allsettings have been made, one can press the "Start" button and start testing. After testing has started, the approximate time ofcompleting of this process can be viewed in the lower part of the window.
Attention:· If "Optimization" is disabled, the expert will be tested, not optimized at pressing of the "Start" button;· at optimization, like at testing, one can use one's own history files.
137 / 164
138 / 164
Client Terminal / Auto Trading / Expert Optimization / Results
ResultsAfter optimization has been completed, its results can be viewed in the tabs of "Optimization Results" and "Optimization Graph".
Optimization ResultsUnlike testing, optimization is supposed to perform many passes of the mechanical trading system (MTS) with different inputs. This isaimed at determining of such expert parameters at which its efficiency will be the highest. To optimize an expert, one has to flag"Optimization" in the testing settings tab and press "Start". After that, two new tabs will appear in the window: "Optimization Results"and "Optimization Graph".
There are not all operations listed in the tab of "Optimization Results", unlike that of testing results, but only final reports about eachpass. The entire information is represented as a table with the following fields:· Pass — the pass number;· Profit — the pure profit (gross profit minus gross loss);· Total trades — the total amount of open trade positions;· Profit factor — ratio between gross profit and gross loss in per cents. One means that these values are equal;· Expected payoff — mathematical expectation of win. This value to be calculated statistically represents the average profit/loss
factor of one trade. It can also be considered to represent the expected profit/loss factor of the next trade;· Drawdown $ — the largest drawdown related to the initial deposit, in the deposit currency;· Drawdown % — the largest drawdown related to the initial deposit, in per cents;· Inputs — changeable values of inputs at each pass.
Having clicked with the left mouse button on any column header, one can sort out all records in the table in increasing or decreasingorder. At execution of the "Set Input Parameters" context menu command, the data of the selected pass will be written as the expertbasic inputs (expert properties window, "Inputs" tab). At that, it will be switched to the "Settings" tab, and the optimization will bedisabled. Having pressed the "Start" button, one can start to test the expert with the selected inputs. Double click with the left mousebutton on the pass line in the Optimization Results tab allows to do the same. Using the "Copy" context menu command or acceleratingkeys of Ctrl+C, one can copy the selected results lines to the clipboard for further use in other applications. If no line has been selected,the entire table will be copied to the clipboard. To do the same, one can also execute the "Copy All" command. The report aboutoptimization results can be saved on the hard disk as an HTML file. To do so, one has to execute the "Copy As Report" context menucommand. Other context menu commands allow to set up representation of results:· Skip Useless Results — show/hide the results of unprofitable passes;· Show Input Parameters — show/hide the "Inputs" column;· Auto Arrange — arrange the column sizes automatically when the window size has been changed.
The same action can be done by pressing of A;· Grid — show/hide grid to separate the columns.
The same actions can be done by pressing of G.
Optimization Graph
The graph of profit of all passes is drawn automatically in the "Optimization Graph" tab. The graph allows to estimate the profitabilityof the use of different inputs combinations visually. The graph representing the amount of profitable (green color) and unprofitable (redcolor) trades at each pass is given in the bottom of the window, as well.
Double click with the left mouse button on any point of the graph switches to the "Optimization Results" tab and selects thecorresponding pass. Using the "Copy" context menu command or accelerating keys of Ctrl+C, one can copy the graph to the clipboard tobe used in other applications. The graph can also be stored on the hard disk as a GIF file. To do so, one has to execute the "Save asPicture" context menu command or press accelerating keys of Ctrl+S.
139 / 164
Client Terminal / Auto Trading / Custom Indicators
Custom IndicatorsCustom indicator is a program independently developed in MetaQuotes Language 4 by the user and functioning as a technical indicator.Technical indicator is a mathematical transformation of security price and/or volume in order to forecast future price changes. The useof indicators allows to answer the question about whether the current trend will remain the same and where it will turn. Indicators areintended for relative simplifying of the complicated process of trading decision making. Algorithms of indicators are also used fordevelopment of trading tactics and expert advisors.
Attention: Custom indicators are intended only for analyzing of symbol price changes, but not for trading itself.
Working with custom indicators means:· Creation of an Indicator
To create and compile custom indicators, one has to use the built-in "MetaEditor". It is a constituent of the client terminal andrepresents a convenient development environment of MQL4 programs.
· Indicator SetupBefore using of custom indicators, one has to set them up first. Working parameters common for all indicators are defined in thewindow of client terminal settings. Besides, every indicator can have its own settings.
· Imposing of an IndicatorParameters of the indicator are calculated and the indicator itself is drawn when imposed into the chart.
· Deletion of an IndicatorIf there is no need of an indicator anymore, the indicator can be deleted from the chart.
140 / 164
Client Terminal / Auto Trading / Custom Indicators / Creation
CreationTo create custom indicators, one has to use MetaQuotes Language 4 (MQL 4) and MetaEditor. To launch the editor, one has to executethe "Create" command of the "Navigator — Custom Indicators" window context menu, or the "Tools — MetaQuotes Language Editor"menu command, or press F4 or the button of the "Standard" toolbar. At creation of the MQL4 program, the Experts Wizard that
allows to create new MQL4 programs will open automatically. "Custom Indicator" must be selected in it as the object to be created, andthe necessary fields must be filled out:· Name — indicator name;· Developer — developer's name;· Link — the developer's web site;· Inputs — the list of indicator inputs. To add a new parameter, one has to press the "Add" button, and for deletion, one has to press
the "Delete".
Then it is necessary to decide whether the new indicator will be created in a separate sub-window and what range it will have. Besides,it is necessary to define the amount and parameters of the indicator arrays. Values of their elements are used to draw lines in the chart.In other words, when indicator arrays are defined, the lines of the future indicator are defined, too. After that, the window of the newindicator with the defined settings will open. A file with the source code (*.MQ4) of the indicator will be placed into the/EXPERTS/INDICATORS folder of the client terminal automatically. From this point onwards, one can start to write the text of the customindicator.
After the indicator has been developed, it must be compiled. To do so, one has to execute the "File — Compile" editor menu command,press F9 or the button of the toolbar. After the indicator has been successfully compiled, an executable program file with *.EX4extension will be created to be automatically placed into the /EXPERTS/INDICATORS folder. The list of custom indicators can be viewedin the "Navigator — Custom Indicators" window of the client terminal.
Modifying of Custom IndicatorsTo start modifying of the existing indicator from terminal, one has to execute the "Modify" command of the "Navigator — CustomIndicator" window context menu. At that, the MetaEditor will open where the selected indicator source code has already beendownloaded. After this code has been changed, one will have to recompile it and get a new executable EX4 file. Otherwise, the previous,non-modified version of the indicator will be used in the terminal.
Attention: If the indicator has been compiled with errors, it is impossible to attach it to the chart. At that, the indicator propertieswindow will not appear, and a record about impossibility to open a file with an executable code will appear in the experts journal.
141 / 164
Client Terminal / Auto Trading / Custom Indicators / Setup
SetupIndicators must have been set up before they are used. Working parameters common for all custom indicators (and experts) are set upin the client terminal settings. The corresponding window can be opened by the "Tools — Options" menu command or by pressing ofaccelerating keys of Ctrl+O. To set up working parameters of indicators, one has to select the "Expert Advisors" tab. Only two optionsinfluence working of custom indicators:· Allow DLL imports
Custom indicators can use DLLs to enlarge their functionalities. If this option is enabled, the libraries can be used without anylimitations. Disabling of the option results in that no MQL4 program can use any external DLLs.
· Allow external experts importsIf there is a need to export functions from other experts or MQL4 libraries during the indicators work, this option must be enabled. Ifit is disabled, no launched indicator will be able to request for functions from other MQL4 programs.
142 / 164
Client Terminal / Auto Trading / Custom Indicators / Attaching to Chart
Attaching to ChartAfter general setup has been completed, one can attach custom indicators to the chart. A custom indicator can be imposed into theactive chart by a double click with the left mouse button on it in the "Navigator — Custom Indicators" window or by execution of thecontext menu command "Attach to a chart". The "Drag'n'Drop" technique allows to impose the analytical tool into any chart. At that, thesetup window will appear automatically that has several tabs:· Common
Import from DLLs and MQL4 can be managed in the "Common" tab. Besides, if indicator is drawn in a separate window, one can set upits range from here. To do so, one has to flag the corresponding options and set the desired values in the fields.
· InputsExternal variables that can be managed directly from the terminal are grouped in the "Inputs" tab. To modify the desired variable, onehas to double-click on its value in the table and write a new one.
· ColorsThe "Colors" tab is intended for managing the indicator elements to be shown in the screen. Besides colors, one can also modifythickness and style of lines.
· LevelsHorizontal lines at any level can be set from the "Levels" tab in the indicator window. To create a new level, one has to press the "Add"button, and to delete it, one has to press the "Delete" button. Colors, thickness and style of levels can also be changed from this tab.
Attention: This tab is not available for indicators drawn directly in the price chart.
· VisualizationOne can limit the use of an indicator by timeframes in the "Visualization" tab. This can be useful if the same indicator must havedifferent settings for different timeframes. One can, for example, impose two copies of the same indicator with different settingsinto the same chart and limit their use by timeframes: the first indicator will work only for smaller timeframes, and the second onewill do for larger timeframes. The "Show in the Data Window" option allows to hide/show data about the given indicator in the DataWindow.
Immediately after that, recalculation if the indicator values and drawing thereof in the chart will start. Custom indicators, like technicalones, can be drawn in a separate indicator window with its own vertical scale (for example, MACD) or imposed directly into the pricechart (for example, Moving Average).
143 / 164
Client Terminal / Auto Trading / Custom Indicators / Remove
RemoveTo shut down an indicator, one has to remove it from the chart. At that, its drawing and recalculation of its values will stop. To removean indicator from the chart, one has to execute its context menu commands of "Delete Indicator" or "Delete Indicator Window", or thechart context menu command of "Indicators List — Delete".
Attention: Removing of a custom indicator from the "Navigator" window will not shut down the indicator of the same name imposedin the chart.
144 / 164
Client Terminal / Auto Trading / Scripts
ScriptsScript is a program written in MetaQuotes Language 4 (MQL 4) and intended for a single performing of any actions. A script can fulfilboth analytical and trading functions. Unlike experts, scripts are executed on request, not by ticks. In other words, where an expertworks almost continuously, a script, having completed the function once, stops functioning by itself.
Working with scripts means:· Creation of a Script
The built-in "MetaEditor" is used to create and compile a script. It is a constituent of the client terminal and represents a convenientdevelopment environment of MQL4 programs.
· Script SetupOne has to set up scripts first before using them. Working parameters common for all scripts are defined in the client terminal setupwindow. Every script has its own settings, as well.
· Launching of a ScriptTo launch a script, one has to attach it to the chart. The script algorithm will be launched immediately after that.
· Deletion of a ScriptThe script completes its working after it has been deleted from the chart.
145 / 164
Client Terminal / Auto Trading / Scripts / Creation
CreationTo create a script, one has to use MetaQuotes Language 4 (MQL 4) and MetaEditor. To launch the experts editing program, one has toexecute the "Create" command of the "Navigator — Scripts" window context menu, or the "Tools — MetaQuotes Language" menucommand, or press F4 or the button of the "Standard" toolbar. At an MQL4 program creation, Expert Creation Wizard will open
automatically that allows to create new MQL4 programs promptly. "Script" must be selected in it as the object to be created, and allnecessary fields must be filled out:· Name — script name;· Developer — developer's name;· Link — the developer's web-site.
After that, the new script window will open in the editor. File containing the script source code (*.MQ4) will be placed into the/EXPERTS/SCRIPTS folder of the client terminal automatically. Then one can start to write the source code of the program.
After the script has been created, it must be compiled. To do so, one has to execute the "File — Compile" menu command in the expertseditor, press F5 or the button in the toolbar. After the script has been successfully compiled, the executable file with *.EX4 extensionwill be created and placed into the /EXPERTS/SCRIPTS folder automatically. The list of all scripts can be viewed in the "Navigator —Scripts" window of the client terminal.
Editing of ScriptsTo start editing of the existing script from the terminal, one has to execute the "Modify" command of the "Navigator — Scripts" windowcontext menu. At that, the experts editor with the selected script source code already downloaded will open. After the source code hasbeen modified, one has to recompile it and get a new executable EX4 file. Otherwise, the previous, non-modified version of the MQL4program will be used in the terminal.
146 / 164
Client Terminal / Auto Trading / Scripts / Setup
SetupBefore starting to use scripts, one has to set them up. Working parameters common for all scripts are stated in the terminal settingswindow. This window can be opened by the "Tools — Options" menu command or by pressing of accelerating keys of Ctrl+O. To set upscript parameters, one has to open the "Expert Advisors" tab. Only five options influence the operation of scripts:· Allow live trading
Like experts, scripts can work in automated mode. They can both analyze price changes and trade. This option is intended forlimiting of trading functions of scripts and expert advisors.
· Ask manual confirmationThe "Ask manual confirmation" option is only activated if scripts are allowed to trade. If this option is enabled and the script tries toperform a trade operation, one will be able to either confirm it or stop it manually. In other words, manual confirmation allows tocontrol over trading activities of experts and scripts.
· Allow DLL importsTo have their functionalities enlarged, scripts can use DLLs. If this option is enabled, the libraries can be used without anylimitations. If this option is disabled, no script will be able to use any external DLLs.
· Confirm DLL function callsThis option can only be enabled if DLLs are allowed to be imported. It assist to control over each called function execution manually. Ifit is disabled, import from external libraries will not be controlled.
· Allow external experts importsIf, at the script operation, there is a need to import functions from other expert or MQL4 libraries, this option must be enabled. If itis disabled, no script will be able to call functions from other MQL4 programs.
147 / 164
Client Terminal / Auto Trading / Scripts / Launch
LaunchAfter general parameters have been set up, the script can be launched. To do so, it is enough just to attach it to the chart. At that, ofthere is a "#property show_inputs" instruction in the program source code, the script setup window will appear automatically. In the"Common" tab of this window, one can:· Positions — select direction of position opening:· Long&Short — both long and short;· Only Long — only to buy;· Only Short — only to sell.
· Enable alerts — enable/disable script alerts;· Disable alert once hit — disable alerting after the first alert has been made;· Allow live trading — enable/disable live trading;· Ask manual confirmation — request for manual confirmation of position opening when performing trade operations;· Allow DLL imports — enable/disable importing of functions from DLL files;· Confirm DLL function calls — request for confirmation at each call of functions from DLL files;· Allow import of external experts — enable/disable calling of functions from external experts.
External variables of the script can be changed in the "Inputs" tab. They are variables of extern class. To change a parameter, one has todouble-click with the left mouse button on its value and write the new one. At that, one can change the value of each variable ordownload the set of inputs already saved before (the "Load" button). One can save the current set of inputs with the button of the samename.
The "Reset" button returns all default settings. Parameters defined in the terminal settings are set in the "Common" tab. Andparameters set in the source code of the program are defined as inputs. The script with the defined parameters can be confirmed bypressing of "OK" and canceled by pressing of button of the same name.
Attention: Unlike those of experts or custom indicators, special properties of the script are set only at its launch.
Script will be launched immediately after that. Double click with the left mouse button on the selected script in the "Navigator — Scripts"window or execution of the "Execute on Chart" command of the script context menu will attach the script to the active chart. The"Drag'n'Drop" technique will allow to attach the script to any chart. If the "Remove Script" command appears in the chart context menu,it means that script is working. This command is active only while this MQL4 program is working.
Attention: Only one script can be attached to a chart.
148 / 164
Client Terminal / Auto Trading / Scripts / Shutdown
ShutdownNormally, a script shuts down by itself. But it can be removed manually. At that, it must be deinitialized first and then rolled out fromthe memory. To remove a script from the chart, one has to execute the chart contest menu "Remove Script" command or attach anotherscript to the chart. Besides, a script will be removed from the chart after symbol or timeframe has been changed.
Attention:· all scripts will be removed after terminal has been shut down;· removing of script from the "Navigator" window will not shut down the MQL4 program of the same name imposed in the chart.
149 / 164
Client Terminal / Tools
ToolsThis section describes various service features of the client terminal:· Configuration at Startup· History Center· Export of Quotes· Global Variables· Contract Specification· Languages Support· Datacenter.ini
150 / 164
Client Terminal / Tools / Configuration at Startup
Configuration at StartupThe client terminal can be launched with some predefined settings. For this purpose, the configuration file name will be passed to theclient terminal as a parameter.
If the full path to the file (Drive:\SubDirectory\FileName) is not given, the file will be searched for in the client terminal directory. Theconfiguration file contains lines of the following appearance:
[Parameter] = [Value]
Comments start with a semicolon (;) and are not processed.
The configuration file parameters can be divided into several groups: common settings, proxy server settings (the "Server" tab in theterminal settings), FTP settings (the "Publisher" tab in the server settings), EA settings (the "Expert Advisors" tab in the serversettings), the expert or script single-launch settings, settings of the Strategy Tester launch.
Common Settings· Profile — the subdirectory name in the /profiles directory. The charts will be opened in the client terminal according to the given
profile. If this parameter is not specified, the current profile will be opened.· MarketWatch — file name (the \symbolsets directory) that contains the symbol list to be shown in the Market Watch window. A file
like this can be obtained using the window context menu command of the "Market Watch - Sets - Save As...".· Login — the number of the account to connect to at startup. If this parameter is not specified, the current login will be used.· Password — the password that allows entering the system. This parameter will be ignored if the client terminal stores personal data
on the disk and the account to be connected is in the list.· Server — the name of the trade server to be connected to. The server name is the same as the name of the corresponding .srv file
stored in the /config directory. This parameter will be ignored if the information about the account to be connected was stored on thedisk.
· AutoConfiguration — "true" or "false" depending on whether the autoconfiguration of Data Center setting should be enabled or not. Ifthis parameter is not specified, the value from the current server settings will be used.
· DataServer — address of the data center. This record can be ignored if the server autoconfiguration s enabled. If this parameter isnot specified, the value from the current server settings will be used.
· EnableDDE — "true" or "false" depending on whether DDE server should be enabled or not. If this parameter is not specified, the valuefrom the current server settings will be used.
· EnableNews — "true" or "false" depending on whether receiving of news should be allowed or not. If this parameter is not specified,the value from the current server settings will be used.
Proxy Server Settings· ProxyEnable — "true" or "false" depending on whether or not a proxy server should be used for connection to the trade server.· ProxyServer — proxy server address.· ProxyType — proxy server type.It can be "HTTP", "SOCKS4", or "SOCKS5".· ProxyLogin — login to be authorized on proxy server.· ProxyPassword — password to access to proxy server.
If any of the above parameters are not specified, the current settings of the client terminal are used (proxy settings in the "Server" tabof the client terminal settings).
FTP Settings· FTPEnable — enable/disable publishing. The possible values are "true" or "false".· FTPPassiveMode — enable/disable the passive mode of data transfer. The possible values are "true" or "false".· FTPAccount — the number of the account the state of which to be sent to the FTP.· FTPServer — FTP server address.· FTPLogin — the login for authorization on the FTP server.· FTPPassword — the password to access to the FTP server.· FTPPath — the name of the FTP server directory in which the report is placed.· FTPPeriod — the periodicity, in minutes, of the reporting to the FTP server.
If any of the above-listed parameters are not specified, the current client terminal settings are used (the "Publisher" tab in the serversettings).
EA Settings· ExpertsEnable — enable/disable experts.· ExpertsDllImport — enable/disable DLL imports.· ExpertsDllConfirm — enable/disable manual confirmation of DLL-functions calling.· ExpertsExpImport — enable/disable import of functions from external experts or MQL4 libraries.· ExpertsTrades — enable/disable the experts trading.· ExpertsTradesConfirm — enable/disable manual confirmation of the trade operation performed by the expert.
Attention: All parameters of an experts group can take values of either "true" or "false".
If any of the above-listed parameters is not specified, the current client terminal settings will be used (the "Expert Advisors" in theserver settings).
The Expert and/or Script Single-Launch Settings· Symbol — the symbol of the security the chart of which should be opened immediately after the terminal startup. After the client
terminal has been closed, the information about this extra chart is not saved. At the terminal restart, without the configuration file,this chart will not be opened. If this parameter is not specified, no extra chart will be opened.
152 / 164
· Period — the chart timeframe (M1, M5, M15, M30, H1, H4, D1, W1, MN). If this parameter is not specified, H1 is used.· Template — the name of the template file (the \templates directory), which should be applied to the chart.· Expert — the name of the expert that should be launched after the client terminal has started. The expert is launched in the chart,
which has been opened according to the data specified in Symbol and Period. If the Symbol parameter has not been not specified, noextra chart opens, and the expert will be launched in the first chart of the current profile. If there are no charts in the current profile,the expert will not be launched. If this parameter has not been specified, no expert is launched.
· ExpertParameters — the name of the file containing the expert parameters (the \experts\presets directory). This file can be createdin the expert properties window by pressing of the "Inputs - Save" button. It is normally used to save the inputs other than the defaultones. If this parameter has not been specified, the default inputs are used.
· Script — the name of the script, which must be launched after the client terminal startup. The script is launched according to thesame rules that are eligible for the expert (described above).
· ScriptParameters — the name of the file containing the script parameters (the \experts\presets directory). This file is made in thesame way as that for the expert.
Example:
; open chart and run expert and/or script Symbol=EURUSD Period=H4 Template=popular.tpl Expert=MACD Sample ExpertParameters=macd.set Script=period_converter ScriptParameters=
Settings of the Strategy Tester Launch· TestExpert — the name of the expert to be launched for testing. If this parameter has not been specified, no testing is launched.· TestExpertParameters — the name of the file containing parameters (the \tester directory). The file can be created in the Properties
window of the expert under test by clicking the "Inputs - Save" button. It is normally used to save parameters other than the defaultones. Other parameters of the expert under test in the "Testing" and "Optimization" tabs (as well as in the "Inputs" tab if thisparameter has not been specified) are filled up with the values automatically saved in the \tester\[the expert name].ini file after thelatest test.
· TestSymbol — the name of the symbol used for the expert testing. If this parameter has not been specified, the latest value used inthe tester is used.
· TestPeriod — the chart period (M1, M5, M15, M30, H1, H4, D1, W1, MN). If this parameter has not been specified, H1 is used.· TestModel — 0, 1, or 2, depending on the testing model (Every tick, Control points, Open prices only). If this parameter has not been
specified, 0 is used (Every tick).· TestOptimization — enable/disable optimization. The values that can be taken are "true" or "false". If this parameter had not been
specified, the "false" value is used.· TestDateEnable — enable/disable the "Use date" flag. The values that can be taken are "true" or "false". If this parameter had not
been specified, the "false" value is used.· TestFromDate — the date, from which to start testing, appeared as YYYY.MM.DD. If this parameter has not been specified, this date
is 1970.01.01.· TestToDate — the date, on which to finish testing, appeared as YYYY.MM.DD. If this parameter has not been specified, this date is
1970.01.01.· TestReport — the name of the test report file. The file will be created in the client terminal directory. A relative path can be specified,
for example: tester\MovingAverageReport". If the extension has not been specified in the file name, the ".htm" will be setautomatically. If this parameter has not been specified, the test report will not be formed.
· TestReplaceReport — enable/disable the repeated report file record. The values that can be taken are "true" or "false". If the "false"value is specified and a report file named in the same way exists already, the number in square brackets will be added to the filename. For example, "MovingAverageReport[1].htm". If this parameter had not been specified, the "false" value is used.
· TestShutdownTerminal — enable/disable shutdown of the terminal after the testing has been finished. The values that can be takenare "true" or "false". If this parameter had not been specified, the "false" value is used. If the user has pressed the "Stop" button, thevalue of this parameter will be flushed to "false" since the control has been given to the user.
History CenterTechnical analysis is the market movements research made in order to forecast future price movements. the market is often analyzedusing charts. So it is very important to have available historical data for all symbols and timeframes used. Historical data are constantlyformed and stored on the server. Connecting to it, the client terminal downloads all necessary data. They will be then used for drawingof charts,testing and optimization of Expert Advisors. To control historical data, the terminal has a special window named "HistoryCenter". This window can be opened by executing the command "Tools — History Center" or by pressing F2.
After the terminal has been shut down, all accumulated historical data will be stored in the "History Center". Sizes of files containinghistorical quotes do not exceed values defined in settings. If the amount of historical data accumulated exceeds the value set in thefield of " Max. bars in history:", the oldest bars will be deleted when storing. For each timeframe, a separate history file is formednamed as SSSSSSPP.hst (where SSSSSS - symbol name, PP - timeframe in minutes) and saved in the /HISTORY. Later on, the saved datawill be used to draw charts, as well as for testing trading strategies.
In the "History Center" window, the available data can be changed. For this, it is necessary to select the desired symbol and timeframein the left part of the window.The corresponding data will be loaded in form of a table. To add a record about a new bar, it is necessaryto press the button of the same name, fill out all necessary fields in the new window and press "OK". After that, the new bar will appearin the history. One can modify the bar by selecting the corresponding record and pressing the "Modify" button. To delete a bar, it isnecessary to select it and press the button of the same name.
Load of Historical DataIt is possible to load quotes for basic currency pairs starting with year 1999 from the historical data server. To do it, it is necessary toselect the desired symbol and press "Download".
Attention: The loaded data can differ from historical data stored on the broker's trade server.
Upon pressing the button, data of M1 timeframe will be loaded. Other timeframes will be automatically recalculated from М1. At that,the time of the downloaded data will be automatically recalculated according to the active account time zone.
When downloading historical data, it is recommended to control amount of bars in history and in charts.
Attention: The deeper is the history used, the more PC resources are needed.
Quotes are weekly updated on the server of historical data. Further, at restarts, only updated quotes will be downloaded.
Exports and Imports of Historical DataHistorical data can be exported into files formatted as CSV, PRN and HTM. For this, it is necessary to select the desired symbol in theleft part of the "History Center" window and press "Export". Then it is necessary to select on of three file formats and specify the pathof location on the hard disk.
Historical data as CSV, PRN, TXT, HTM and HST can also be imported into terminal.
Historical data in the file can be represented as follows (any other separator can be used instead of space):· YYYY.MM.DD HH:MM O H L C V· YYYY-MM-DD HH:MM O H L C V· YYYY/MM/DD HH:MM O H L C V· DD.MM.YYYY HH:MM O H L C V· DD-MM-YYYY HH:MM O H L C V· DD/MM/YYYY HH:MM O H L C V
First of all, it is necessary to select a symbol and a timeframe, for which the import will be performed, in the left part of the "HistoryCenter" window. Then it is necessary to set up import parameters by pressing "Import":· Separator — data separator in the file to be imported. Comma, semicolon, space or tabulation character can be used as separators;· Skip columns — skip columns when importing. This can be helpful when the imported file contains more data types than necessary;· Skip lines — skip rows (lines) when importing;· Time shift — shift data by several hours in time;· Selected only — import only selected data. Data are selected by lines using "Ctrl" and "Shift";· Volumes — enable/disable importing of volumes.
After historical data have been imported, they can be used to show charts and test Expert Advisors.
Historical File Format (HST Files)
155 / 164
The database header is the first
struct HistoryHeader{ int version; // database version char copyright[64]; // copyright info char symbol[12]; // symbol name int period; // symbol timeframe int digits; // the amount of digits after decimal point in the symbol time_t timesign; // timesign of the database creation time_t last_sync; // the last synchronization time int unused[13]; // to be used in future};
then goes the bars array (single-byte justification)
#pragma pack(push,1)//---- standard representation of the quote in the databasestruct RateInfo{ time_t ctm; // current time in seconds double open; double low; double high; double close; double vol;};#pragma pack(pop)
156 / 164
Client Terminal / Tools / Export of Quotes
Export of QuotesSource data serving as a basis for the entire analytical work of the terminal user are those about security price changes. Thisinformation is provided by the brokerage company. Price data allow to draw symbol charts, research in financial markets, use varioustrading tactics, and make trade decisions. Quotes represent files with records in format of "SYMBOL, BID, ASK, DATE" (security symbol,bid price, ask price, date and time) and income in the terminal automatically as soon as connection to the server has been established.
The terminal allows to export the current quotes to other programs in the real-time mode through "DDE" (Dynamic Data Exchange)protocol. This is a protocol of operational systems of MS Windows used for dynamic data exchange among various applications. Quotesare given through DDE only at incoming of new ticks (ADVISE mode), but not immediately on request (REQUEST mode) where the latestprice is shown. N/A is shown on the first REQUEST, and after the new price has been income, quotes will appear.
To activate the export of quotes from the terminal through DDE, one has to enable the "Enable DDE server" option in the terminalsettings.
Attention: History Data cannot be exported through DDE protocol. The current quotes are exported only when the client terminal isonline.
DDE request formats and their possible results by the example of "DDE-sample.xls" file:
Attention: For data to be shown properly in MS Excel, one has to enable "Tools — Options... — Translation — Translation formulaentry" menu option of MS Excel.
157 / 164
Client Terminal / Tools / Global Variables
Global VariablesSeveral experts can be launched in the client terminal at the same time. Sometimes, there is a need them to interchange withinformation. To provide possibility of prompt transfer of moderate amounts of information among experts, as well as organize conflict-free simultaneous working of several experts, there are global variables in the terminal. Unlike variables claimed at a global level in theexpert source code and available only within the corresponding module, global variables exsist independently on experts. Their valuesare saved between terminal launches, unlike those of variables claimed at a global level (they are set at every expert launch and lost atexpert remove). Global variables are available within four weeks since their last call from experts or manual modifying.
There is a special window in terminal that manages global variables. It can be opened by execution of the "Tools — Global Variables"menu command or by pressing of F3. All global variables, their values and times of their last calls are listed in a table in this window.Using buttons located in the right part of the window, one can add a new global variable or delete an existing one. To change the nameor value of a global variable, one has to double-click with the left mouse button on the corresponding cell of the table. The last call timewill be changed automatically for this variable.
158 / 164
Client Terminal / Tools / Contract Specification
Contract SpecificationThis message window allows to view securities contract specifications. The main parameters are grouped in table with following fields:· Spread — difference between Bid and Ask prices in points;· Digits — the amount of digits after decimal point in the price representation;· Stops level — minimum distance to the current price in points at which Stop Loss and Take Profit orders can be placed;· Pendings are good till cancel — forced closing of pending orders at the end of a session. "Yes" means that pending orders will not be
closed forcedly;· Contract size — one-lot price in deposit currency;· Tick price — the size of minimal price change in quote currency;· Tick size — minimal symbol price change interval in points;· Profit calculation mode — accepted profit calculation technique (Forex, CFD, Futures);· Swap type — rollover calculation type (in points, in deposit currency, or in per cents);· Swap long — rollover size for a long position;· Swap short — rollover size for a short position;· Margin calculation mode — accepted free margin calculation technique (Forex, CFD, Futures)· Margin hedge — size of margin for hedged positions.
The symbol specification window can be called by pressing of "Properties" button in the Market Watch window or the "Symbol properties"of the "Tester — Settings" window.
159 / 164
Client Terminal / Tools / Languages Support
Languages SupportThe Client Terminal interface is multilingual. It can be represented in any available language. This feature makes the program not onlyeasy-to-use, but also allows to reduce the amount of errors that occur during trading because of lack of understanding of foreign termsand notions. The list of all available languages can be found in the "View — Languages" menu. One can switch one's terminal to alanguage by selecting of this language in the list. The language can be changed actually only after restart of the terminal.
160 / 164
Client Terminal / Tools / Datacenter.ini
Datacenter.iniAdministrators of dealing centers who would like to redirect the clients' traffic forcedly have a new opportunity now. The Data Centerused by the client terminal can be strictly defined using the configuration file named datacenter.ini. This file must be placed in the/config directory of the client terminal.
If the "Data Center auto configuration" is flagged in the server settings, there will be an attempt to open and analyze the datacenter.inifile. If a data center for the server will be found in this file, the connection will be performed exactly to it. No more than one datacenter can be defined for one server.
The string format of the datacenter.ini:
[server name][delimiter][data center address]
where:· server name is the name of the corresponding .srv file;· delimiter is a comma or any quantity of spaces;· data center address is the IP address : port number.
Lines that start with a semicolon (;) are considered to be a comment and are not processed.
ArticlesIn this section you can find links and short descriptions articles dedicated to working with the client terminal.· Common· Tester
162 / 164
Client Terminal / Articles / Common
CommonForex Trading ABC
Working on financial markets represents, first of all, trade operations. We all, starting from the very childhood, have anintuitive idea of what is to buy and to sell. But Forex trading is still something special. This article deals with the ideasnecessary to explain some terms. We will also consider the MQL 4 functions that correspond with those terms.
Secrets of MetaTrader 4 Client Terminal21 way to ease the life: Latent features in MetaTrader 4 Client Terminal. Full screen; hot keys; Fast Navigation bar;minimizing windows; favorites; traffic reduction; disabling of news; symbol sets; Market Watch; templates for testing andindependent charts; profiles; crosshair; electronic ruler; barwise chart paging; account history in the chart; types ofpending orders; modifying of StopLoss and TakeProfit; undo deletion; chart print.
Secrets of MetaTrader 4 Client Terminal: Alerting SystemHow to be aware of what happens in the terminal and on your account without permanent looking at the monitor. Systemevents; custom events; wave and executable files; electronic messages; setting up SMTP server access; publications;setting up FTP server access.
Secrets of the MetaTrader 4 Client Terminal: IndicatorsAre you going to write your own indicator? Perhaps you will find that what you need among indicators already embedded inthe client terminal. So why to reinvent the wheel? A summary table of integrated indicators' characteristics; specialfeatures and methods of attaching indicators to a chart; building of levels; displaying of indicators on differenttimeframes.
Secrets of MetaTrader 4 Client Terminal: File Library in MetaEditorWhen creating custom programs, code editor is of great importance. The more functions are available in the editor, thefaster and more convenient is creation of the program. Many programs are created on basis of an already existing code.Do you use an indicator or a script that does not fully suit your purposes? Download the code of this program from ourwebsite and customize it for yourselves.
163 / 164
Client Terminal / Articles / Tester
TesterStrategy Tester: Modes of Modeling during Testing
Many programs of technical analysis allow to test trading strategies on history data. In the most cases, the testing isconducted on already completed data without any attempts to model the trends within a price bar. It was made quickly, butnot precisely.
Testing Features and Limits in MetaTrader 4This article allows to find out more about features and limits of Strategy Tester in MetaTrader 4.
What the Numbers in the Expert Testing Report MeanArticle explains how to read testing reports and to interpret the obtained results properly.
testing Expert Advisors in the MetaTrader 4 Client Terminal: An Outward GlanceWhat happens after you have clicked on the "Start" button? The article answers this and many other questions.
Tester in the Terminal MetaTrader 4: It Should Be KnownThe elaborate interface of the terminal MetaTrader 4 is a forefront, but beside this the terminal includes a deep-laid testerof strategies. And while the worth of MetaTrader 4 as a trading terminal is obvious, the quality of the tester's strategytesting can be assessed only in practice. This article shows the advantages and conveniences of testing in MetaTrader 4.