28
User Guide Ethernet out-of service test training exercises MT1000A Network Master Pro MT1100A Network Master Flex
| Date post: | 16-May-2018 |
| Category: |
Documents |
| Upload: | trankhuong |
| View: | 222 times |
| Download: | 2 times |

User Guide
Ethernet out-of service test training exercises
MT1000A Network Master Pro
MT1100A Network Master Flex
1
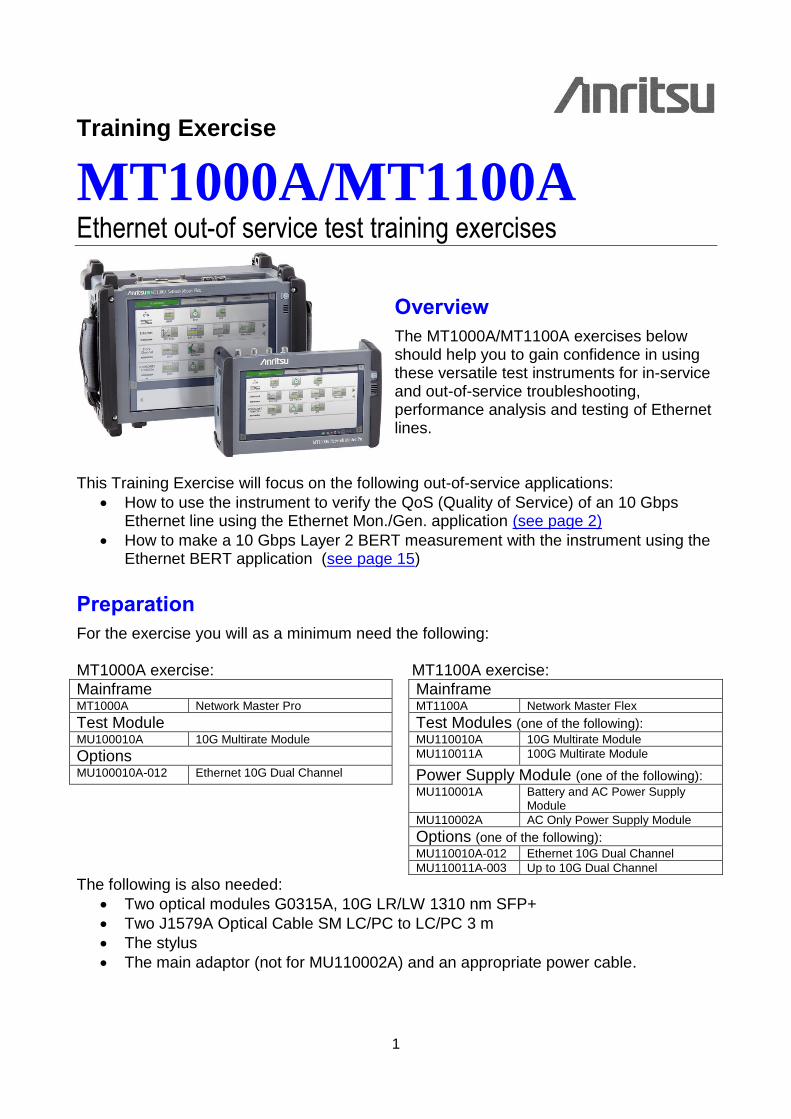
Training Exercise
MT1000A/MT1100A Ethernet out-of service test training exercises
Overview
The MT1000A/MT1100A exercises below should help you to gain confidence in using these versatile test instruments for in-service and out-of-service troubleshooting, performance analysis and testing of Ethernet lines.
This Training Exercise will focus on the following out-of-service applications:
How to use the instrument to verify the QoS (Quality of Service) of an 10 Gbps Ethernet line using the Ethernet Mon./Gen. application (see page 2)
How to make a 10 Gbps Layer 2 BERT measurement with the instrument using the Ethernet BERT application (see page 15)
Preparation
For the exercise you will as a minimum need the following: MT1000A exercise: MT1100A exercise:
Mainframe Mainframe MT1000A Network Master Pro MT1100A Network Master Flex
Test Module Test Modules (one of the following): MU100010A 10G Multirate Module MU110010A 10G Multirate Module
Options MU110011A 100G Multirate Module
MU100010A-012 Ethernet 10G Dual Channel Power Supply Module (one of the following): MU110001A Battery and AC Power Supply
Module
MU110002A AC Only Power Supply Module
Options (one of the following):
MU110010A-012 Ethernet 10G Dual Channel
MU110011A-003 Up to 10G Dual Channel
The following is also needed:
Two optical modules G0315A, 10G LR/LW 1310 nm SFP+
Two J1579A Optical Cable SM LC/PC to LC/PC 3 m
The stylus
The main adaptor (not for MU110002A) and an appropriate power cable.
2
Ethernet QoS verification
This exercise is an out-of-service QoS verification with a multi-stream test of an Ethernet line. The instrument will emulate 3 types of traffic (video, voice and data) with different priority settings. How to set up the instrument for this exercise:
Connect Tx to Rx on the optical module in port 1 with a J1579A optical cable.
Power on the instrument
You will now see the Application Selector screen.
To simplify this procedure the Control Panel tab select the Setting and “Restore Applications Defaults” option.
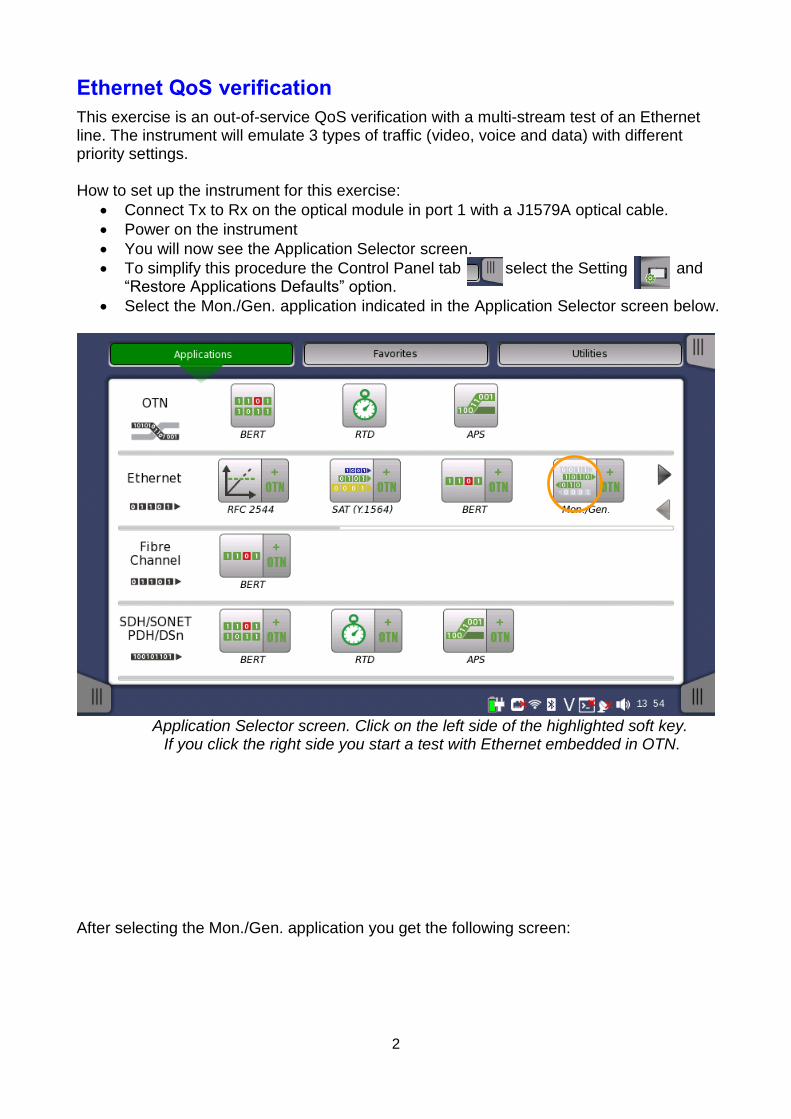
Select the Mon./Gen. application indicated in the Application Selector screen below.
Application Selector screen. Click on the left side of the highlighted soft key. If you click the right side you start a test with Ethernet embedded in OTN.
After selecting the Mon./Gen. application you get the following screen:
3
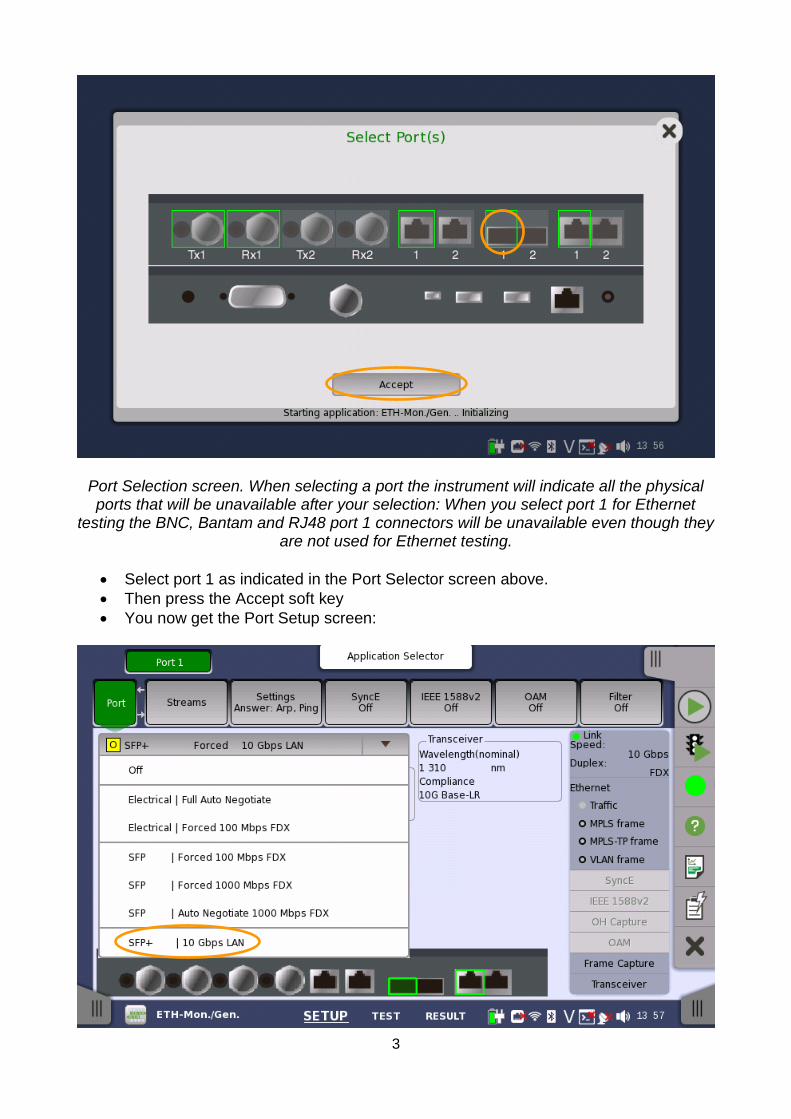
Port Selection screen. When selecting a port the instrument will indicate all the physical ports that will be unavailable after your selection: When you select port 1 for Ethernet
testing the BNC, Bantam and RJ48 port 1 connectors will be unavailable even though they are not used for Ethernet testing.
Select port 1 as indicated in the Port Selector screen above.
Then press the Accept soft key
You now get the Port Setup screen:
4
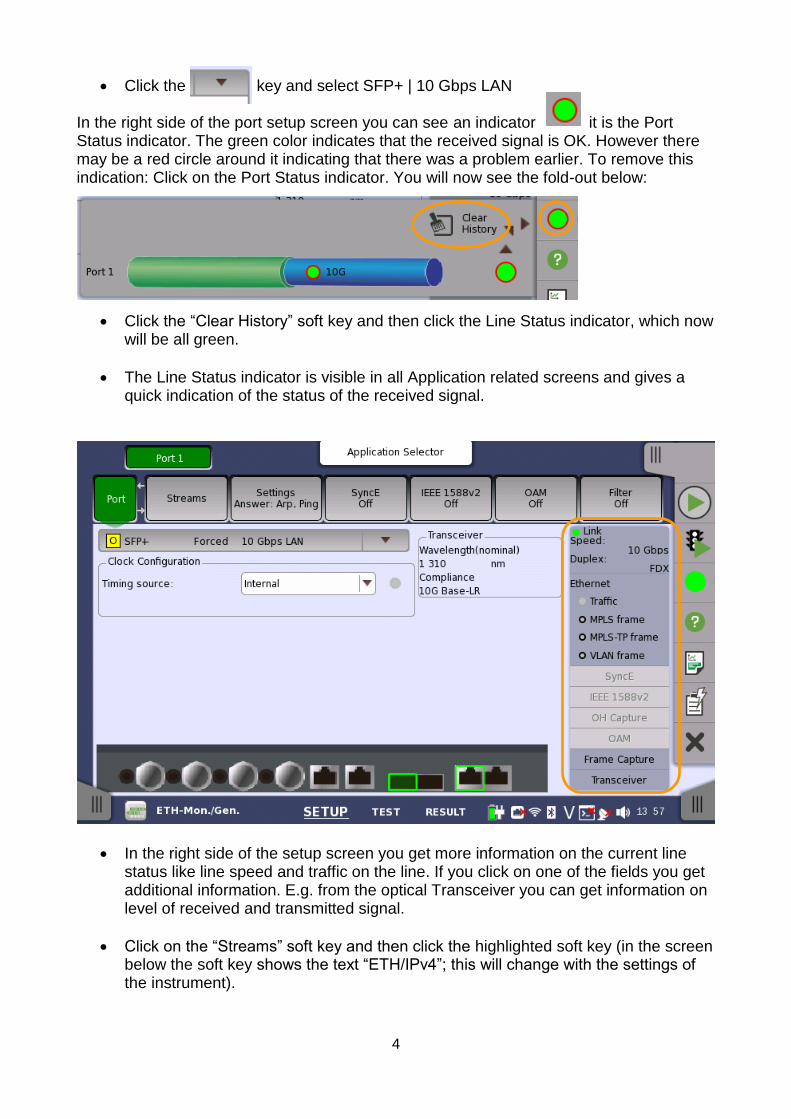
Click the key and select SFP+ | 10 Gbps LAN In the right side of the port setup screen you can see an indicator it is the Port Status indicator. The green color indicates that the received signal is OK. However there may be a red circle around it indicating that there was a problem earlier. To remove this indication: Click on the Port Status indicator. You will now see the fold-out below:
Click the “Clear History” soft key and then click the Line Status indicator, which now will be all green.
The Line Status indicator is visible in all Application related screens and gives a quick indication of the status of the received signal.
In the right side of the setup screen you get more information on the current line status like line speed and traffic on the line. If you click on one of the fields you get additional information. E.g. from the optical Transceiver you can get information on level of received and transmitted signal.
Click on the “Streams” soft key and then click the highlighted soft key (in the screen below the soft key shows the text “ETH/IPv4”; this will change with the settings of the instrument).

5
You now get the Stream Setup screen:
In the Stream Setup screen you can independently configure the protocol structure of each stream; at the bottom of the screen you can see that the MT1000A supports up to 16 streams per port.

6
You can select various layer 2 protocols: MPLS (with up to 8 layers of MPLS labels), MPLS-TP, PBB, VLAN (with up to 8 layers of VLAN tags), LLC1, SNAP, Layer 3 protocols: (IPv4 or IPv6) and Layer 4 protocols: TCP, UDP (or none).
You can set Unicast, Multicast and Broadcast MAC addresses. Unicast and Multicast addresses are distinguished by the least significant bit in the first Dst MAC address – for Unicast the bit is 0, for Multicast the bit is 1. E.g. 00-00-00-00-00-00 in a Unicast address, while 01-00-00-00-00-00 is a Multicast address. You directly specify the % of Broadcast addresses to be included in the transmitted stream.
With the “Variable” soft key you can automatically change a number of consecutive bits in an address field (including VLAN tags and MPLS labels). The screen shot below indicates the capabilities of this function (you can open this page see the function, but except for that this function will not be used in the exercise). Confirm the “Field:” section below is turned “Off” before moving on.
In Ethernet based network VLANs (Virtual Local Area Networks) can be used to distinguish between different types of traffic. Each VLAN gets its own ID and a priority is also assigned to the VLAN. The network will use the priority setting to prioritize the traffic types on a line. The MT1000A multistream function use addresses to distinguish between the streams: MAC addresses, IP addresses and/or VLAN IDs. For this exercise only the VLAN IDs are used to distinguish between the streams – all MAC and IP addresses must be all 0. Please observe that in a real network all 0 MAC and IP addresses must not be used – and source and destination addresses must be different.
7
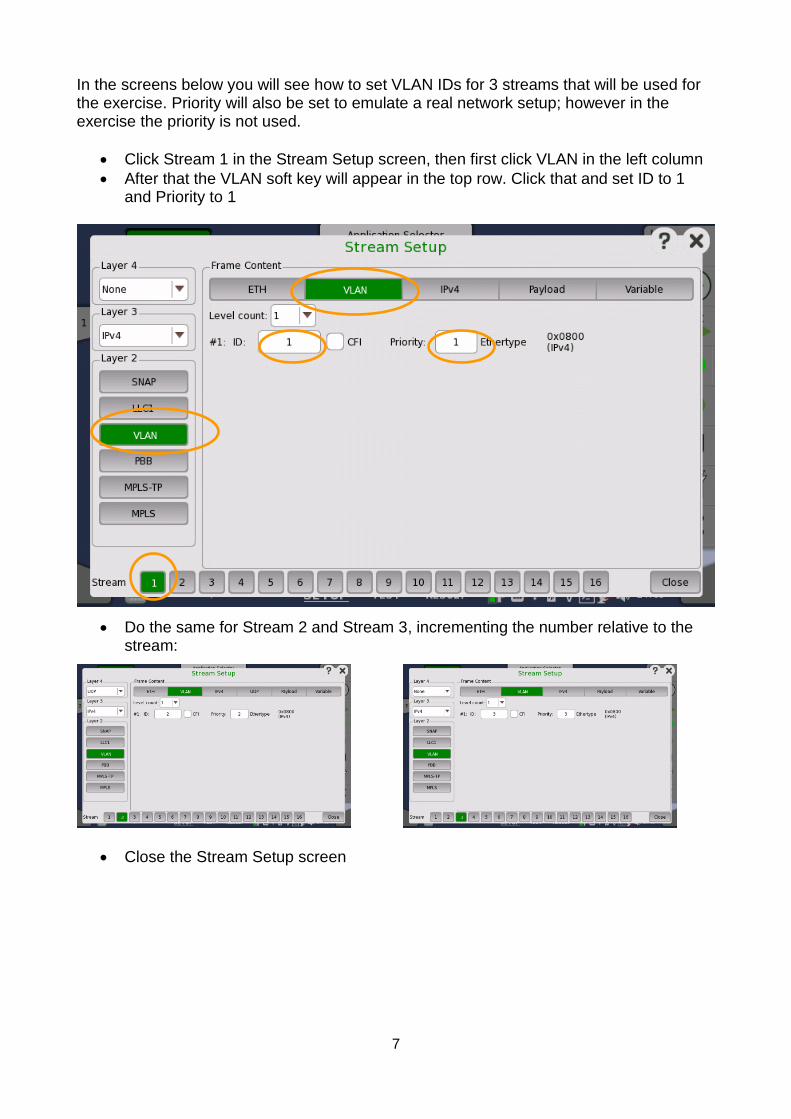
In the screens below you will see how to set VLAN IDs for 3 streams that will be used for the exercise. Priority will also be set to emulate a real network setup; however in the exercise the priority is not used.
Click Stream 1 in the Stream Setup screen, then first click VLAN in the left column
After that the VLAN soft key will appear in the top row. Click that and set ID to 1 and Priority to 1
Do the same for Stream 2 and Stream 3, incrementing the number relative to the stream:
Close the Stream Setup screen

8
You now get a screen like the following:
Click on the top left tap and check that MAC and IP addresses for Streams 1, 2 and 3 are all 0:
You switch between MAC and IP addresses by clicking on the area highlighted above.
9
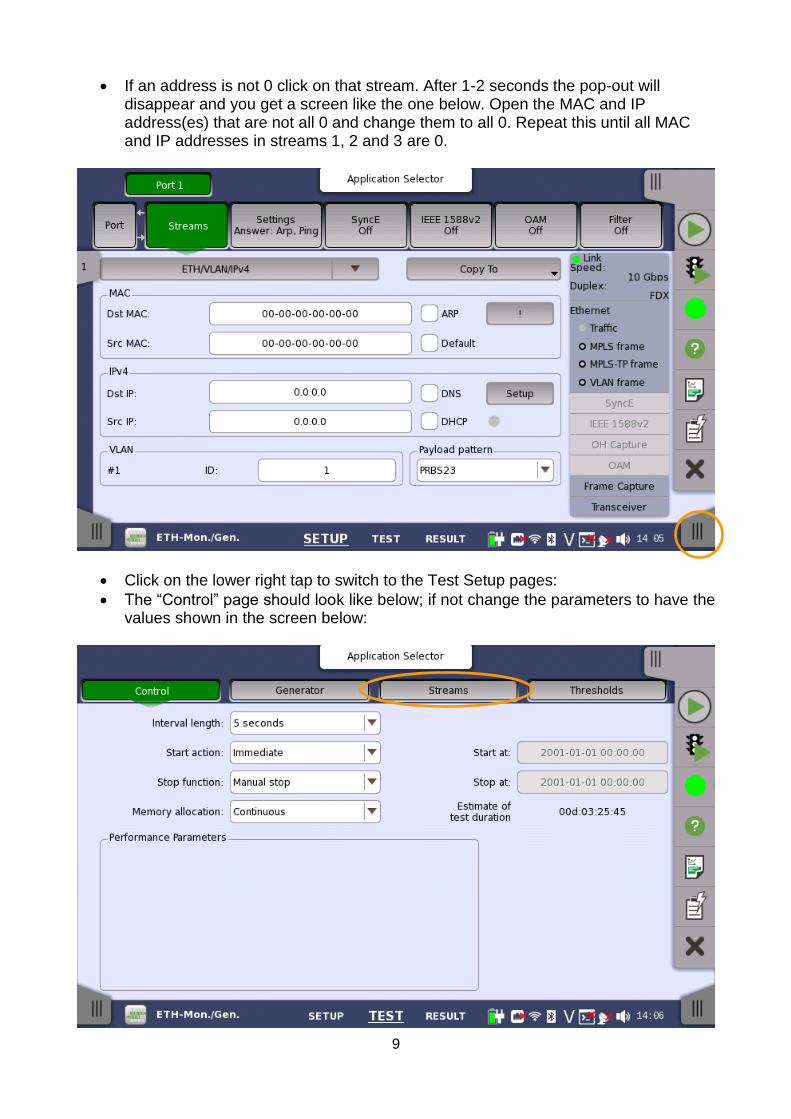
If an address is not 0 click on that stream. After 1-2 seconds the pop-out will disappear and you get a screen like the one below. Open the MAC and IP address(es) that are not all 0 and change them to all 0. Repeat this until all MAC and IP addresses in streams 1, 2 and 3 are 0.
Click on the lower right tap to switch to the Test Setup pages:
The “Control” page should look like below; if not change the parameters to have the values shown in the screen below:
10
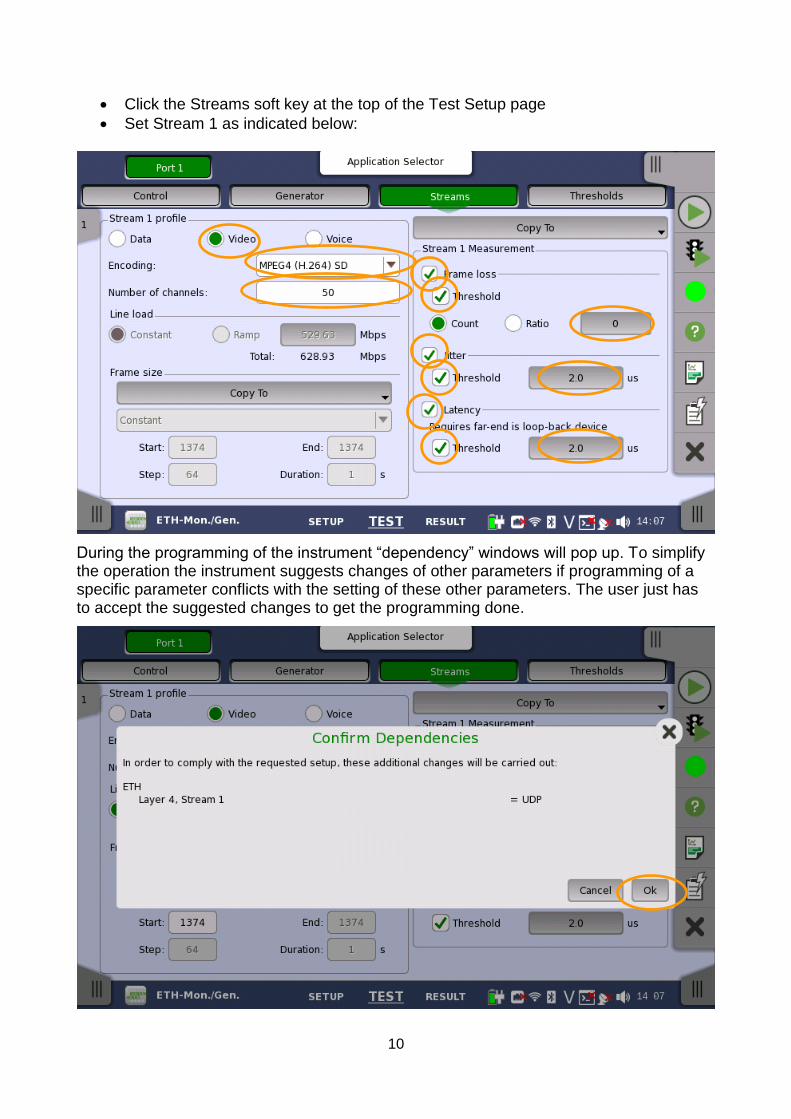
Click the Streams soft key at the top of the Test Setup page
Set Stream 1 as indicated below:
During the programming of the instrument “dependency” windows will pop up. To simplify the operation the instrument suggests changes of other parameters if programming of a specific parameter conflicts with the setting of these other parameters. The user just has to accept the suggested changes to get the programming done.

11
To switch between streams: Click the tap at the top right in the screen. In the pop-out that appears click on the addresses of the stream you want and wait approx. one second. Then the screen for the selected stream will open.
Set Stream 2 as indicated below:
Set Stream 3 as indicated below:
12
The “Video” and “Voice” settings makes it easy to emulate traffic patterns that are similar to those of Video and Voice. Please observe however that you do not send real video and voice signals.
When setting up the streams you also select which of the QoS parameters you want to measure: Frame Loss, Latency and Packet Jitter. Depending on configuration and application some of these parameters may not be relevant:
o If you send the traffic through a pipe with less capacity than the Ethernet line rate (e.g. if the Ethernet traffic is carried over a lower capacity SDH link) you may want to test that the highest priority traffic has no frame loss, while you know that the lower priority traffic will have frame loss. In such a case it may be irrelevant to see frame loss for the lower priority traffic
o The Latency measurement requires a far end loop back, which may involve a reflector device at the far end. If that is not available, the Latency should be disabled.
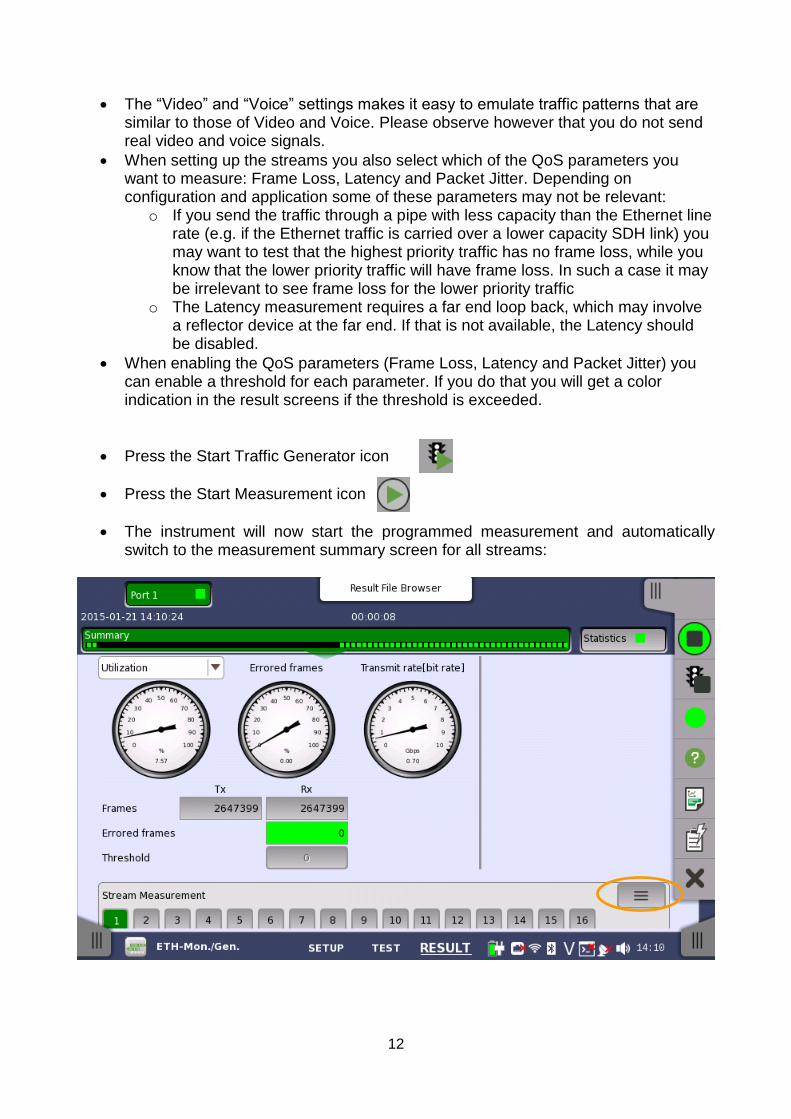
When enabling the QoS parameters (Frame Loss, Latency and Packet Jitter) you can enable a threshold for each parameter. If you do that you will get a color indication in the result screens if the threshold is exceeded.
Press the Start Traffic Generator icon
Press the Start Measurement icon
The instrument will now start the programmed measurement and automatically switch to the measurement summary screen for all streams:

13
In the summary screen you get an overview of the measurement results. Color indications will indicate if results are good (green) or bad (yellow or red, depending on severity) where it is relevant.
Press the highlighted icon to get more details per stream:
In this screen you get the main QoS parameters per stream (Frame Loss, Latency and Packet Jitter). Click on the symbols for stream 2 and 3 to get the QoS parameters for these streams.
When programming each stream thresholds for the QoS parameters were programmed. You now get green color indications making it easy to see that the QoS parameters are within the acceptance limits you entered.

14
By selecting the Statistics soft key you can get a certain parameter shown for all streams. Below you can see the possible screens:
Select the “Ethernet – Frame” statistics and scroll down to the “Last Received” VLAN section. Here you will see first level VLAN ID (VLAN 1) switch between 1, 2 and 3 depending on which stream that was detected when the screen was last updated:
15
BER test of an Ethernet line
This exercise shows how to do an out-of-service Layer 2 BERT (Bit Error Rate Test) of an Ethernet line. The exercise should come right after the Ethernet QoS verification exercise in the previous section, and the Ethernet QoS verification SHOULD NOT BE STOPPED when this exercise is made as the instrument can do two independent measurements simultaneously. The requirements for this exercise are the same as those described on first page in this document. To set up the instrument for this part of the exercise:
It is assumed that you now are in one of the result screens after the Ethernet QoS verification exercise.
Connect Tx to Rx on the optical module in port 2 with a J1579A optical cable.
Click on the “Result File Browser” field in the top of the result screen. You then get to the Result File Browser. Here click on one of the taps in the lower left or right on the screen
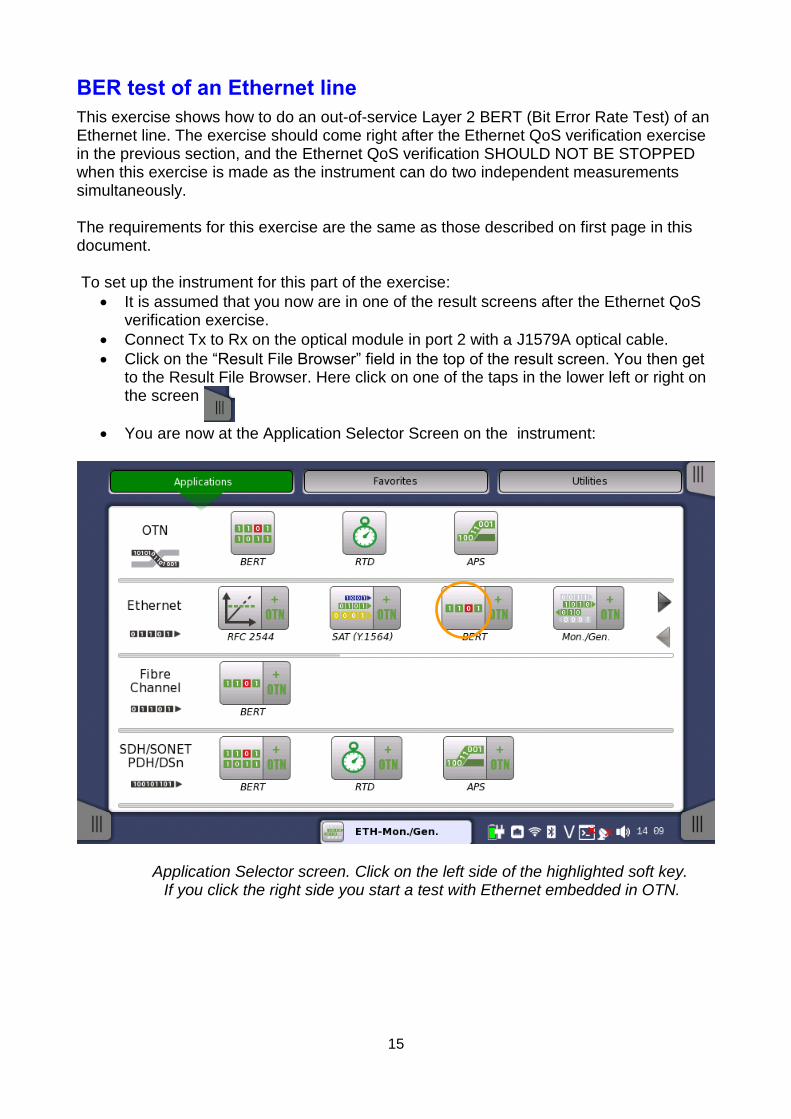
You are now at the Application Selector Screen on the instrument:
Application Selector screen. Click on the left side of the highlighted soft key. If you click the right side you start a test with Ethernet embedded in OTN.
16
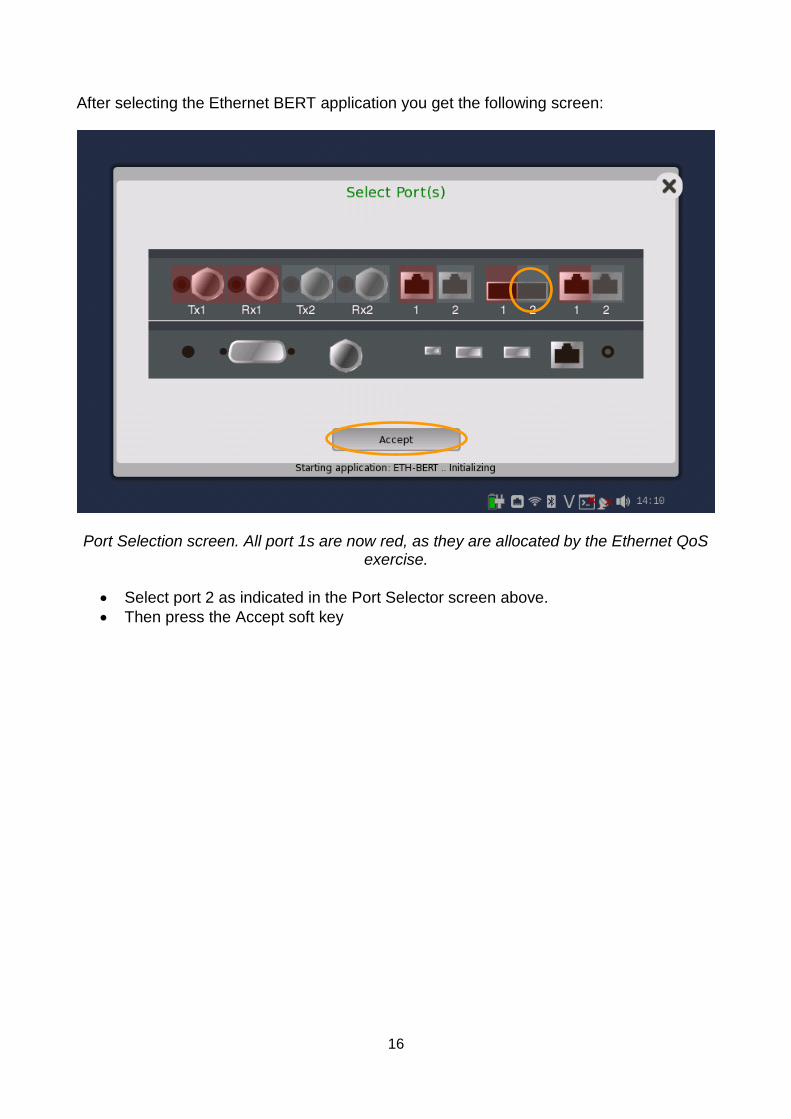
After selecting the Ethernet BERT application you get the following screen:
Port Selection screen. All port 1s are now red, as they are allocated by the Ethernet QoS exercise.
Select port 2 as indicated in the Port Selector screen above.
Then press the Accept soft key
17
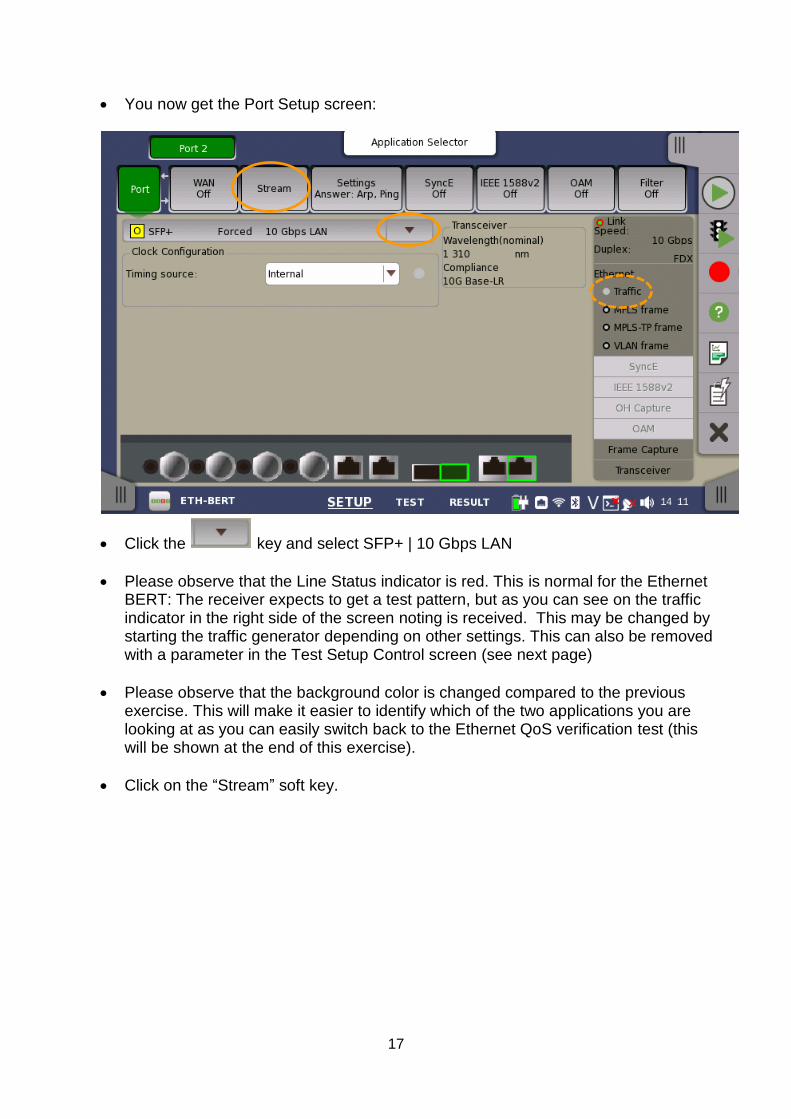
You now get the Port Setup screen:
Click the key and select SFP+ | 10 Gbps LAN
Please observe that the Line Status indicator is red. This is normal for the Ethernet BERT: The receiver expects to get a test pattern, but as you can see on the traffic indicator in the right side of the screen noting is received. This may be changed by starting the traffic generator depending on other settings. This can also be removed with a parameter in the Test Setup Control screen (see next page)
Please observe that the background color is changed compared to the previous exercise. This will make it easier to identify which of the two applications you are looking at as you can easily switch back to the Ethernet QoS verification test (this will be shown at the end of this exercise).
Click on the “Stream” soft key.

18
Click the key and select ETH. Hereby only layer 2 is enabled in the test traffic. When you do this you should say that you can instead activate tests for layer 3 or layer 4 if that is required for the test application.
Set Dst and Src MAC addresses to the same value e.g. all 0s as shown above (in the dialog where you program addresses a “CLR” soft key will change any other setting to all 0s)
Click on the tap in the lower right corner to get to the Test Setup screens.
The “Control” page should look like below; if not change the parameters to have the values shown in the screen below:
19
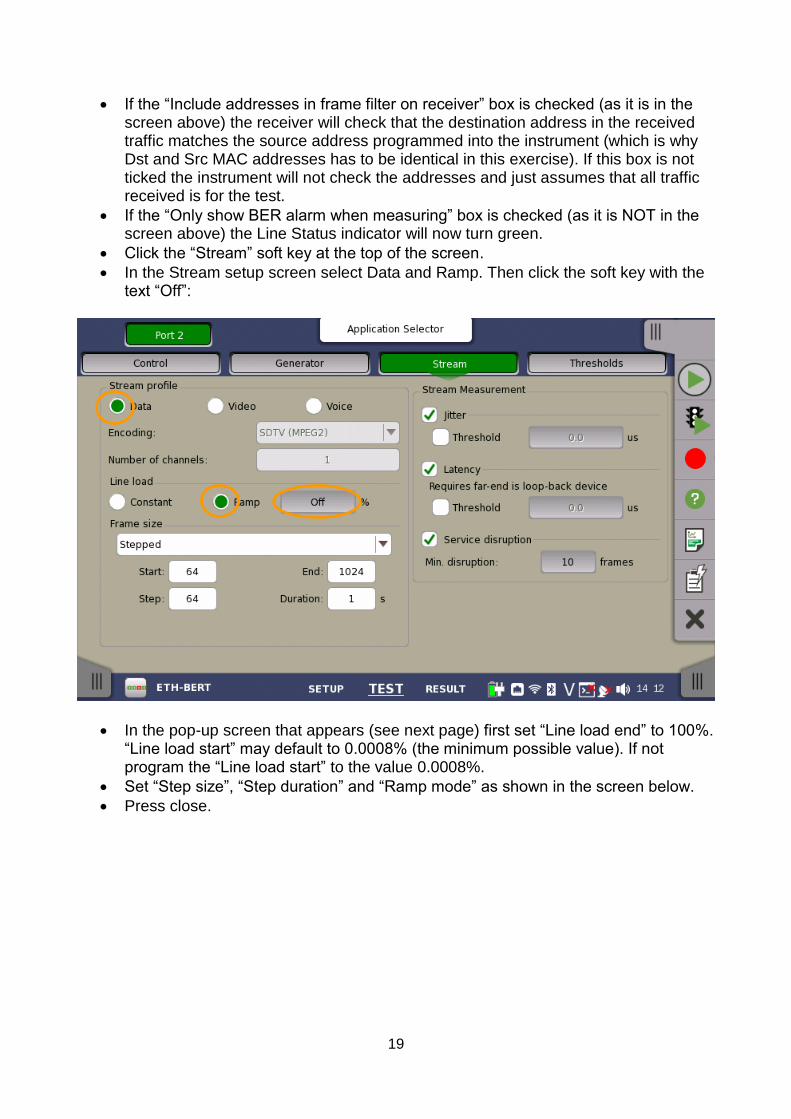
If the “Include addresses in frame filter on receiver” box is checked (as it is in the screen above) the receiver will check that the destination address in the received traffic matches the source address programmed into the instrument (which is why Dst and Src MAC addresses has to be identical in this exercise). If this box is not ticked the instrument will not check the addresses and just assumes that all traffic received is for the test.
If the “Only show BER alarm when measuring” box is checked (as it is NOT in the screen above) the Line Status indicator will now turn green.
Click the “Stream” soft key at the top of the screen.
In the Stream setup screen select Data and Ramp. Then click the soft key with the text “Off”:
In the pop-up screen that appears (see next page) first set “Line load end” to 100%. “Line load start” may default to 0.0008% (the minimum possible value). If not program the “Line load start” to the value 0.0008%.
Set “Step size”, “Step duration” and “Ramp mode” as shown in the screen below.
Press close.

20
Press the Start Traffic Generator icon
Press the Start Measurement icon
The instrument will now start the programmed measurement and automatically switch to the measurement summary screen the BERT:
21
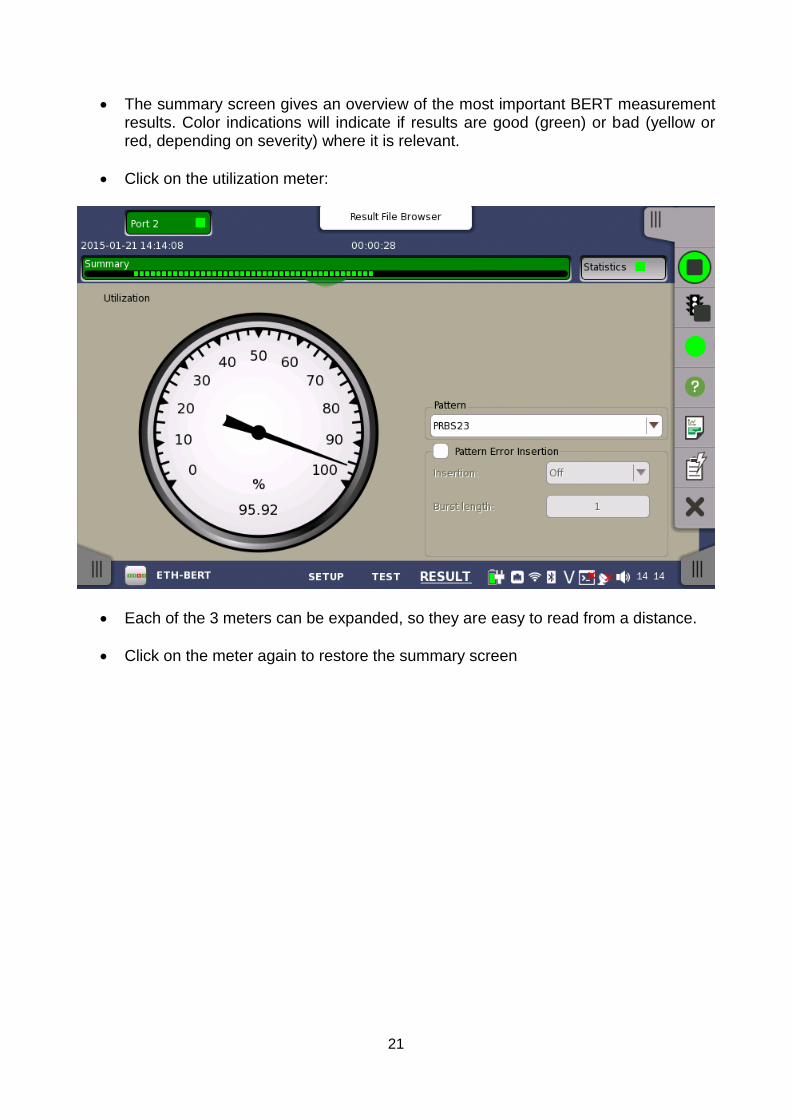
The summary screen gives an overview of the most important BERT measurement results. Color indications will indicate if results are good (green) or bad (yellow or red, depending on severity) where it is relevant.
Click on the utilization meter:
Each of the 3 meters can be expanded, so they are easy to read from a distance.
Click on the meter again to restore the summary screen

22
Now you can generate a couple of errors in the test pattern to show what happens in case errors are detected.
Check the “Pattern error insertion” box
Set insertion to “Manual”
Click 2-3 times on the “Error Insert” soft key to inject errors.
The Error count field will change color (to yellow) to make it easy to see that a problem has been detected on the line.
The most relevant error insertion in a BERT application is pattern error insertion. This is why the error insertion type is directly visible in the BERT summary page. By pressing the tap at the top right of the screen the customer can open the application control pane where a number of different Ethernet errors and alarms can be injected.
To show more on the detected errors click the “Statistics” soft key at the top of the Ethernet BERT Summary screen.
First time you do this after start of measurement the instrument will open the “Ethernet – BERT” Statistical screen (see next page). In the upper part of the screen you can see the name of the screen (in this case “Ethernet – BERT”). If you click on this name you get a list of all available statistical screens with a color indication to show screens where problems are detected.
o The color indication makes it easy to identify the screens indicating problems detected on the Ethernet line.
23
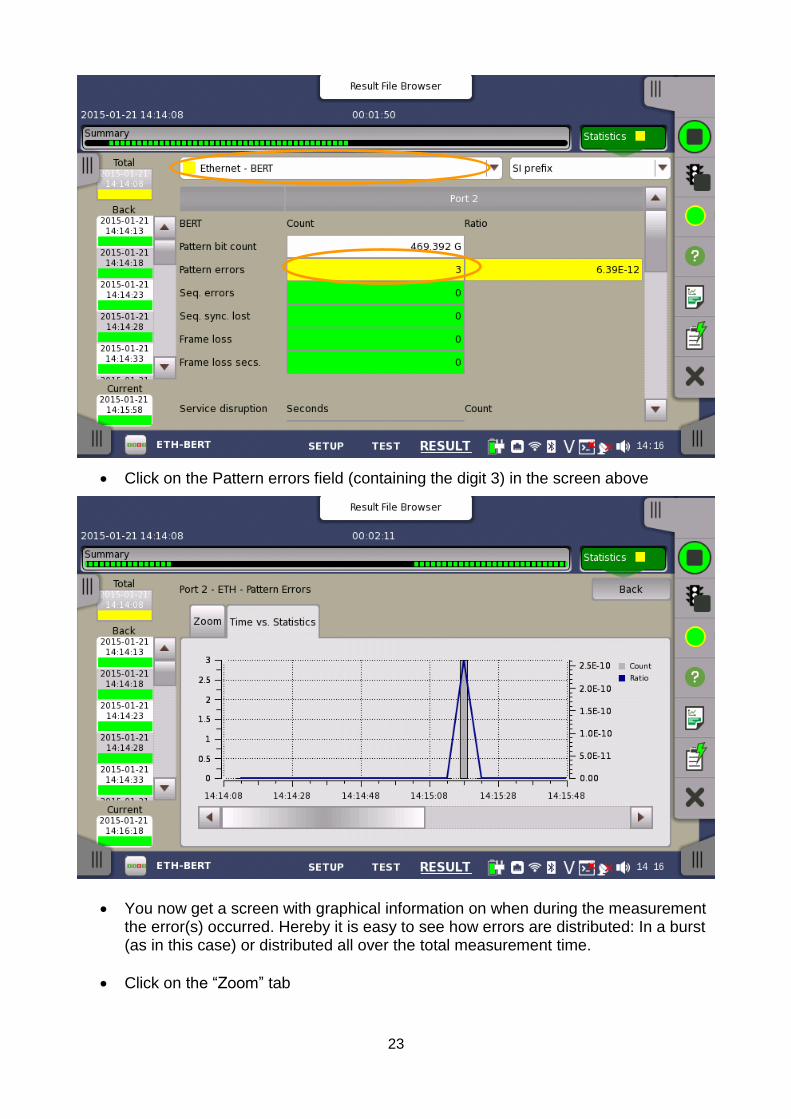
Click on the Pattern errors field (containing the digit 3) in the screen above
You now get a screen with graphical information on when during the measurement the error(s) occurred. Hereby it is easy to see how errors are distributed: In a burst (as in this case) or distributed all over the total measurement time.
Click on the “Zoom” tab

24
You now get a screen focusing on a single parameter, easy to read from a distance: If you modify something on the equipment that is under test some meters away from the instrument you can use this display understanding what happens while making any modifications.
Click the “Back” tap.
Click on the Pattern bit count field

25
You now can see the Ramp pattern that was programmed earlier.
Click the “Back” tap.
Click the tap in the upper left of the screen.
Check the “Only show intervals that contains errors” box.
You now see only the 5 second segment(s) of the test where errors were detected. You can look through the various statistical screens to find information on any other parameters in these segments allowing you to gain more insight on the cause of the error.
The length of the segment is set in the Test Setup “Control” page with the parameter “Interval length”. It can have values from 1 second to 12 hours or No intervals.
At this time the Ethernet QoS verification demonstration should still be running on port 1. To get to the Ethernet QoS verification demonstration click on the Application indicator in the lower left of the screen.
The Running Applications Pane will now appear as you can see on the next page
Another way to get the Running Applications Pane on the screen is to press the Power On/Off button and then in the following pop-up press the “Apps Switcher” soft key

26
You can have two independent tests running simultaneously and switch between them at any time – like if you had two separate instruments at the test site – giving you the possibility to reduce the test time by up to 50% if several lines are to be tested at the test site. You just click on the other test in the Apps Switcher pop up above to switch to that test (note the background color of the button is the same as the test background color.
In this exercise both ports were used for Ethernet testing, but if required (and with the right configuration of the instrument) the two ports can be used for different technologies, like Ethernet on one port and SDH/ SONET on the other port.
NB: Screen shots in this document were made using a MT1000A with SW version 2.03. Screen layouts may change if other SW versions are used for the exercise. You can make similar screen shots with the MT1100A.

• United StatesAnritsu Company1155 East Collins Blvd., Suite 100, Richardson, TX 75081, U.S.A.Toll Free: 1-800-267-4878Phone: +1-972-644-1777Fax: +1-972-671-1877
• CanadaAnritsu Electronics Ltd.700 Silver Seven Road, Suite 120, Kanata, Ontario K2V 1C3, CanadaPhone: +1-613-591-2003 Fax: +1-613-591-1006
• BrazilAnritsu Eletrônica Ltda.Praça Amadeu Amaral, 27 - 1 Andar01327-010 - Bela Vista - São Paulo - SP - BrazilPhone: +55-11-3283-2511Fax: +55-11-3288-6940
• MexicoAnritsu Company, S.A. de C.V.Av. Ejército Nacional No. 579 Piso 9, Col. Granada11520 México, D.F., MéxicoPhone: +52-55-1101-2370Fax: +52-55-5254-3147
• United KingdomAnritsu EMEA Ltd.200 Capability Green, Luton, Bedfordshire, LU1 3LU, U.K.Phone: +44-1582-433200 Fax: +44-1582-731303
• FranceAnritsu S.A.12 avenue du Québec, Bâtiment Iris 1- Silic 612,91140 VILLEBON SUR YVETTE, FrancePhone: +33-1-60-92-15-50Fax: +33-1-64-46-10-65
• GermanyAnritsu GmbHNemetschek Haus, Konrad-Zuse-Platz 1 81829 München, Germany Phone: +49-89-442308-0 Fax: +49-89-442308-55
• ItalyAnritsu S.r.l.Via Elio Vittorini 129, 00144 Roma, ItalyPhone: +39-6-509-9711 Fax: +39-6-502-2425
• SwedenAnritsu ABKistagången 20B, 164 40 KISTA, SwedenPhone: +46-8-534-707-00 Fax: +46-8-534-707-30
• FinlandAnritsu ABTeknobulevardi 3-5, FI-01530 VANTAA, FinlandPhone: +358-20-741-8100Fax: +358-20-741-8111
• DenmarkAnritsu A/SKay Fiskers Plads 9, 2300 Copenhagen S, DenmarkPhone: +45-7211-2200Fax: +45-7211-2210
• RussiaAnritsu EMEA Ltd. Representation Office in RussiaTverskaya str. 16/2, bld. 1, 7th floor.Russia, 125009, MoscowPhone: +7-495-363-1694Fax: +7-495-935-8962
• United Arab EmiratesAnritsu EMEA Ltd.Dubai Liaison OfficeP O Box 500413 - Dubai Internet CityAl Thuraya Building, Tower 1, Suit 701, 7th FloorDubai, United Arab EmiratesPhone: +971-4-3670352Fax: +971-4-3688460
• IndiaAnritsu India Private Limited2nd & 3rd Floor, #837/1, Binnamangla 1st Stage, Indiranagar, 100ft Road, Bangalore - 560038, IndiaPhone: +91-80-4058-1300Fax: +91-80-4058-1301
• SingaporeAnritsu Pte. Ltd.11 Chang Charn Road, #04-01, Shriro HouseSingapore 159640Phone: +65-6282-2400Fax: +65-6282-2533
• P.R. China (Shanghai)Anritsu (China) Co., Ltd.Room 2701-2705, Tower A, New Caohejing International Business CenterNo. 391 Gui Ping Road Shanghai, 200233, P.R. ChinaPhone: +86-21-6237-0898Fax: +86-21-6237-0899
• P.R. China (Hong Kong)Anritsu Company Ltd.Unit 1006-7, 10/F., Greenfield Tower, Concordia Plaza,No. 1 Science Museum Road, Tsim Sha Tsui East, Kowloon, Hong Kong, P.R. ChinaPhone: +852-2301-4980Fax: +852-2301-3545
• JapanAnritsu Corporation8-5, Tamura-cho, Atsugi-shi, Kanagawa, 243-0016 JapanPhone: +81-46-296-1221Fax: +81-46-296-1238
• KoreaAnritsu Corporation, Ltd.5FL, 235 Pangyoyeok-ro, Bundang-gu, Seongnam-si, Gyeonggi-do, 463-400 KoreaPhone: +82-31-696-7750Fax: +82-31-696-7751
• AustraliaAnritsu Pty. Ltd.Unit 21/270 Ferntree Gully Road, Notting Hill, Victoria 3168, AustraliaPhone: +61-3-9558-8177Fax: +61-3-9558-8255
• TaiwanAnritsu Company Inc.7F, No. 316, Sec. 1, NeiHu Rd., Taipei 114, TaiwanPhone: +886-2-8751-1816Fax: +886-2-8751-1817
Specifications are subject to change without notice.
1404
Printed on Recycled Paper
Please Contact:
No. MT1000A/MT1100A-E-Z-2-(1.00) Printed in Japan 2015-1 MG


