95
User Guide to the 2019 Natality Public Use File
User Guide
to the
2019 Natality
Public Use File
Acknowledgments
The preparation of this User Guide was coordinated by Claudia P. Valenzuela in the Division of Vital
Statistics (DVS) under the general direction of Joyce A. Martin, Lead Statistician, Reproductive
Statistics Branch (RSB), DVS.
The Division of Vital Statistics Director, Steven Schwartz, managed the Vital Statistics Cooperative
Program through which the vital registration offices of all states, the District of Columbia, New York
City, Puerto Rico, Virgin Islands, Guam, American Samoa, and the Commonwealth of the Northern
Mariana Islands provided the data to the National Center for Health Statistics (NCHS).
The vital statistics computer file on which it is based was prepared by DVS staff. This Division also
processed computer edits, designed and programmed the tabulations, reviewed the data, prepared
documentation for this file, and was responsible for receipt and processing of the basic data file. Rajesh
Virkar and Karen Knight provided overall direction. Important contributors were Legesse Alemu, Laci
Banks-Walker, Senora Davis, Anne Driscoll, Catherine Forbes, Connie M. Gentry, Brady E. Hamilton,
Margaret Jamison, Christina K. Jarman, David W. Justice, Virginia J. Justice, Kryn Krautheim, Denise
Little, Annie S. Liu, Susan L. McBroom, Jasmine N. Mickens, Enudio Mercado-Gonzalez, Michelle
J.K. Osterman, Steven J. Steimel, Pam Stephenson, and George C. Tolson.
Michelle J.K. Osterman, Brady E. Hamilton, and Claudia P. Valenzuela reviewed and verified these
technical notes.
NCHS acknowledges the essential role of the vital registration offices of all states and territories in
maintaining the system through which vital statistics data are obtained and their cooperation in
providing the information on which this publication is based.
2
Table of Contents
Control count of records 7
File layout 8
County codes 41
Detailed Technical Notes 47
Introduction 48
Definition of Live Birth 48
The Birth Registration Area 49
Classification of births by occurrence and residence 50
Residence error 50
Population based rates 50
Geographic classification 50
Standard Certificates of Live Birth 51
2003 revision 51
Natality data files 52
Micro-data files 52
Demographic Characteristics 53
Hispanic origin and race 53
Hispanic origin 53
Race of mother and father 54
Age of mother 54
Imputation of age of mother 55
Extreme values of age 55
Mean age of mother 55
Not stated age or date of birth of mother 55
Age of father 55
Marital status 55
Inferential procedures 56
Imputation of marital status 56
Educational attainment 56
Mother 56
Father 57
Live-birth order and parity 57
3

Birth interval 58
Medical and Public Services Utilization 58
Prenatal care 58
WIC food during pregnancy 59
Obstetric procedures 59
Characteristics of labor and delivery 59
Place of birth 60
Planned home births 60
Time of birth 60
Attendant at birth 61
CNM/CM-attended births 61
Method of delivery 61
Trial of labor 62
Total cesarean rate 62
Low-risk cesarean rate 62
Primary cesarean and VBAC delivery rates 62
Payment source for the delivery 62
Maternal Behavior and Health Characteristics 63
Mother’s body mass index (BMI) 63
Mother’s height 63
Mother’s pre-pregnancy weight 64
Mother’s weight at delivery 64
Weight gain during pregnancy 64
Cigarette smoking before and during pregnancy 65
Quitting smoking before or during pregnancy 65
Risk factors in this pregnancy 65
Eclampsia 66
Pregnancy from infertility treatment 66
Infections present and/or treated during this pregnancy 66
Maternal morbidity 67
Infant Health Characteristics 67
Period of gestation 67
Birthweight 68
Apgar score 69
4
5-minute score 69
10-minute score 69
Abnormal conditions of the newborn 69
Congenital anomalies of the newborn 70
Down syndrome and suspected chromosomal disorder 70
Plurality 70
Infant breastfed 71
Quality of Data 71
Completeness of registration 72
Completeness of reporting 72
Quality control procedures 72
Comparison with medical records 72
Rarely occurring events 73
State-specific data quality issues for 2019 73
Computation of Rates and Other Measures 74
Population denominators 74
2019 population estimates 74
Population estimates for the specific Hispanic groups 75
Revised population estimates 75
Residential population base 75
Small populations as denominators 75
Net census undercounts and overcounts 75
Cohort fertility tables 76
Total fertility rates 76
Seasonal adjustment of rates 76
Computation of percentages, percentage distributions, and means 76
Computation of Measures of Variability 77
Random variation and significance testing for natality data 77
Specified Hispanic population groups 77
References 78
Figures and Tables 84
Figure 1. U.S. Standard Certificate of Live Birth: 2003 Revision 84
5

Table A. Births by place of occurrence and residence for births occurring in the 50 states,
the District of Columbia, and U.S. territories, 2019 86
Table B. Percent of birth records on which specified items were not stated: United States
and each state and territory, New York City, and the District of Columbia, 2019
88
Table 1. Estimated total population, by race and Hispanic origin and specified Hispanic
origin group and estimated female population, by age and race and Hispanic origin and
specified Hispanic origin group of woman and standard errors by age and specified
Hispanic origin group: United States, 2019 92
Table 2. Estimated total population, female population, and age-specific female population:
United States, each state, and territory, July 1, 2019 93
Table 3. Population of birth- and death-registration states, 1900-1932, and United States,
1900-2019 94
Documentation Table 1. Number and percentage of live births by race of mother: United
States, 2019 95
Additional detailed tables available with the release of the “Births: Final Data for 2019”
Control Count of Records
6

2019 Natality
File / Data Characteristics
All Files:
Record format: Fixed Format
Code scheme: Numeric/Alphabetic/Blank
Record length: 1330
All Births:
Record count
By occurrence
By residence
To foreign residents
United States
3,757,582
3,757,582
3,747,540
10,042
Territories
24,373
24,373
24,083
290
7

2019 Natality Public Use File
Documentation
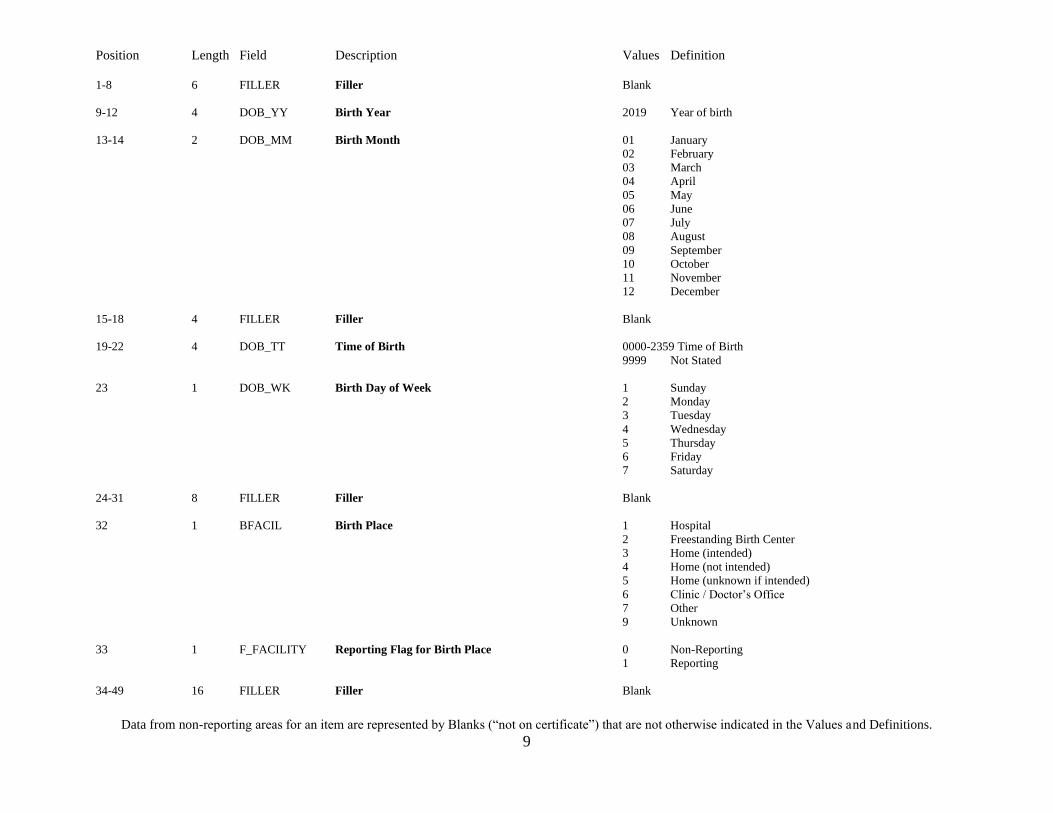
Position Length Field Description Values Definition
1-8 6 FILLER Filler Blank
9-12 4 DOB_YY Birth Year 2019 Year of birth
13-14 2 DOB_MM Birth Month 01 January
02 February
03 March
04 April
05 May
06 June
07 July
08 August
09 September
10 October
11 November
12 December
15-18 4 FILLER Filler Blank
19-22 4 DOB_TT Time of Birth 0000-2359 Time of Birth
9999 Not Stated
23 1 DOB_WK Birth Day of Week 1 Sunday
2 Monday
3 Tuesday
4 Wednesday
5 Thursday
6 Friday
7 Saturday
24-31 8 FILLER Filler Blank
32 1 BFACIL Birth Place 1 Hospital
2 Freestanding Birth Center
3 Home (intended)
4 Home (not intended)
5 Home (unknown if intended)
6 Clinic / Doctor’s Office 7 Other
9 Unknown
33 1 F_FACILITY Reporting Flag for Birth Place 0 Non-Reporting
1 Reporting
34-49 16 FILLER Filler Blank
Data from non-reporting areas for an item are represented by Blanks (“not on certificate”) that are not otherwise indicated in the Values and Definitions.
9
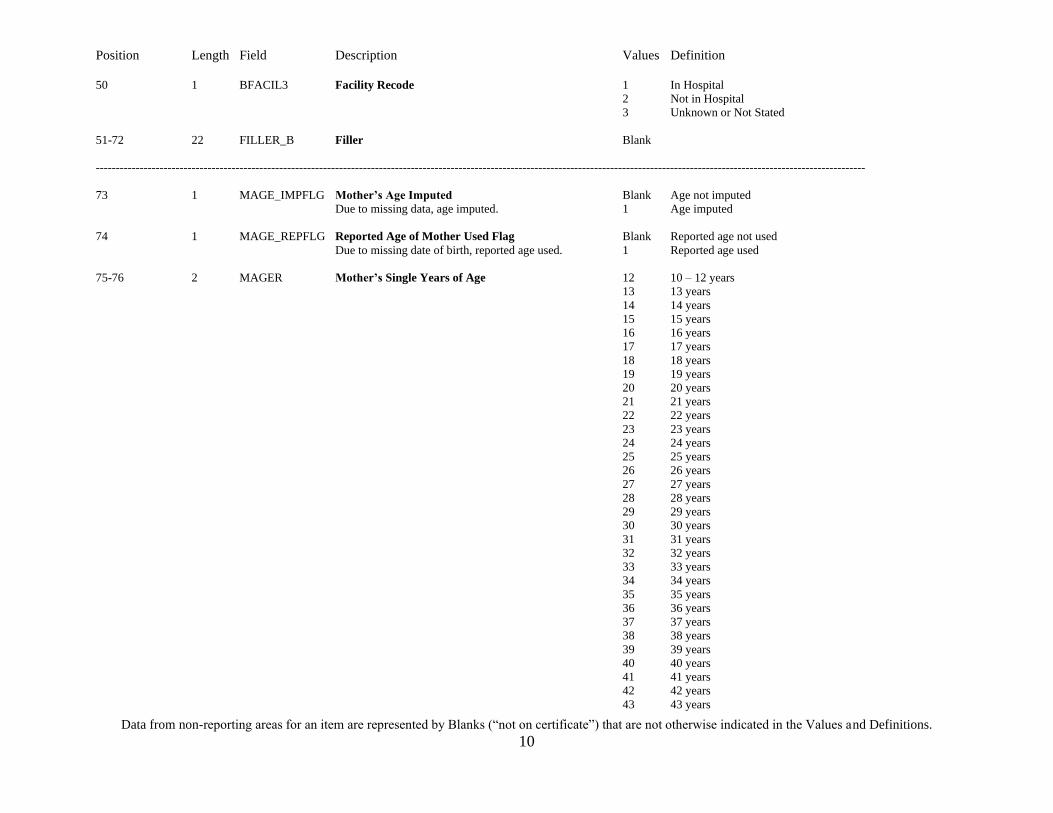
-------------------------------------------------------------------------------------------------------------------------------------------------------------------------------------------------
Position Length Field Description Values Definition
50 1 BFACIL3 Facility Recode 1 In Hospital
2 Not in Hospital
3 Unknown or Not Stated
51-72 22 FILLER_B Filler Blank
73 1 MAGE_IMPFLG Mother’s Age Imputed Blank Age not imputed
Due to missing data, age imputed. 1 Age imputed
74 1 MAGE_REPFLG Reported Age of Mother Used Flag Blank Reported age not used
Due to missing date of birth, reported age used. 1 Reported age used
75-76 2 MAGER Mother’s Single Years of Age 12 10 – 12 years
13 13 years
14 14 years
15 15 years
16 16 years
17 17 years
18 18 years
19 19 years
20 20 years
21 21 years
22 22 years
23 23 years
24 24 years
25 25 years
26 26 years
27 27 years
28 28 years
29 29 years
30 30 years
31 31 years
32 32 years
33 33 years
34 34 years
35 35 years
36 36 years
37 37 years
38 38 years
39 39 years
40 40 years
41 41 years
42 42 years
43 43 years
Data from non-reporting areas for an item are represented by Blanks (“not on certificate”) that are not otherwise indicated in the Values and Definitions.
10

Position Length Field Description Values Definition
44
45
46
47
48
49
50
44 years
45 years
46 years
47 years
48 years
49 years
50 years and over
77-78 2 MAGER14 Mother’s Age Recode 14 01
03
04
05
06
07
08
09
10
11
12
13
14
Under 15 Years
15 years
16 years
17 years
18 years
19 years
20-24 years
25-29 years
30-34 years
35-39 years
40-44 years
45-49 years
50-54 years
79 1 MAGER9 Mother’s Age Recode 9 1
2
3
4
5
6
7
8
9
Under 15 years
15-19 years
20-24 years
25-29 years
30-34 years
35-39 years
40-44 years
45-49 years
50-54 years
80-83 4 FILLER Filler Blank
84 1 MBSTATE_REC Mother’s Nativity 1
2
3
Born in the U.S. (50 US States)
Born outside the U.S. (includes possessions)
Unknown or Not Stated
85-103 19 FILLER Filler Blank
104 1 RESTATUS Residence Status
United States 1
2
RESIDENT: State and county of occurrence and residence
are the same.
INTRASTATE NONRESIDENT: State of occurrence and
residence are the same but county is different.
Data from non-reporting areas for an item are represented by Blanks (“not on certificate”) that are not otherwise indicated in the Values and Definitions.
11
Position Length Field Description Values Definition
3 INTERSTATE NONRESIDENT: State of occurrence and
residence are different but both are one of the 50 US states
or District of Columbia.
4 FOREIGN RESIDENT: The state of residence is not one of
the 50 US states or District of Columbia.
U.S. Territories 1 RESIDENT: State and county of occurrence and residence
For detailed geography codes see addendum. residence are the same. (Unique to Guam, all US residents
are considered residents of Guam and thus are assigned 1.)
2 INTRATERRITORY NONRESIDENT: Territory of occurrence and
residence are the same but county is different.
3 INTERTERRITORY RESIDENT: Territory of occurrence and
residence are different but both are US Territories.
4 FOREIGN RESIDENT: The residence is not a US Territory.
105-106 2 MRACE31 Mother’s Race Recode 31 United States and all Outlying Areas of 01 White (only) [only one race reported]
the United States except Puerto Rico 02 Black (only)
03 AIAN (American Indian or Alaskan Native) (only)
04 Asian (only)
05 NHOPI (Native Hawaiian or Other Pacific Islander) (only)
06 Black and White
07 Black and AIAN
08 Black and Asian
09 Black and NHOPI
10 AIAN and White
11 AIAN and Asian
12 AIAN and NHOPI
13 Asian and White
14 Asian and NHOPI
15 NHOPI and White
16 Black, AIAN, and White
17 Black, AIAN, and Asian
18 Black, AIAN, and NHOPI
19 Black, Asian, and White
20 Black, Asian, and NHOPI
21 Black, NHOPI, and White
22 AIAN, Asian, and White
23 AIAN, NHOPI, and White
24 AIAN, Asian, and NHOPI
25 Asian, NHOPI, and White
26 Black, AIAN, Asian, and White
27 Black, AIAN, Asian, and NHOPI
28 Black, AIAN, NHOPI, and White
29 Black, Asian, NHOPI, and White
30 AIAN, Asian, NHOPI, and White
Data from non-reporting areas for an item are represented by Blanks (“not on certificate”) that are not otherwise indicated in the Values and Definitions.
12
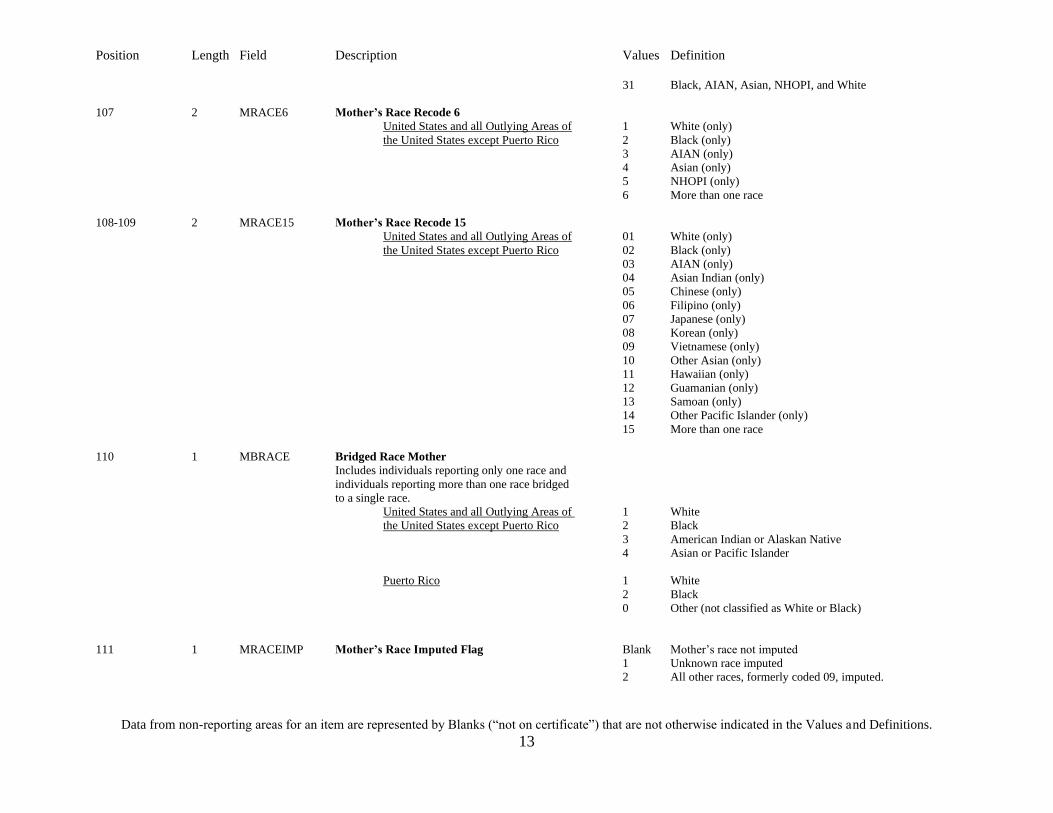
Position Length Field Description Values Definition
31 Black, AIAN, Asian, NHOPI, and White
107 2 MRACE6 Mother’s Race Recode 6
United States and all Outlying Areas of
the United States except Puerto Rico
1
2
3
4
5
6
White (only)
Black (only)
AIAN (only)
Asian (only)
NHOPI (only)
More than one race
108-109 2 MRACE15 Mother’s Race Recode 15
United States and all Outlying Areas of
the United States except Puerto Rico
01
02
03
04
05
06
07
08
09
10
11
12
13
14
15
White (only)
Black (only)
AIAN (only)
Asian Indian (only)
Chinese (only)
Filipino (only)
Japanese (only)
Korean (only)
Vietnamese (only)
Other Asian (only)
Hawaiian (only)
Guamanian (only)
Samoan (only)
Other Pacific Islander (only)
More than one race
110 1 MBRACE Bridged Race Mother
Includes individuals reporting only one race and
individuals reporting more than one race bridged
to a single race.
United States and all Outlying Areas of
the United States except Puerto Rico
1
2
3
4
White
Black
American Indian or Alaskan Native
Asian or Pacific Islander
Puerto Rico 1
2
0
White
Black
Other (not classified as White or Black)
111 1 MRACEIMP Mother’s Race Imputed Flag Blank
1
2
Mother’s race not imputed Unknown race imputed
All other races, formerly coded 09, imputed.
Data from non-reporting areas for an item are represented by Blanks (“not on certificate”) that are not otherwise indicated in the Values and Definitions.
13
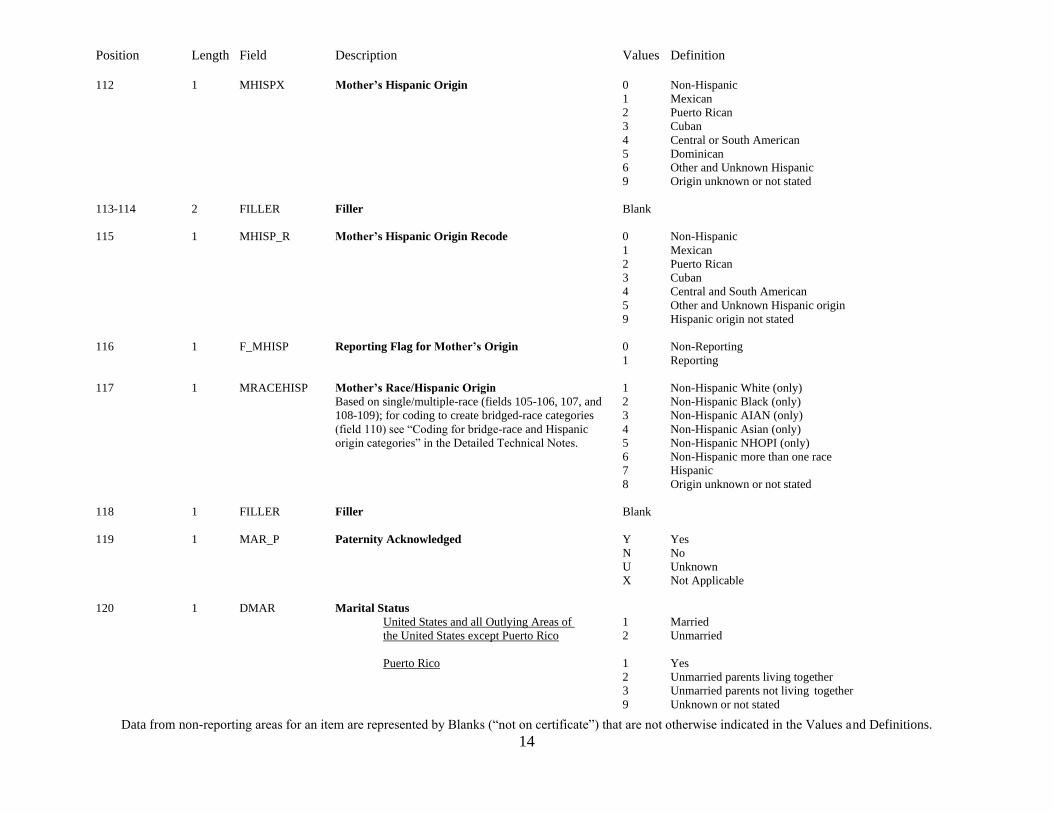
Position Length Field Description Values Definition
112 1 MHISPX Mother’s Hispanic Origin 0
1
2
3
4
5
6
9
Non-Hispanic
Mexican
Puerto Rican
Cuban
Central or South American
Dominican
Other and Unknown Hispanic
Origin unknown or not stated
113-114 2 FILLER Filler Blank
115 1 MHISP_R Mother’s Hispanic Origin Recode 0
1
2
3
4
5
9
Non-Hispanic
Mexican
Puerto Rican
Cuban
Central and South American
Other and Unknown Hispanic origin
Hispanic origin not stated
116 1 F_MHISP Reporting Flag for Mother’s Origin 0
1
Non-Reporting
Reporting
117 1 MRACEHISP Mother’s Race/Hispanic Origin Based on single/multiple-race (fields 105-106, 107, and
108-109); for coding to create bridged-race categories
(field 110) see “Coding for bridge-race and Hispanic
origin categories” in the Detailed Technical Notes.
1
2
3
4
5
6
7
8
Non-Hispanic White (only)
Non-Hispanic Black (only)
Non-Hispanic AIAN (only)
Non-Hispanic Asian (only)
Non-Hispanic NHOPI (only)
Non-Hispanic more than one race
Hispanic
Origin unknown or not stated
118 1 FILLER Filler Blank
119 1 MAR_P Paternity Acknowledged Y
N
U
X
Yes
No
Unknown
Not Applicable
120 1 DMAR Marital Status
United States and all Outlying Areas of
the United States except Puerto Rico
1
2
Married
Unmarried
Puerto Rico 1
2
3
9
Yes
Unmarried parents living together
Unmarried parents not living together
Unknown or not stated
Data from non-reporting areas for an item are represented by Blanks (“not on certificate”) that are not otherwise indicated in the Values and Definitions.
14

-------------------------------------------------------------------------------------------------------------------------------------------------------------------------------------------------
Position Length Field Description Values Definition
121 1 MAR_IMP Mother’s Marital Status Imputed Blank Marital Status not imputed
1 Marital Status imputed
122 1 FILLER Filler Blank
123 1 F_MAR_P Reporting Flag for Paternity Acknowledged 0 Non-Reporting
1 Reporting
124 1 MEDUC Mother’s Education 1 8th grade or less
2 9th through 12th grade with no diploma
3 High school graduate or GED completed
4 Some college credit, but not a degree.
5 Associate degree (AA,AS)
6 Bachelor’s degree (BA, AB, BS) 7 Master’s degree (MA, MS, MEng, MEd, MSW, MBA)
8 Doctorate (PhD, EdD) or Professional Degree (MD, DDS,
DVM, LLB, JD)
9 Unknown
125 1 FILLER Filler Blank
126 1 F_MEDUC Reporting Flag for Education of Mother 0 Non-Reporting
1 Reporting
127-141 15 FILLER_M Filler M Blank
142 1 FAGERPT_FLG Father’s Reported Age Used Blank Father’s reported age not used 1 Father’s reported age used
143-146 4 FILLER Filler Blank
147-148 2 FAGECOMB Father’s Combined Age 09-98 Father’s combined age in years 99 Unknown or not stated
149-150 2 FAGEREC11 Father’s Age Recode 11 01 Under 15 years
02 15-19 years
03 20-24 years
04 25-29 years
05 30-34 years
06 35-39 years
07 40-44 years
08 45-49 years
09 50-54 years
Data from non-reporting areas for an item are represented by Blanks (“not on certificate”) that are not otherwise indicated in the Values and Definitions.
15
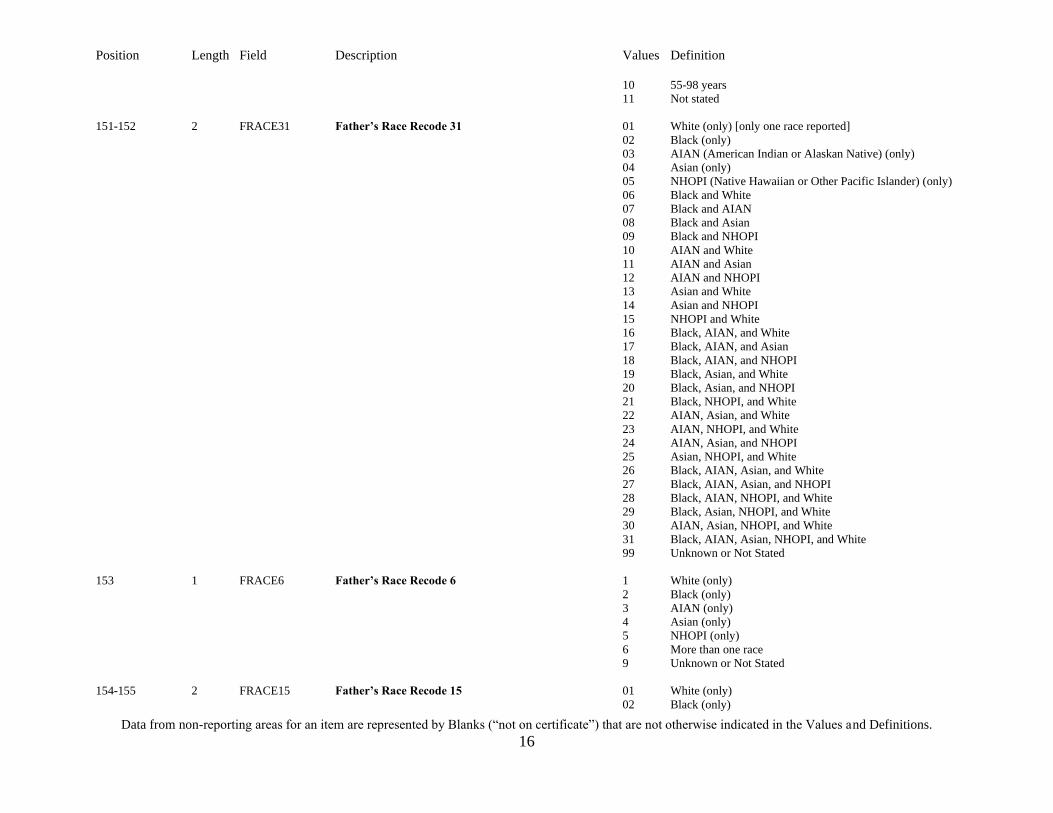
Position Length Field Description Values Definition
10 55-98 years
11 Not stated
151-152 2 FRACE31 Father’s Race Recode 31 01 White (only) [only one race reported]
02 Black (only)
03 AIAN (American Indian or Alaskan Native) (only)
04 Asian (only)
05 NHOPI (Native Hawaiian or Other Pacific Islander) (only)
06 Black and White
07 Black and AIAN
08 Black and Asian
09 Black and NHOPI
10 AIAN and White
11 AIAN and Asian
12 AIAN and NHOPI
13 Asian and White
14 Asian and NHOPI
15 NHOPI and White
16 Black, AIAN, and White
17 Black, AIAN, and Asian
18 Black, AIAN, and NHOPI
19 Black, Asian, and White
20 Black, Asian, and NHOPI
21 Black, NHOPI, and White
22 AIAN, Asian, and White
23 AIAN, NHOPI, and White
24 AIAN, Asian, and NHOPI
25 Asian, NHOPI, and White
26 Black, AIAN, Asian, and White
27 Black, AIAN, Asian, and NHOPI
28 Black, AIAN, NHOPI, and White
29 Black, Asian, NHOPI, and White
30 AIAN, Asian, NHOPI, and White
31 Black, AIAN, Asian, NHOPI, and White
99 Unknown or Not Stated
153 1 FRACE6 Father’s Race Recode 6 1 White (only)
2 Black (only)
3 AIAN (only)
4 Asian (only)
5 NHOPI (only)
6 More than one race
9 Unknown or Not Stated
154-155 2 FRACE15 Father’s Race Recode 15 01 White (only)
02 Black (only)
Data from non-reporting areas for an item are represented by Blanks (“not on certificate”) that are not otherwise indicated in the Values and Definitions.
16
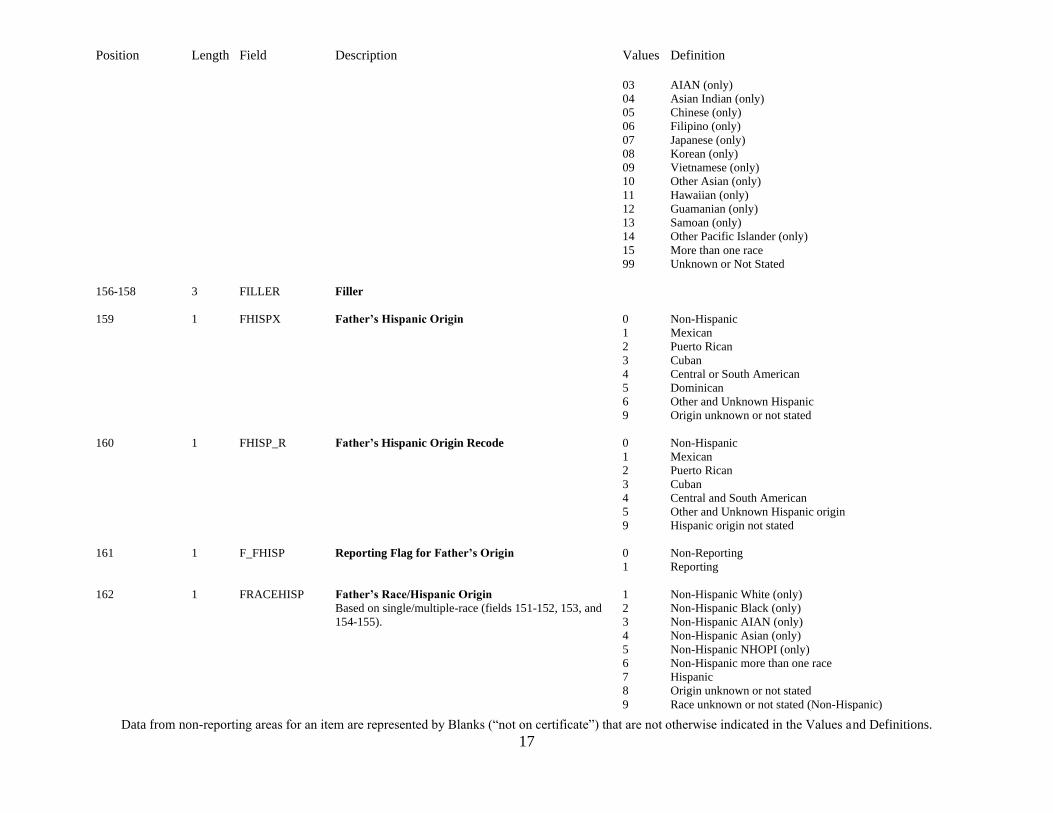
Position Length Field Description Values Definition
03 AIAN (only)
04 Asian Indian (only)
05 Chinese (only)
06 Filipino (only)
07 Japanese (only)
08 Korean (only)
09 Vietnamese (only)
10 Other Asian (only)
11 Hawaiian (only)
12 Guamanian (only)
13 Samoan (only)
14 Other Pacific Islander (only)
15 More than one race
99 Unknown or Not Stated
156-158 3 FILLER Filler
159 1 FHISPX Father’s Hispanic Origin 0 Non-Hispanic
1 Mexican
2 Puerto Rican
3 Cuban
4 Central or South American
5 Dominican
6 Other and Unknown Hispanic
9 Origin unknown or not stated
160 1 FHISP_R Father’s Hispanic Origin Recode 0 Non-Hispanic
1 Mexican
2 Puerto Rican
3 Cuban
4 Central and South American
5 Other and Unknown Hispanic origin
9 Hispanic origin not stated
161 1 F_FHISP Reporting Flag for Father’s Origin 0 Non-Reporting
1 Reporting
162 1 FRACEHISP Father’s Race/Hispanic Origin 1 Non-Hispanic White (only)
Based on single/multiple-race (fields 151-152, 153, and 2 Non-Hispanic Black (only)
154-155). 3 Non-Hispanic AIAN (only)
4 Non-Hispanic Asian (only)
5 Non-Hispanic NHOPI (only)
6 Non-Hispanic more than one race
7 Hispanic
8 Origin unknown or not stated
9 Race unknown or not stated (Non-Hispanic)
Data from non-reporting areas for an item are represented by Blanks (“not on certificate”) that are not otherwise indicated in the Values and Definitions.
17
-------------------------------------------------------------------------------------------------------------------------------------------------------------------------------------------------
Position Length Field Description Values Definition
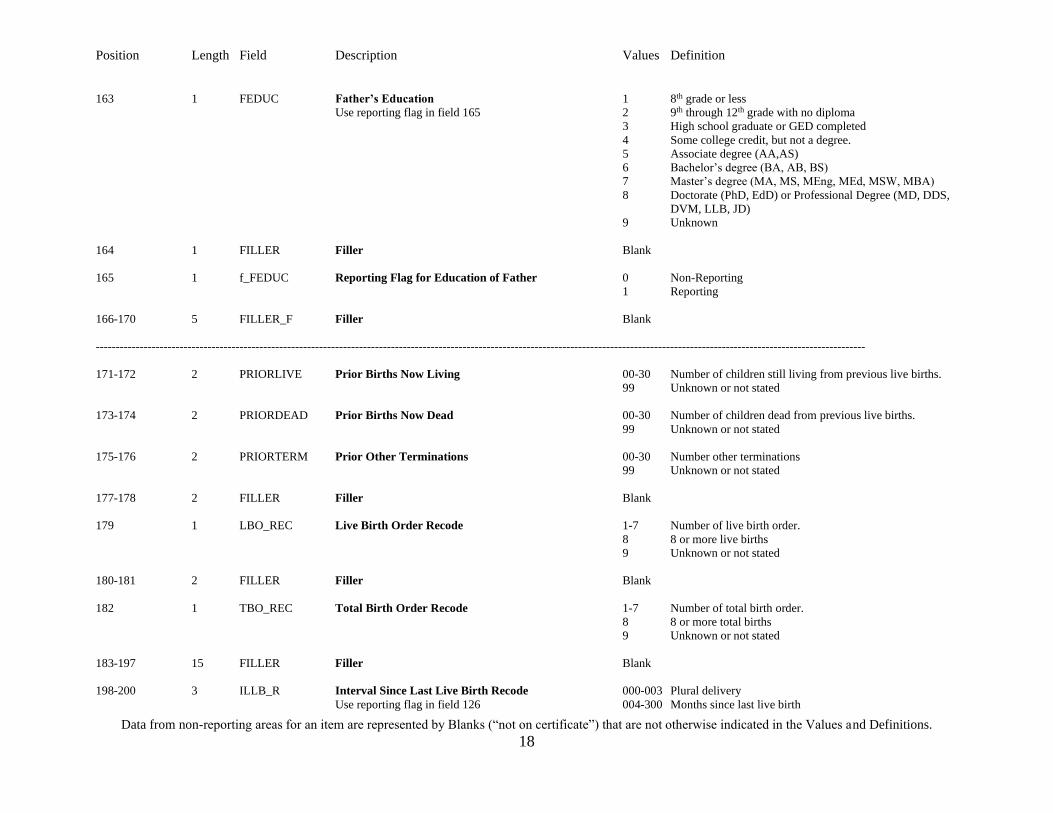
163 1 FEDUC Father’s Education 1 8th grade or less
Use reporting flag in field 165 2 9th through 12th grade with no diploma
3 High school graduate or GED completed
4 Some college credit, but not a degree.
5 Associate degree (AA,AS)
6 Bachelor’s degree (BA, AB, BS) 7 Master’s degree (MA, MS, MEng, MEd, MSW, MBA) 8 Doctorate (PhD, EdD) or Professional Degree (MD, DDS,
DVM, LLB, JD)
9 Unknown
164 1 FILLER Filler Blank
165 1 f_FEDUC Reporting Flag for Education of Father 0 Non-Reporting
1 Reporting
166-170 5 FILLER_F Filler Blank
171-172 2 PRIORLIVE Prior Births Now Living 00-30 Number of children still living from previous live births.
99 Unknown or not stated
173-174 2 PRIORDEAD Prior Births Now Dead 00-30 Number of children dead from previous live births.
99 Unknown or not stated
175-176 2 PRIORTERM Prior Other Terminations 00-30 Number other terminations
99 Unknown or not stated
177-178 2 FILLER Filler Blank
179 1 LBO_REC Live Birth Order Recode 1-7 Number of live birth order.
8 8 or more live births
9 Unknown or not stated
180-181 2 FILLER Filler Blank
182 1 TBO_REC Total Birth Order Recode 1-7 Number of total birth order.
8 8 or more total births
9 Unknown or not stated
183-197 15 FILLER Filler Blank
198-200 3 ILLB_R Interval Since Last Live Birth Recode 000-003 Plural delivery
Use reporting flag in field 126 004-300 Months since last live birth
Data from non-reporting areas for an item are represented by Blanks (“not on certificate”) that are not otherwise indicated in the Values and Definitions.
18

Position Length Field Description Values Definition
888 Not applicable / 1st live birth
999 Unknown or not stated
201-202 2 ILLB_R11 Interval Since Last Live Birth Recode 11 00 Zero to 3 months (plural delivery)
Use reporting flag in field 126 01 4 to 11 months
02 12 to 17 months
03 18 to 23 months
04 24 to 35 months
05 36 to 47 months
06 48 to 59 months
07 60 to 71 months
08 72 months and over
88 Not applicable (1st live birth)
99 Unknown or not stated
203-205 3 FILLER Filler Blank
206-208 3 ILOP_R Interval Since Last Other Pregnancy Recode 000-003 Plural delivery
Use reporting flag in field 126 004-300 Months since last live birth
888 Not applicable / 1st natality event
999 Unknown or not stated
209-210 2 ILOP_R11 Interval Since Last Other Pregnancy Recode 11 00 Zero to 3 months (plural delivery)
Use reporting flag in field 126 01 4 to 11 months
02 12 to 17 months
03 18 to 23 months
04 24 to 35 months
05 36 to 47 months
06 48 to 59 months
07 60 to 71 months
08 72 months and over
88 Not applicable (1st natality event)
99 Unknown or not stated
211-213 3 FILLER Filler Blank
214-216 3 ILP_R Interval Since Last Pregnancy Recode 000-003 Plural delivery
Use reporting flag in field 126 004-300 Months since last live birth
888 Not applicable / no previous pregnancy
999 Unknown or not stated
217-218 2 ILP_R11 Interval Since Last Pregnancy Recode 11 00 Zero to 3 months (plural delivery)
Use reporting flag in field 126 01 4 to 11 months
00 12 to 17 months
01 18 to 23 months
02 24 to 35 months
Data from non-reporting areas for an item are represented by Blanks (“not on certificate”) that are not otherwise indicated in the Values and Definitions.
19
-------------------------------------------------------------------------------------------------------------------------------------------------------------------------------------------------
Position Length Field Description Values Definition
03 36 to 47 months
04 48 to 59 months
05 60 to 71 months
06 72 months and over
88 Not applicable (no previous pregnancy)
99 Unknown or not stated
219-223 5 FILLER_P Blank
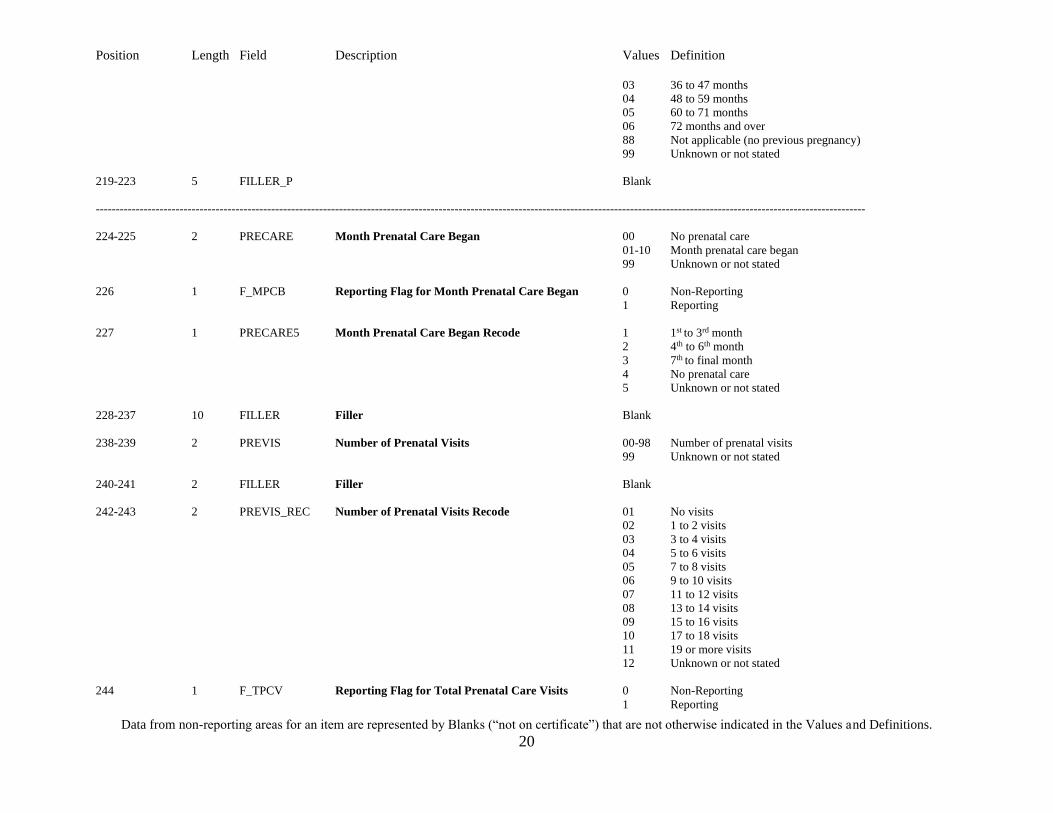
224-225 2 PRECARE Month Prenatal Care Began 00 No prenatal care
01-10 Month prenatal care began
99 Unknown or not stated
226 1 F_MPCB Reporting Flag for Month Prenatal Care Began 0 Non-Reporting
1 Reporting
1st 227 1 PRECARE5 Month Prenatal Care Began Recode 1 to 3rd month
4th 2 to 6th month
3 7th to final month
4 No prenatal care
5 Unknown or not stated
228-237 10 FILLER Filler Blank
238-239 2 PREVIS Number of Prenatal Visits 00-98 Number of prenatal visits
99 Unknown or not stated
240-241 2 FILLER Filler Blank
242-243 2 PREVIS_REC Number of Prenatal Visits Recode 01 No visits
02 1 to 2 visits
03 3 to 4 visits
04 5 to 6 visits
05 7 to 8 visits
06 9 to 10 visits
07 11 to 12 visits
08 13 to 14 visits
09 15 to 16 visits
10 17 to 18 visits
11 19 or more visits
12 Unknown or not stated
244 1 F_TPCV Reporting Flag for Total Prenatal Care Visits 0 Non-Reporting
1 Reporting
Data from non-reporting areas for an item are represented by Blanks (“not on certificate”) that are not otherwise indicated in the Values and Definitions.
20

-------------------------------------------------------------------------------------------------------------------------------------------------------------------------------------------------
Position Length Field Description Values Definition
245-250 6 FILLER Filler Blank
251 1 WIC WIC Y Yes
N No
U Unknown or not stated
252 1 F_WIC Reporting Flag for WIC 0 Non-Reporting
1 Reporting
253-254 2 CIG_0 Cigarettes Before Pregnancy 00-97 Number of cigarettes daily
98 98 or more cigarettes daily
99 Unknown or not stated
255-256 2 CIG_1 Cigarettes 1st Trimester 00-97 Number of cigarettes daily
98 98 or more cigarettes daily
99 Unknown or not stated
257-258 2 CIG_2 Cigarettes 2nd Trimester 00-97 Number of cigarettes daily
98 98 or more cigarettes daily
99 Unknown or not stated
259-260 2 CIG_3 Cigarettes 3rd Trimester 00-97 Number of cigarettes daily
98 98 or more cigarettes daily
99 Unknown or not stated
261 1 CIG0_R Cigarettes Before Pregnancy Recode 0 Nonsmoker
1 1-5
2 6-10
3 11-20
4 21-40
5 41 or more
6 Unknown or not stated
262 1 CIG1_R Cigarettes 1st Trimester Recode 0 Nonsmoker
1 1-5
2 6-10
3 11-20
4 21-40
5 41 or more
6 Unknown or not stated
263 1 CIG2_R Cigarettes 2nd Trimester Recode 0 Nonsmoker
1 1-5
Data from non-reporting areas for an item are represented by Blanks (“not on certificate”) that are not otherwise indicated in the Values and Definitions.
21

-------------------------------------------------------------------------------------------------------------------------------------------------------------------------------------------------
Position Length Field Description Values Definition
2 6-10
3 11-20
4 21-40
5 41 or more
6 Unknown or not stated
264 1 CIG3_R Cigarettes 3rd Trimester Recode 0 Nonsmoker
1 1-5
2 6-10
3 11-20
4 21-40
5 41 or more
6 Unknown or not stated
265 1 F_CIGS_0 Reporting Flag for Cigarettes before Pregnancy 0 Non-Reporting
1 Reporting
266 1 F_CIGS_1 Reporting Flag for Cigarettes 1st Trimester 0 Non-Reporting
1 Reporting
267 1 F_CIGS_2 Reporting Flag for Cigarettes 2nd Trimester 0 Non-Reporting
1 Reporting
268 1 F_CIGS_3 Reporting Flag for Cigarettes 3rd Trimester 0 Non-Reporting
1 Reporting
269 1 CIG_REC Cigarette Recode Y Yes
N No
U Unknown or not stated
270 1 F_TOBACO Reporting Flag for Tobacco use 0 Non-Reporting
1 Reporting
271-279 9 FILLER_R Filler Blank
280-281 2 M_Ht_In Mother’s Height in Total Inches 30-78 Height in inches
99 Unknown or not stated
282 1 F_M_HT Reporting Flag for Mother’s Height 0 Non-Reporting
1 Reporting
283-286 4 BMI Body Mass Index 13.0-69.9 Body Mass Index
Use reporting flag in field 282 99.9 Unknown or not stated
Data from non-reporting areas for an item are represented by Blanks (“not on certificate”) that are not otherwise indicated in the Values and Definitions.
22
-------------------------------------------------------------------------------------------------------------------------------------------------------------------------------------------------
Position Length Field Description Values Definition
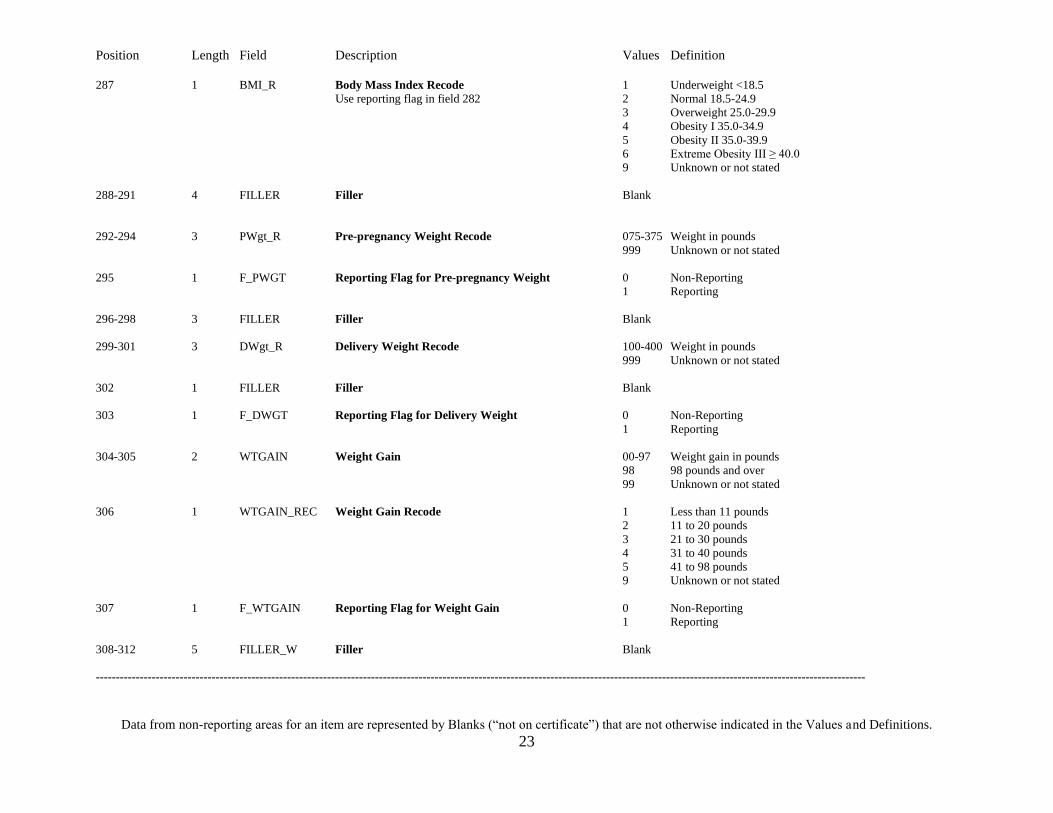
287 1 BMI_R Body Mass Index Recode 1 Underweight <18.5
Use reporting flag in field 282 2 Normal 18.5-24.9
3 Overweight 25.0-29.9
4 Obesity I 35.0-34.9
5 Obesity II 35.0-39.9
6 Extreme Obesity III ≥ 40.0 9 Unknown or not stated
288-291 4 FILLER Filler Blank
292-294 3 PWgt_R Pre-pregnancy Weight Recode 075-375 Weight in pounds
999 Unknown or not stated
295 1 F_PWGT Reporting Flag for Pre-pregnancy Weight 0 Non-Reporting
1 Reporting
296-298 3 FILLER Filler Blank
299-301 3 DWgt_R Delivery Weight Recode 100-400 Weight in pounds
999 Unknown or not stated
302 1 FILLER Filler Blank
303 1 F_DWGT Reporting Flag for Delivery Weight 0 Non-Reporting
1 Reporting
304-305 2 WTGAIN Weight Gain 00-97 Weight gain in pounds
98 98 pounds and over
99 Unknown or not stated
306 1 WTGAIN_REC Weight Gain Recode 1 Less than 11 pounds
2 11 to 20 pounds
3 21 to 30 pounds
4 31 to 40 pounds
5 41 to 98 pounds
9 Unknown or not stated
307 1 F_WTGAIN Reporting Flag for Weight Gain 0 Non-Reporting
1 Reporting
308-312 5 FILLER_W Filler Blank
Data from non-reporting areas for an item are represented by Blanks (“not on certificate”) that are not otherwise indicated in the Values and Definitions.
23

Position Length Field Description Values Definition
313-342 30 Risk Factors
313 1 RF_PDIAB Pre-pregnancy Diabetes Y
N
U
Yes
No
Unknown or not stated
314 1 RF_GDIAB Gestational Diabetes Y
N
U
Yes
No
Unknown or not stated
315 1 RF_PHYPE Pre-pregnancy Hypertension Y
N
U
Yes
No
Unknown or not stated
316 1 RF_GHYPE Gestational Hypertension Y
N
U
Yes
No
Unknown or not stated
317 1 RF_EHYPE Hypertension Eclampsia Y
N
U
Yes
No
Unknown or not stated
318 1 RF_PPTERM Previous Preterm Birth Y
N
U
Yes
No
Unknown or not stated
319 1 F_RF_PDIAB Reporting Flag for Pre-pregnancy Diabetes 0
1
Non-Reporting
Reporting
320 1 F_RF_GDIAB Reporting Flag for Gestational Diabetes 0
1
Non-Reporting
Reporting
321 1 F_RF_PHYPER Reporting Flag for Pre-pregnancy Hypertension 0
1
Non-Reporting
Reporting
322 1 F_RF_GHYPER Reporting Flag for Gestational Hypertension 0
1
Non-Reporting
Reporting
323 1 F_RF_ECLAMP Reporting Flag for Hypertension Eclampsia 0
1
Non-Reporting
Reporting
324 1 F_RF_PPB Reporting Flag for Previous Preterm Birth 0
1
Non-Reporting
Reporting
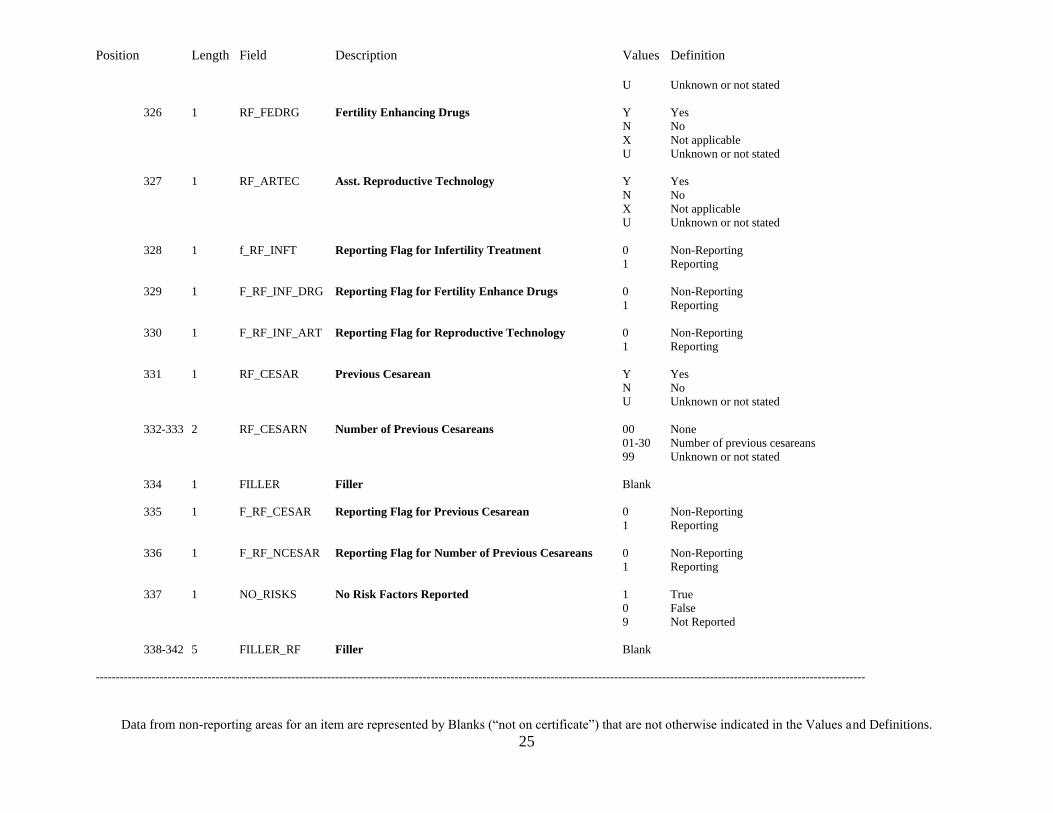
325 1 RF_INFTR Infertility Treatment Used Y
N
Yes
No
Data from non-reporting areas for an item are represented by Blanks (“not on certificate”) that are not otherwise indicated in the Values and Definitions.
24
-------------------------------------------------------------------------------------------------------------------------------------------------------------------------------------------------
Position Length Field Description Values Definition
U Unknown or not stated
326 1 RF_FEDRG Fertility Enhancing Drugs Y
N
X
U
Yes
No
Not applicable
Unknown or not stated
327 1 RF_ARTEC Asst. Reproductive Technology Y
N
X
U
Yes
No
Not applicable
Unknown or not stated
328 1 f_RF_INFT Reporting Flag for Infertility Treatment 0
1
Non-Reporting
Reporting
329 1 F_RF_INF_DRG Reporting Flag for Fertility Enhance Drugs 0
1
Non-Reporting
Reporting
330 1 F_RF_INF_ART Reporting Flag for Reproductive Technology 0
1
Non-Reporting
Reporting
331 1 RF_CESAR Previous Cesarean Y
N
U
Yes
No
Unknown or not stated
332-333 2 RF_CESARN Number of Previous Cesareans 00
01-30
99
None
Number of previous cesareans
Unknown or not stated
334 1 FILLER Filler Blank
335 1 F_RF_CESAR Reporting Flag for Previous Cesarean 0
1
Non-Reporting
Reporting
336 1 F_RF_NCESAR Reporting Flag for Number of Previous Cesareans 0
1
Non-Reporting
Reporting
337 1 NO_RISKS No Risk Factors Reported 1
0
9
True
False
Not Reported
338-342 5 FILLER_RF Filler Blank
Data from non-reporting areas for an item are represented by Blanks (“not on certificate”) that are not otherwise indicated in the Values and Definitions.
25

-------------------------------------------------------------------------------------------------------------------------------------------------------------------------------------------------
Position Length Field Description Values Definition
343-358 15 Infections Present
343 1 IP_GON Gonorrhea Y
N
U
Yes
No
Unknown or not stated
344 1 IP_SYPH Syphilis Y
N
U
Yes
No
Unknown or not stated
345 1 IP_CHLAM Chlamydia Y
N
U
Yes
No
Unknown or not stated
346 1 IP_HEPB Hepatitis B Y
N
U
Yes
No
Unknown or not stated
347 1 IP_HEPC Hepatitis C Y
N
U
Yes
No
Unknown or not stated
348 1 F_IP_GONOR Reporting Flag for Gonorrhea 0
1
Non-Reporting
Reporting
349 1 F_IP_SYPH Reporting Flag for Syphilis 0
1
Non-Reporting
Reporting
350 1 F_IP_CHLAM Reporting Flag for Chlamydia 0
1
Non-Reporting
Reporting
351 1 F_IP_HEPATB Reporting Flag for Hepatitis B 0
1
Non-Reporting
Reporting
352 1 F_IP_HEPATC Reporting Flag for Hepatitis C 0
1
Non-Reporting
Reporting
353 1 NO_INFEC No Infections Reported 1
0
9
True
False
Not Reported
354-358 5 FILLER_IP Filler_IP Blank
Data from non-reporting areas for an item are represented by Blanks (“not on certificate”) that are not otherwise indicated in the Values and Definitions.
26
-------------------------------------------------------------------------------------------------------------------------------------------------------------------------------------------------
Position Length Field Description Values Definition
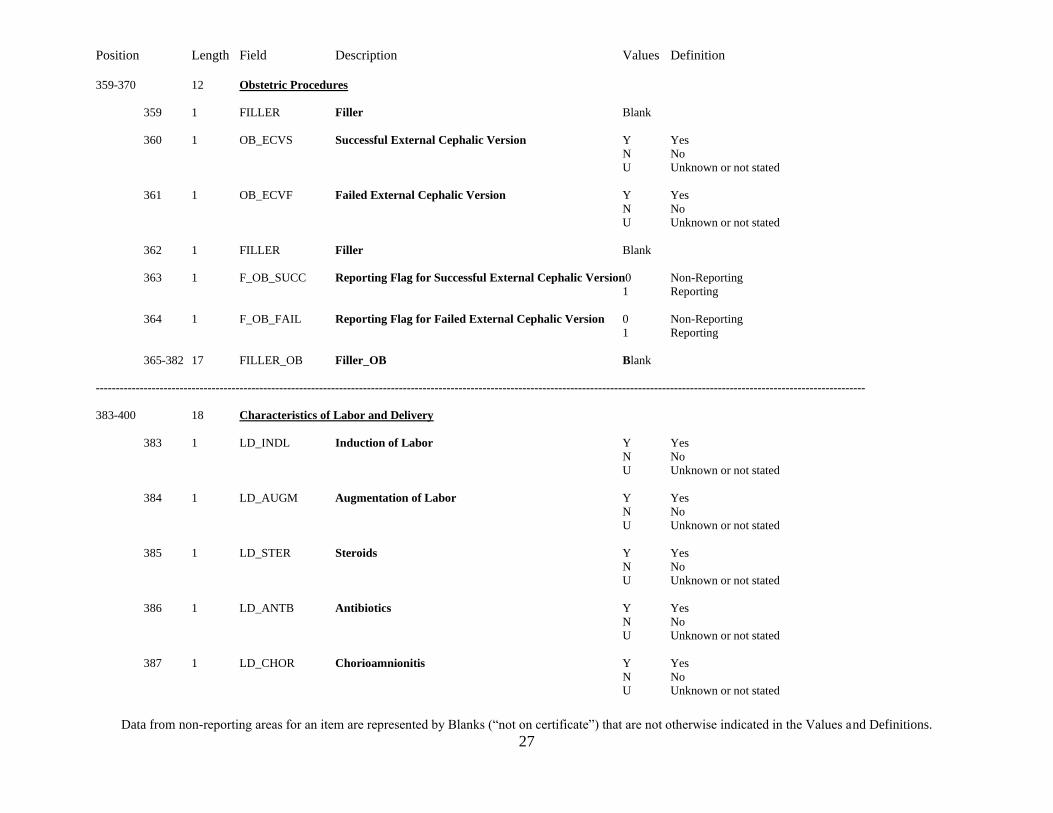
359-370 12 Obstetric Procedures
359 1 FILLER Filler Blank
360 1 OB_ECVS Successful External Cephalic Version Y Yes
N No
U Unknown or not stated
361 1 OB_ECVF Failed External Cephalic Version Y Yes
N No
U Unknown or not stated
362 1 FILLER Filler Blank
363 1 F_OB_SUCC Reporting Flag for Successful External Cephalic Version0 Non-Reporting
1 Reporting
364 1 F_OB_FAIL Reporting Flag for Failed External Cephalic Version 0 Non-Reporting
1 Reporting
365-382 17 FILLER_OB Filler_OB Blank
383-400 18 Characteristics of Labor and Delivery
383 1 LD_INDL Induction of Labor Y Yes
N No
U Unknown or not stated
384 1 LD_AUGM Augmentation of Labor Y Yes
N No
U Unknown or not stated
385 1 LD_STER Steroids Y Yes
N No
U Unknown or not stated
386 1 LD_ANTB Antibiotics Y Yes
N No
U Unknown or not stated
387 1 LD_CHOR Chorioamnionitis Y Yes
N No
U Unknown or not stated
Data from non-reporting areas for an item are represented by Blanks (“not on certificate”) that are not otherwise indicated in the Values and Definitions.
27

-------------------------------------------------------------------------------------------------------------------------------------------------------------------------------------------------
Position Length Field Description Values Definition
388 1 LD_ANES Anesthesia Y Yes
N No
U Unknown or not stated
389 1 F_LD_INDL Reporting Flag for Induction of Labor 0 Non-Reporting
1 Reporting
390 1 F_LD_AUGM Reporting Flag for Augmentation of Labor 0 Non-Reporting
1 Reporting
391 1 F_LD_STER Reporting Flag for Steroids 0 Non-Reporting
1 Reporting
392 1 F_LD_ANTB Reporting Flag for Antibiotics 0 Non-Reporting
1 Reporting
393 1 F_LD_CHOR Reporting Flag for Chorioamnionitis 0 Non-Reporting
1 Reporting
394 1 F_LD_ANES Reporting Flag for Anesthesia 0 Non-Reporting
1 Reporting
395 1 NO_LBRDLV No Characteristics of Labor Reported 1 True
0 False
9 Not Reported
396-400 5 FILLER_LD Filler Blank
401-414 14 Method of Delivery
401 1 ME_PRES Fetal Presentation at Delivery 1 Cephalic
2 Breech
3 Other
9 Unknown or not stated
402 1 ME_ROUT Final Route & Method of Delivery 1 Spontaneous
2 Forceps
3 Vacuum
4 Cesarean
9 Unknown or not stated
403 1 ME_TRIAL Trial of Labor Attempted (if cesarean) Y Yes
N No
X Not applicable
Data from non-reporting areas for an item are represented by Blanks (“not on certificate”) that are not otherwise indicated in the Values and Definitions.
28
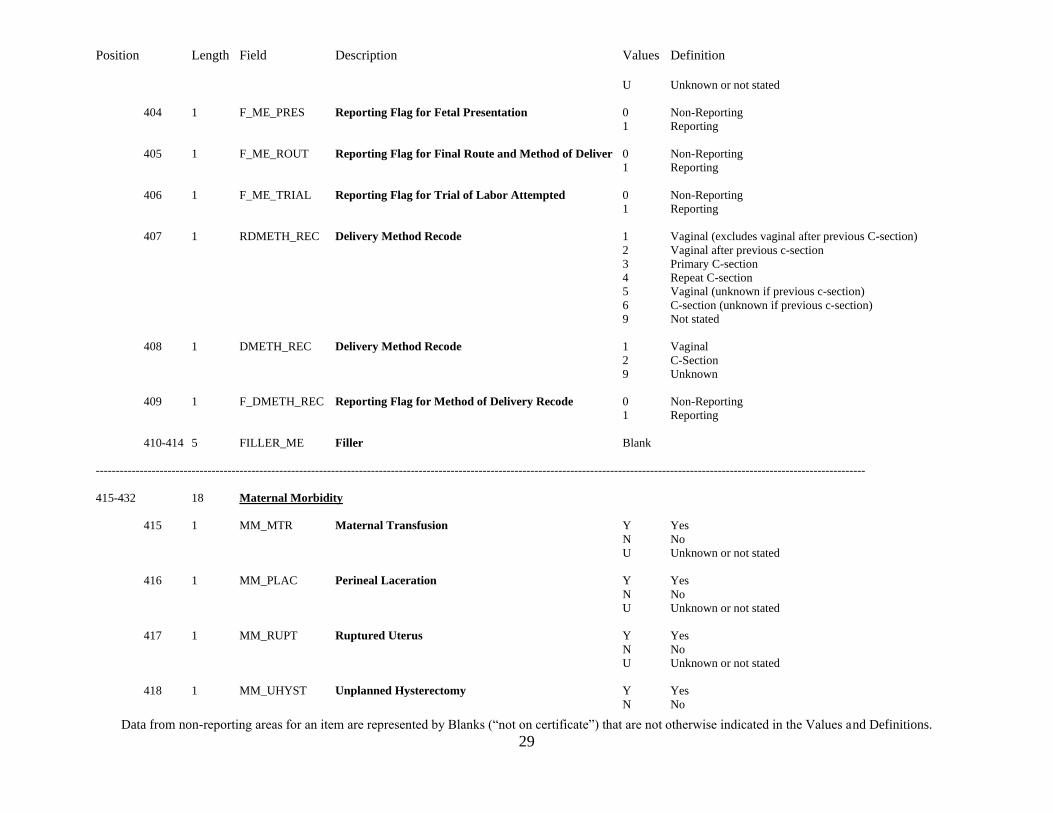
-------------------------------------------------------------------------------------------------------------------------------------------------------------------------------------------------
Position Length Field Description Values Definition
U Unknown or not stated
404 1 F_ME_PRES Reporting Flag for Fetal Presentation 0 Non-Reporting
1 Reporting
405 1 F_ME_ROUT Reporting Flag for Final Route and Method of Deliver 0 Non-Reporting
1 Reporting
406 1 F_ME_TRIAL Reporting Flag for Trial of Labor Attempted 0 Non-Reporting
1 Reporting
407 1 RDMETH_REC Delivery Method Recode 1 Vaginal (excludes vaginal after previous C-section)
2 Vaginal after previous c-section
3 Primary C-section
4 Repeat C-section
5 Vaginal (unknown if previous c-section)
6 C-section (unknown if previous c-section)
9 Not stated
408 1 DMETH_REC Delivery Method Recode 1 Vaginal
2 C-Section
9 Unknown
409 1 F_DMETH_REC Reporting Flag for Method of Delivery Recode 0 Non-Reporting
1 Reporting
410-414 5 FILLER_ME Filler Blank
415-432 18 Maternal Morbidity
415 1 MM_MTR Maternal Transfusion Y Yes
N No
U Unknown or not stated
416 1 MM_PLAC Perineal Laceration Y Yes
N No
U Unknown or not stated
417 1 MM_RUPT Ruptured Uterus Y Yes
N No
U Unknown or not stated
418 1 MM_UHYST Unplanned Hysterectomy Y Yes
N No
Data from non-reporting areas for an item are represented by Blanks (“not on certificate”) that are not otherwise indicated in the Values and Definitions.
29
-------------------------------------------------------------------------------------------------------------------------------------------------------------------------------------------------
Position Length Field Description Values Definition
U Unknown or not stated
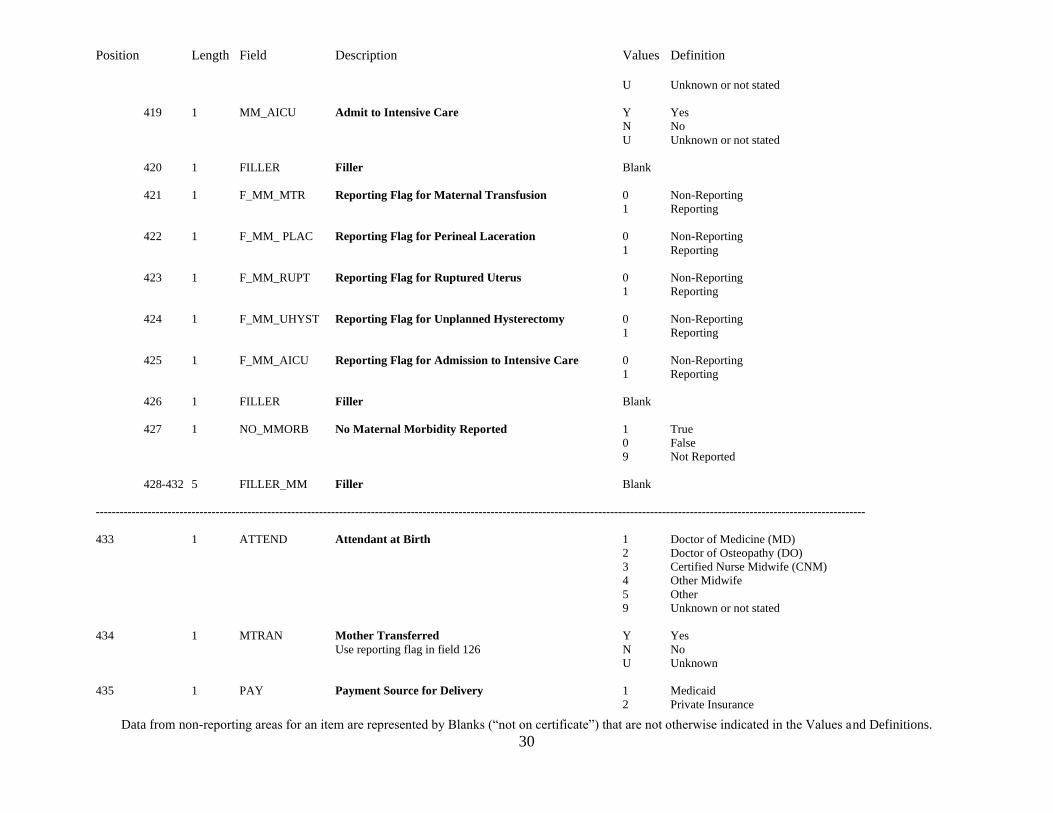
419 1 MM_AICU Admit to Intensive Care Y Yes
N No
U Unknown or not stated
420 1 FILLER Filler Blank
421 1 F_MM_MTR Reporting Flag for Maternal Transfusion 0 Non-Reporting
1 Reporting
422 1 F_MM_ PLAC Reporting Flag for Perineal Laceration 0 Non-Reporting
1 Reporting
423 1 F_MM_RUPT Reporting Flag for Ruptured Uterus 0 Non-Reporting
1 Reporting
424 1 F_MM_UHYST Reporting Flag for Unplanned Hysterectomy 0 Non-Reporting
1 Reporting
425 1 F_MM_AICU Reporting Flag for Admission to Intensive Care 0 Non-Reporting
1 Reporting
426 1 FILLER Filler Blank
427 1 NO_MMORB No Maternal Morbidity Reported 1 True
0 False
9 Not Reported
428-432 5 FILLER_MM Filler Blank
433 1 ATTEND Attendant at Birth 1 Doctor of Medicine (MD)
2 Doctor of Osteopathy (DO)
3 Certified Nurse Midwife (CNM)
4 Other Midwife
5 Other
9 Unknown or not stated
434 1 MTRAN Mother Transferred Y Yes
Use reporting flag in field 126 N No
U Unknown
435 1 PAY Payment Source for Delivery 1 Medicaid
2 Private Insurance
Data from non-reporting areas for an item are represented by Blanks (“not on certificate”) that are not otherwise indicated in the Values and Definitions.
30

-------------------------------------------------------------------------------------------------------------------------------------------------------------------------------------------------
Position Length Field Description Values Definition
3 Self-Pay
4 Indian Health Service
5 CHAMPUS/TRICARE
6 Other Government (Federal, State, Local)
8 Other
9 Unknown
436 1 PAY_REC Payment Recode 1 Medicaid
2 Private Insurance
3 Self Pay
4 Other
9 Unknown
437 1 F_PAY Reporting Flag for Source of Payment 0 Non-Reporting
1 Reporting
438 1 F_PAY_REC Reporting Flag for Payment Recode 0 Non-Reporting
1 Reporting
439-443 5 FILLER_A Filler Blank
444-445 2 APGAR5 Five Minute APGAR Score 00-10 A score of 0-10
99 Unknown or not stated
446 1 APGAR5R Five Minute APGAR Recode 1 A score of 0-3
2 A score of 4-6
3 A score of 7-8
4 A score of 9-10
5 Unknown or not stated
447 1 F_APGAR5 Reporting Flag for Five minute APGAR 0 Non-Reporting
1 Reporting
448-449 2 APGAR10 Ten Minute APGAR Score 00-10 A score of 0-10
Use reporting flag in field 126 88 Not applicable
99 Unknown or not stated
450 1 APGAR10R Ten Minute APGAR Recode 1 A score of 0-3
Use reporting flag in field 126 2 A score of 4-6
3 A score of 7-8
4 A score of 9-10
5 Not stated/not applicable
451-453 3 FILLER Filler Blank
Data from non-reporting areas for an item are represented by Blanks (“not on certificate”) that are not otherwise indicated in the Values and Definitions.
31

-------------------------------------------------------------------------------------------------------------------------------------------------------------------------------------------------
Position Length Field Description Values Definition
454 1 DPLURAL Plurality Recode 1 Single
2 Twin
3 Triplet
4 Quadruplet
5 Quintuplet or higher
455 1 FILLER Filler Blank
456 1 IMP_PLUR Plurality Imputed Blank Plurality is not imputed
1 Plurality is imputed
457-458 2 FILLER Filler Blank
1st 459 1 SETORDER_R Set Order Recode 1
2nd Use reporting flag in field 126 2
3rd 3
4th 4
5 5th to 16th
9 Unknown or not stated
460-474 15 FILLER Filler Blank
475 1 SEX Sex of Infant M Male
F Female
476 1 IMP_SEX Imputed Sex Blank Infant Sex not Imputed
1 Infant Sex is Imputed
477-478 2 DLMP_MM Last Normal Menses Month 01 January
02 February
03 March
04 April
05 May
06 June
07 July
08 August
09 September
10 October
11 November
12 December
99 Unknown or not stated
479-480 2 FILLER Filler Blank
Data from non-reporting areas for an item are represented by Blanks (“not on certificate”) that are not otherwise indicated in the Values and Definitions.
32
Position Length Field Description Values Definition
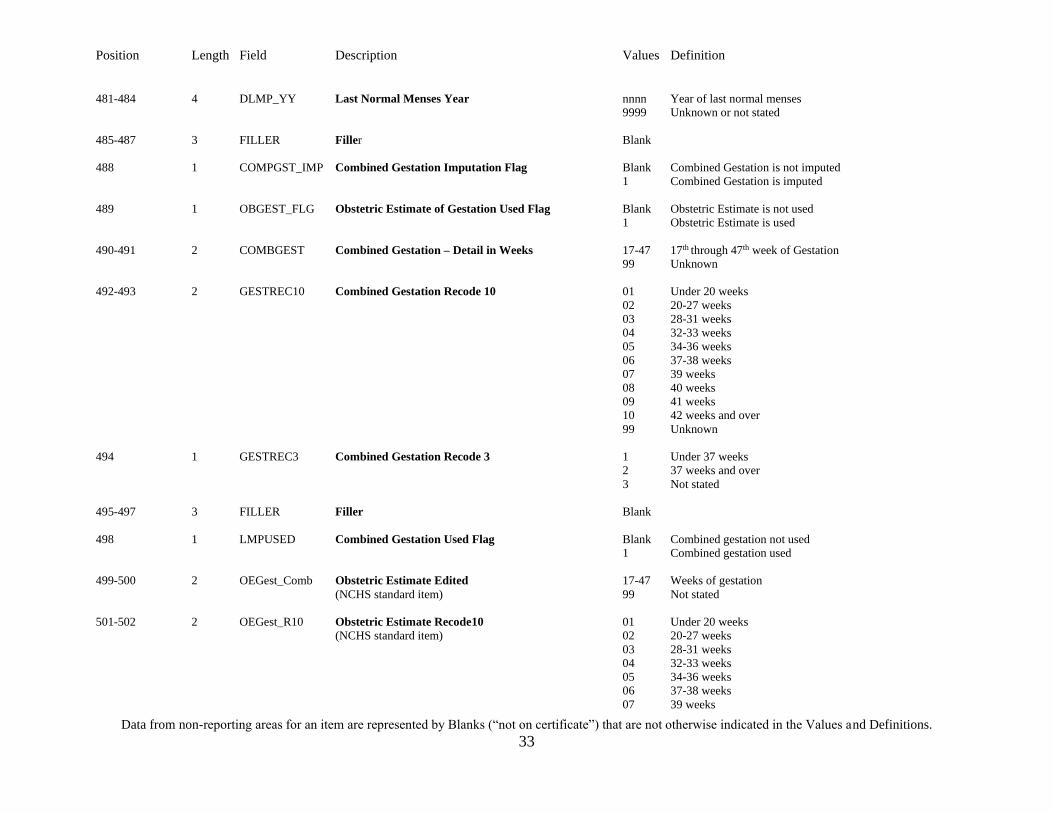
481-484 4 DLMP_YY Last Normal Menses Year nnnn Year of last normal menses
9999 Unknown or not stated
485-487 3 FILLER Filler Blank
488 1 COMPGST_IMP Combined Gestation Imputation Flag Blank Combined Gestation is not imputed
1 Combined Gestation is imputed
489 1 OBGEST_FLG Obstetric Estimate of Gestation Used Flag Blank Obstetric Estimate is not used
1 Obstetric Estimate is used
490-491 2 COMBGEST Combined Gestation – Detail in Weeks 17-47 17th through 47th week of Gestation
99 Unknown
492-493 2 GESTREC10 Combined Gestation Recode 10 01 Under 20 weeks
02 20-27 weeks
03 28-31 weeks
04 32-33 weeks
05 34-36 weeks
06 37-38 weeks
07 39 weeks
08 40 weeks
09 41 weeks
10 42 weeks and over
99 Unknown
494 1 GESTREC3 Combined Gestation Recode 3 1 Under 37 weeks
2 37 weeks and over
3 Not stated
495-497 3 FILLER Filler Blank
498 1 LMPUSED Combined Gestation Used Flag Blank Combined gestation not used
1 Combined gestation used
499-500 2 OEGest_Comb Obstetric Estimate Edited 17-47 Weeks of gestation
(NCHS standard item) 99 Not stated
501-502 2 OEGest_R10 Obstetric Estimate Recode10 01 Under 20 weeks
(NCHS standard item) 02 20-27 weeks
03 28-31 weeks
04 32-33 weeks
05 34-36 weeks
06 37-38 weeks
07 39 weeks
Data from non-reporting areas for an item are represented by Blanks (“not on certificate”) that are not otherwise indicated in the Values and Definitions.
33
-------------------------------------------------------------------------------------------------------------------------------------------------------------------------------------------------
-------------------------------------------------------------------------------------------------------------------------------------------------------------------------------------------------
Position Length Field Description Values Definition
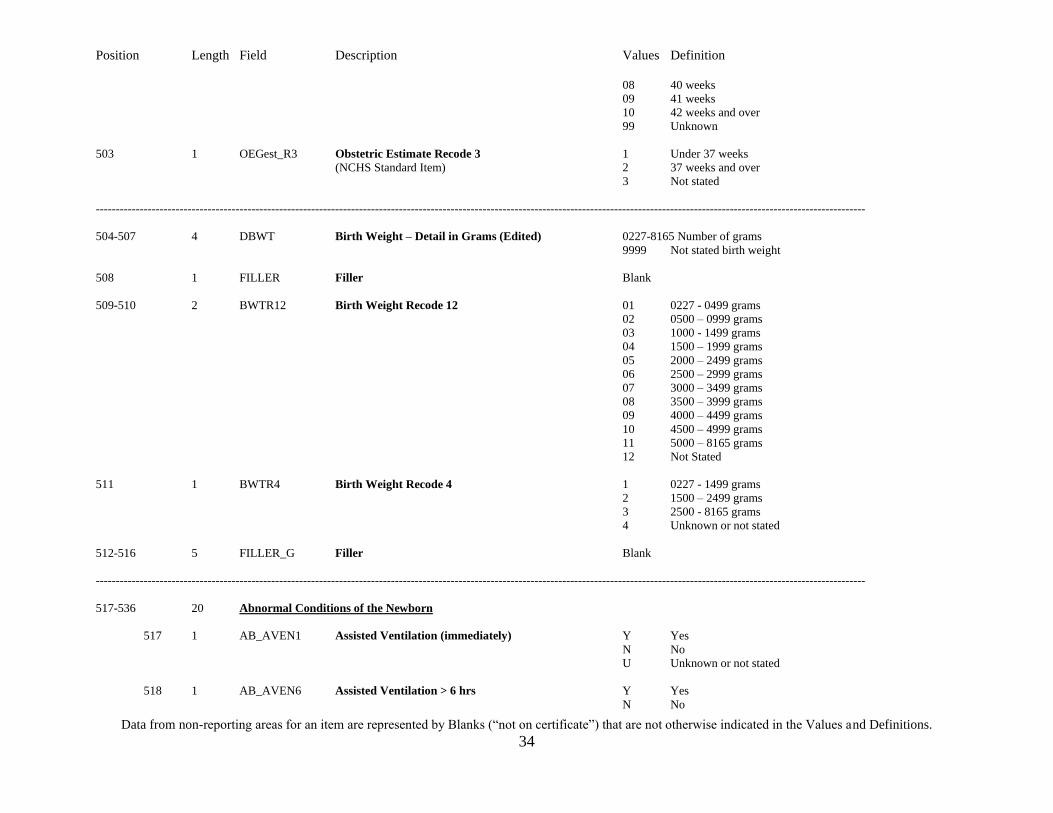
08 40 weeks
09 41 weeks
10 42 weeks and over
99 Unknown
503 1 OEGest_R3 Obstetric Estimate Recode 3 1 Under 37 weeks
(NCHS Standard Item) 2 37 weeks and over
3 Not stated
504-507 4 DBWT Birth Weight – Detail in Grams (Edited) 0227-8165 Number of grams
9999 Not stated birth weight
508 1 FILLER Filler Blank
509-510 2 BWTR12 Birth Weight Recode 12 01 0227 - 0499 grams
02 0500 – 0999 grams
03 1000 - 1499 grams
04 1500 – 1999 grams
05 2000 – 2499 grams
06 2500 – 2999 grams
07 3000 – 3499 grams
08 3500 – 3999 grams
09 4000 – 4499 grams
10 4500 – 4999 grams
11 5000 – 8165 grams
12 Not Stated
511 1 BWTR4 Birth Weight Recode 4 1 0227 - 1499 grams
2 1500 – 2499 grams
3 2500 - 8165 grams
4 Unknown or not stated
512-516 5 FILLER_G Filler Blank
517-536 20 Abnormal Conditions of the Newborn
517 1 AB_AVEN1 Assisted Ventilation (immediately) Y Yes
N No
U Unknown or not stated
518 1 AB_AVEN6 Assisted Ventilation > 6 hrs Y Yes
N No
Data from non-reporting areas for an item are represented by Blanks (“not on certificate”) that are not otherwise indicated in the Values and Definitions.
34
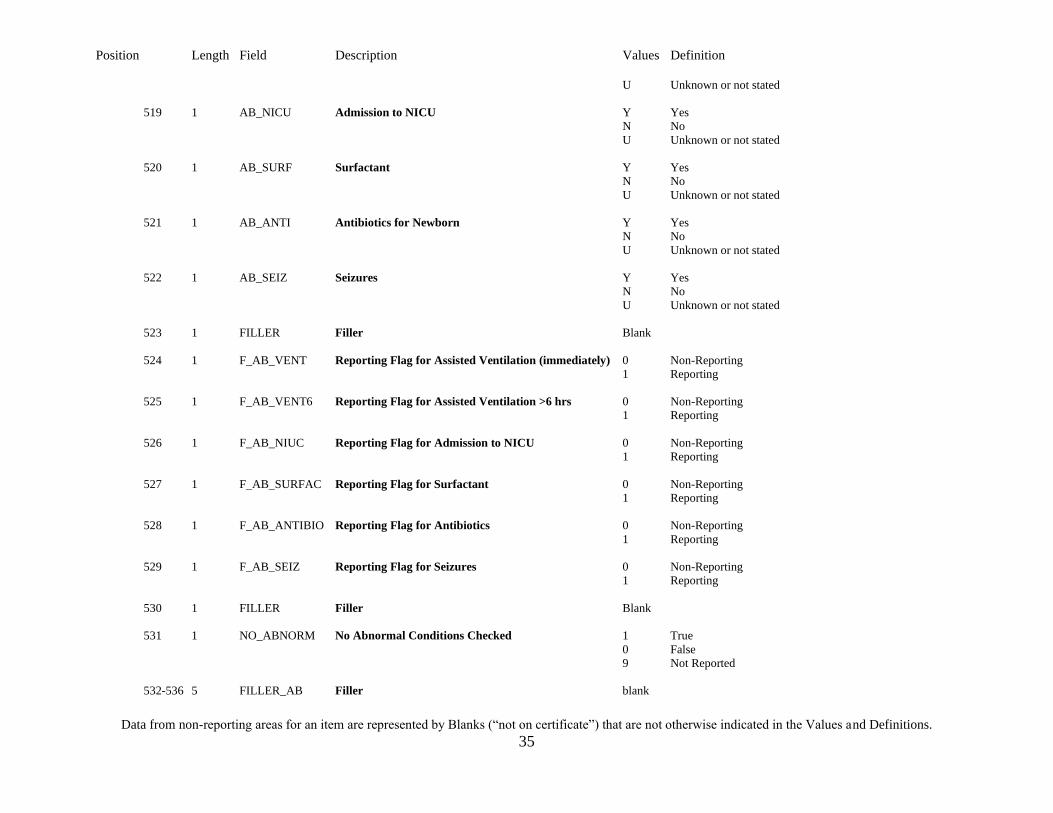
Position Length Field Description Values Definition
U Unknown or not stated
519 1 AB_NICU Admission to NICU Y
N
U
Yes
No
Unknown or not stated
520 1 AB_SURF Surfactant Y
N
U
Yes
No
Unknown or not stated
521 1 AB_ANTI Antibiotics for Newborn Y
N
U
Yes
No
Unknown or not stated
522 1 AB_SEIZ Seizures Y
N
U
Yes
No
Unknown or not stated
523 1 FILLER Filler Blank
524 1 F_AB_VENT Reporting Flag for Assisted Ventilation (immediately) 0
1
Non-Reporting
Reporting
525 1 F_AB_VENT6 Reporting Flag for Assisted Ventilation >6 hrs 0
1
Non-Reporting
Reporting
526 1 F_AB_NIUC Reporting Flag for Admission to NICU 0
1
Non-Reporting
Reporting
527 1 F_AB_SURFAC Reporting Flag for Surfactant 0
1
Non-Reporting
Reporting
528 1 F_AB_ANTIBIO Reporting Flag for Antibiotics 0
1
Non-Reporting
Reporting
529 1 F_AB_SEIZ Reporting Flag for Seizures 0
1
Non-Reporting
Reporting
530 1 FILLER Filler Blank
531 1 NO_ABNORM No Abnormal Conditions Checked 1
0
9
True
False
Not Reported
532-536 5 FILLER_AB Filler blank
Data from non-reporting areas for an item are represented by Blanks (“not on certificate”) that are not otherwise indicated in the Values and Definitions.
35
-------------------------------------------------------------------------------------------------------------------------------------------------------------------------------------------------
Position Length Field Description Values Definition
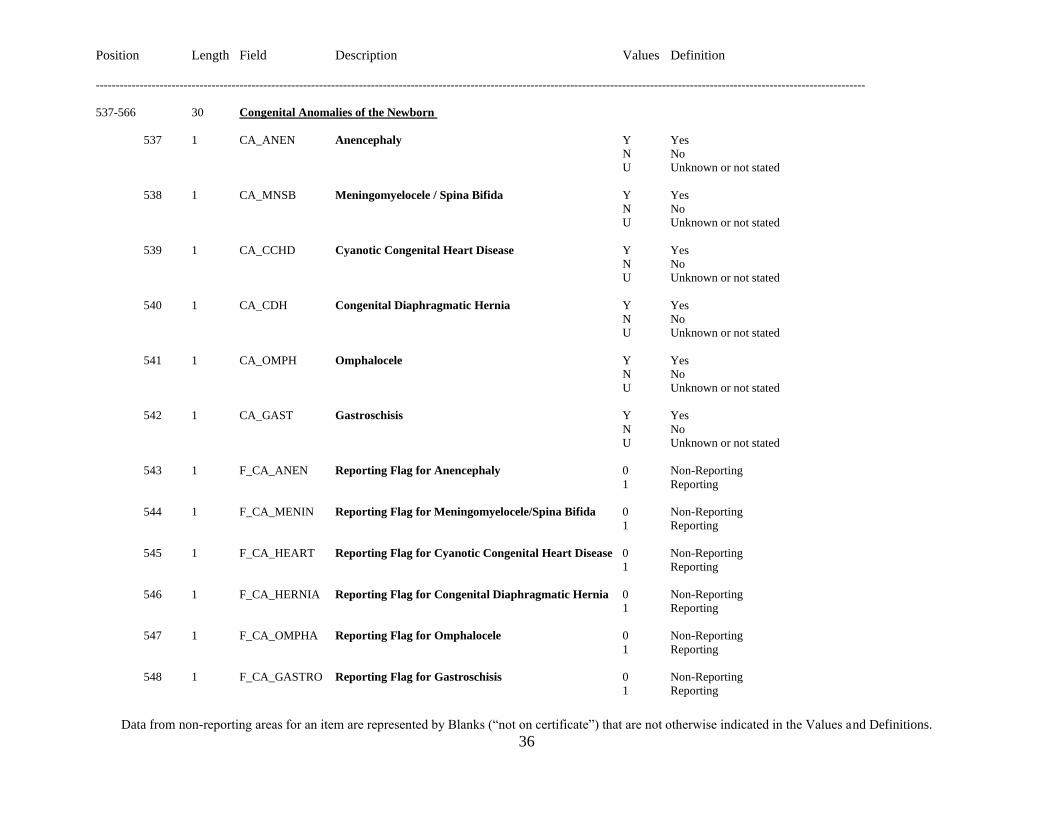
537-566 30 Congenital Anomalies of the Newborn
537 1 CA_ANEN Anencephaly Y
N
U
Yes
No
Unknown or not stated
538 1 CA_MNSB Meningomyelocele / Spina Bifida Y
N
U
Yes
No
Unknown or not stated
539 1 CA_CCHD Cyanotic Congenital Heart Disease Y
N
U
Yes
No
Unknown or not stated
540 1 CA_CDH Congenital Diaphragmatic Hernia Y
N
U
Yes
No
Unknown or not stated
541 1 CA_OMPH Omphalocele Y
N
U
Yes
No
Unknown or not stated
542 1 CA_GAST Gastroschisis Y
N
U
Yes
No
Unknown or not stated
543 1 F_CA_ANEN Reporting Flag for Anencephaly 0
1
Non-Reporting
Reporting
544 1 F_CA_MENIN Reporting Flag for Meningomyelocele/Spina Bifida 0
1
Non-Reporting
Reporting
545 1 F_CA_HEART Reporting Flag for Cyanotic Congenital Heart Disease 0
1
Non-Reporting
Reporting
546 1 F_CA_HERNIA Reporting Flag for Congenital Diaphragmatic Hernia 0
1
Non-Reporting
Reporting
547 1 F_CA_OMPHA Reporting Flag for Omphalocele 0
1
Non-Reporting
Reporting
548 1 F_CA_GASTRO Reporting Flag for Gastroschisis 0
1
Non-Reporting
Reporting
Data from non-reporting areas for an item are represented by Blanks (“not on certificate”) that are not otherwise indicated in the Values and Definitions.
36
Position Length Field Description Values Definition
549 1 CA_LIMB Limb Reduction Defect Y
N
U
Yes
No
Unknown or not stated
550 1 CA_CLEFT Cleft Lip w/ or w/o Cleft Palate Y
N
U
Yes
No
Unknown or not stated
551 1 CA_CLPAL Cleft Palate alone Y
N
U
Yes
No
Unknown or not stated
552 1 CA_DOWN Down Syndrome C
P
N
U
Confirmed
Pending
No
Unknown
553 1 CA_DISOR Suspected Chromosomal Disorder C
P
N
U
Confirmed
Pending
No
Unknown
554 1 CA_HYPO Hypospadias Y
N
U
Yes, anomaly reported
No, anomaly not reported
Unknown
555 1 F_CA_LIMB Reporting Flag for Limb Reduction Defect 0
1
Non-Reporting
Reporting
556 1 F_CA_CLEFTLP Reporting Flag for Cleft Lip with or without Cleft Palate0
1
Non-Reporting
Reporting
557 1 F_CA_CLEFT Reporting Flag for Cleft Palate Alone 0
1
Non-Reporting
Reporting
558 1 F_CA_DOWNS Reporting Flag for Down Syndrome 0
1
Non-Reporting
Reporting
559 1 F_CA_CHROM Reporting Flag for Suspected Chromosomal Disorder 0
1
Non-Reporting
Reporting
560 1 F_CA_HYPOS Reporting Flag for Hypospadias 0
1
Non-Reporting
Reporting
561 1 NO_CONGEN No Congenital Anomalies Checked 1
0
True
False
Data from non-reporting areas for an item are represented by Blanks (“not on certificate”) that are not otherwise indicated in the Values and Definitions.
37
-------------------------------------------------------------------------------------------------------------------------------------------------------------------------------------------------
-------------------------------------------------------------------------------------------------------------------------------------------------------------------------------------------------
Position Length Field Description Values Definition
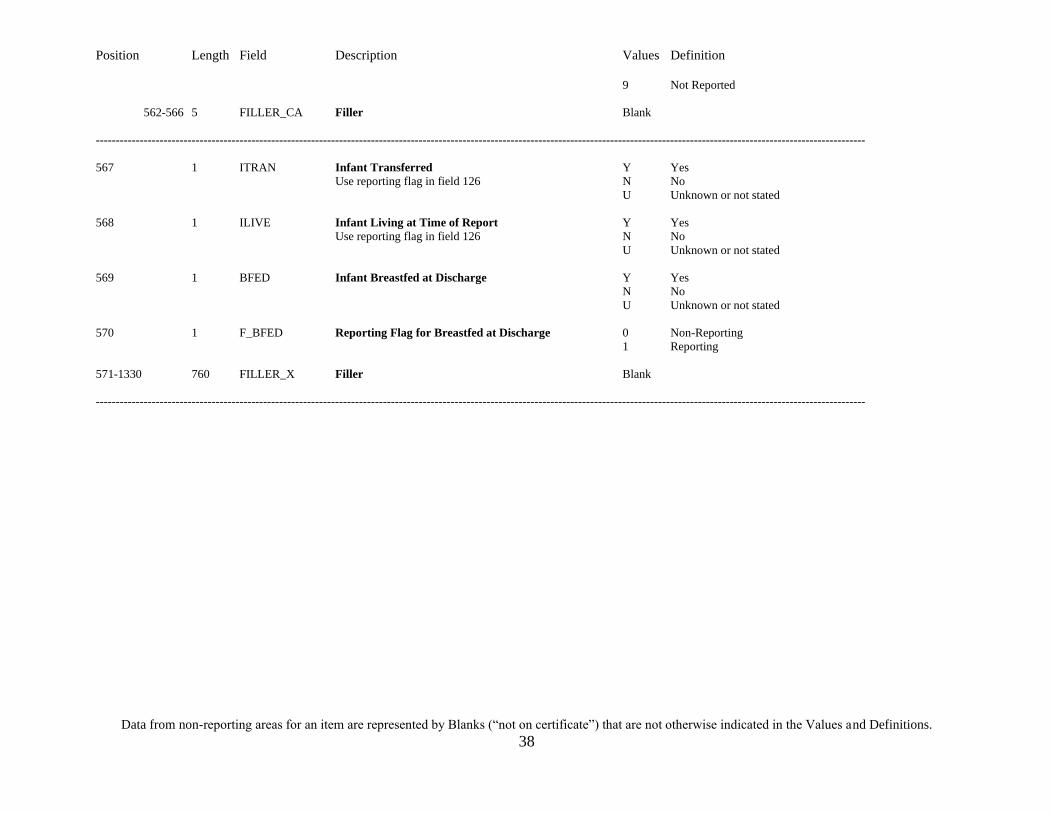
9 Not Reported
562-566 5 FILLER_CA Filler Blank
567 1 ITRAN Infant Transferred Y Yes
Use reporting flag in field 126 N No
U Unknown or not stated
568 1 ILIVE Infant Living at Time of Report Y Yes
Use reporting flag in field 126 N No
U Unknown or not stated
569 1 BFED Infant Breastfed at Discharge Y Yes
N No
U Unknown or not stated
570 1 F_BFED Reporting Flag for Breastfed at Discharge 0 Non-Reporting
1 Reporting
571-1330 760 FILLER_X Filler Blank
Data from non-reporting areas for an item are represented by Blanks (“not on certificate”) that are not otherwise indicated in the Values and Definitions.
38
Position Length Field Description Values Definition
ADDENDUM
Detailed geographic information for the territories.
24-25 2 OCTERR Mother’s Occurrence Territory/Possession Outlying Areas of the United States
AS American Samoa
GU Guam
MP Northern Marianas
PR Puerto Rico
VI Virgin Islands
US United States (births to residents of the 50 states or DC)
XX Not Applicable
ZZ Not Classifiable
28-30 3 OCNTYFIPS Occurrence FIPS County Puerto Rico
021 Bayamo’n 025 Caguas
031 Carolina
097 Mayaguez
113 Ponce
127 San Juan
999 County of less than 100,000
Other Outlying Areas of the United States
000 No county level geography
999 County of less than 100,000
31 1 OCNTYPOP Occurrence County Pop 0 County of 1,000,000 or more
1 County of 500,000 to 1,000,000
2 County of 250,000 to 500,000
3 County of 100,000 to 250,000
4 County of 50,000 to 100,000
5 County of 25,000 to 50,000
6 County of 10,000 to 25,000
9 County less than 10,000
80-81 2 MBCNTRY Mother’s Birth Country AA-ZZ See Geographic Documentation
85-86 2 MRCNTRY Mother’s Residence Country AA-ZZ See Geographic Documentation
89-90 2 MRTERR Mother’s Residence Territory Outlying Areas of the United States
AS American Samoa
GU Guam
MP Northern Marianas
PR Puerto Rico
Data from non-reporting areas for an item are represented by Blanks (“not on certificate”) that are not otherwise indicated in the Values and Definitions.
39

Position Length Field Description Values Definition
VI
US
XX
ZZ
Virgin Islands
United States (births to residents of the 50 states or DC)
Not Applicable
Not Classifiable
91-93 3 RCNTY Residence FIPS county Puerto Rico
021 Bayamo’n 025 Caguas
031 Carolina
097 Mayaguez
113 Ponce
127 San Juan
999 County of less than 100,000
Other Outlying Areas of the United States
000 No county level geography
999 County of less than 100,000
99 1 RCNTY_POP Population of Residence County 0
1
2
3
4
5
6
9
Z
County of 1,000,000 or more
County of 500,000 to 1,000,000
County of 250,000 to 500,000
County of 100,000 to 250,000
County of 50,000 to 100,000
County of 25,000 to 50,000
County of 10,000 to 25,000
County less than 10,000
Foreign resident
100 1 RCITY_POP Population of Residence City 0
1
2
3
4
5
6
9
Z
City of 1,000,000 or more
City of 500,000 to 1,000,000
City of 250,000 to 500,000
City of 100,000 to 250,000
City of 50,000 to 100,000
City of 25,000 to 50,000
City of 10,000 to 25,000
All other areas in the US
Foreign resident
103 1 RECTYPE Record Type 1
2
RESIDENT: Territory and county of occurrence and
residence are the same.
NONRESIDENT: Territory and county of occurrence and
residence are different.
Data from non-reporting areas for an item are represented by Blanks (“not on certificate”) that are not otherwise indicated in the Values and Definitions.
40


DETAILED TECHNICAL NOTES
UNITED STATES
2019
NATALITY
U.S. DEPARTMENT OF
HEALTH AND HUMAN SERVICES
CENTERS FOR DISEASE CONTROL AND PREVENTION
NATIONAL CENTER FOR HEALTH STATISTICS
Hyattsville, Maryland: 2020
47
Introduction
These Detailed Technical Notes, published by the Centers for Disease Control and Prevention’s
National Center for Health Statistics (NCHS), supplement the “Technical Notes” section of “Births:
Final Data for 2019” [1], and are for use with the 2019 Natality public use data. The 2019 natality
micro-data file may be downloaded at http://www.cdc.gov/nchs/data_access/VitalStatsOnline.htm [2].
The micro-data natality file does not include geographic detail (e.g., state or county of birth). Selected
natality data, including some geographic data, are available in CDC WONDER (http://wonder.cdc.gov).
CDC WONDER is an interactive online data access tool that provides selected natality data from 1995-
2016. Beginning with the 2016 data, all items available in the public use file will be available in CDC
WONDER.
A review of 2003-based birth certificate revision items in 2014 and 2015 by a collaborative
effort among representatives from several vital statistics jurisdictions: The National Association for
Public Health Statistics and Information Systems (NAPHSIS), and NCHS, resulted in the decision to
drop a number of items from the national birth certificate data file for reasons of poor data quality. For
more information on this effort and for a full list of items that were dropped, see
https://www.cdc.gov/nchs/nvss/deleted_items_from_birth_fetal_death_files.htm.
Key natality items are presented in “Births in the United States, 2019,” which will accompany
the release of the 2019 public use file [2]. Information on other items can be found in the upcoming
2019 final report and accompanying internet tables [1]. Additional discussion of selected items (e.g.,
sexually transmitted infections during pregnancy, vaginal births after previous cesarean, and twin
childbearing) is available in recent reports [3-7]. Assessments of the quality of many medical and health
items are also available [8,9].
Table B presents a listing of items and the percentage of records that were not stated for all
reporting areas: each state, New York City, the District of Columbia, plus Puerto Rico, Guam, the U.S.
Virgin Islands, American Samoa, and the Northern Marianas. Note that Virgin Islands and American
Samoa did not report for 2019.
Definition of Live Birth
Every product of conception that gives a sign of life after birth, regardless of the length of the
pregnancy, is considered a live birth. This concept is included in the definition set forth by the World
Health Organization in 1950 as described in a United Nation’s Handbook [10]. A slightly expanded
definition of live birth was recommended by the 1992 and 2011 revisions of the Model State Vital
48
Statistics Act and Regulations [11,12], based on recommendations of a 1988 working group formed by
the American Academy of Pediatrics and the American College of Obstetricians and Gynecologists [13]
and is consistent with that currently used by the WHO in the ICD-10 [14] and the United Nations:
“Live birth” means the complete expulsion or extraction from its mother of a product of human
conception, irrespective of the duration of pregnancy, which, after such expulsion or extraction,
breathes, or shows any other evidence of life, such as beating of the heart, pulsation of the
umbilical cord, or definite movement of voluntary muscles, whether or not the umbilical cord has
been cut or the placenta is attached. Heartbeats are to be distinguished from transient cardiac
contractions; respirations are to be distinguished from fleeting respiratory efforts or gasps.
This definition distinguishes a live birth from a fetal death in precise terms [15,16]. The vast
majority of registration areas use definitions of live births similar to this definition [15]. All states
require the reporting of live births regardless of length of gestation or birth weight.
The Birth Registration Area
The birth registration system of the United States includes the 50 states, the District of Columbia,
the independent registration area of New York City, and Puerto Rico, the U.S. Virgin Islands, Guam,
American Samoa, and the Commonwealth of the Northern Mariana Islands (referred to as Northern
Marianas). In statistical tabulations, “United States” refers only to the aggregate of the 50 states
(including New York City) and the District of Columbia. Information on the history and development of
the birth-registration area is available elsewhere [17].
Natality statistics for all states and the District of Columbia are based on information for all
births registered in the reporting areas. The information is received on electronic files consisting of
individual records processed by the states, the District of Columbia, New York City, Puerto Rico, the
U.S. Virgin Islands, American Samoa, and the Northern Marianas. NCHS receives these files from the
registration offices of all states, the two cities and four territories through the Vital Statistics Cooperative
Program. Information for Guam and Northern Marianas for 2019 is obtained from images of original
birth certificates, which are coded and keyed by NCHS. For historical information on the birth
registration system, see the User Guide to the 2014 Natality Public Use File [18].
U.S. natality data are limited to births occurring within the United States, including those
occurring to U.S. residents and nonresidents. Births to nonresidents of the United States have been
excluded from most published tabulations by place of residence (for further discussion see
“Classification by occurrence and residence”). Births occurring to U.S. citizens or residents outside the
49

United States are not included in the natality file. Data for Puerto Rico, the U.S. Virgin Islands, Guam,
American Samoa, and the Northern Marianas are limited to births registered in these areas.
Classification of births by occurrence and residence
In tabulations by place of residence, births occurring within the United States to U.S. citizens and
to residents who are not citizens are allocated to the usual place of residence of the mother in the United
States, as reported on the birth certificate. Births to U.S. residents occurring outside this country are not
included in tabulations by place of residence or place of occurrence.
The total count of births for the United States by place of residence and by place of occurrence
will not be identical. Births to nonresidents of the United States are included in data by place of
occurrence but excluded from data by place of residence, as previously indicated. See Table A for the
number of births by residence and occurrence for the 50 states and the District of Columbia for 2019.
Residence error: According to a 1950 test (which has not been repeated), errors in residence
reporting for the country as a whole tend to overstate the number of births to residents of urban areas
and to understate the number of births to residents of other areas [19]. Recent experience, based on
anecdotal evidence from the states, suggests that this is still a concern. This tendency has assumed
special importance because of a concomitant development—the increased utilization of hospitals in
cities by residents of nearby places—with the result that a number of births are erroneously reported as
having occurred to residents of urban areas. Another factor that contributes to this overstatement of
urban births is the customary practice of using city addresses for persons living outside the city limits.
Residence error should be taken into particular consideration in interpreting tabulated data for small
areas. Both birth and infant mortality patterns can be affected.
Population-based rates: One of the principal values of vital statistics data is realized through the
presentation of rates that are computed by relating the vital events of a class to the population of a
similarly defined class (e.g., 2019 births to women aged 20-24 years and the 2019 population of women
aged 20-24). Vital statistics and population statistics, therefore, must be tabulated in comparable groups.
Even when the variables common to both, such as geographic area, age, race, and sex, have been
similarly classified and tabulated, significant discrepancies may result from differences between the
enumeration method of obtaining population data and the registration method of obtaining vital statistics
data [20].
Geographic classification: The geographic code structure for the 2019 natality file is given in the
NCHS manual, “Vital Records Geographic Classification, 2014,” and in the country, county, and place
50
geographic code files [21,22]. The geographic code structure on the 2019file is based on results of the
2010 Census of Population.
Standard Certificates of Live Birth
The U.S. Standard Certificate of Live Birth, issued by the U.S. Department of Health and Human
Services, has served for many years as the principal means for attaining uniformity in the content of the
documents used to collect information on births in the United States. The U.S. Standard Certificate of
Live Birth has historically been revised every 10-15 years. Most state certificates conform closely in
content to the standard certificate, but are modified to the extent required by the particular state's needs
or by special provisions of the state's vital statistics law.
The 2003 revision: In 2003, a revised U.S. Standard Certificate of Live Birth was adopted
(Figure 1). For more information on the 2003 standard certificate and details regarding the certificate
revision and links to the documents referenced below, see the NCHS website of the 2003 certificate
revision at http://www.cdc.gov/nchs/nvss/vital_certificate_revisions.htm. The 2003 birth certificate
replaces the previous 1989 U.S. Standard Certificate of Live Birth [23,24]. Implementation of the 2003
U.S. Standard Certificate of Live Birth (revised) by the states and independent reporting areas was
phased in from 2003 to 2016. All states and the District of Columbia had implemented the revised birth
certificate as of January 1, 2016. Guam, Puerto Rico, the U.S. Virgin Islands, and the Northern Marianas
had implemented the revised birth certificate as of January 1, 2017 (see User Guide to the 2015 Natality
Public Use File [25] for a detailed implementation schedule).
The 2003 Revision of the U.S. Standard Certificate of Live Birth introduced substantial changes
to data content and quality. Many key data items are common between revisions; however, a number of
items were substantively modified. The 2003 revision also includes many new items never before
collected on the Standard Certificate [23,24]. For details on data items comparable between revisions see
the User Guide to the 2014 Natality Public Use File [18]. For a list of items that were dropped in 2014
for reasons of poor data quality, see
https://www.cdc.gov/nchs/nvss/deleted_items_from_birth_fetal_death_files.htm.
A key aspect of the 2003 revision of the U.S. Standard Certificate of Live Birth was the re-
engineering of the data collection and transmission system to improve data quality, speed of data
collection and transmission, and to enhance standardization of data [23,26]. To encourage collection of
data from the best sources, two worksheets were developed: the “Mother’s Worksheet” (available at
https://www.cdc.gov/nchs/data/dvs/moms-worksheet-2016.pdf) [27] and the “Facility Worksheet”
51

(available at https://www.cdc.gov/nchs/data/dvs/facility-worksheet-2016.pdf) [28]. In the Mother’s
Worksheet, data are directly obtained from the mother and include items such as race, Hispanic origin
and educational attainment. For the Facility Worksheet, data are obtained directly from the medical
records of the mother and infant for items such as date of first prenatal care visit, pregnancy risk factors,
and method of delivery. To assist hospital staff in completing the Facility Worksheet, a comprehensive
instruction manual was developed: Guide to Completing the Facility Worksheets for the Certificate of
Live Birth and Report of Fetal Death (2003 Revision) (“Guide to the Facility Worksheet”; available at
https://www.cdc.gov/nchs/data/dvs/GuidetoCompleteFacilityWks.pdf) [29]. Detailed definitions and
instructions for data items that are collected from the Facility Worksheet are in the “Guide to the Facility
Worksheet”.
The first ever eLearning training, “Applying Best Practices for Reporting Medical and Health
Information on Birth Certificates,” on completing the medical and health information for the birth
certificate was launched in October 2016. The training emphasizes the importance and uses of birth
certificate data and best practices for collecting specific birth medical and health items. The audience for
the training includes birth information specialists, physicians, nurses, and hospital administrators.
Continuing education credits for nurses, physicians, and non-clinical staff are also available. The
training is internet-based and approximately 45 minutes in length. It is available at
www.cdc.gov/nchs/training/BirthCertificateElearning.
Detailed descriptions of editing and computation methods of the items described below are
available [30,31].
Natality data files
Micro-data files: Natality micro-data files for data years 1968-2019 may be downloaded at
http://www.cdc.gov/nchs/data_access/VitalStatsOnline.htm. The general rules used to classify
characteristics of live births are presented in several NCHS manuals [21,22,26,30,31]. These instructions
are for states to use to collect and code the data items; they do not include NCHS edit recodes.
The 2003-2015 edits and natality micro-data files include data items common to both the 1989
and 2003 revisions of the U.S. Standard Certificate of Live Birth. The files also include items exclusive
to the 2003 revision. See the file layout in this User Guide. Certain data items new to the 2003 revised
certificate (e.g., maternal morbidity) are available beginning with data files 2009.
52

Beginning with the 2005 data year, the public release micro-data natality file no longer includes
geographic detail (e.g., state or county of birth). Information on the data use policy is available at
http://www.cdc.gov/nchs/nvss/dvs_data_release.htm [32].
Demographic Characteristics
Hispanic origin and race
Hispanic origin: Hispanic origin and race are reported separately on the birth certificate (Figure
1). It is recommended that this information be reported directly by the mother via the Mother’s
Worksheet [27].
For 1989 through 2017, data on the public use file and in NCHS reports for specified Hispanic
groups are shown in most cases for five specified Hispanic groups: Mexican, Puerto Rican, Cuban,
Central and South American, and “other and unknown Hispanic.” Starting with 2018, data are presented
for the additional Hispanic group, Dominican (see items MHISPX and FHISPX in file positions 112 and
159). This subgroup was previously included in “other and unknown Hispanic.” In tabulations of birth
data by race and Hispanic origin, data for persons of Hispanic origin are not further classified by race
because the vast majority of Hispanic women are reported as white. In tabulations of birth data by race
only, data for persons of Hispanic origin are included in the data for each race group according to the
mother’s reported race. In tabulations that include Hispanic origin, data for non-Hispanic persons are
classified according to the race of the mother, due to substantial differences in fertility and maternal and
infant health characteristics between Hispanic and non-Hispanic (single-race) white women. American
Samoa does not currently collect information on Hispanic origin.
The Hispanic origin question asks respondents to select only one response. Occasionally,
however, more than one Hispanic origin response is given, that is, a specified Hispanic group (Mexican,
Puerto Rican, Cuban, Dominican, or Central and South American) in combination with one or more
other specified Hispanic group. From 2003 through 2012, respondents who selected more than one
Hispanic origin on the birth certificate were classified as “other Hispanic”. Beginning with the 2013 data
year, respondents who select more than one Hispanic origin are randomly assigned to a single Hispanic
origin. This change was implemented to be consistent with the coding methods of the American
Community Survey [33], on which the rates for the specified Hispanic groups from 2010 on are based
(see “Population estimates for the specific Hispanic groups”).
53
The percentage of records for which Hispanic origin of the parents was not reported in 2018 is
presented by reporting area in Table B.
Note the change in 2019 California occurrence births for women of “Central and South
American” and “Other and unknown Hispanic” origin. The number of California births by occurrence to
“Central and South American” women increased from 17,535 in 2018 to 27,735 in 2019 (a difference of
58.2%), whereas the number births to “Other and unknown Hispanic” women decreased from 34,993 in
2018 to 19,419 in 2019 (45.0%). This change is likely related, at least in part, to the implementation of a
new state reporting system and corresponding increases in literal responses providing greater specificity
of Hispanic origin.
Race of mother and father: Reported separately from Hispanic origin, the instructions are to
check one or more races to indicate what the mother/father considers her/himself to be. It is
recommended that this information be reported directly by the mother via the Mother’s Worksheet [27].
The 2003 revision of the U.S. Standard Certificate of Live Birth allows the reporting of the five race
categories either alone (i.e., single-race) or in combination (i.e., more than one race or multiple races)
for each parent [24], in accordance with the revised standards issued by the Office of Management and
Budget (OMB) in 1997 [34]. The five categories for race specified in the revised standards are:
American Indian or Alaska Native (AIAN), Asian, Black or African American, Native Hawaiian or
Other Pacific Islander (NHOPI), and White. Information on this change is presented elsewhere [35-37].
Starting in 2016, all states and the District of Columbia, in addition to Puerto Rico, the U.S.
Virgin Islands, Guam and Northern Marianas, were reporting race according to the 1997 revised OMB
standards, with 2.7% of mothers in the U.S. reporting more than one race in 2019 (Documentation
Table 1).
Where race of the mother is not reported, if the race of the father is known, the race of the father
is assigned to the mother. When information is not available for either parent, the race of the mother is
imputed according to the specific race of the mother on the preceding record with a known race of
mother. In 2019, race of mother was imputed for 6.8% of births (by occurrence).
Age of mother
The age of mother is derived from the reported month and year of birth. It is recommended that
this information be reported directly by the mother via the Mother’s Worksheet [27]. For American
Samoa, exact age of mother was reported.
Imputation of age of mother: Age of mother is imputed for ages 8 years or under and 65 years
and over (mother’s age 9 years is recoded as 10 years and ages 55-64 years are recoded to an age from
54

50-54 years). A review and verification of unedited data for several years showed that the vast majority
of births reported as occurring to women aged 50 years and older were to women aged 50-54 years.
Extreme values of age: Data for single year of age of mother 9-11 and 55-64 years are not shown
in the public use data files. Births to mothers 9-11 years are collapsed into the categories “12 years or
under;” births to mothers 50-64 years into the category “50-54 years”.
Mean age of mother: Mean age is the arithmetic average of an age distribution. Trend data on the
mean age of mother, derived directly from frequencies of births by age, are available at
https://www.cdc.gov/nchs/products/vsus.htm#natab2003, [38] and for recent years, in Table I-6 of the
2019 Final Report [1]. For information on median age of mother, see User Guide for the 2014 Natality
Public Use File [18].
Not stated age or date of birth of mother: Beginning in 1964, birth records with date of birth of
mother and/or age of mother not stated have had age imputed (555 records; 0.01% for 2019) according
to the age of mother from the previous birth record of the same race and total-birth order (total of fetal
deaths and live births). (See NCHS Instruction Manuals, Part 12 [31,39]).
Age of father
Information on age of father is derived from the father’s date of birth and is recommended to be
reported directly by the mother. See the Mother’s Worksheet [27]. Information on age of father is often
missing for children born to unmarried mothers, greatly inflating the number in the “Not stated”
category in all tabulations by age of father. If the age is under 10 years, it is considered not stated and
grouped with those cases for which age is not stated on the certificate. See also the NCHS manual for
detailed descriptions of editing and computation methods [30] and Table B for the percent of records for
which father’s age is not stated.
Marital status
National estimates of births to unmarried women are based on two methods of determining
marital status: 1) direct question; and 2) inferential procedures (described below). For more details on
the history of the two methods, see the User Guide for the 2014 Natality Public Use File [18].
It is recommended that information on marital status be reported directly by the mother using the
Mother’s Worksheet [27]. See also the NCHS manual for detailed descriptions of editing and
computation methods [30,31] and Tables 9, 10, and I-7 of the 2019 Final Report [1].
55
Inferential procedures: Historical information on inferential procedures can be found in the 2014
User Guide [18]. In 2019, inferential procedures were used to compile birth statistics by marital status in
full or in part for New York (excluding New York City). In New York, a birth is inferred as nonmarital
if either of these factors, listed in priority-of-use order, is present: a paternity acknowledgment was
received or the father’s name is missing. In recent years, a number of states have extended their efforts
to identify the fathers when the parents are not married in order to enforce child support obligations. The
presence of a paternity acknowledgment, therefore, is the most reliable indicator that the birth is
nonmarital in the states not reporting this information directly. Details of the changes in reporting
procedures and the impact of the procedures on the data are described in previous reports [40,41].
Imputation of marital status: Mother’s marital status was not reported in 2019 on 0.1% of the
birth records where this information is obtained exclusively by a direct question (i.e., in the 49 states, the
District of Columbia, and New York City). Marital status was imputed for these records. If status was
unknown and the father’s age was known, then the mother was considered married. If the status was
unknown, and the father’s age unknown, then the mother was considered unmarried.
Beginning in 2017, NCHS cannot release record-level data on the marital status of the mother for
births occurring in or to residents of California due to state statutory restrictions. Tabulated data on
births by marital status for California were provided to NCHS by the state for the preparation of this
report and national and state information on marital status is included in the 2019 Final Report [1].
Educational attainment
Mother: Educational attainment is based on the highest degree or level of school completed at
the time of the delivery. It is recommended that information on educational attainment of the mother be
reported directly by the mother using the Mother’s Worksheet [27]. See also the NCHS manual for
detailed descriptions of editing and computation methods [30,31], Table I-8 of the 2019 Final Report
[1], and Table B for the percent of records for which mother’s education is not stated.
Starting with the 2018 data, the following consistency checks for maternal age are applied to
each level of educational attainment:
8th grade or less Minimum age 9
9th through 12th grade, no diploma Minimum age 13
High school graduate or GED completed Minimum age 15
Some college credit, but not a degree Minimum age 17
Associate degree Minimum age 18
56

Bachelor’s degree Minimum age 20
Master’s degree Minimum age 21
Doctorate Minimum age 23.
Where maternal age is not compatible with the level of educational attainment, educational
attainment is edited to “Not stated.”
Father: The question on educational attainment of the father is parallel to that for the mother.
Information on education of father is often missing on birth certificates of children born to unmarried
mothers, greatly inflating the number in the “Not stated” category. While the overall percentage of “Not
stated” records for the United States was 13.8 percent (Table B) in 2019, this information was missing
for more than one-third of records for one state (Wisconsin).
Live-birth order and parity
Live-birth order and parity are determined from two items on the birth certificate, “Number of
previous live births now living” and “Number of previous live births now dead.” Live-birth order and
parity classifications refer to the total number of live births the mother has had including the 2019 birth.
Fetal deaths are excluded.
Live-birth order indicates what number the present birth represents; for example, a baby born to
a mother who has had two previous live births (even if one or both are not now living) has a live-birth
order of three. Parity indicates how many live births a mother has had. Before delivery, a mother having
her first baby has a parity of zero, and a mother having her third baby has a parity of two. After delivery
the mother of a baby who is a first live birth has a parity of one, and the mother of a baby who is a third
live birth has a parity of three.
It is recommended that this information be collected directly from the prenatal care record using
the Facility Worksheet [28]. Detailed instructions and definitions for these items are presented in the
Guide to the Facility Worksheet [29]. See also the NCHS manual for detailed descriptions of editing and
computation methods [30,31] and Table B for the percent of records for which live birth order is not
stated.
In computing birth rates by live-birth order, births tabulated as birth order not stated are
distributed in the same proportion as births of known live-birth order.
Birth interval
57
Birth intervals are computed for all births of second or higher order. The interval is computed
from the infant’s date of birth (month and year) and the date of the last live birth (month and year). In a
plural delivery, the second and higher order birth within a set is classified at an interval of 0-3 months.
It is recommended that this information be collected directly from the prenatal care record using
the Facility Worksheet [28]. Detailed instructions and definitions for these items are presented in the
Guide to the Facility Worksheet [29]. See also the NCHS manual for detailed descriptions of editing and
computation methods [30,31], Table I-10 of the 2019 Final Report [1], and Table B for the percent of
records for which birth interval is not stated.
Medical and Public Services Utilization
Prenatal care
Information on the timing and number of prenatal care visits is collected from the items “Date of
first prenatal visit” (with a checkbox for “No prenatal care”) and “Total number of prenatal visits for this
pregnancy.” The public use file includes the month prenatal care began (ranging from months 1-10 of
the pregnancy based on the obstetric estimate of gestation) as well as a recode for the trimester prenatal
care began (1st, 2nd, or 3rd). “Date of the last prenatal care visit” is no longer available in the public use
file due to concerns with data quality.
It is recommended that prenatal care information be collected directly from the prenatal care
record using the Facility Worksheet [28]. Detailed instructions and definitions for these items are
presented in the Guide to the Facility Worksheet [29]. See also the NCHS manual for detailed
descriptions of editing and computation methods [30,31], Table 16 of the 2019 Final Report [1], and
Table B for the percent of records for which month prenatal care began and number of prenatal care
visits is not stated.
In 2014, NCHS changed from the date of the last menstrual period (LMP) to the obstetric
estimate (OE) to calculate gestational age [18]. Also in 2014, NCHS changed the way the month in
which prenatal care began is calculated to use of the OE-based method. This change resulted in higher
percentages of prenatal care beginning in the 1st trimester. For example, in 2014, the percentage of births
with prenatal care beginning in the 1st trimester was 73.3% when based on LMP (data not available)
compared with 76.6% when based on OE. By state, 1st trimester prenatal care based on OE was, on
average, 5% higher than 1st trimester care based on LMP. Accordingly, prenatal care data based on the
OE are not comparable with those based on the LMP.
58
WIC food during pregnancy
It is recommended that information on receipt of WIC (The Special Supplemental Nutrition
Program for Women, Infants, and Children) food for the mother during this pregnancy be reported
directly by the mother using the Mother’s Worksheet [27]. WIC is a program intended to help low-
income pregnant women, infants, and children through age 5 receive proper nutrition by providing
vouchers for food, nutrition counseling, health care screenings and referrals; it is administered by the
U.S. Department of Agriculture [42]. See also the NCHS manual for detailed descriptions of editing and
computation methods [30,31], Table I-11 of the 2019 Final Report [1], and Table B for the percent of
records for which receipt of WIC is not stated.
Obstetric procedures
Two obstetric procedures: 1) successful external cephalic version and 2) failed external cephalic
version are available in the 2019 natality public use file. The choice “None of the above” is available if
external cephalic version is not applicable. If the item is not completed (i.e. none of the boxes are
checked), it is classified as “Not stated.” Cervical cerclage and tocolysis are no longer available in the
public use file due to concerns with data quality.
It is recommended that this information on obstetric procedures be collected directly from the
medical record using the Facility Worksheet [28]. Detailed instructions and definitions are presented in
the Guide to the Facility Worksheet [29]. See also the NCHS manual for detailed descriptions of editing
and computation methods [30,31], Table I-14 of the 2019 Final Report [1], and Table B for the percent
of records for which obstetric procedures is not stated.
Characteristics of labor and delivery
Six characteristics of labor and delivery are separately identified in a checkbox format: 1)
induction of labor; 2) augmentation of labor; 3) steroids; 4) antibiotics received by the mother during
labor; 5) clinical chorioamnionitis or maternal temperature > 38°C; and 6) epidural or spinal anesthesia
during labor. The characteristics of labor and delivery item allows for the reporting of more than one
characteristic and includes a choice of “None of the above.” If the item is not completed (i.e., none of
the boxes are checked), it is classified as “Not stated.” Due to concerns with data quality, non-vertex
59

presentation, moderate/heavy meconium staining of the amniotic fluid, and fetal intolerance of labor are
no longer available in the public use file.
It is recommended that this information be collected directly from the medical record using the
Facility Worksheet [28]. Detailed instructions and definitions for the characteristics are presented in the
Guide to the Facility Worksheet [29]. See also the NCHS manual for detailed descriptions of editing and
computation methods [30,31], Table I-15 of the 2019 Final Report [1], and Table B for the percent of
records for which characteristics of labor and delivery is not stated.
Place of birth
Five options for place of birth are identified in a checkbox format: 1) hospital; 2) freestanding
birth center; 3) home birth, 4) clinic/doctor’s office and 5) other (must be specified). If the item is not
completed (i.e., none of the boxes are checked), it is classified as “Not stated”.
It is recommended that this information be collected directly from the medical record using the
Facility Worksheet [28]. Detailed instructions and definitions for the characteristics are presented in the
Guide to the Facility Worksheet [29]. See also the NCHS manual for detailed descriptions of editing and
computation methods [30,31], Tables I-4 and I-5 of the 2019 Final Report [1], and Table B for the
percent of records for which place of birth is not stated.
Planned home births: Information on whether the home birth was planned is reported by 49
states and the District of Columbia (excludes California), representing 88.1 percent of 2019 births. If the
birth was a home birth (box checked) then the following question is asked in a checkbox format:
Planned to deliver at home? Yes/ No.
A reporting flag should be used to generate accurate numbers by residence for planned home
births. The reporting flag (the file position is specified in the file layout) will exclude births to residents
of non-reporting states (California). More information on the use of reporting flags can be found in the
introduction to the User Guide for the 2014 Natality Public Use File [18].
Time of birth
Time of birth is based on a 24-hour (military) clock. It is recommended that this information be
collected directly from the medical record using the Facility Worksheet [28]. Detailed instructions and
definitions for the characteristics are presented in the Guide to the Facility Worksheet [29]. See also the
NCHS manual for detailed descriptions of editing and computation methods [30,31], Tables I-1 of the
2019 Final Report [1], and Table B for the percent of records for which time of birth is not stated.
60
Attendant at birth
Five options for title of attendant at birth are identified in a checkbox format: 1) MD (medical
doctor) 2) DO (osteopath) 3) CNM/CM (certified nurse midwife/certified midwife) 4) other midwife 5)
other (must be specified). If the item is not completed (i.e., none of the boxes are checked), it is
classified as “Not stated”.
It is recommended that this information be collected directly from the medical record using the
Facility Worksheet [28]. Detailed instructions and definitions for the characteristics are presented in the
Guide to the Facility Worksheet [29]. See also the NCHS manual for detailed descriptions of editing and
computation methods [30,31], Tables I-4 of the 2019 Final Report [1], and Table B for the percent of
records for which attendant at birth is not stated.
CNM/CM-attended births: There is evidence that the number of live births attended by
CNM/CM is understated [43], largely due to difficulty in correctly identifying the birth attendant when
more than one provider is present at the birth. (Anecdotal evidence suggests that some hospitals require
that a physician be reported as the attendant even when no physician is physically present at midwife-
attended births.)
Method of delivery
Three options for fetal presentation at birth are identified in a checkbox format: 1) cephalic; 2)
breech; and 3) other. Four options for final route and method of delivery are identified in a checkbox
format: 1) vaginal/spontaneous; 2) vaginal/forceps; 3) vaginal/vacuum; and 4) cesarean. If either of the
two items, fetal presentation at birth and final route and method of delivery, are not completed (i.e., none
of the boxes are checked), they are classified as “Not stated”. The checkboxes, stating whether delivery
with forceps or vacuum extraction was unsuccessful are no longer included in the public use files due to
concerns with data quality.
It is recommended that this information be collected directly from the medical record using the
Facility Worksheet [28]. Detailed instructions and definitions for the characteristics are presented in the
Guide to the Facility Worksheet [29]. See also the NCHS manual for detailed descriptions of editing and
computation methods [30,31], Table I-17 of the 2019 Final Report [1], and Table B for the percent of
records for which fetal presentation and final route and method of delivery is not stated.
61
Trial of labor: If the final route and method of delivery was cesarean (box checked) then the
question “If cesarean, was a trial of labor attempted?” Yes/ No is asked. See Table I-17 of the 2019
Final Report [1].
Total cesarean rate: The overall cesarean delivery rate or total cesarean rate is computed as the
percent of all births delivered by cesarean. See Tables 17, 18, I-16 and I-17 of the 2019 Final Report
[1].
Low-risk cesarean rate: The low-risk cesarean delivery rate is the number of singleton, term (37
or more weeks of gestation based on obstetric estimate), cephalic, cesarean deliveries to women having
a first birth per 100 women delivering singleton, term, cephalic, first births. Obstetric estimate and live-
birth order are discussed in more detail elsewhere. See Tables 17, 18 and I-16 of the 2019 Final Report
[1].
Primary cesarean and VBAC delivery rates: The primary cesarean and vaginal birth after
previous cesarean (VBAC) delivery rates are computed by using the information on vaginal and
cesarean deliveries from the “Method of delivery” item as well as information on whether the mother
had a previous cesarean from the “Risk factors in this pregnancy” item. The primary cesarean rate is
computed as the number of women having a first cesarean delivery divided by all women giving birth
who have never had a cesarean delivery. The denominator for the primary cesarean rate includes the
sum of primary cesareans and vaginal births without a previous cesarean. The rate of VBAC delivery is
computed by dividing all VBAC deliveries by the sum of VBAC and repeat cesarean deliveries, that is,
women with a previous cesarean delivery. See Tables 17 and 18 of the 2019 Final Report [1].
Payment source for delivery
Four options for source of payment at delivery are identified in a checkbox format: 1) private
insurance; 2) Medicaid; 3); self-pay; and 4) other (must be specified). If the item is not completed (i.e.,
none of the boxes are checked), it is classified as “Not stated”. The instructions are to check the box that
best describes the principal source of payment for this delivery. Note that for 2018, for Rhode Island,
“other” sources of payment for the delivery includes only CHAMPUS/TRICARE, whereas “other” for
other reporting areas combines several sources.
It is recommended that this information be collected directly from the medical record using the
Facility Worksheet [28]. Detailed instructions and definitions for the characteristics are presented in the
Guide to the Facility Worksheet [29]. See also the NCHS manual for detailed descriptions of editing and
62
computation methods [30,31], Table 19 of the 2019 Final Report [1], and Table B for the percent of
records for which source of payment is not stated.
More detailed information for the “other” category is available for 34 states and the District of
Columbia, representing 56.9 percent of all U.S. births in 2019. For these states, the “Other” category is
further delineated into the following groups: 1) Indian Health Service; 2) CHAMPUS/TRICARE; 3)
Other government; and 4) other (must be specified). A reporting flag should be used to generate accurate
numbers by residence for more detailed source of payment at delivery. The reporting flag (the file
position is specified in the file layout) will exclude births to residents of non-reporting states (Arizona,
Arkansas, Florida, Illinois, Michigan, Minnesota, Mississippi, Missouri, New Hampshire, New Jersey,
North Carolina, Pennsylvania, Rhode Island, Texas, Vermont, and Virginia). More information on the
use of reporting flags can be found in the introduction to the User Guide for the 2014 Natality Public
Use File [18].
Maternal Behavior and Health Characteristics
Mother’s pre-pregnancy body mass index (BMI)
BMI provides an indication of the mother’s body fat based on her height and pre-pregnancy
weight (see below). Mother’s height and pre-pregnancy weight are discussed in more detail below.
Mother’s pre-pregnancy BMI is calculated as:
[mother’s pre-pregnancy weight (lb) / [mother’s height (in)]2 ] x 703
The currently used categories for BMI were established by the National Health, Lung and Blood
Institute (NHBL) in the late 1990s [44]. See the NCHS manual for detailed descriptions of editing and
computation methods [30,31], Table I-9 of the 2019 Final Report [1].
Mother’s height
Mother’s height is one of the measurements used to compute mother’s pre-pregnancy BMI (see
above). The range of acceptable values for this item is 1-8 feet and 1-11 inches.
It is recommended that information on the mother’s height (in feet/inches) come from the
Mother’s Worksheet [27]. See the NCHS manual for detailed descriptions of editing and computation
methods [30,31] and Table B for the percent of records for which mother’s height is not stated.
63
Mother’s pre-pregnancy weight
Mother’s pre-pregnancy weight is one of the measurements used to compute mother’s pre-
pregnancy BMI (see above). Mother’s pre-pregnancy weight, along with mother’s weight at delivery, is
used to compute the mother’s weight gain during delivery (see below). The range of values accepted for
mother’s pre-pregnancy weight is 50-400 pounds. All other values are edited to “Not stated”.
It is recommended that information on the mother’s pre-pregnancy weight (in pounds) be
reported directly by the mother via the Mother’s Worksheet [27]. See the NCHS manual for detailed
descriptions of editing and computation methods [30,31] and Table B for the percent of records for
which mother’s pre-pregnancy weight is not stated.
Mother’s weight at delivery
Mother’s weight at delivery, along with mother’s pre-pregnancy weight, is used to compute the
mother’s weight gain during pregnancy (see below). The range of values accepted for mother’s weight at
delivery is 100-450 pounds.
It is recommended that this information be collected directly from the medical record using the
Facility Worksheet [28]. Detailed instructions and definitions for the characteristics are presented in the
Guide to the Facility Worksheet [29]. See also the NCHS manual for detailed descriptions of editing and
computation methods [30,31] and Table B for the percent of records for which mother’s weight at
delivery is not stated.
Weight gain during pregnancy
Information on weight gain during pregnancy is derived from mother’s pre-pregnancy weight
and mother’s weight at delivery (see above). Mother’s weight gain during pregnancy is calculated by
subtracting the mother’s pre-pregnancy weight from her weight at delivery. Weight gain during
pregnancy is reported in pounds. A reported loss of weight is recorded as zero gain. See also the NCHS
manual for detailed descriptions of editing and computation methods [30,31].
Cigarette smoking before and during pregnancy
The question asks for the number of cigarettes (or packs) smoked in the three months prior to
becoming pregnant and in each trimester. All entries reporting packs of cigarettes are converted to the
corresponding number of cigarettes (1 pack = 20 cigarettes). If the mother reports smoking in any of the
three trimesters of pregnancy she is classified as a smoker (smoked anytime during pregnancy). Women
64

with unknown smoking status for any trimester (except for births with gestational ages less than 27
weeks; see below) who report not smoking in other trimesters are classified as “Unknown smoking
status.”
For women whose pregnancies end prior to the 3rd trimester of pregnancy (less than 27
completed weeks), but for whom cigarette smoking is reported in the 3rd trimester of pregnancy,
smoking status during the 3rd trimester of pregnancy is changed/edited to “Unknown.” Women who
give birth prior to the 3rd trimester who report smoking in the 1st or 2nd trimester are classified as
smokers. Women who give birth prior to the 3rd trimester of pregnancy who report no cigarettes in the
1st or 2nd trimester are classified as non-smokers.
Quitting smoking before or during pregnancy: Women who report smoking in the three months
prior to pregnancy but report no smoking during all three trimesters are considered to have quit smoking
before pregnancy. Women who smoked in the three months prior to pregnancy and during any trimester
are considered to have not quit smoking before pregnancy. If a woman reported smoking in the three
months prior to pregnancy, and reported not smoking during one or more trimesters, but smoking status
was unknown for any of the other trimesters, quitting before pregnancy status is classified as
“Unknown”. Women who report smoking only in the first trimester and/or second trimesters, but not the
third trimester, are considered to have quit smoking during pregnancy. If smoking status during the third
trimester of pregnancy is unknown, quitting status is tabulated as “Unknown” [31].
It is recommended that information on smoking before and during pregnancy be reported directly
by the mother via the Mother’s Worksheet [27]. See also the NCHS manual for detailed descriptions of
editing and computation methods [30,31], Table 15 of the 2019 Final Report [1], and Table B for the
percent of records for which cigarette smoking before and during pregnancy is not stated.
Risk factors in this pregnancy
Six risk factors are separately identified in a checkbox format: 1) diabetes (pre-pregnancy or
gestational); 2) hypertension (pre-pregnancy or gestational); 3) eclampsia; 4) previous preterm births; 5)
pregnancy resulted from infertility treatment; and 6) mother had a previous cesarean delivery. This item
allows for the reporting of more than one risk factor and includes a choice of “None of the above”. If the
item is not completed (i.e., none of the boxes are checked), it is classified as “Not stated”. The checkbox
“Other previous poor pregnancy outcome” is no longer available in the public use files because of
concerns with data quality.
65

It is recommended that this information be collected directly from the medical record using the
Facility Worksheet [28]. Detailed instructions and definitions for the characteristics are presented in the
Guide to the Facility Worksheet [29]. See also the NCHS manual for detailed descriptions of editing and
computation methods [30,31], Table I-12 of the 2019 Final Report [1], and Table B for the percent of
records for which risk factors is not stated.
Eclampsia: Information on eclampsia is available for 48 states and the District of Columbia
(excludes South Carolina and Tennessee), representing 96.3 percent of 2019 births. A reporting flag
should be used to generate accurate numbers by residence for eclampsia. The reporting flag (the file
position is specified in the file layout) will exclude births to residents of non-reporting states. More
information on the use of reporting flags can be found in the introduction to the User Guide for the 2014
Natality Public Use File [18].
Pregnancy resulted from infertility treatment: There is a general checkbox question about
whether the pregnancy resulted from infertility treatment. If the answer is “Yes” (box checked) then the
infertility treatments are grouped into two separate categories:
• Fertility enhancing drugs, artificial insemination, or intrauterine insemination
• Assisted reproductive technology (e.g., in vitro fertilization (IVF), gamete intrafallopian
transfer (GIFT), ZIFT).
A total of 48 states and the District of Columbia (excludes South Carolina, and Tennessee),
representing 96.3 percent of 2019 births, reported information on the type of infertility treatment used.
The instructions are to check all that apply, meaning that one or both of these responses can be reported
for the same birth. ART procedures are those in which both egg and sperm are handled in the laboratory.
A reporting flag should be used to generate accurate numbers by residence for type of infertility
treatment used. The reporting flag (the file position is specified in the file layout) will exclude births to
residents of non-reporting states. More information on the use of reporting flags can be found in the
introduction to the User Guide for the 2014 Natality Public Use File [18].
Infections present and/or treated during this pregnancy
Five infections are separately identified in a checkbox format: 1) gonorrhea; 2) syphilis; 3)
chlamydia; 4) hepatitis B; and 5) hepatitis C. This is a checkbox item allowing for the reporting of more
than one infection and includes a choice of “None of the above”. If the item is not completed (i.e. none
of the boxes are checked), it is classified as “Not stated”.
66

It is recommended that this information be collected directly from the medical record using the
Facility Worksheet [28]. Detailed instructions and definitions for the characteristics are presented in the
Guide to the Facility Worksheet [29]. See also the NCHS manual for detailed descriptions of editing and
computation methods [30,31], Table I-13 of the 2019 Final Report [1], and Table B for the percent of
records for which infections present and/or treated during this pregnancy is not stated.
Maternal morbidity
Five maternal morbidities are separately identified in a checkbox format: 1) maternal transfusion;
2) third or fourth degree perineal laceration; 3) ruptured uterus; 4) unplanned hysterectomy; and 5)
admission to intensive care unit. This item allows for the reporting of more than one morbidity and
includes a choice of “None of the above”. If the item is not completed (i.e., none of the boxes are
checked), it is classified as “Not stated”. The checkbox item “unplanned operating room procedure
following delivery” is no longer included in the public use file because of concerns with data quality.
It is recommended that this information be collected directly from the medical record using the
Facility Worksheet [28]. Detailed instructions and definitions for the characteristics are presented in the
Guide to the Facility Worksheet [29]. See also the NCHS manual for detailed descriptions of editing and
computation methods [30,31], Table I-18 of the 2019 Final Report [1], and Table B for the percent of
records for which maternal morbidities is not stated.
Infant Health Characteristics
Period of gestation
Beginning with the 2014 data year, NCHS transitioned to a new standard for estimating the
gestational age of the newborn. The new measure – the obstetric estimate of gestation at delivery (OE)
replaces the measure based on the data of the last normal menses (LMP) [45]. Accordingly, gestational
age data in standard reports are based on the OE. However, LMP-based data are also available. National
data based on the OE are available only from data year 2007 forward. Gestational age estimates differ
somewhat between the OE- and LMP-based measures. For example, the 2019 OE-based preterm birth
rate is 10.23% compared with the LMP-based rate of 12.16%. Of note, both preterm birth rates declined
from 2007 to 2014 but rose from 2015 to 2019. Discussion of the reasons for the change, and a detailed
comparison of the two measures, are presented elsewhere [45].
67
Births occurring before 37 completed weeks of gestation are considered to be preterm for
purposes of classification consistent with the ICD-9 and ICD-10 definitions [14]. NCHS further
categorizes births at less than 34 weeks as early preterm and births at 34-36 weeks as late preterm.
Births occurring between 37 and 38 completed weeks are considered early term, between 39 and 40
completed weeks as full term, 41 completed weeks as late term, and at 42 completed weeks and over as
post-term. These distinctions are consistent with the revised American College of Obstetrics and
Gynecology revised term definitions [46].
It is recommended that this information be collected directly from the medical record using the
Facility Worksheet [28]. Detailed instructions and definitions for the characteristics are presented in the
Guide to the Facility Worksheet [29]. See also the NCHS manual for detailed descriptions of editing and
computation methods [30,31], Tables 20, 21, I-19, and I-20 of the 2019 Final Report [1], and Table B
for the percent of records for which period of gestation is not stated.
Birthweight
Birthweight is reported in some areas in pounds and ounces and in other areas as grams.
However, the metric system is used to tabulate and present the statistics to facilitate comparison with
data published by other groups. The categories for birthweight are consistent with the recommendations
in the International Statistical Classification of Diseases, Ninth Revision (ICD–9) and the International
Statistical Classification of Diseases, Tenth Revision (ICD–10) [14,47]. The categories in gram intervals
and their equivalents in pounds and ounces are as follows:
Less than 500 grams = 1 lb 1 oz or less
500–999 grams = 1 lb 2 oz–2 lb 3 oz
1,000–1,499 grams = 2 lb 4 oz–3 lb 4 oz
1,500–1,999 grams = 3 lb 5 oz–4 lb 6 oz
2,000–2,499 grams = 4 lb 7 oz–5 lb 8 oz
2,500–2,999 grams = 5 lb 9 oz–6 lb 9 oz
3,000–3,499 grams = 6 lb 10 oz–7 lb 11 oz
3,500–3,999 grams = 7 lb 12 oz–8 lb 13 oz
4,000–4,499 grams = 8 lb l4 oz–9 lb l4 oz
4,500–4,999 grams = 9 lb 15 oz–11 lb 0 oz
5,000 grams or more = 11 lb l oz or more
ICD–9 and ICD–10 define low birthweight as less than 2,500 grams. Very low birthweight is
defined as less than 1,500 grams.
68
To establish the continuity of class intervals needed to convert pounds and ounces to grams, the
end points of these intervals are assumed to be half an ounce less at the lower end and half an ounce
more at the upper end. For example, 2 lb 4 oz–3 lb 4 oz is interpreted as 2 lb 3 ½ oz–3 lb 4 ½ oz.
It is recommended that this information be collected directly from the medical record using the
Facility Worksheet [28]. Detailed instructions and definitions for the characteristics are presented in the
Guide to the Facility Worksheet [29]. See also the NCHS manual for detailed descriptions of editing and
computation methods [30,31], Tables 22, 23, I-21, and I-22 of the 2019 Final Report [1], and Table B
for the percent of records for which birthweight is not stated.
Apgar score
5-minute score: The Apgar score is a measure of the need for resuscitation and a predictor of the
infant's chances of surviving the first year of life. It is a summary measure of the infant's condition based
on heart rate, respiratory effort, muscle tone, reflex irritability, and color. Each of these factors is given a
score of 0, 1, or 2; the sum of these 5 values is the Apgar score, which ranges from 0 to 10. A score of 0
to 3 indicates an infant in need of resuscitation; a score of 4 to 6 is considered intermediate; a score of 7
or greater indicates that the neonate is in good to excellent physical condition. The 5-minute score
means that these factors were assessed at 5 minutes after delivery.
10-minute Apgar score: The 2003 revised certificate asks for a 10-minute Apgar score if the 5-
minute score is less than 6. Ten-minute Apgar score was reported for 1.3 percent (46,789) of births in
2019; an additional 6.3 percent (2,933) of births had “Not stated” 10-minute Apgar score for infants
whose 5-minute score was less than 6.
It is recommended that this information be collected directly from the medical record using the
Facility Worksheet [28]. Detailed instructions and definitions for the characteristics are presented in the
Guide to the Facility Worksheet [29]. See also the NCHS manual for detailed descriptions of editing and
computation methods [30,31] and Table B for the percent of records for which 5-minute and 10-minute
Apgar score is not stated.
Abnormal conditions of the newborn
Six abnormal conditions of the newborn are separately identified in a checkbox format: 1)
assisted ventilation required immediately following delivery; 2) assisted ventilation required for more
than six hours; 3) NICU admission; 4) newborn given surfactant replacement therapy; 5) antibiotics
received by the newborn for suspected neonatal sepsis; and 6) seizure or serious neurological
dysfunction. This item allows for the reporting of more than one condition and includes a choice of 69
“None of the above”. If the item is not completed (i.e., none of the boxes are checked), it is classified as
“Not stated”. The checkbox item significant birth injury is no longer included in the public use file
because of concerns with data quality.
It is recommended that this information be collected directly from the medical record using the
Facility Worksheet [28]. Detailed instructions and definitions for the characteristics are presented in the
Guide to the Facility Worksheet [29]. See also the NCHS manual for detailed descriptions of editing and
computation methods [30,31], Table I-24 of the 2019 Final Report [1], and Table B for the percent of
records for which abnormal conditions of the newborn is not stated.
Congenital anomalies of the newborn
Twelve congenital anomalies are separately identified in a checkbox format: 1) anencephaly; 2)
meningomyelocele/spina bifida; 3) cyanotic congenital heart disease; 4) congenital diaphragmatic
hernia; 5) omphalocele; 6) gastrochisis; 7) limb reduction defect; 8) cleft lip with or without cleft palate;
9) cleft palate alone; 10) Down syndrome; 11) suspected chromosomal disorder; and 12) hypospadias.
This item allows for the reporting of more than one anomaly and includes a choice of “None of the
above”. If the item is not completed (i.e. none of the boxes are checked), it is classified as “Not stated”.
Data for the congenital anomaly “Hypospadias” are edited to exclude this condition where the
infant is a female.
It is recommended that this information be collected directly from the medical record using the
Facility Worksheet [28]. Detailed instructions and definitions for the characteristics are presented in the
Guide to the Facility Worksheet [29]. See also the NCHS manual for detailed descriptions of editing and
computation methods [30,31], Table I-25 of the 2019 Final Report [1], and Table B for the percent of
records for which congenital anomalies is not stated. See the Quality of Data section below for discuss
of quality concerns with rarely occurring events.
Down Syndrome and suspected chromosomal disorder: The item includes a general checkbox
question about whether Down Syndrome and suspected chromosomal disorder are present. If “Yes” (box
checked), the following question is asked: karyotype pending or karyotype confirmed. These responses
are combined for a “Yes” response.
Plurality
Plurality is classified as single, twin, triplet, quadruplet, and quintuplet and higher order births.
Each record in the public use natality file represents an individual birth. For example, a record coded as
70
a twin represents one birth in a twin delivery. Pairs or sets of twins or higher order multiple births are
not identified in this file. Records for which plurality is unknown are imputed as singletons. This
occurred for 0.004% (166) of all records for 2019.
It is recommended that this information be collected directly from the medical record using the
Facility Worksheet [28]. Detailed instructions and definitions for the characteristics are presented in the
Guide to the Facility Worksheet [29]. See also NCHS manuals for detailed descriptions of editing and
computation methods [30,31], Tables 24, 25, and I-23 in the 2019 Final Report [1].
Infant breastfed
Information on whether the infant was being breastfed during the period from birth to discharge
from the hospital is available 48 states and the District of Columbia (excludes California and Michigan),
representing 85.2 percent of all U.S. births in 2019. The item asks the question: Is the infant being
breastfed at discharge? Yes/No. The intent to breastfeed, without having initiated it by the time of
hospital discharge, is not considered a “Yes” response.
It is recommended that this information be collected directly from the medical record using the
Facility Worksheet [28]. Detailed instructions and definitions for the characteristics are presented in the
Guide to the Facility Worksheet [29]. See also NCHS manuals for detailed descriptions of editing and
computation methods [30,31], Table I-11 in the 2019 Final Report [1], and Table B for the percent of
records for which infant breastfed at discharge is not stated.
A reporting flag should be used to generate accurate numbers by residence for infant breastfed.
The reporting flag (the file position is specified in the file layout) will exclude births to residents of non-
reporting states. More information on the use of reporting flags can be found in the introduction to the
User Guide for the 2014 Natality Public Use File [18].
Definitions of medical terms
For definitions and discussion of the maternal and infant health characteristics, see the Guide to
the Facility Worksheet [27].
Quality of Data
Although vital statistics data are useful for a variety of administrative and scientific purposes,
they cannot be correctly interpreted unless various qualifying factors and methods of classification are
taken into account. The factors to be considered depend on the specific purposes for which the data are
71
to be used. It is not feasible to discuss all the pertinent factors in the use of vital statistics tabulations, but
some of the more important ones should be mentioned.
Most of the factors limiting the use of data arise from imperfections (missing or misclassified) in
the original records or from the impracticability of tabulating these data in very detailed categories.
These limitations should not be ignored, but their existence does not lessen the value of the data for most
general purposes.
Completeness of registration: It is estimated that more than 99 percent of all births occurring in
the United States in 2019 were registered.
Completeness of reporting: Interpretation of birth certificate data must include evaluation of item
completeness. The “Not stated” percentage is one measure of the quality of the data. Completeness of
reporting varies among items and states. See Table B for the percentage of birth records on which
specified items were not stated. Items with high percentages of “Not stated” should be interpreted with
caution.
Quality control procedures: As electronic files are received at NCHS, they are automatically
checked for completeness, individual item code validity, and unacceptable inconsistencies between data
items. The registration area is notified of any problems. In addition, NCHS staff review the files on an
ongoing basis to detect problems in overall quality such as inadequate reporting for certain items, failure
to follow NCHS coding rules, and systems and software errors. Traditionally, quality assurance
procedures were limited to the review and analysis of differences between NCHS and registration area
code assignments for a small sample of records. As electronic birth registration became prevalent, this
procedure was augmented by analyses of year-to-year and area-to-area variations in the data. These
analyses are based on preliminary tabulations of the data that are cumulated by state on a year-to-date
basis. NCHS investigates all differences judged to have consequences for quality and completeness. In
the review process, statistical tests are used to call initial attention to differences for possible follow-up.
As necessary, registration areas are informed of differences encountered in the tables and asked to verify
the counts or to determine the nature of the differences. Missing records (except those permanently
voided) and other problems detected by NCHS are resolved, and corrections are transmitted to NCHS.
Comparison with medical records: A 2013 report based on studies in two states showed that the
quality of data items on the 2003 revised birth certificate varied widely. That is, some items are
collected in such a manner that exact agreement with the medical records (considered the “gold
standard”) for non-check box items and sensitivity for checkbox items was high, whereas some health
and medical condition items on the birth certificate are likely underreported [9].
72
Rarely occurring events: There were not enough cases of some of the rarer conditions listed on
the birth certificate to assess data quality in the study mentioned above. Examples are maternal
morbidities, such as ruptured uterus and unplanned hysterectomy. These may be underreported on the
birth certificate compared with results from large multi-center studies and nationally representative
survey data. For example, the rate of uterine rupture for women with a previous cesarean who delivered
singletons at term (37 or more weeks of completed gestation) was 0.32% in 1999-2002 in a National
Institute for Child Health and Development (NICHD) 19-institution cohort study [48] compared with
0.08 percent for comparable birth certificate data in 2014. Although there are other reasons for the
differences in the rates, such as the differing time periods under study, these findings suggest that the
birth certificate data likely underreport these morbidities.
It is well documented that congenital anomalies, except for the most visible and most severe,
have historically been under-reported on birth certificates [49]. This has been attributable, at least in
part, to the inclusion of anomalies on the 1989 U.S. Standard Certificate of Live Birth, which may be
difficult to detect within the short period between birth and completion of the child’s birth certificate.
The 2003 revision of the U.S. Standard Certificate attempted to improve reporting of congenital
anomalies by including only those diagnosable within 24 hours of birth using conventional, widely
available diagnostic techniques [50]. However, it is not clear whether these efforts were successful
because the instances of the anomalies were too few to be included in the quality study above and there
have yet to be other quality studies assessing these data.
State-specific data quality issues for 2019
These state-specific data quality issues are of particular concern due to documented evidence of
underreporting and/or inaccurate reporting for 2019. These data should be used with caution.
Georgia:
• Characteristics of Labor & Delivery – Augmentation of labor
• Prenatal care items – Number of prenatal care visits
Michigan:
• Breastfeeding – Item wording is not consistent with the national standard item wording and data
for this state are not considered comparable with those of other states. Use the reporting flag for
this item to exclude Michigan data from the reporting area totals.
North Carolina:
• Maternal Morbidity – Maternal transfusion
73
Puerto Rico:
• Characteristics of Labor & Delivery – Anesthesia, Induction of labor
Rhode Island:
• Prenatal care items – Number of prenatal care visits (unknowns exceed 25% of records)
Texas:
• Risk Factors in this Pregnancy – Fertility enhancing drugs
Virginia:
• Prenatal care items – Number prenatal care visits
Computation of Rates and Other Measures
Population denominators
2019 population estimates: Birth and fertility rates for 2019 shown in the 2019 Final Report [1]
are based on populations estimated from the 2010 census as of July 1, 2019. These populations are
shown in Table 1. The population estimates have been provided by the U.S. Census Bureau [51] and are
based on the 2010 census counts by age, race (consistent with the revised 1997 OMB standards), and sex
[34].
Birth and fertility rates by state shown in the 2019 Final Report [1] are based on state-level
population estimates based on the 2010 census provided by the U.S. Census Bureau [51]. Birth and
fertility rates for the territories except Puerto Rico are based on population estimates available from the
U.S. Census Bureau’s International Data Base [52]. Rates for Puerto Rico are based on population
estimates from the 2010 census as of July 1, 2019, and are available from the U.S. Census Bureau [53].
Rates by state and territory shown in this report may differ from rates computed on the basis of
other population estimates; rates for smaller population subgroups such as those for teen mothers may be
particularly affected by differences in population estimates. Birth and fertility rates by month are based
on monthly population estimates also based on the 2010 census estimates. Rates for unmarried women
are based on distributions of the population by marital status averaged over a 2-year period for 2018–
2019 as reported by the U.S. Census Bureau in the March Current Population Survey (CPS) for each
year [54,55], which have been adjusted to July 1, 2019 (2010 census) population levels [51] by NCHS’
Division of Vital Statistics [41].
As of the preparation of this report, data from the March CPS for 2020 were not available.
Accordingly, the distributions of the population by marital status were based on a 2-year average of
74
2018 and 2019. For earlier years, rates for unmarried women are based on distributions of the population
by marital status averaged over a 3-year period.
Population estimates for the specific Hispanic groups
Beginning in 2011, birth and fertility rates for the specific Hispanic population groups (Mexican,
Puerto Rican, Cuban, Central and South American, and Other Hispanic populations, and Dominican,
starting in 2016) are based on population estimates derived from the 1-year American Community
Survey (ACS) [56] and adjusted to the U.S. resident population control totals by the U.S. Census
Bureau. For detailed information on the population estimates for the specific Hispanic groups, see the
User Guide for the 2016 Natality Public Use File [57].
The 2019 population estimates for the specific Hispanic population groups were not available as
of the preparation of the 2019 final report. Accordingly, birth and fertility rates for these groups are not
shown in this report. Birth and fertility rates for the specified Hispanic population groups will be
available in forthcoming expanded report tables of the 2019 Final Report [1]. These estimates will be
derived from the 2019 1-year ACS and adjusted according to the (2010-based) postcensal estimates for
July 1, 2019.
Revised population estimates
Residential population base: Birth rates for the United States and individual states are based on
the total resident populations of the respective areas (Table 2). These populations exclude the Armed
Forces abroad but include the Armed Forces stationed in each area. The residential population as well as
the population including Armed Forces abroad for the United States for 2010–2019 are shown in Table
3. A detailed discussion of historical population bases is presented elsewhere [58].
Small populations as denominators: An asterisk (*) is shown in place of any derived rate in the
following situations: 1) the rate is based on fewer than 20 births in the numerator, or 2) for the Hispanic
subgroups, a relative standard error of 23 percent or more for the ACS-based rates of 2010-2019. Rates
based on populations below these minimum levels lack sufficient reliability for analytic purposes.
Net census undercounts and overcounts: Studies conducted by the U.S. Census Bureau indicate
that some age, race, and sex groups are more completely enumerated than others. Census miscounts can
have consequences for vital statistics measures. For example, an adjustment to increase the population
denominator would result in a smaller rate compared to the unadjusted population. A more detailed
discussion of census undercounts and overcounts can be found in the “1999 Technical Appendix” [58].
75
Adjusted rates for 2019 can be computed by multiplying the reported rates by ratios from the 2019
census-level population adjusted for the estimated age-specific census over- and undercounts.
Cohort fertility tables
Various fertility measures for cohorts of women are computed from births adjusted for
underregistration and population estimates corrected for under enumeration and misstatement of age.
Cohort fertility tables are available through 2009 and have recently been revised and updated to
incorporate new rates for black women [59-62]. A detailed description of the methods used in deriving
these measures is available in an earlier publication as well as detailed data for earlier years [63].
Total fertility rates
The total fertility rate is the sum of the birth rates by age of mother (in 5–year age groups)
multiplied by 5. It is an age–adjusted rate because it is based on the assumption that there is the same
number of women in each age group. The rate of 1,706.0 in 2019, for example, means that if a
hypothetical group of 1,000 women were to have the same birth rates in each age group that were
observed in the actual childbearing population in 2019, they would have a total of 1,706.0 children by
the time they reached the end of the reproductive period (taken here to be age 50 years), assuming that
all of the women survived to that age.
Seasonal adjustment of rates
The seasonally adjusted birth and fertility rates are computed from the X–11 variant of Census
Method II [64]. This method, used since 1964, differs slightly from the U.S. Bureau of Labor Statistics
(BLS) Seasonal Factor Method, which was used for Vital Statistics of the United States, 1964. The
fundamental technique is the same in that it is an adaptation of the ratio-to-moving-average method.
Before 1964, the method of seasonal adjustment was based on the X–9 variant and other variants of
Census Method II. A comparison of the Census Method II with the BLS Seasonal Factor Method shows
the differences in the seasonal patterns of births to be negligible.
Computation of percentages, percentage distributions, and means
Births for which a particular characteristic is unknown were subtracted from the figures for total
births that were used as denominators before percentages, percentage distributions, and means were
computed. The percentage of records with missing information for each item is shown by state in Table
76
B. The mean age of mother is the arithmetic average of the age of mothers at the time of birth, computed
directly from the frequency of births by age of mother.
An asterisk (*) indicates that the figure does not meet standards of reliability or precision. Two
separate criteria are used to determine whether a figure, either a rate or proportion, meets these
standards.
For a rate, an asterisk is shown in place of a rate based on fewer than 20 births in the numerator.
Rates based on fewer than 20 births have a relative standard error (RSE) of about 23% or more and,
therefore, are considered highly variable.
For a proportion (or percentage), new criteria have been adopted by NCHS [65]. For prior
published proportion or percentages, an asterisk was shown in place of a proportion or percentage based
on fewer than 20 births in the numerator, as rates are still currently based. The new criteria are based on
denominator size and on the absolute or relative widths of the confidence interval of the proportion or
percentage calculated using the Clopper–Pearson method. For detailed information on the new criteria,
see “National Center for Health Statistics Data Presentation Standards for Proportions” [65].
Computation of Measures of Variability
Random variation and significance testing for natality data
For information and discussion on random variation and significance testing for natality data,
with the exception of specified Hispanic groups (see below), see the User Guide to the 2010 Natality
Public Use File [66].
Specified Hispanic population groups
For information and discussion on random variation and significance testing of birth and fertility
rates for the specified Hispanic groups, see the User Guide to the 2016 Natality Public Use File [57].
77
References
1. Martin JA, Hamilton BE, Osterman MJK, Driscoll AK, Drake P. Births: Final Data for 2019
National vital statistics report. Forthcoming.
2. National Center for Health Statistics. Natality 2019. Public use file. Hyattsville, Maryland:
National Center for Health Statistics. Annual internet product. 2020. Available at:
http://www.cdc.gov/nchs/data_access/VitalStatsOnline.htm.
3. Gregory ECW, Ely DM. Trends and characteristics of sexually transmitted infections during
pregnancy: United States, 2016–2018. National Vital Statistics Reports; vol 69 no 3. Hyattsville,
MD: National Center for Health Statistics. 2020..
4. Osterman MJK. Recent trends in vaginal birth after cesarean delivery: United States, 2016–2018.
NCHS Data Brief, no 359. Hyattsville, MD: National Center for Health Statistics. 2020.
5. Martin JA, Osterman MJK. Is twin childbearing on the decline? Twin births in the United States,
2014–2018. NCHS Data Brief, no 351. Hyattsville, MD: National Center for Health Statistics.
2019.
6. Driscoll AK, Ely DM. Maternal characteristics and infant outcomes in Appalachia and the Delta.
National Vital Statistics Reports; vol 68 no 11. Hyattsville, MD: National Center for Health
Statistics. 2019.
7. Martin JA, Osterman MJK. Describing the increase in preterm births in the United States, 2014– 2016. NCHS Data Brief, no 312. Hyattsville, MD: National Center for Health Statistics. 2018.
8. Martin JA, Wilson EC, Osterman MJK et al. Assessing the quality of medical and health data
from the 2003 birth certificate revision: results from two states. National vital statistics reports;
vol 62 no 2. Hyattsville, MD: National Center for Health Statistics. 2012. Available at:
http://www.cdc.gov/nchs/data/nvsr/nvsr62/nvsr62_02.pdf.
9. Gregory ECW, Martin JA, Argov EL, Osterman MJK. Assessing the quality of medical and
health data from the 2003 birth certificate revision: Results from New York City. National Vital
Statistics Reports; vol 68 no 8. Hyattsville, MD: National Center for Health Statistics. 2019.
10. United Nations. Handbook of vital statistics. Studies in methods series F. no. 7. New York:
United Nations. 1955.
11. Centers for Disease Control and Prevention. Model State Vital Statistics Act and Regulations,
1992 Revision. Publication no. (PHS) 95–1115. Hyattsville, Maryland: National Center for
Health Statistics. 1995.
78
12. Centers for Disease Control and Prevention. Model State Vital Statistics Act and Model State
Vital Statistics Regulations, 2011 Revision. Publication no. (PHS) 11-1115. Hyattsville,
Maryland: National Center for Health Statistics. 2011. Available at: http://www.fgs.org/rpac/wp-
content/uploads/2010/02/Model-State-Vital-Statistics-Act-2011.pdf
13. American Academy of Pediatrics and American College of Obstetricians and Gynecologists.
Guidelines for perinatal care, (2nd edition). Washington, DC. 308–24. 1988.
14. World Health Organization. Manual of the international statistical classification of diseases,
injuries, and causes of death, based on the recommendations of the Tenth Revision Conference,
1987. Geneva: World Health Organization. 1992.
15. Kowaleski J. State definitions and reporting requirements for live births, fetal deaths, and
induced terminations of pregnancy (1997 revision). Hyattsville, Maryland: National Center for
Health Statistics. 1997.
16. National Center for Health Statistics. Detailed technical notes – Fetal death 2013. Hyattsville,
Maryland: National Center for Health Statistics Annual product, 2009. Available at:
http://www.cdc.gov/nchs/data_access/VitalStatsOnline.htm.
17. Hertzel, AM. U.S. Vital Statistics System. Major activities and developments, 1950-95.
Hyattsville, Maryland: National Center for Health Statistics. 1997.
18. National Center for Health Statistics. User Guide to the 2014 Natality Public Use File.
Hyattsville, Maryland: National Center for Health Statistics. Annual product 2015. Available at:
http://www.cdc.gov/nchs/data_access/VitalStatsOnline.htm.
19. U.S. Department of Health, Education and Welfare, Public Health Service, Office of Vital
Statistics. Birth registration completeness in the United States and geographic areas, 1950; vol 39
no 2. 1954.
20. Schachter J. Matched record comparison of birth certificate and census information in the United
States, 1950. Vital statistics—Special Reports; vol 47 no 12. Washington: Public Health Service.
1962.
21. National Center for Health Statistics. Instruction manual, part 8. Vital records, geographic codes
2014. Available at: http://www.cdc.gov/nchs/IMP8_2014.pdf.
22. Division of Vital Statistics. Instruction manual part 8: Geographic classification, 2014.
Hyattsville, Maryland: National Center for Health Statistics. Available at:
http://www.cdc.gov/nchs/nvss/instruction_manuals.htm.
79

23. National Center for Health Statistics. Report of the Panel to Evaluate the U.S. Standard
Certificates. Hyattsville, Maryland: National Center for Health Statistics. 2000.
24. National Center for Health Statistics. 2003 revision of the U.S. Standard Certificate of Live
Birth. 2003.
25. National Center for Health Statistics. User Guide to the 2015 Natality Public Use File.
Hyattsville, Maryland: National Center for Health Statistics. Annual product 2016. Available at:
http://www.cdc.gov/nchs/data_access/VitalStatsOnline.htm.
26. National Center for Health Statistics. Birth edit specifications for the 2003 Revision of the U.S.
Standard Certificate of Birth. 2005.
https://www.cdc.gov/nchs/data/dvs/birth_edit_specifications.pdf.
27. National Center for Health Statistics. Mother’s Worksheet for Child’s Birth Certificate. 2016.
Available at: https://www.cdc.gov/nchs/data/dvs/moms-worksheet-2016.pdf.
28. National Center for Health Statistics. Facility Worksheet for the Live Birth Certificate. 2016.
Available at: https://www.cdc.gov/nchs/data/dvs/facility-worksheet-2016.pdf.
29. National Center for Health Statistics. Guide to completing the facility worksheets for the
Certificate of Live Birth and Report of Fetal Death (2003 revision). 2006 update. Hyattsville,
Maryland: National Center for Health Statistics.
https://www.cdc.gov/nchs/data/dvs/GuidetoCompleteFacilityWks.pdf.
30. Division of Vital Statistics. Instruction manual part 3a: Classification and coding instructions for
birth records, 1999-2001. Hyattsville, Maryland: National Center for Health Statistics.
31. Division of Vital Statistics. Computer edits for natality data -- 2003 Revised Certificate.
Hyattsville, Maryland: National Center for Health Statistics. Forthcoming on the Internet.
32. National Center for Health Statistics. NCHS Data Release and Access Policy for Micro-data and
Compressed Vial Statistics Files. http://www.cdc.gov/nchs/nvss/dvs_data_release.htm.
33. Ramirez RR, Ennis SR. Item nonresponse, allocation, and data editing of the question on
Hispanic origin in the American Community Survey (ACS):2000 to 2007. U.S. Census Bureau:
Population Division Working Paper No. 86. 2010.
34. Office of Management and Budget. Revisions to the standards for the classification of federal
data on race and ethnicity. Fed Regist 62FR58781–58790. October 30, 1997.
80
35. Ingram DD, Parker JD, Schenker N, et al. United States Census 2000 population with bridged
race categories. National Center for Health Statistics. Vital Health Stat 2(135). 2003.
36. Johnson D. Coding and editing multiple race. Presented at the 2004 Joint Meeting of NAPHSIS
and VSCP. Portland, Oregon. June 6–10, 2004.
37. Weed JA. NCHS procedures for multiple-race and Hispanic origin data: Collection, coding,
editing, and transmitting. Presented at the 2004 Joint Meeting of NAPHSIS and VSCP. Portland,
Oregon. June 6–10, 2004.
38. National Center for Health Statistics. Vital statistics of the United States, 2003, vol I, natality.
CD-ROM. Hyattsville, Maryland: National Center for Health Statistics. 2005.
39. Division of Vital Statistics. Instruction manual part 12: Computer edits for natality data, effective
1993.Vital statistics, data preparation. Hyattsville, Maryland: National Center for Health
Statistics. 1995.
40. Ventura SJ, Bachrach CA. Nonmarital childbearing in the United States, 1940–99. National vital
statistics reports; vol 48 no 16. Hyattsville, Maryland: National Center for Health Statistics.
2000.
41. Ventura SJ. Births to unmarried mothers: United States, 1980–92. National Center for Health
Statistics. Vital Health Stat 21(53). 1995.
42. U.S. Department of Agriculture, Food and Nutrition Service (Web site). About WIC: WIC at a
glance. Available at http://www.fns.usda.gov/wic/aboutwic/wicataglance.htm. Accessed
05/14/13.
43. Walker D, Brooks-Schmunk S. Summers L. Do birth certificate data accurately reflect the
number of CNM-attended births? An exploratory study. J Midwifery Women’s Health, 49(5):
443-448. 2004.
44. National Heart, Lung and Blood Institute. Clinical Guidelines on the identification, evaluation
and treatment of overweight and obesity in adults. NIH publication 98-4083. Washington DC:
National Institutes of Health. 1998.
45. Martin JA, Osterman, MJK, Kirmeyer SE, Gregory, ECW. Measuring Gestational Age in Vital
Statistics: Transitioning to the Obstetric Estimate. National Vital Statistics Reports; vol. 64, no. 5.
Hyattsville, MD: National Center for Health Statistics. 2015.
81
46. ACOG Committee Opinion No 579: Definition of term pregnancy. Obstet Gynecol. 2013 Nov;
122(5):1139-40.
47. World Health Organization. Manual of the international statistical classification of diseases,
injuries and causes of death. Sixth revision. Geneva. 1949.
48. Spong CY, Landon MB, Gilbert S, Rouse DJ, Leveno KJ, Varner MW, et al. Risk of uterine rupture
and adverse perinatal outcome at term after cesarean delivery. Obstetrics & Gynecology
110(4):801-807. 2007.
49. Bateman BT, Mhyre JM, Callaghan WM, et al. Peripartum hysterectomy in the United States:
nationwide 14 year experience. Am J Obstet Gynecol 206(63):e1-8. 2012.
50. Menacker, F Martin, JA. Expanded health data from the new birth certificate, 2005. National
statistics reports; vol 56 no 13. Hyattsville, Maryland: National Center for Health Statistics.
2008.
51. U.S. Census Bureau. 2019 population estimates. Annual state resident population estimates for 6
race groups (5 race alone groups and one multiple race group) by age, sex, and Hispanic origin:
April 1, 2010 to July 1, 2019. 2020. Available from:https://www2.census.gov/programs-
surveys/popest/tables/2010-2019/state/asrh/sc-est2019-alldata6.csv.
52. U.S. Census Bureau. International data base. Population by single years of age and sex, 2019.
2020. Available from: https://www.census.gov/data-tools/demo/idb/informationGateway.php.
Accessed June 17, 2020.
53. U.S. Census Bureau. 2019 population estimates. Annual estimates of the resident population by
single year of age and sex for Puerto Rico Commonwealth: April 1, 2010 to July 1, 2019 (PRC-
EST2019-SYASEX). 2020. Available from: https://www2.census.gov/programs-
surveys/popest/tables/2010-2019/state/detail/prc-est2019-syasex.xlsx.
54. U.S. Census Bureau. The Data Web: DataFerrett. Current Population Survey. 2018 March
Annual Social and Economic Supplement. 2019. Available from: http://dataferrett.census.gov/.
55. U.S. Census Bureau. Microdata Access Tool. Current Population Survey. 2019 March Annual
Social and Economic Supplement. 2020. Available from: https://data.census.gov/mdat/.
56. U.S. Census Bureau. American Community Survey (ACS), 2019 1-year estimates
(st31002_2019_010_flags), by sex, age, nativity, and Hispanic origin. Population estimates for
2019 based on unpublished tabulations. Forthcoming.
57. National Center for Health Statistics. User guide to the 2016 natality public use file. Hyattsville,
MD. Available from:https://www.cdc.gov/nchs/data_access/Vitalstatsonline.htm.
82
58. National Center for Health Statistics. Technical appendix. Vital statistics of the United States:
1999, vol I, natality on CD-ROM from Hyattsville, Maryland: National Center for Health
Statistics. 2001.
59. Hamilton BE, Cosgrove CM. Cohort Fertility Tables: United States, 1960-2005. Available at:
http://www.cdc.gov/nchs/nvss/cohort_fertility_tables.htm. Released: June 30, 2010.
60. Hamilton BE, Cosgrove CM. Technical appendix to the cohort fertility tables for all, white, and
black women: United States, 1960-2005. Hyattsville, MD: National Center for Health Statistics.
Available at:
http://www.cdc.gov/nchs/data/nvss/cohort_fertility_tables_1960_2005_appendix.pdf. Released:
June 30, 2010.
61. Hamilton BE, Cosgrove CM. Cohort Fertility Tables: United States, 2006–2009. Available at:
http://www.cdc.gov/nchs/nvss/cohort_ fertility_tables.htm. Released: August 20, 2012.
62. Hamilton BE, Cosgrove CM. Technical appendix to the cohort fertility tables for all, white, and
black women: United States, 2006–2009. Hyattsville, MD: National Center for Health Statistics.
Available at: http://www.cdc.gov/nchs/nvss/cohort_fertility_tables.htm. Released: August 20,
2012.
63. Heuser R. Fertility tables for birth cohorts by color: United States, 1917–73. National Center for
Health Statistics. Hyattsville, Maryland. 1976. Available at:
http://www.cdc.gov/nchs/data/misc/fertiltbacc.pdf.
64. Shiskin J, Young A, Musgrove J. The X–11 variant of the Census Method II Seasonal
Adjustment Program. Technical paper; no 15, 1967 rev. Washington: U.S. Census Bureau. 1967.
65. Parker JD, Talih M, Malec DJ, et al. National Center for Health Statistics data presentation
standards for proportions. National Center for Health Statistics. Vital Health Stat 2(175). 2017.
Available from: https://www.cdc.gov/nchs/data/series/sr_02/sr02_175.pdf.
66. National Center for Health Statistics. User Guide to the 2010 Natality Public Use File.
Hyattsville, Maryland: National Center for Health Statistics. Annual product 2012. Available for
downloading at: http://www.cdc.gov/nchs/data_access/VitalStatsOnline.htm.
67. U.S. Census Bureau, Population Division, Table 1. Monthly Population Estimates for the United
States: April 1, 2010 to December 1, 2020 (NA-EST2019-01), Resident Population and Resident
Population Plus Armed Forces Overseas, December 2018. Available from:
https://www2.census.gov/programs-surveys/popest/tables/2010-2019/national/totals/na-est2019-
01.xlsx.
83

Figure 1. U.S. Standard Certificate of Live Birth, 2003 Revision
U.S. STANDARD CERTIFICATE OF LIVE BIRTH LOCAL FILE NO. BIRTH NUMBER:
INFORMATION FOR ADMINISTRATIVE USE
INFORMATION FOR MEDICAL AND HEALTH PURPOSES ONLY
REV. 11/2003
C H I L D 1. CHILD’S NAME (First, Middle, Last, Suffix) 2. TIME OF BIRTH (24 hr)
3. SEX 4. DATE OF BIRTH (Mo/Day/Yr)
5. FACILITY NAME (If not institution, give street and number) 6. CITY, TOWN, OR LOCATION OF BIRTH 7. COUNTY OF BIRTH
M O T H E R 8a. MOTHER’S CURRENT LEGAL NAME (First, Middle, Last, Suffix) 8b. DATE OF BIRTH (Mo/Day/Yr)
8c. MOTHER’S NAME PRIOR TO FIRST MARRIAGE (First, Middle, Last, Suffix) 8d. BIRTHPLACE (State, Territory, or Foreign Country)
9a. RESIDENCE OF MOTHER-STATE 9b. COUNTY 9c. CITY, TOWN, OR LOCATION
9d. STREET AND NUMBER 9e. APT. NO. 9f. ZIP CODE 9g. INSIDE CITY LIMITS?
□ Yes □ No
F A T H E R 10a. FATHER’S CURRENT LEGAL NAME (First, Middle, Last, Suffix) 10b. DATE OF BIRTH (Mo/Day/Yr) 10c. BIRTHPLACE (State, Territory, or Foreign Country)
CERTIF IER 11. CERTIFIER’S NAME: _______________________________________________
TITLE: □ MD □ DO □ HOSPITAL ADMIN. □ CNM/CM □ OTHER MIDWIFE
□ OTHER (Specify)_____________________________
12. DATE CERTIFIED
______/ ______ / __________
MM DD YYYY
13. DATE FILED BY REGISTRAR
______/ ______ / __________
MM DD YYYY
M O T H E R 14. MOTHER’S MAILING ADDRESS: 9 Same as residence, or: State: City, Town, or Location:
Street & Number: Apartment No.: Zip Code:
15. MOTHER MARRIED? (At birth, conception, or any time between) □ Yes □ No IF NO, HAS PATERNITY ACKNOWLEDGEMENT BEEN SIGNED IN THE HOSPITAL? □ Yes □ No
16. SOCIAL SECURITY NUMBER REQUESTED FOR CHILD? □ Yes □ No
17. FACILITY ID. (NPI)
18. MOTHER’S SOCIAL SECURITY NUMBER: 19. FATHER’S SOCIAL SECURITY NUMBER:
M O T H E R 20. MOTHER’S EDUCATION (Check the box that best describes the highest degree or level of school completed at the time of delivery)
□ 8th grade or less
□ 9th - 12th grade, no diploma
□ High school graduate or GEDcompleted
□ Some college credit but no degree
□ Associate degree (e.g., AA, AS)
□ Bachelor’s degree (e.g., BA, AB, BS)
□ Master’s degree (e.g., MA, MS, MEng, MEd, MSW, MBA)
□ Doctorate (e.g., PhD, EdD) orProfessional degree (e.g., MD, DDS, DVM, LLB, JD)
21. MOTHER OF HISPANIC ORIGIN? (Check the box that best describes whether the mother is Spanish/Hispanic/Latina. Check the “No” box if mother is not Spanish/Hispanic/Latina)
□ No, not Spanish/Hispanic/Latina
□ Yes, Mexican, Mexican American, Chicana
□ Yes, Puerto Rican
□ Yes, Cuban
□ Yes, other Spanish/Hispanic/Latina
(Specify)_____________________________
22. MOTHER’S RACE (Check one or more races to indicate what the mother considers herself to be)
□ White □ Black or African American □ American Indian or Alaska Native
(Name of the enrolled or principal tribe)________________ □ Asian Indian □ Chinese □ Filipino □ Japanese □ Korean □ Vietnamese □ Other Asian (Specify)______________________________ □ Native Hawaiian □ Guamanian or Chamorro □ Samoan □ Other Pacific Islander (Specify)______________________ □ Other (Specify)___________________________________
F A T H E R 23. FATHER’S EDUCATION (Check the box that best describes the highest degree or level of school completed at the time of delivery)
□ 8th grade or less
□ 9th - 12th grade, no diploma
□ High school graduate or GEDcompleted
□ Some college credit but no degree
□ Associate degree (e.g., AA, AS)
□ Bachelor’s degree (e.g., BA, AB, BS)
□ Master’s degree (e.g., MA, MS,MEng, MEd, MSW, MBA)
□ Doctorate (e.g., PhD, EdD) orProfessional degree (e.g., MD, DDS, DVM, LLB, JD)
24. FATHER OF HISPANIC ORIGIN? (Check the box that best describes whether the father is Spanish/Hispanic/Latino. Check the “No” box if father is not Spanish/Hispanic/Latino)
□ No, not Spanish/Hispanic/Latino
□ Yes, Mexican, Mexican American, Chicano
□ Yes, Puerto Rican
□ Yes, Cuban
□ Yes, other Spanish/Hispanic/Latino
(Specify)_____________________________
25. FATHER’S RACE (Check one or more races to indicate what the father considers himself to be)
□ White □ Black or African American □ American Indian or Alaska Native
(Name of the enrolled or principal tribe)________________ □ Asian Indian □ Chinese □ Filipino □ Japanese □ Korean □ Vietnamese □ Other Asian (Specify)______________________________ □ Native Hawaiian □ Guamanian or Chamorro □ Samoan □ Other Pacific Islander (Specify)______________________ □ Other (Specify)___________________________________
Mot
her’s
Nam
e __
____
____
____
__
Mot
her’s
Med
ical
Rec
ord
No.
__
____
____
____
____
____
___
26. PLACE WHERE BIRTH OCCURRED (Check one) 27. ATTENDANT’S NAME, TITLE, AND NPI 28. MOTHER TRANSFERRED FOR MATERNAL□ Hospital MEDICAL OR FETAL INDICATIONS FOR
□ Freestanding birthing center NAME: _______________________ NPI:_______ DELIVERY? □ Yes □ No
□ Home Birth: Planned to deliver at home? 9 Yes 9 No TITLE: □ MD □ DO □ CNM/CM □ OTHER MIDWIFE IF YES, ENTER NAME OF FACILITY MOTHER TRANSFERRED FROM:
□ Clinic/Doctor’s office □ OTHER (Specify)___________________ □ Other (Specify)_______________________ _______________________________________
MOTHER 29a. DATE OF FIRST PRENATAL CARE VISIT ______ /________/ __________ □ No Prenatal Care M M D D YYYY
29b. DATE OF LAST PRENATAL CARE VISIT ______ /________/ __________
M M D D YYYY
30. TOTAL NUMBER OF PRENATAL VISITS FOR THIS PREGNANCY
_________________________ (If none, enter A0".)
31. MOTHER’S HEIGHT _______ (feet/inches)
32. MOTHER’S PREPREGNANCY WEIGHT _________ (pounds)
33. MOTHER’S WEIGHT AT DELIVERY _________ (pounds)
34. DID MOTHER GET WIC FOOD FOR HERSELF DURING THIS PREGNANCY? □ Yes □ No
35. NUMBER OF PREVIOUS LIVE BIRTHS (Do not include
this child)
36. NUMBER OF OTHER PREGNANCY OUTCOMES (spontaneous or induced losses or ectopic pregnancies)
37. CIGARETTE SMOKING BEFORE AND DURING PREGNANCY For each time period, enter either the number of cigarettes or the number of packs of cigarettes smoked. IF NONE, ENTER A0".
Average number of cigarettes or packs of cigarettes smoked per day. # of cigarettes # of packs
Three Months Before Pregnancy _________ OR ________ First Three Months of Pregnancy _________ OR ________ Second Three Months of Pregnancy _________ OR ________
Third Trimester of Pregnancy _________ OR ________
38. PRINCIPAL SOURCE OF PAYMENT FOR THIS DELIVERY
□ Private Insurance □ Medicaid □ Self-pay □ Other
(Specify) _______________
35a. Now Living
Number _____
□ None
35b. Now Dead
Number _____
□ None
36a. Other Outcomes
Number _____
□ None
35c. DATE OF LAST LIVE BIRTH 36b. DATE OF LAST OTHER 39. DATE LAST NORMAL MENSES BEGAN 40. MOTHER’S MEDICAL RECORD NUMBER _______/________ PREGNANCY OUTCOME ______ /________/ __________ MM Y Y Y Y _______/________
MM Y Y Y Y M M D D YYYY
MEDICAL AND
HEALTH INFORMATION
41. RISK FACTORS IN THIS PREGNANCY (Check all that apply)
Diabetes □ Prepregnancy (Diagnosis prior to this pregnancy) □ Gestational (Diagnosis in this pregnancy)
Hypertension □ Prepregnancy (Chronic) □ Gestational (PIH, preeclampsia) □ Eclampsia
□ Previous preterm birth
□ Other previous poor pregnancy outcome (Includes perinatal death, small-for-gestational age/intrauterine growth restricted birth)
□ Pregnancy resulted from infertility treatment-If yes, check all that apply: □ Fertility-enhancing drugs, Artificial insemination or
Intrauterine insemination □ Assisted reproductive technology (e.g., in vitro
fertilization (IVF), gamete intrafallopian transfer (GIFT))
□ Mother had a previous cesarean delivery If yes, how many __________
□ None of the above
43. OBSTETRIC PROCEDURES (Check all that apply)
□ Cervical cerclage □ Tocolysis
External cephalic version: □ Successful □ Failed
□ None of the above
46. METHOD OF DELIVERY
A. Was delivery with forceps attempted but unsuccessful?
□ Yes □ No
B. Was delivery with vacuum extraction attempted but unsuccessful?
□ Yes □ No
C. Fetal presentation at birth □ Cephalic □ Breech □ Other
D. Final route and method of delivery (Check one) □ Vaginal/Spontaneous □ Vaginal/Forceps □ Vaginal/Vacuum □ Cesarean
If cesarean, was a trial of labor attempted? □ Yes □ No
44. ONSET OF LABOR (Check all that apply)
□ Premature Rupture of the Membranes (prolonged, ∃12 hrs.)
□ Precipitous Labor (<3 hrs.)
□ Prolonged Labor (∃ 20 hrs.)
□ None of the above
45. CHARACTERISTICS OF LABOR AND DELIVERY (Check all that apply)
□ Induction of labor □ Augmentation of labor □ Non-vertex presentation □ Steroids (glucocorticoids) for fetal lung maturation
received by the mother prior to delivery □ Antibiotics received by the mother during labor □ Clinical chorioamnionitis diagnosed during labor or
47. MATERNAL MORBIDITY (Check all that apply) (Complications associated with labor and delivery)
□ Maternal transfusion □ Third or fourth degree perineal laceration □ Ruptured uterus □ Unplanned hysterectomy □ Admission to intensive care unit
42. INFECTIONS PRESENT AND/OR TREATED DURING THIS PREGNANCY (Check all that apply)
□ Gonorrhea □ Syphilis
maternal temperature >38°C (100.4°F) □ Moderate/heavy meconium staining of the amniotic fluid
□ Unplanned operating room procedure following delivery
□ Chlamydia □ Fetal intolerance of labor such that one or more of the □ None of the above □ Hepatitis B □ Hepatitis C □ None of the above
following actions was taken: in-utero resuscitative measures, further fetal assessment, or operative delivery
□ Epidural or spinal anesthesia during labor □ None of the above
NEWBORN INFORMATION
NEWBORN
Mot
her’s
Nam
e __
____
____
____
__
Mot
her’s
Med
ical
Rec
ord
No.
___
____
____
____
____
_
48. NEWBORN MEDICAL RECORD NUMBER 54. ABNORMAL CONDITIONS OF THE NEWBORN (Check all that apply)
□ Assisted ventilation required immediately following delivery
□ Assisted ventilation required for more than six hours
□ NICU admission
□ Newborn given surfactant replacement therapy
□ Antibiotics received by the newborn for suspected neonatal sepsis
□ Seizure or serious neurologic dysfunction
□ Significant birth injury (skeletal fracture(s), peripheral nerve injury, and/or soft tissue/solid organ hemorrhage which requires intervention)
9 None of the above
55. CONGENITAL ANOMALIES OF THE NEWBORN (Check all that apply)
□ Anencephaly □ Meningomyelocele/Spina bifida □ Cyanotic congenital heart disease □ Congenital diaphragmatic hernia □ Omphalocele □ Gastroschisis □ Limb reduction defect (excluding congenital
amputation and dwarfing syndromes) □ Cleft Lip with or without Cleft Palate □ Cleft Palate alone □ Down Syndrome
□ Karyotype confirmed □ Karyotype pending
□ Suspected chromosomal disorder □ Karyotype confirmed □ Karyotype pending
□ Hypospadias □ None of the anomalies listed above
49. BIRTHWEIGHT (grams preferred, specify unit)
______________________ 9 grams 9 lb/oz
50. OBSTETRIC ESTIMATE OF GESTATION:
_________________ (completed weeks)
51. APGAR SCORE: Score at 5 minutes:________________________
If 5 minute score is less than 6,
Score at 10 minutes: _______________________
52. PLURALITY - Single, Twin, Triplet, etc.
(Specify)________________________
53. IF NOT SINGLE BIRTH - Born First, Second,
Third, etc. (Specify) ________________
56. WAS INFANT TRANSFERRED WITHIN 24 HOURS OF DELIVERY? 9 Yes 9 No IF YES, NAME OF FACILITY INFANT TRANSFERRED
TO:______________________________________________________
57. IS INFANT LIVING AT TIME OF REPORT? □ Yes □ No □ Infant transferred, status unknown
58. IS THE INFANT BEING BREASTFED AT DISCHARGE?
□ Yes □ No
Table A. Births by place of occurrence and residence for
births occurring in the 50 states, the District of Columbia,
and U.S. territories, 2019
Number live births
Area Occurrence1
Residence1,2
United States 3,757,582 3,747,540
Alabama 57,224 58,615
Alaska 9,735 9,822
Arizona 80,371 79,375
Arkansas 35,314 36,564
California 447,653 446,479
Colorado 63,520 62,869
Connecticut 35,557 34,258
Delaware 10,935 10,562
District of Columbia 13,384 9,079
Florida 220,230 220,002
Georgia 127,255 126,371
Hawaii 16,827 16,797
Idaho 21,762 22,063
Illinois 136,602 140,128
Indiana 81,354 80,859
Iowa 37,558 37,649
Kansas 36,986 35,395
Kentucky 50,874 53,069
Louisiana 59,111 58,941
Maine 11,509 11,779
Maryland 66,793 70,178
Massachusetts 69,916 69,117
Michigan 106,918 107,886
Minnesota 65,082 66,027
Mississippi 35,663 36,636
Missouri 72,912 72,127
Montana 11,122 11,079
Nebraska 25,146 24,755
Nevada 34,731 35,072
New Hampshire 11,825 11,839
New Jersey 96,906 99,585
New Mexico 21,574 22,960
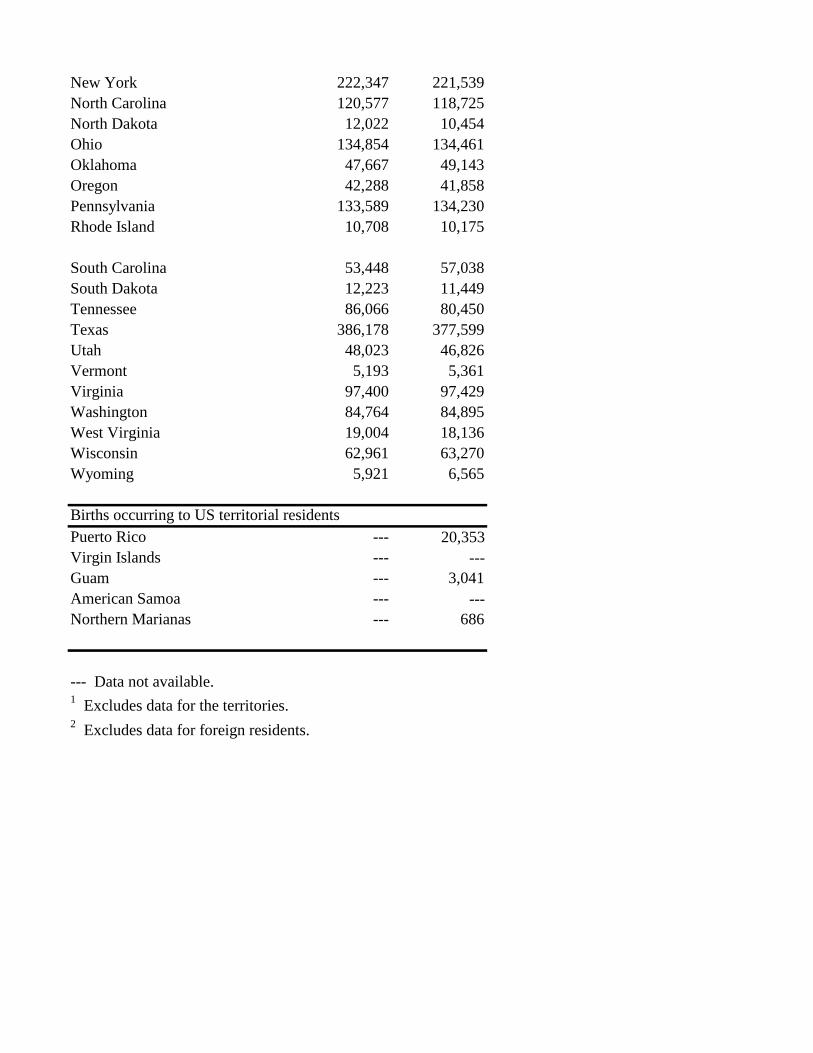
New York 222,347 221,539
North Carolina 120,577 118,725
North Dakota 12,022 10,454
Ohio 134,854 134,461
Oklahoma 47,667 49,143
Oregon 42,288 41,858
Pennsylvania 133,589 134,230
Rhode Island 10,708 10,175
South Carolina 53,448 57,038
South Dakota 12,223 11,449
Tennessee 86,066 80,450
Texas 386,178 377,599
Utah 48,023 46,826
Vermont 5,193 5,361
Virginia 97,400 97,429
Washington 84,764 84,895
West Virginia 19,004 18,136
Wisconsin 62,961 63,270
Wyoming 5,921 6,565
Births occurring to US territorial residents
Puerto Rico --- 20,353
Virgin Islands --- ---
Guam --- 3,041
American Samoa --- ---
Northern Marianas ---
--- Data not available. 1 Excludes data for the territories.
2 Excludes data for foreign residents.
686
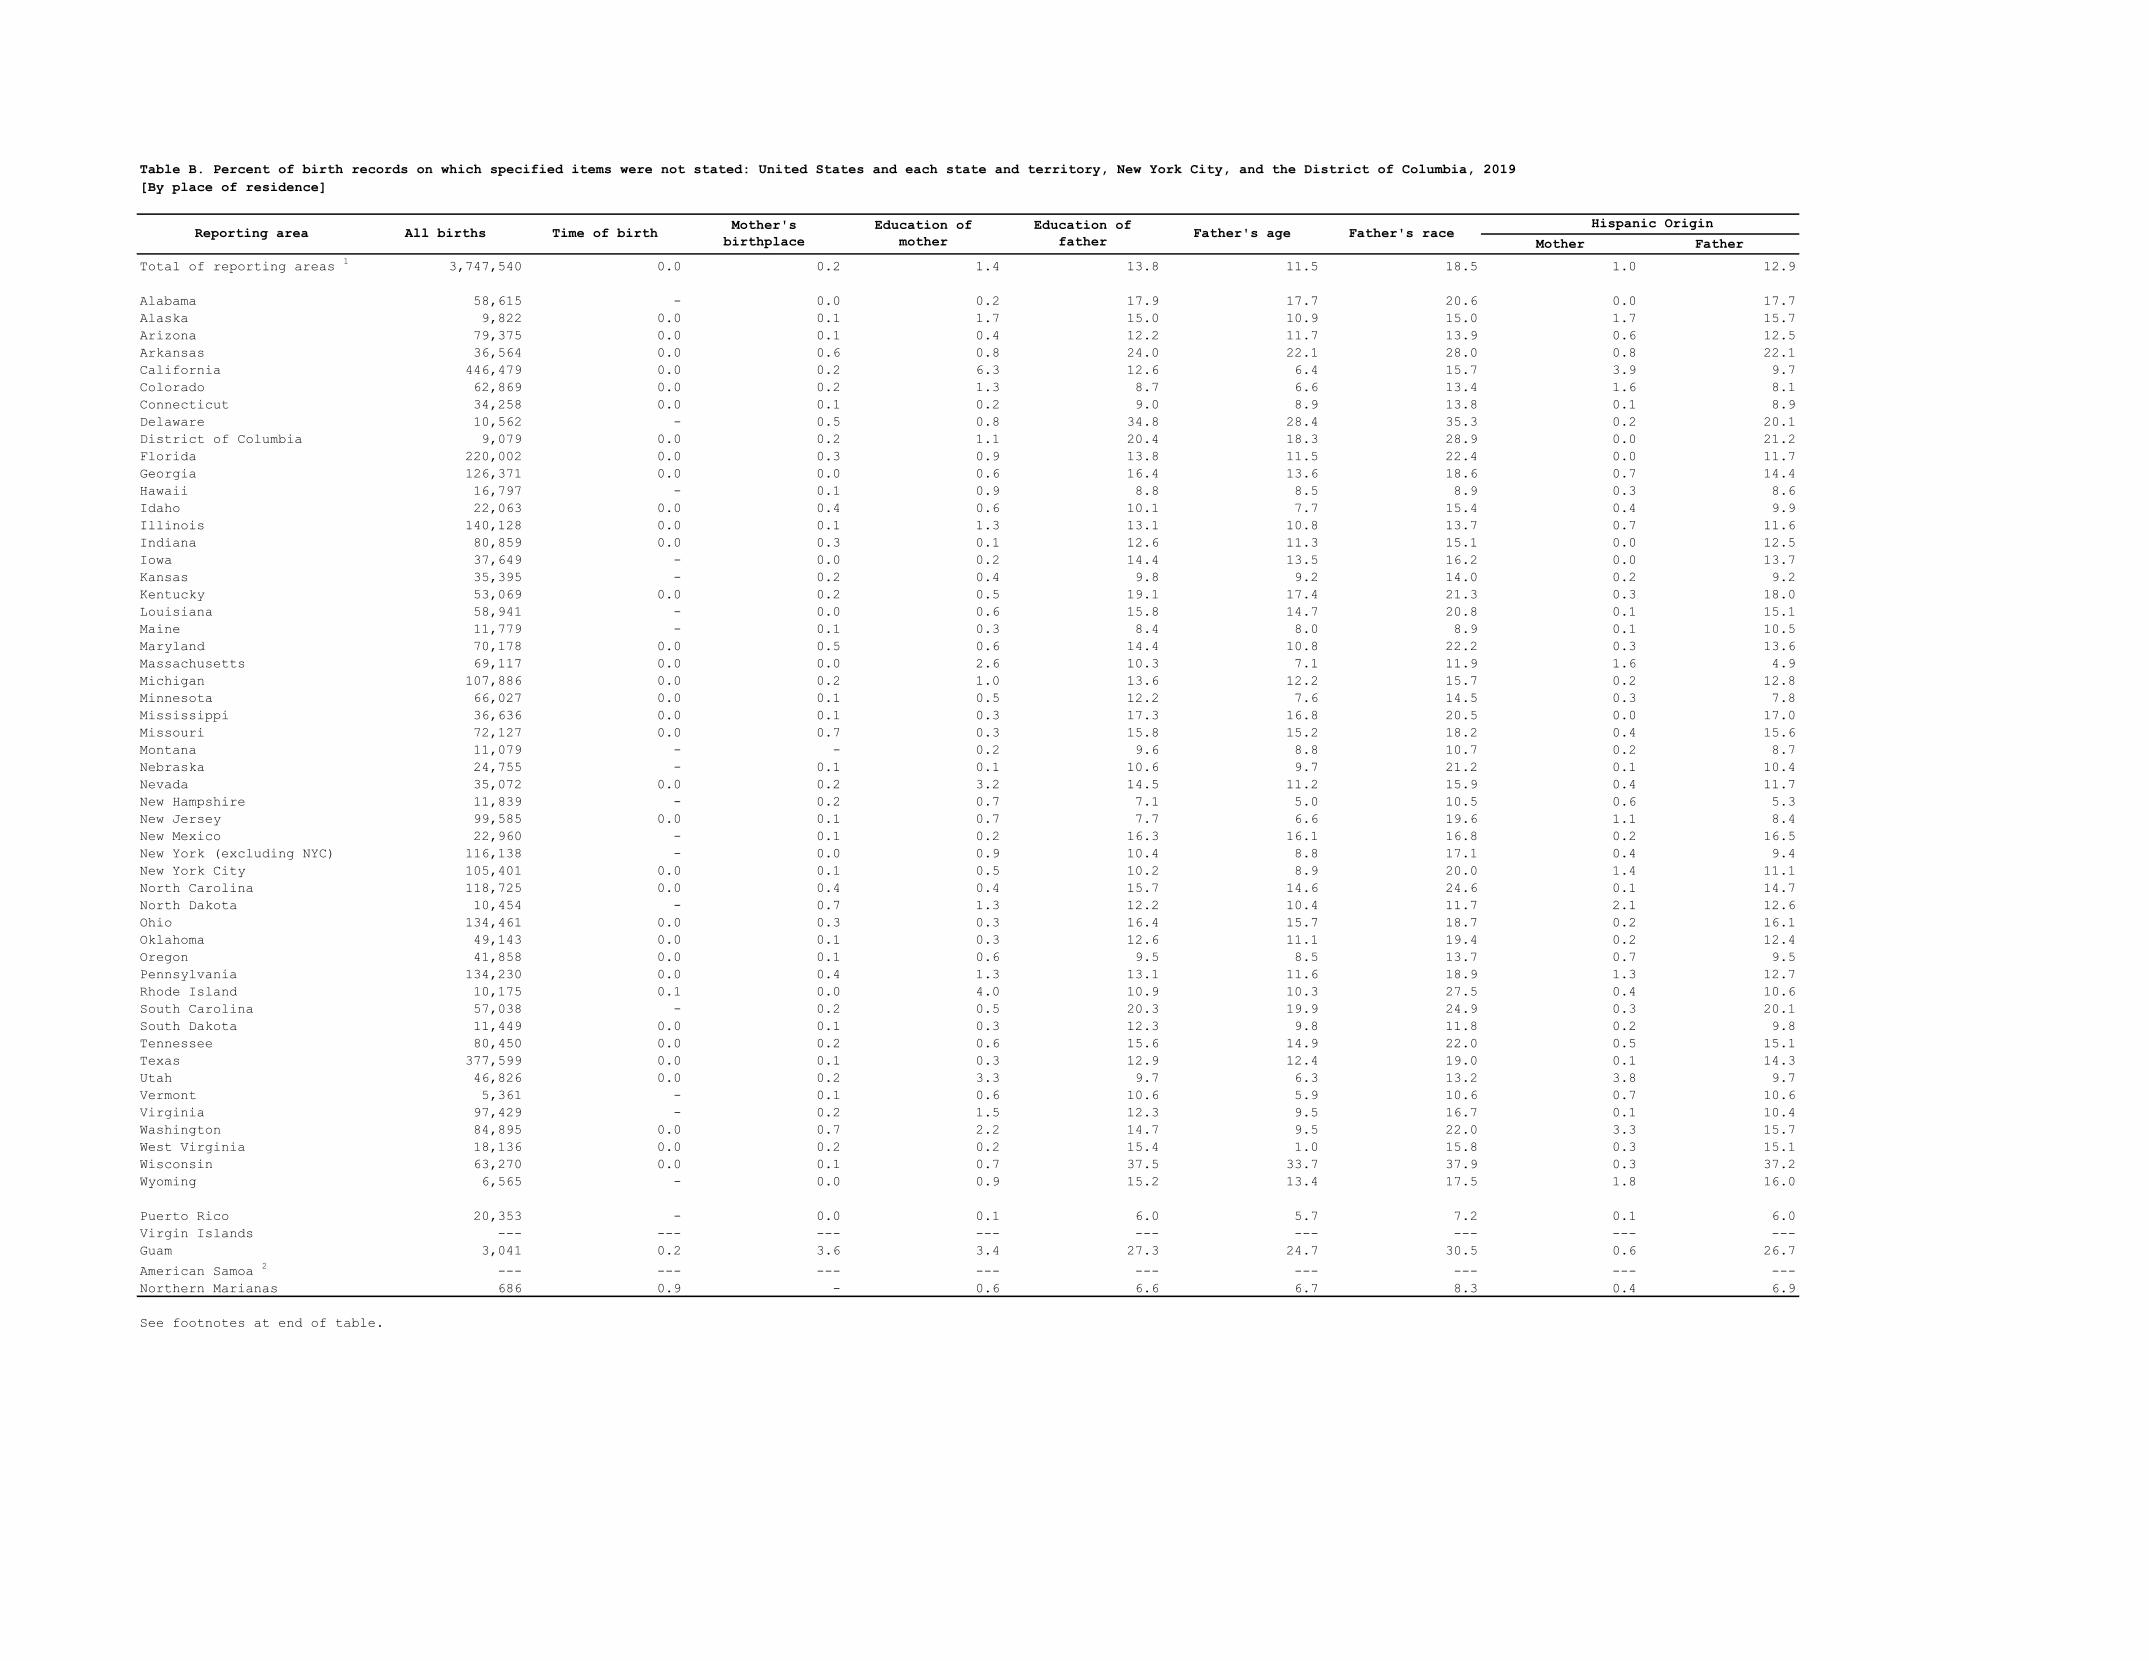
Table B. Percent of birth records on which specified items were not stated: United States and each state and territory, New York City, and the District of Columbia, 2019
[By place of residence]
Reporting area All births Time of birth Mother's
birthplace
Education of
mother
Education of
father Father's age Father's race
Mother Father
Hispanic Origin
Total of reporting areas 1
3,747,540 0.0 0.2 1.4 13.8 11.5 18.5 1.0 12.9
Alabama 58,615 - 0.0 0.2 17.9 17.7 20.6 0.0 17.7
Alaska 9,822 0.0 0.1 1.7 15.0 10.9 15.0 1.7 15.7
Arizona 79,375 0.0 0.1 0.4 12.2 11.7 13.9 0.6 12.5
Arkansas 36,564 0.0 0.6 0.8 24.0 22.1 28.0 0.8 22.1
California 446,479 0.0 0.2 6.3 12.6 6.4 15.7 3.9 9.7
Colorado 62,869 0.0 0.2 1.3 8.7 6.6 13.4 1.6 8.1
Connecticut 34,258 0.0 0.1 0.2 9.0 8.9 13.8 0.1 8.9
Delaware 10,562 - 0.5 0.8 34.8 28.4 35.3 0.2 20.1
District of Columbia 9,079 0.0 0.2 1.1 20.4 18.3 28.9 0.0 21.2
Florida 220,002 0.0 0.3 0.9 13.8 11.5 22.4 0.0 11.7
Georgia 126,371 0.0 0.0 0.6 16.4 13.6 18.6 0.7 14.4
Hawaii 16,797 - 0.1 0.9 8.8 8.5 8.9 0.3 8.6
Idaho 22,063 0.0 0.4 0.6 10.1 7.7 15.4 0.4 9.9
Illinois 140,128 0.0 0.1 1.3 13.1 10.8 13.7 0.7 11.6
Indiana 80,859 0.0 0.3 0.1 12.6 11.3 15.1 0.0 12.5
Iowa 37,649 - 0.0 0.2 14.4 13.5 16.2 0.0 13.7
Kansas 35,395 - 0.2 0.4 9.8 9.2 14.0 0.2 9.2
Kentucky 53,069 0.0 0.2 0.5 19.1 17.4 21.3 0.3 18.0
Louisiana 58,941 - 0.0 0.6 15.8 14.7 20.8 0.1 15.1
Maine 11,779 - 0.1 0.3 8.4 8.0 8.9 0.1 10.5
Maryland 70,178 0.0 0.5 0.6 14.4 10.8 22.2 0.3 13.6
Massachusetts 69,117 0.0 0.0 2.6 10.3 7.1 11.9 1.6 4.9
Michigan 107,886 0.0 0.2 1.0 13.6 12.2 15.7 0.2 12.8
Minnesota 66,027 0.0 0.1 0.5 12.2 7.6 14.5 0.3 7.8
Mississippi 36,636 0.0 0.1 0.3 17.3 16.8 20.5 0.0 17.0
Missouri 72,127 0.0 0.7 0.3 15.8 15.2 18.2 0.4 15.6
Montana 11,079 - - 0.2 9.6 8.8 10.7 0.2 8.7
Nebraska 24,755 - 0.1 0.1 10.6 9.7 21.2 0.1 10.4
Nevada 35,072 0.0 0.2 3.2 14.5 11.2 15.9 0.4 11.7
New Hampshire 11,839 - 0.2 0.7 7.1 5.0 10.5 0.6 5.3
New Jersey 99,585 0.0 0.1 0.7 7.7 6.6 19.6 1.1 8.4
New Mexico 22,960 - 0.1 0.2 16.3 16.1 16.8 0.2 16.5
New York (excluding NYC) 116,138 - 0.0 0.9 10.4 8.8 17.1 0.4 9.4
New York City 105,401 0.0 0.1 0.5 10.2 8.9 20.0 1.4 11.1
North Carolina 118,725 0.0 0.4 0.4 15.7 14.6 24.6 0.1 14.7
North Dakota 10,454 - 0.7 1.3 12.2 10.4 11.7 2.1 12.6
Ohio 134,461 0.0 0.3 0.3 16.4 15.7 18.7 0.2 16.1
Oklahoma 49,143 0.0 0.1 0.3 12.6 11.1 19.4 0.2 12.4
Oregon 41,858 0.0 0.1 0.6 9.5 8.5 13.7 0.7 9.5
Pennsylvania 134,230 0.0 0.4 1.3 13.1 11.6 18.9 1.3 12.7
Rhode Island 10,175 0.1 0.0 4.0 10.9 10.3 27.5 0.4 10.6
South Carolina 57,038 - 0.2 0.5 20.3 19.9 24.9 0.3 20.1
South Dakota 11,449 0.0 0.1 0.3 12.3 9.8 11.8 0.2 9.8
Tennessee 80,450 0.0 0.2 0.6 15.6 14.9 22.0 0.5 15.1
Texas 377,599 0.0 0.1 0.3 12.9 12.4 19.0 0.1 14.3
Utah 46,826 0.0 0.2 3.3 9.7 6.3 13.2 3.8 9.7
Vermont 5,361 - 0.1 0.6 10.6 5.9 10.6 0.7 10.6
Virginia 97,429 - 0.2 1.5 12.3 9.5 16.7 0.1 10.4
Washington 84,895 0.0 0.7 2.2 14.7 9.5 22.0 3.3 15.7
West Virginia 18,136 0.0 0.2 0.2 15.4 1.0 15.8 0.3 15.1
Wisconsin 63,270 0.0 0.1 0.7 37.5 33.7 37.9 0.3 37.2
Wyoming 6,565 - 0.0 0.9 15.2 13.4 17.5 1.8 16.0
Puerto Rico 20,353 - 0.0 0.1 6.0 5.7 7.2 0.1 6.0
Virgin Islands --- --- --- --- --- --- --- --- ---
Guam 3,041 0.2 3.6 3.4 27.3 24.7 30.5 0.6 26.7
American Samoa 2
--- --- --- --- --- --- --- --- ---
Northern Marianas 686 0.9 - 0.6 6.6 6.7 8.3 0.4 6.9
See footnotes at end of table.
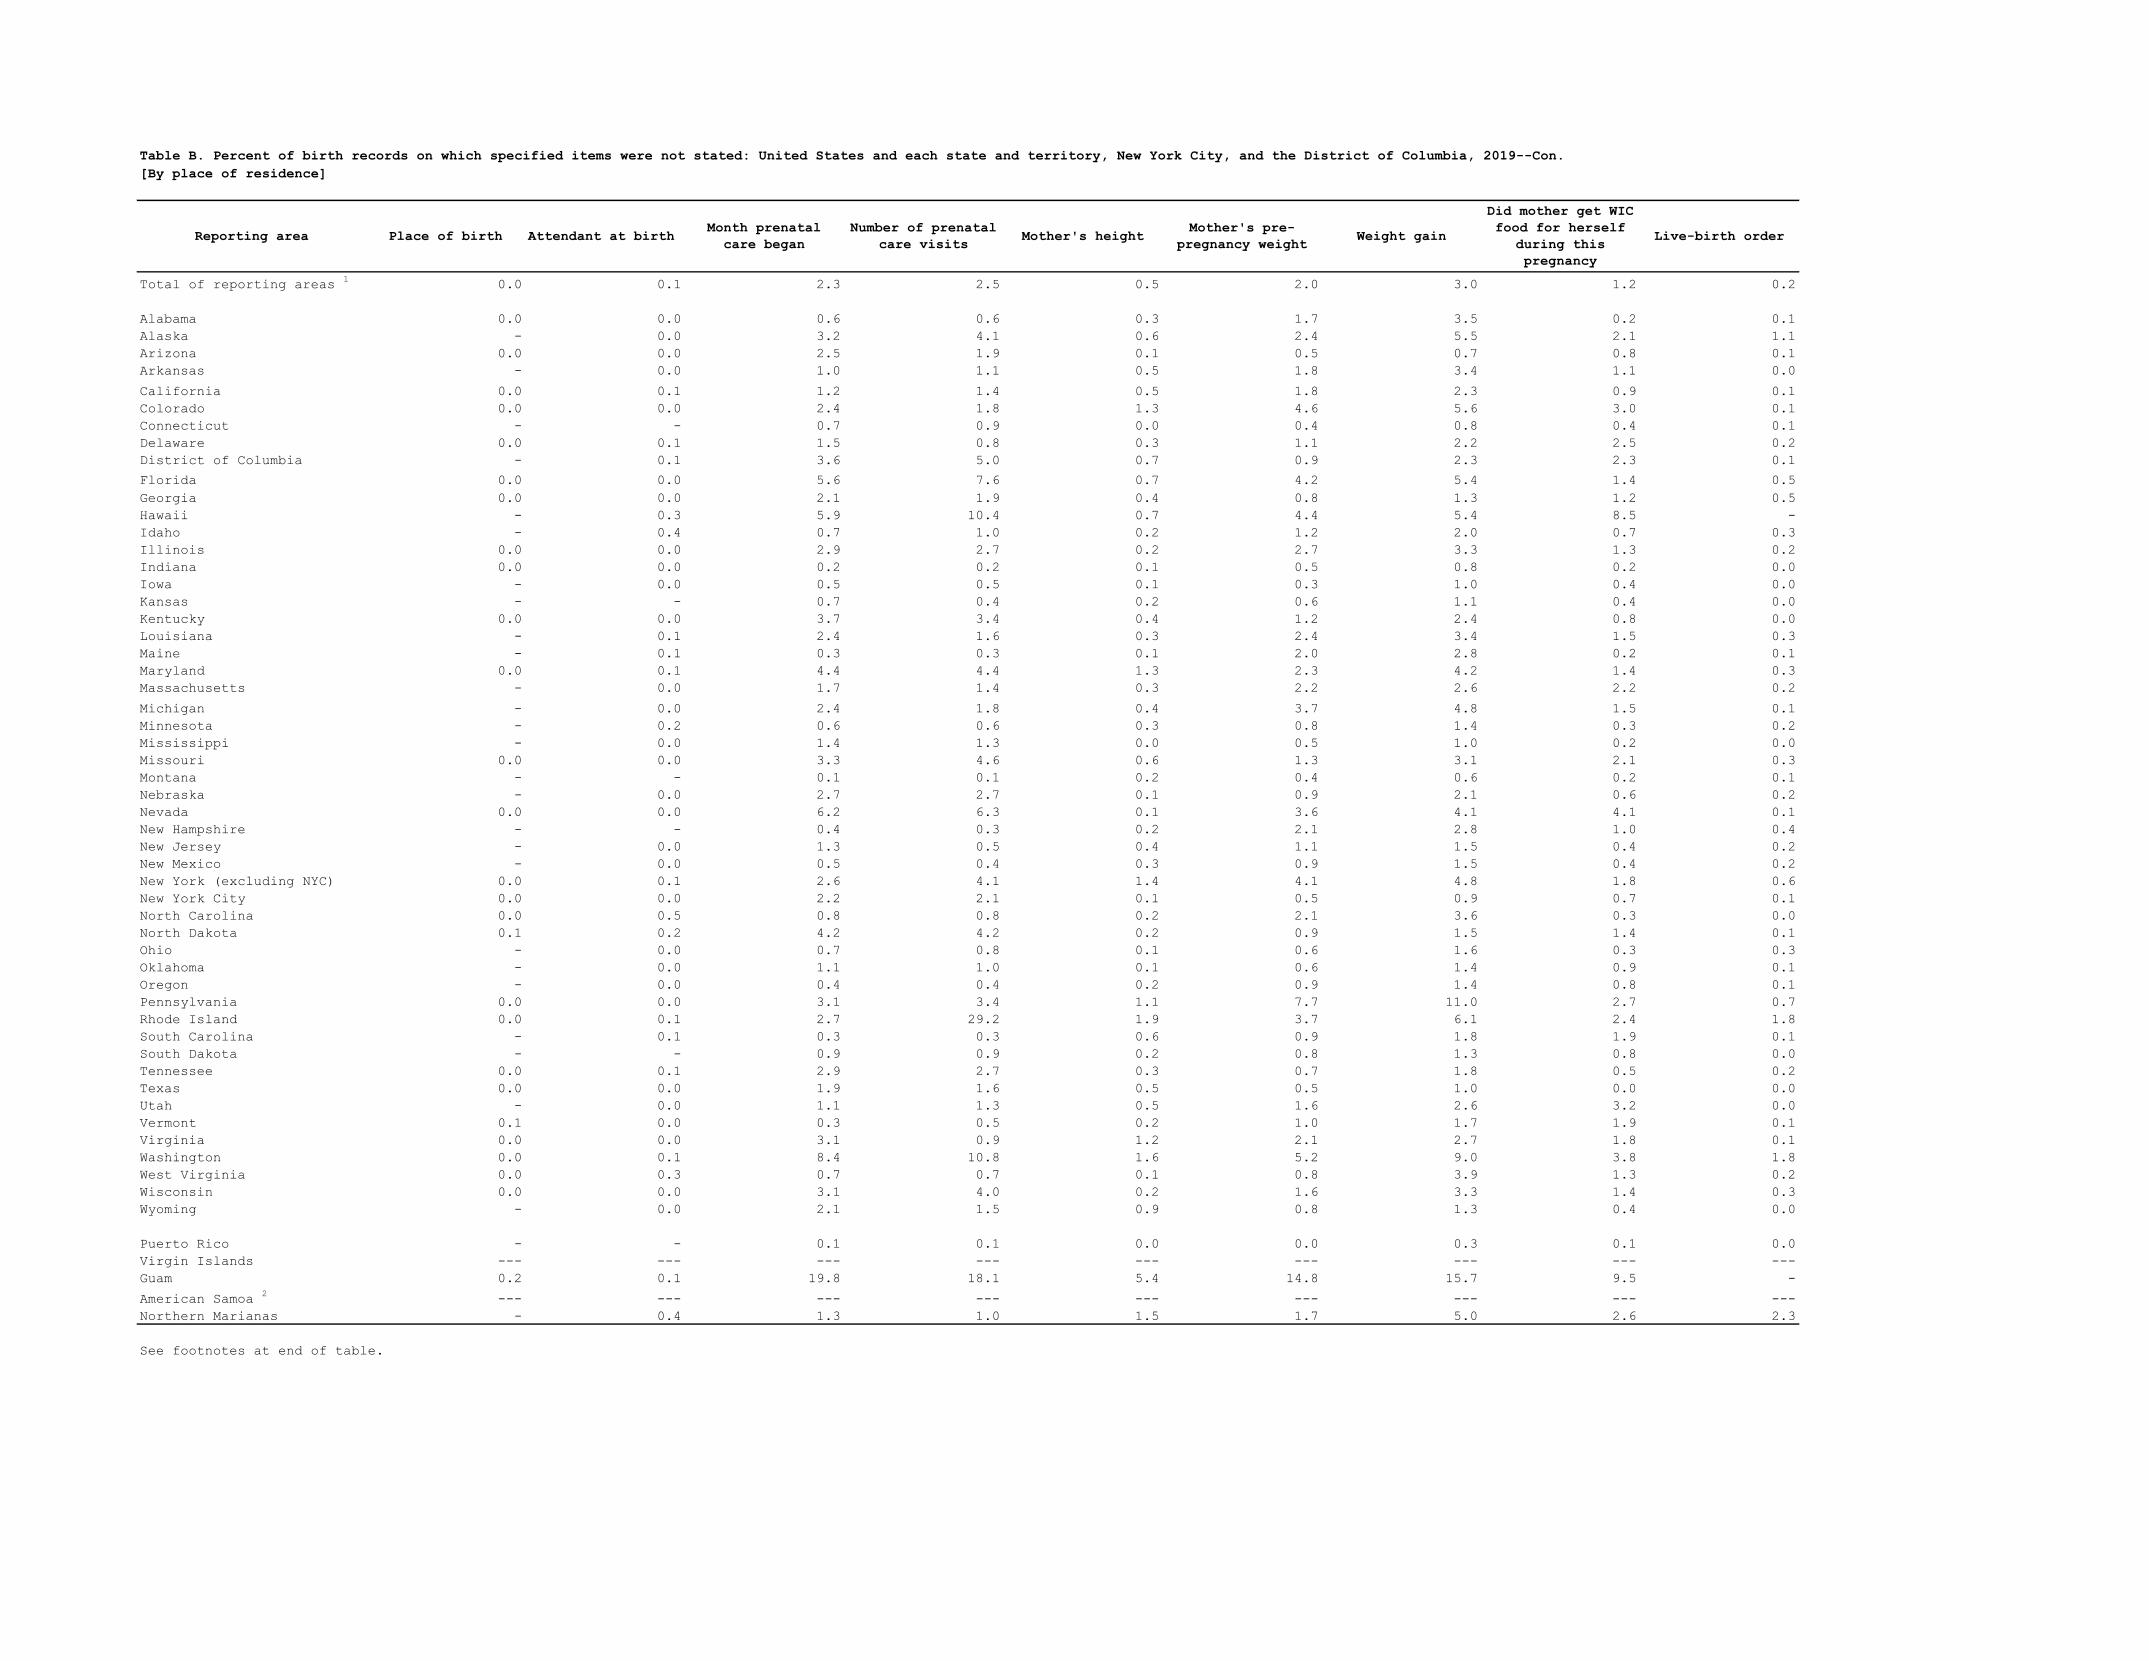
Table B. Percent of birth records on which specified items were not stated: United States and each state and territory, New York City, and the District of Columbia, 2019--Con.
[By place of residence]
Did mother get WIC
Reporting area Place of birth Attendant at birth Month prenatal
care began
Number of prenatal
care visits Mother's height
Mother's pre-
pregnancy weight Weight gain
food for herself
during this Live-birth order
pregnancy
Total of reporting areas 1
0.0 0.1 2.3 2.5 0.5 2.0 3.0 1.2 0.2
Alabama 0.0 0.0 0.6 0.6 0.3 1.7 3.5 0.2 0.1
Alaska - 0.0 3.2 4.1 0.6 2.4 5.5 2.1 1.1
Arizona 0.0 0.0 2.5 1.9 0.1 0.5 0.7 0.8 0.1
Arkansas - 0.0 1.0 1.1 0.5 1.8 3.4 1.1 0.0
California 0.0 0.1 1.2 1.4 0.5 1.8 2.3 0.9 0.1
Colorado 0.0 0.0 2.4 1.8 1.3 4.6 5.6 3.0 0.1
Connecticut - - 0.7 0.9 0.0 0.4 0.8 0.4 0.1
Delaware 0.0 0.1 1.5 0.8 0.3 1.1 2.2 2.5 0.2
District of Columbia - 0.1 3.6 5.0 0.7 0.9 2.3 2.3 0.1
Florida 0.0 0.0 5.6 7.6 0.7 4.2 5.4 1.4 0.5
Georgia 0.0 0.0 2.1 1.9 0.4 0.8 1.3 1.2 0.5
Hawaii - 0.3 5.9 10.4 0.7 4.4 5.4 8.5 -
Idaho - 0.4 0.7 1.0 0.2 1.2 2.0 0.7 0.3
Illinois 0.0 0.0 2.9 2.7 0.2 2.7 3.3 1.3 0.2
Indiana 0.0 0.0 0.2 0.2 0.1 0.5 0.8 0.2 0.0
Iowa - 0.0 0.5 0.5 0.1 0.3 1.0 0.4 0.0
Kansas - - 0.7 0.4 0.2 0.6 1.1 0.4 0.0
Kentucky 0.0 0.0 3.7 3.4 0.4 1.2 2.4 0.8 0.0
Louisiana - 0.1 2.4 1.6 0.3 2.4 3.4 1.5 0.3
Maine - 0.1 0.3 0.3 0.1 2.0 2.8 0.2 0.1
Maryland 0.0 0.1 4.4 4.4 1.3 2.3 4.2 1.4 0.3
Massachusetts - 0.0 1.7 1.4 0.3 2.2 2.6 2.2 0.2
Michigan - 0.0 2.4 1.8 0.4 3.7 4.8 1.5 0.1
Minnesota - 0.2 0.6 0.6 0.3 0.8 1.4 0.3 0.2
Mississippi - 0.0 1.4 1.3 0.0 0.5 1.0 0.2 0.0
Missouri 0.0 0.0 3.3 4.6 0.6 1.3 3.1 2.1 0.3
Montana - - 0.1 0.1 0.2 0.4 0.6 0.2 0.1
Nebraska - 0.0 2.7 2.7 0.1 0.9 2.1 0.6 0.2
Nevada 0.0 0.0 6.2 6.3 0.1 3.6 4.1 4.1 0.1
New Hampshire - - 0.4 0.3 0.2 2.1 2.8 1.0 0.4
New Jersey - 0.0 1.3 0.5 0.4 1.1 1.5 0.4 0.2
New Mexico - 0.0 0.5 0.4 0.3 0.9 1.5 0.4 0.2
New York (excluding NYC) 0.0 0.1 2.6 4.1 1.4 4.1 4.8 1.8 0.6
New York City 0.0 0.0 2.2 2.1 0.1 0.5 0.9 0.7 0.1
North Carolina 0.0 0.5 0.8 0.8 0.2 2.1 3.6 0.3 0.0
North Dakota 0.1 0.2 4.2 4.2 0.2 0.9 1.5 1.4 0.1
Ohio - 0.0 0.7 0.8 0.1 0.6 1.6 0.3 0.3
Oklahoma - 0.0 1.1 1.0 0.1 0.6 1.4 0.9 0.1
Oregon - 0.0 0.4 0.4 0.2 0.9 1.4 0.8 0.1
Pennsylvania 0.0 0.0 3.1 3.4 1.1 7.7 11.0 2.7 0.7
Rhode Island 0.0 0.1 2.7 29.2 1.9 3.7 6.1 2.4 1.8
South Carolina - 0.1 0.3 0.3 0.6 0.9 1.8 1.9 0.1
South Dakota - - 0.9 0.9 0.2 0.8 1.3 0.8 0.0
Tennessee 0.0 0.1 2.9 2.7 0.3 0.7 1.8 0.5 0.2
Texas 0.0 0.0 1.9 1.6 0.5 0.5 1.0 0.0 0.0
Utah - 0.0 1.1 1.3 0.5 1.6 2.6 3.2 0.0
Vermont 0.1 0.0 0.3 0.5 0.2 1.0 1.7 1.9 0.1
Virginia 0.0 0.0 3.1 0.9 1.2 2.1 2.7 1.8 0.1
Washington 0.0 0.1 8.4 10.8 1.6 5.2 9.0 3.8 1.8
West Virginia 0.0 0.3 0.7 0.7 0.1 0.8 3.9 1.3 0.2
Wisconsin 0.0 0.0 3.1 4.0 0.2 1.6 3.3 1.4 0.3
Wyoming - 0.0 2.1 1.5 0.9 0.8 1.3 0.4 0.0
Puerto Rico - - 0.1 0.1 0.0 0.0 0.3 0.1 0.0
Virgin Islands --- --- --- --- --- --- --- --- ---
Guam 0.2 0.1 19.8 18.1 5.4 14.8 15.7 9.5 -
American Samoa 2
--- --- --- --- --- --- --- --- ---
Northern Marianas - 0.4 1.3 1.0 1.5 1.7 5.0 2.6 2.3
See footnotes at end of table.
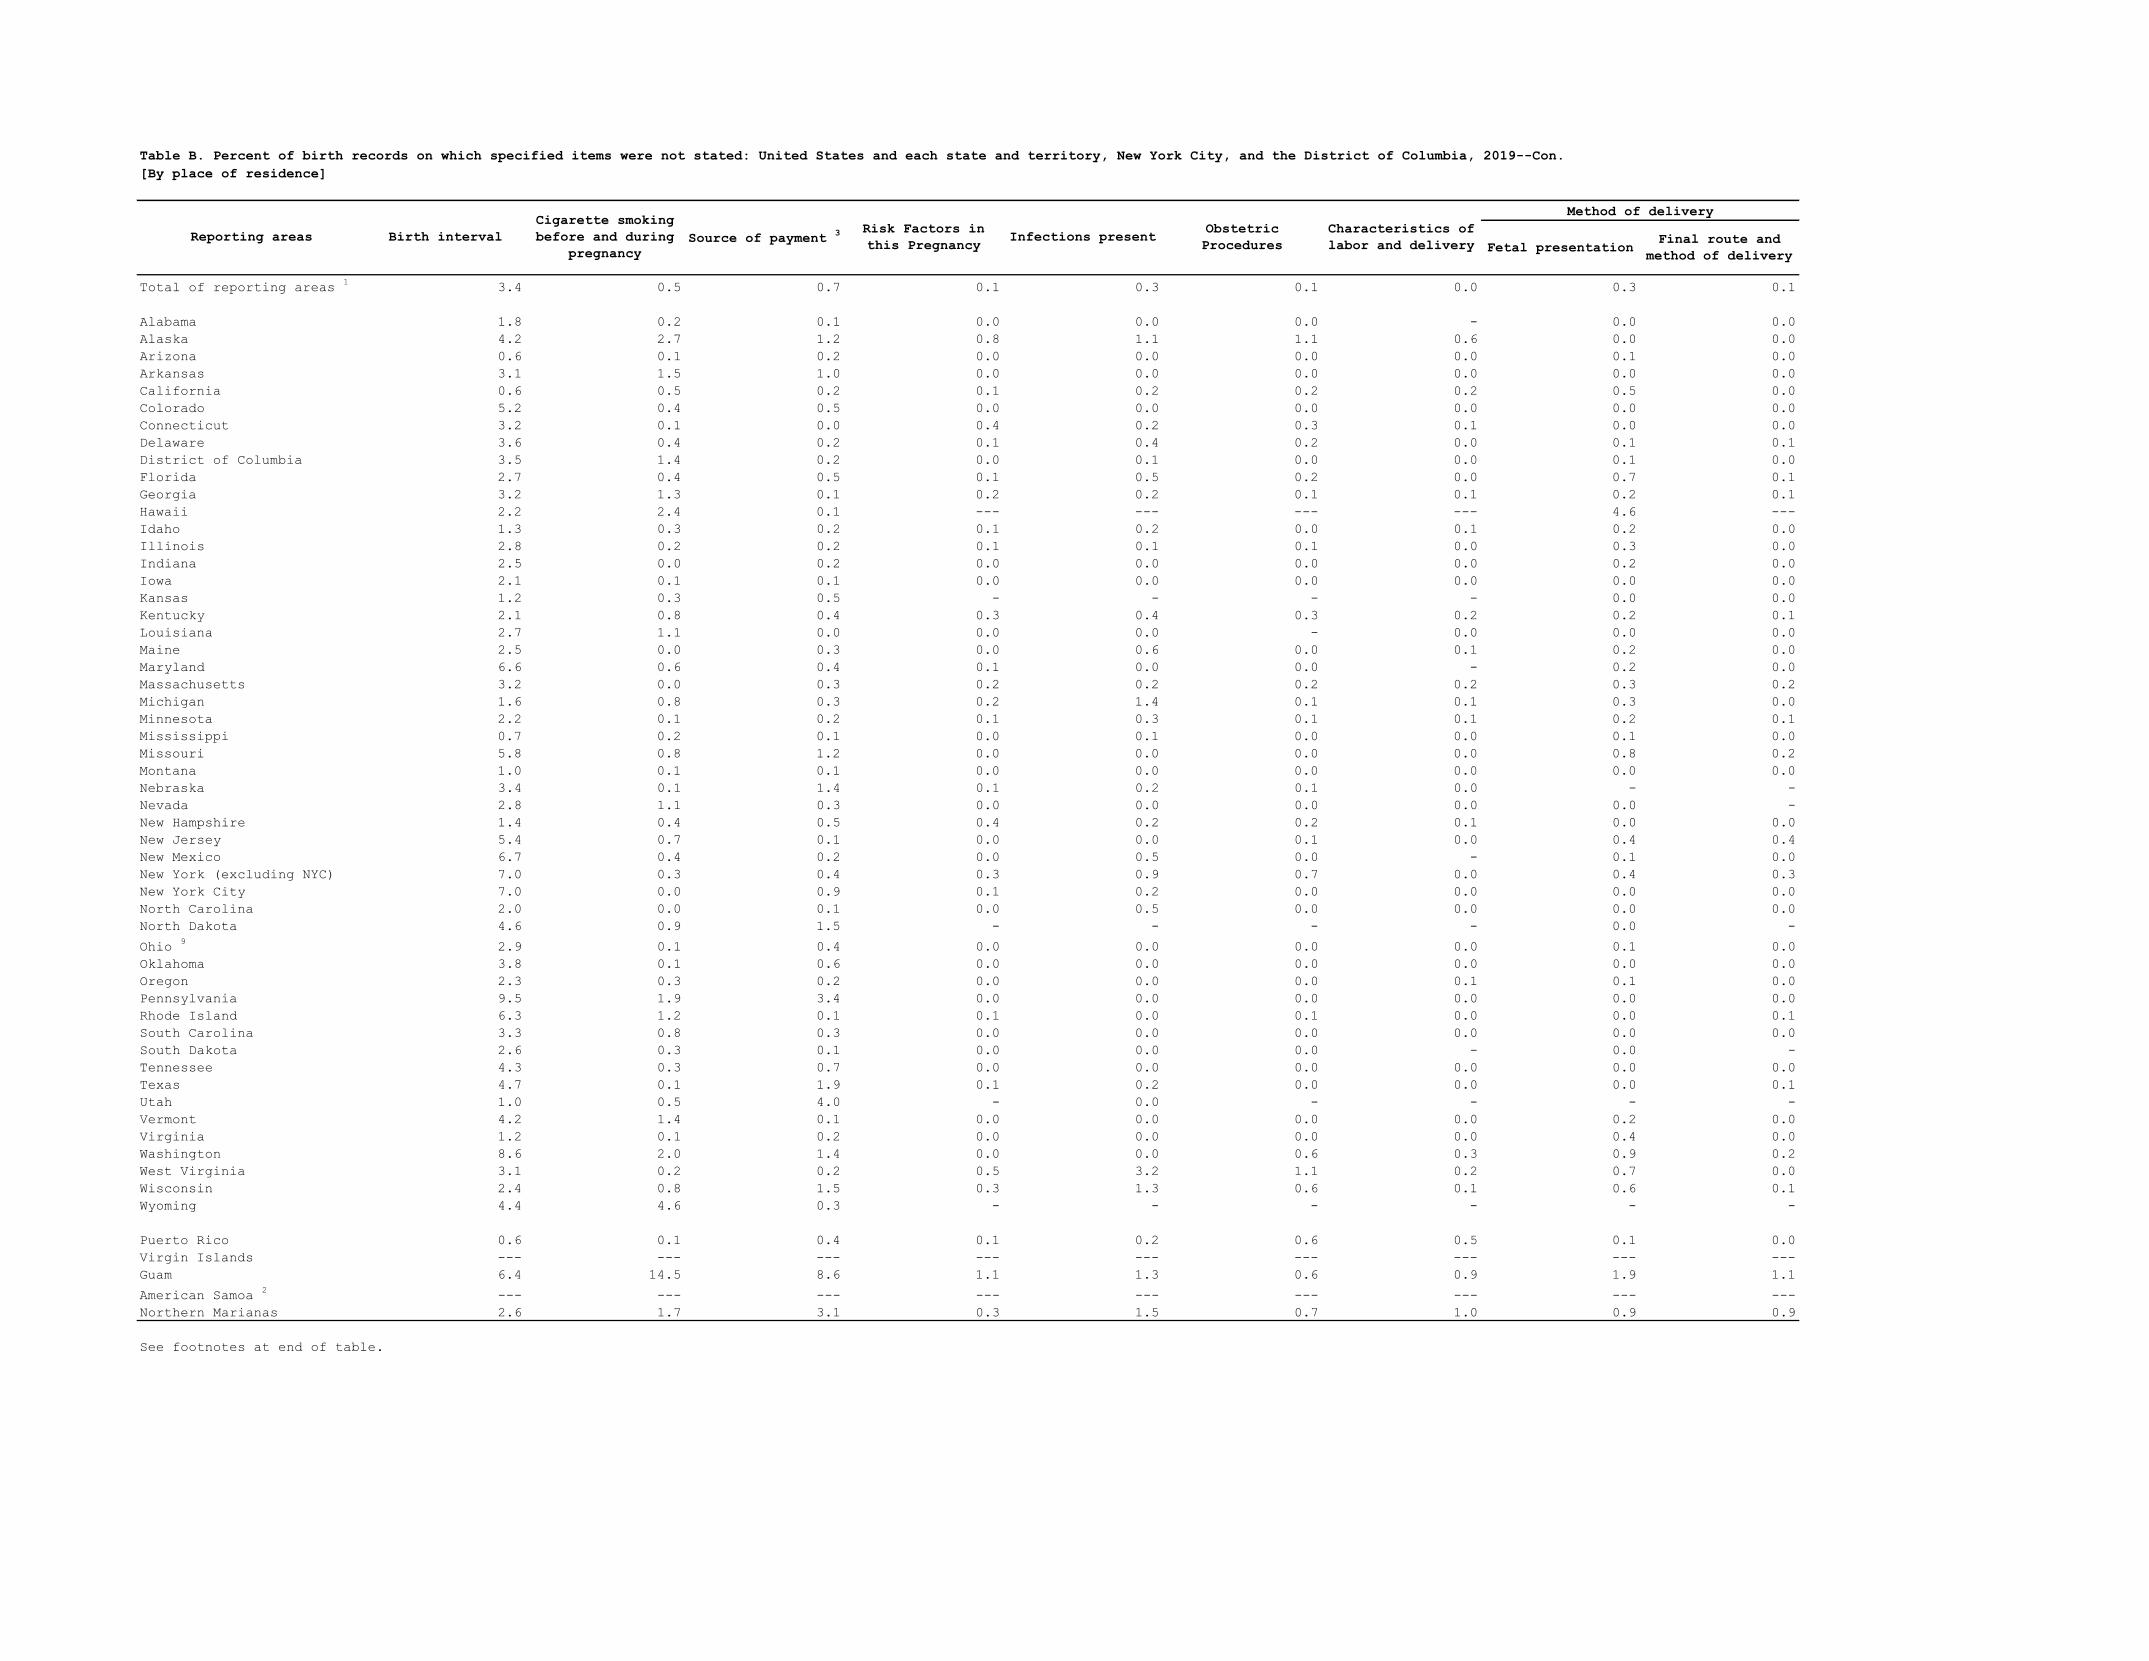
Table B. Percent of birth records on which specified items were not stated: United States and each state and territory, New York City, and the District of Columbia, 2019--Con.
[By place of residence]
Reporting areas Birth interval
Cigarette smoking
before and during
pregnancy
Source of payment 3 Risk Factors in
this Pregnancy Infections present
Obstetric
Procedures
Characteristics of
labor and delivery Fetal presentation Final route and
method of delivery
Method of delivery
Total of reporting areas 1
3.4 0.5 0.7 0.1 0.3 0.1 0.0 0.3 0.1
Alabama 1.8 0.2 0.1 0.0 0.0 0.0 - 0.0 0.0
Alaska 4.2 2.7 1.2 0.8 1.1 1.1 0.6 0.0 0.0
Arizona 0.6 0.1 0.2 0.0 0.0 0.0 0.0 0.1 0.0
Arkansas 3.1 1.5 1.0 0.0 0.0 0.0 0.0 0.0 0.0
California 0.6 0.5 0.2 0.1 0.2 0.2 0.2 0.5 0.0
Colorado 5.2 0.4 0.5 0.0 0.0 0.0 0.0 0.0 0.0
Connecticut 3.2 0.1 0.0 0.4 0.2 0.3 0.1 0.0 0.0
Delaware 3.6 0.4 0.2 0.1 0.4 0.2 0.0 0.1 0.1
District of Columbia 3.5 1.4 0.2 0.0 0.1 0.0 0.0 0.1 0.0
Florida 2.7 0.4 0.5 0.1 0.5 0.2 0.0 0.7 0.1
Georgia 3.2 1.3 0.1 0.2 0.2 0.1 0.1 0.2 0.1
Hawaii 2.2 2.4 0.1 --- --- --- --- 4.6 ---
Idaho 1.3 0.3 0.2 0.1 0.2 0.0 0.1 0.2 0.0
Illinois 2.8 0.2 0.2 0.1 0.1 0.1 0.0 0.3 0.0
Indiana 2.5 0.0 0.2 0.0 0.0 0.0 0.0 0.2 0.0
Iowa 2.1 0.1 0.1 0.0 0.0 0.0 0.0 0.0 0.0
Kansas 1.2 0.3 0.5 - - - - 0.0 0.0
Kentucky 2.1 0.8 0.4 0.3 0.4 0.3 0.2 0.2 0.1
Louisiana 2.7 1.1 0.0 0.0 0.0 - 0.0 0.0 0.0
Maine 2.5 0.0 0.3 0.0 0.6 0.0 0.1 0.2 0.0
Maryland 6.6 0.6 0.4 0.1 0.0 0.0 - 0.2 0.0
Massachusetts 3.2 0.0 0.3 0.2 0.2 0.2 0.2 0.3 0.2
Michigan 1.6 0.8 0.3 0.2 1.4 0.1 0.1 0.3 0.0
Minnesota 2.2 0.1 0.2 0.1 0.3 0.1 0.1 0.2 0.1
Mississippi 0.7 0.2 0.1 0.0 0.1 0.0 0.0 0.1 0.0
Missouri 5.8 0.8 1.2 0.0 0.0 0.0 0.0 0.8 0.2
Montana 1.0 0.1 0.1 0.0 0.0 0.0 0.0 0.0 0.0
Nebraska 3.4 0.1 1.4 0.1 0.2 0.1 0.0 - -
Nevada 2.8 1.1 0.3 0.0 0.0 0.0 0.0 0.0 -
New Hampshire 1.4 0.4 0.5 0.4 0.2 0.2 0.1 0.0 0.0
New Jersey 5.4 0.7 0.1 0.0 0.0 0.1 0.0 0.4 0.4
New Mexico 6.7 0.4 0.2 0.0 0.5 0.0 - 0.1 0.0
New York (excluding NYC) 7.0 0.3 0.4 0.3 0.9 0.7 0.0 0.4 0.3
New York City 7.0 0.0 0.9 0.1 0.2 0.0 0.0 0.0 0.0
North Carolina 2.0 0.0 0.1 0.0 0.5 0.0 0.0 0.0 0.0
North Dakota 4.6 0.9 1.5 - - - - 0.0 -
Ohio 9
2.9 0.1 0.4 0.0 0.0 0.0 0.0 0.1 0.0
Oklahoma 3.8 0.1 0.6 0.0 0.0 0.0 0.0 0.0 0.0
Oregon 2.3 0.3 0.2 0.0 0.0 0.0 0.1 0.1 0.0
Pennsylvania 9.5 1.9 3.4 0.0 0.0 0.0 0.0 0.0 0.0
Rhode Island 6.3 1.2 0.1 0.1 0.0 0.1 0.0 0.0 0.1
South Carolina 3.3 0.8 0.3 0.0 0.0 0.0 0.0 0.0 0.0
South Dakota 2.6 0.3 0.1 0.0 0.0 0.0 - 0.0 -
Tennessee 4.3 0.3 0.7 0.0 0.0 0.0 0.0 0.0 0.0
Texas 4.7 0.1 1.9 0.1 0.2 0.0 0.0 0.0 0.1
Utah 1.0 0.5 4.0 - 0.0 - - - -
Vermont 4.2 1.4 0.1 0.0 0.0 0.0 0.0 0.2 0.0
Virginia 1.2 0.1 0.2 0.0 0.0 0.0 0.0 0.4 0.0
Washington 8.6 2.0 1.4 0.0 0.0 0.6 0.3 0.9 0.2
West Virginia 3.1 0.2 0.2 0.5 3.2 1.1 0.2 0.7 0.0
Wisconsin 2.4 0.8 1.5 0.3 1.3 0.6 0.1 0.6 0.1
Wyoming 4.4 4.6 0.3 - - - - - -
Puerto Rico 0.6 0.1 0.4 0.1 0.2 0.6 0.5 0.1 0.0
Virgin Islands --- --- --- --- --- --- --- --- ---
Guam 6.4 14.5 8.6 1.1 1.3 0.6 0.9 1.9 1.1
American Samoa 2
--- --- --- --- --- --- --- --- ---
Northern Marianas 2.6 1.7 3.1 0.3 1.5 0.7 1.0 0.9 0.9
See footnotes at end of table.
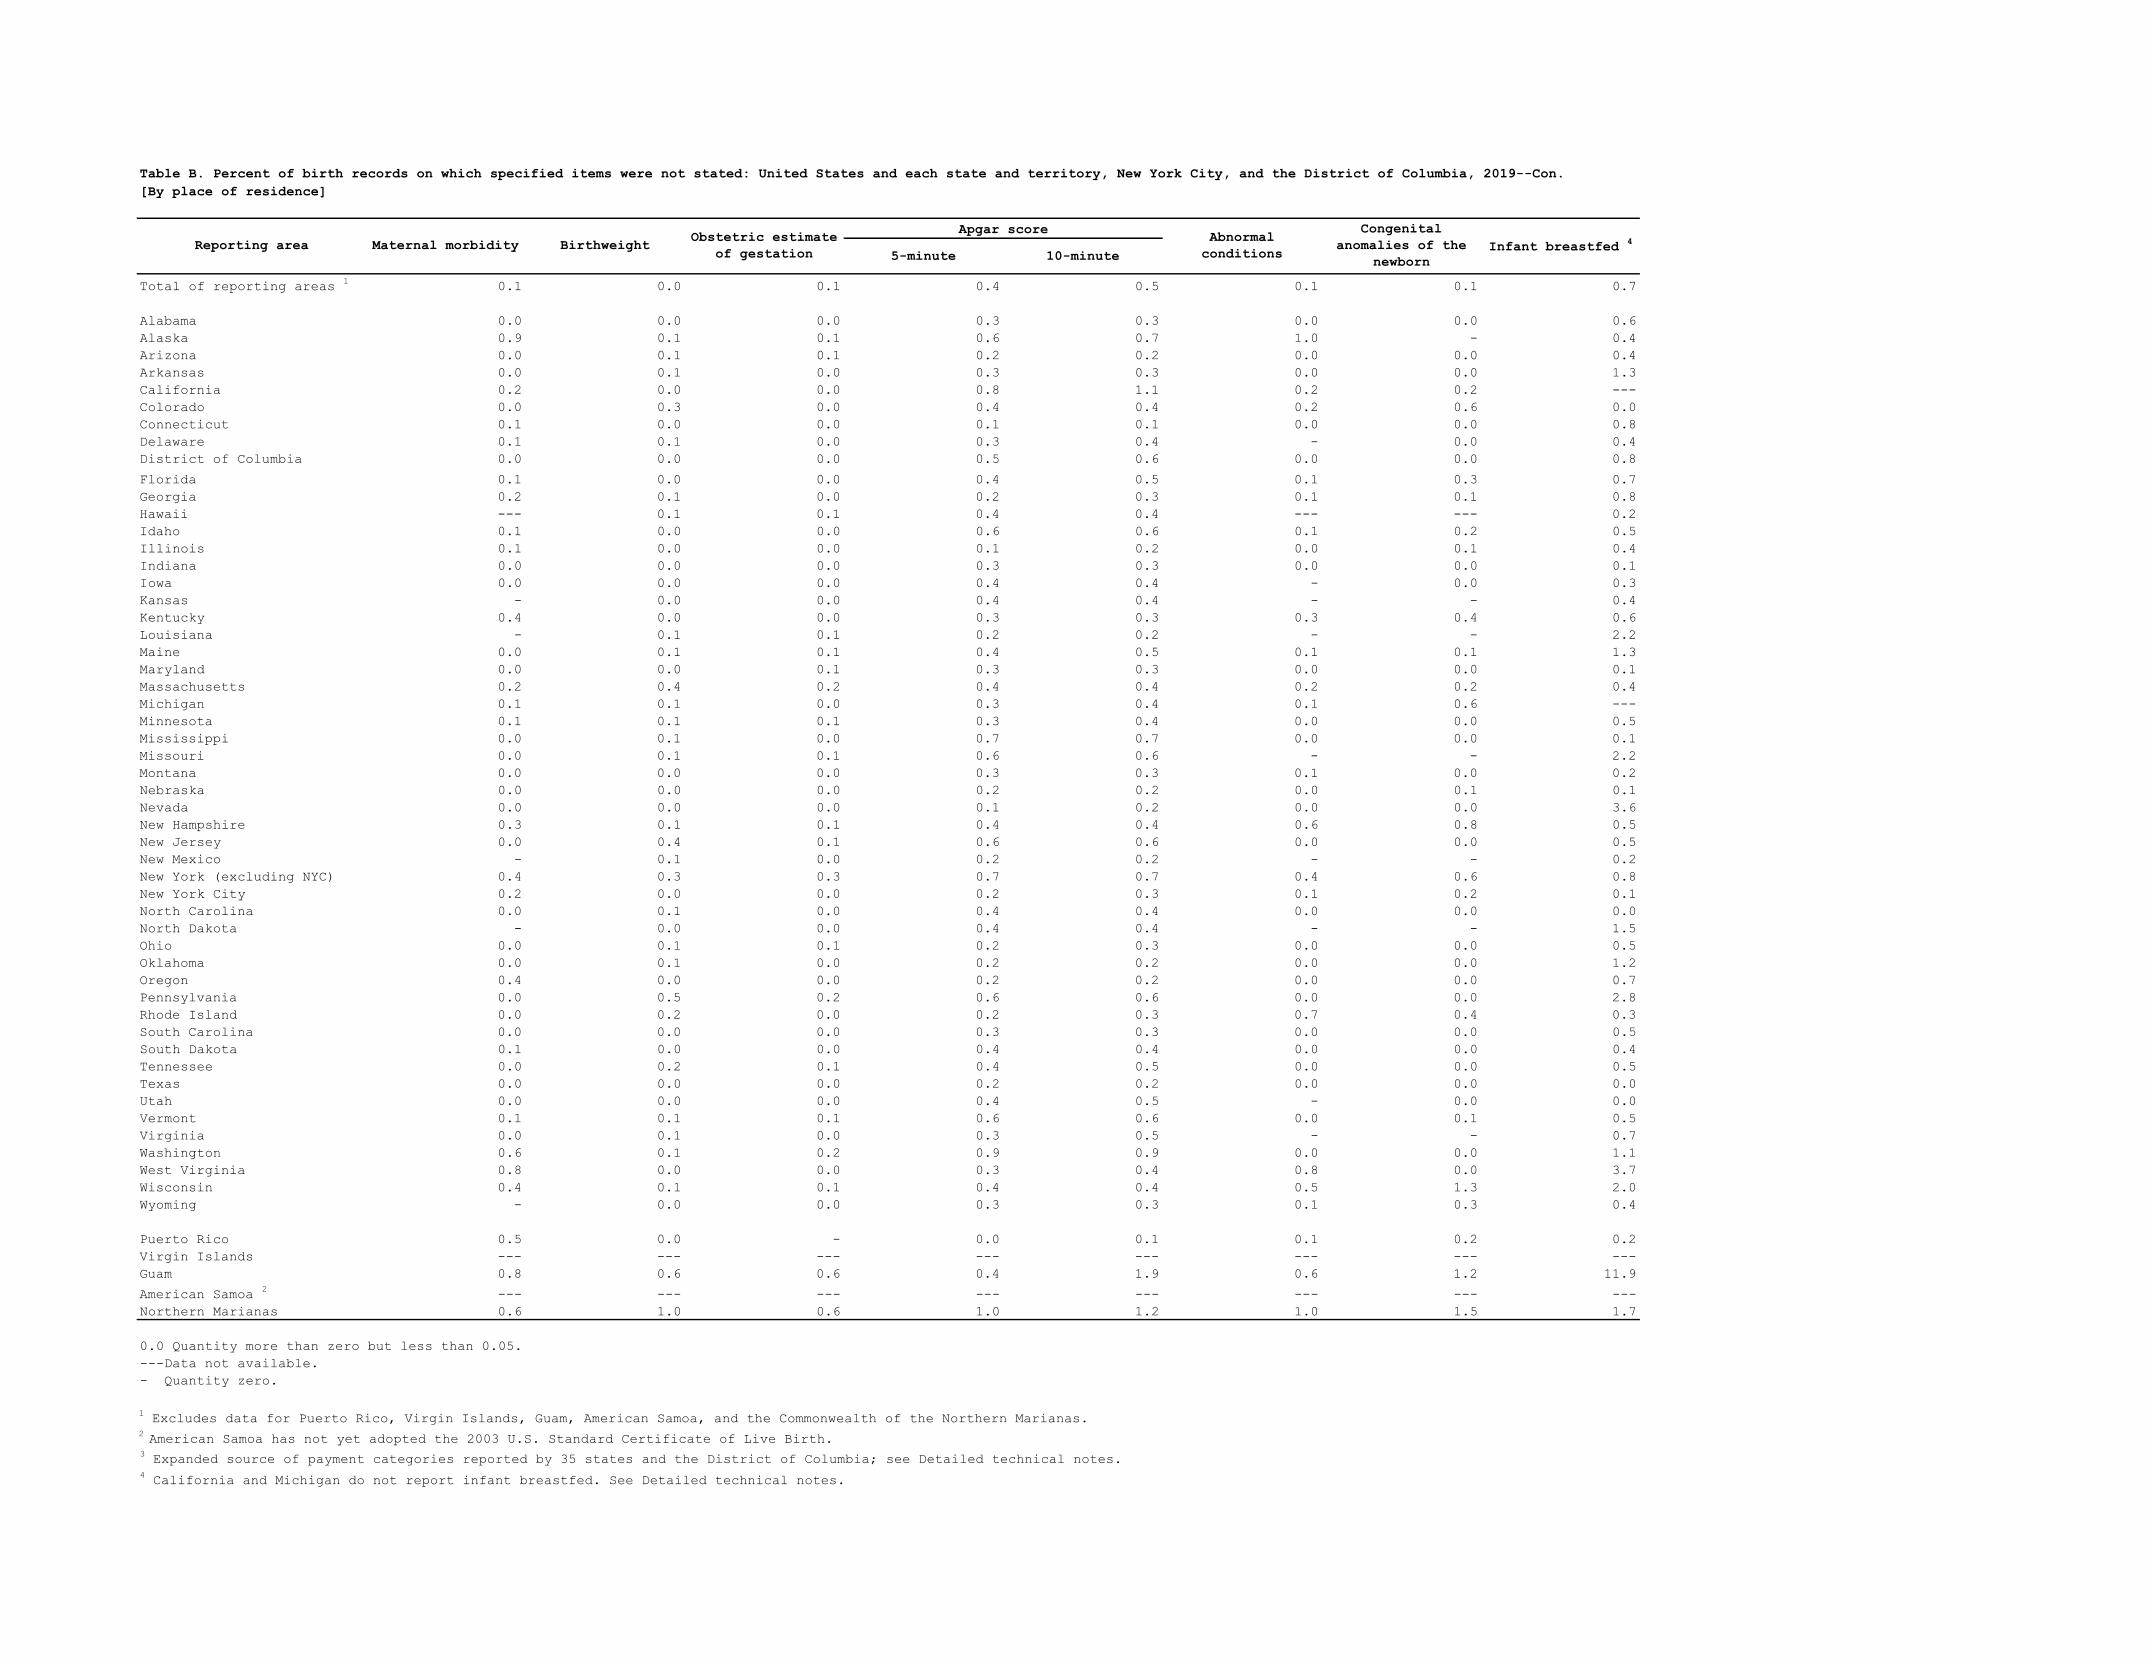
Table B. Percent of birth records on which specified items were not stated: United States and each state and territory, New York City, and the District of Columbia, 2019--Con.
[By place of residence]
Reporting area Maternal morbidity Birthweight Obstetric estimate
of gestation 5-minute 10-minute
Apgar score Abnormal
conditions
Congenital
anomalies of the
newborn
Infant breastfed 4
Total of reporting areas 1
0.1 0.0 0.1 0.4 0.5 0.1 0.1 0.7
Alabama 0.0 0.0 0.0 0.3 0.3 0.0 0.0 0.6
Alaska 0.9 0.1 0.1 0.6 0.7 1.0 - 0.4
Arizona 0.0 0.1 0.1 0.2 0.2 0.0 0.0 0.4
Arkansas 0.0 0.1 0.0 0.3 0.3 0.0 0.0 1.3
California 0.2 0.0 0.0 0.8 1.1 0.2 0.2 ---
Colorado 0.0 0.3 0.0 0.4 0.4 0.2 0.6 0.0
Connecticut 0.1 0.0 0.0 0.1 0.1 0.0 0.0 0.8
Delaware 0.1 0.1 0.0 0.3 0.4 - 0.0 0.4
District of Columbia 0.0 0.0 0.0 0.5 0.6 0.0 0.0 0.8
Florida 0.1 0.0 0.0 0.4 0.5 0.1 0.3 0.7
Georgia 0.2 0.1 0.0 0.2 0.3 0.1 0.1 0.8
Hawaii --- 0.1 0.1 0.4 0.4 --- --- 0.2
Idaho 0.1 0.0 0.0 0.6 0.6 0.1 0.2 0.5
Illinois 0.1 0.0 0.0 0.1 0.2 0.0 0.1 0.4
Indiana 0.0 0.0 0.0 0.3 0.3 0.0 0.0 0.1
Iowa 0.0 0.0 0.0 0.4 0.4 - 0.0 0.3
Kansas - 0.0 0.0 0.4 0.4 - - 0.4
Kentucky 0.4 0.0 0.0 0.3 0.3 0.3 0.4 0.6
Louisiana - 0.1 0.1 0.2 0.2 - - 2.2
Maine 0.0 0.1 0.1 0.4 0.5 0.1 0.1 1.3
Maryland 0.0 0.0 0.1 0.3 0.3 0.0 0.0 0.1
Massachusetts 0.2 0.4 0.2 0.4 0.4 0.2 0.2 0.4
Michigan 0.1 0.1 0.0 0.3 0.4 0.1 0.6 ---
Minnesota 0.1 0.1 0.1 0.3 0.4 0.0 0.0 0.5
Mississippi 0.0 0.1 0.0 0.7 0.7 0.0 0.0 0.1
Missouri 0.0 0.1 0.1 0.6 0.6 - - 2.2
Montana 0.0 0.0 0.0 0.3 0.3 0.1 0.0 0.2
Nebraska 0.0 0.0 0.0 0.2 0.2 0.0 0.1 0.1
Nevada 0.0 0.0 0.0 0.1 0.2 0.0 0.0 3.6
New Hampshire 0.3 0.1 0.1 0.4 0.4 0.6 0.8 0.5
New Jersey 0.0 0.4 0.1 0.6 0.6 0.0 0.0 0.5
New Mexico - 0.1 0.0 0.2 0.2 - - 0.2
New York (excluding NYC) 0.4 0.3 0.3 0.7 0.7 0.4 0.6 0.8
New York City 0.2 0.0 0.0 0.2 0.3 0.1 0.2 0.1
North Carolina 0.0 0.1 0.0 0.4 0.4 0.0 0.0 0.0
North Dakota - 0.0 0.0 0.4 0.4 - - 1.5
Ohio 0.0 0.1 0.1 0.2 0.3 0.0 0.0 0.5
Oklahoma 0.0 0.1 0.0 0.2 0.2 0.0 0.0 1.2
Oregon 0.4 0.0 0.0 0.2 0.2 0.0 0.0 0.7
Pennsylvania 0.0 0.5 0.2 0.6 0.6 0.0 0.0 2.8
Rhode Island 0.0 0.2 0.0 0.2 0.3 0.7 0.4 0.3
South Carolina 0.0 0.0 0.0 0.3 0.3 0.0 0.0 0.5
South Dakota 0.1 0.0 0.0 0.4 0.4 0.0 0.0 0.4
Tennessee 0.0 0.2 0.1 0.4 0.5 0.0 0.0 0.5
Texas 0.0 0.0 0.0 0.2 0.2 0.0 0.0 0.0
Utah 0.0 0.0 0.0 0.4 0.5 - 0.0 0.0
Vermont 0.1 0.1 0.1 0.6 0.6 0.0 0.1 0.5
Virginia 0.0 0.1 0.0 0.3 0.5 - - 0.7
Washington 0.6 0.1 0.2 0.9 0.9 0.0 0.0 1.1
West Virginia 0.8 0.0 0.0 0.3 0.4 0.8 0.0 3.7
Wisconsin 0.4 0.1 0.1 0.4 0.4 0.5 1.3 2.0
Wyoming - 0.0 0.0 0.3 0.3 0.1 0.3 0.4
Puerto Rico 0.5 0.0 - 0.0 0.1 0.1 0.2 0.2
Virgin Islands --- --- --- --- --- --- --- ---
Guam 0.8 0.6 0.6 0.4 1.9 0.6 1.2 11.9
American Samoa 2
--- --- --- --- --- --- --- ---
Northern Marianas 0.6 1.0 0.6 1.0 1.2 1.0 1.5 1.7
0.0 Quantity more than zero but less than 0.05.
---Data not available.
- Quantity zero.
1 Excludes data for Puerto Rico, Virgin Islands, Guam, American Samoa, and the Commonwealth of the Northern Marianas.
2 American Samoa has not yet adopted the 2003 U.S. Standard Certificate of Live Birth.
3 Expanded source of payment categories reported by 35 states and the District of Columbia; see Detailed technical notes.
4 California and Michigan do not report infant breastfed. See Detailed technical notes.

Table 1. Estimated total population, by race and Hispanic origin and specified Hispanic origin group and estimated female population, by age and race and Hispanic origin and specified
Hispanic origin group of woman, and standard errors by age and specified Hispanic origin group: United States, 2019
[Populations estimated as of July 1]
Race and Hispanic origin
Total
population 15-44 years 10-14 years Total 15-17 years
15-19 years
Female population
18-19 years 20-24 years 25-29 years 30-34 years 35-39 years 40-44 years 45-49 years
All races and origins\1 328,239,523 64,325,356 10,180,007 10,308,963 6,109,866 4,199,097 10,568,188 11,504,446 11,076,695 10,852,580 10,014,484 10,312,396
Non-Hispanic, single-race\2
White
Asian
Native Hawaiian or Pacific
Black
American Indian or Alaska
197,309,822 41,147,488 2,434,908
18,905,879 595,908
35,063,576 9,005,247 513,664
4,442,907 135,256
5,099,703 1,410,180
87,343 520,536 20,785
5,374,563 3,172,237 1,429,443 834,783
87,058 51,385 553,165 324,970 20,244 12,098
2,202,326 5,633,574 6,188,431 6,162,490 6,085,206 5,619,312 6,063,475 594,660 1,510,571 1,731,951 1,541,900 1,452,176 1,339,206 1,364,444 35,673 89,556 98,281 86,658 80,235 71,876 72,903
228,195 622,844 792,421 857,685 844,068 772,724 752,726 8,146 20,913 24,749 25,258 24,058 20,034 18,447
Total
Mexican
Hispanic\3 60,572,237 ---
13,573,396 ---
2,607,641 ---
2,471,758 1,486,528 --- ---
985,230 2,359,028 2,374,415 2,172,650 2,167,700 2,027,845 1,894,490
--- --- --- --- --- --- ---
--- --- --- --- --- --- --- --- --- --- --- ---
Puerto Rican --- --- --- --- --- --- --- --- --- --- --- ---
--- --- --- --- --- --- --- --- --- --- --- ---
Cuban --- --- --- --- --- --- --- --- --- --- --- ---
--- --- --- --- --- --- --- --- --- --- --- ---
Dominican --- --- --- --- --- --- --- --- --- --- --- ---
--- --- --- --- --- --- --- --- --- --- --- ---
Other Hispanic\4 --- --- --- --- --- --- --- --- --- --- --- ---
--- --- --- --- --- --- --- --- --- --- --- ---
--- Data not available.
1 Includes population estimates of race and origin groups not shown separately, such as Hispanic single-race white, Hispanic single-race black, and non-Hispanic multiple-race people.
2 Persons of non-Hispanic origin may be of any race. Race categories are consistent with the 1997 Office of Management and Budget (OMB) standards. Single-race is defined as only one race
reported.
3 Includes all persons of Hispanic origin of any race.
4 Includes Central and South American and other and unknown Hispanic.
NOTES: Population count estimates are based on the 2010 census; see "Technical Notes." Population estimates for Mexican, Puerto Rican, Cuban, Central and Other Hispanic, which includes
includes Central and South American and other and unknown Hispanic, are based on the American Community Survey adjusted to resident population control totals (the 2010-based population
estimates for the United States for July 1, 2019). Population estimates for Hispanic total are based on the 2010 census, as of Juy 1, 2019. Population estimates by specified Hispanic origin
in this table may not add to population estimates for total Hispanic. Standard errors are shown in parentheses below each population estimate.
SOURCE: U.S. Census Bureau. See references 51 and 56.
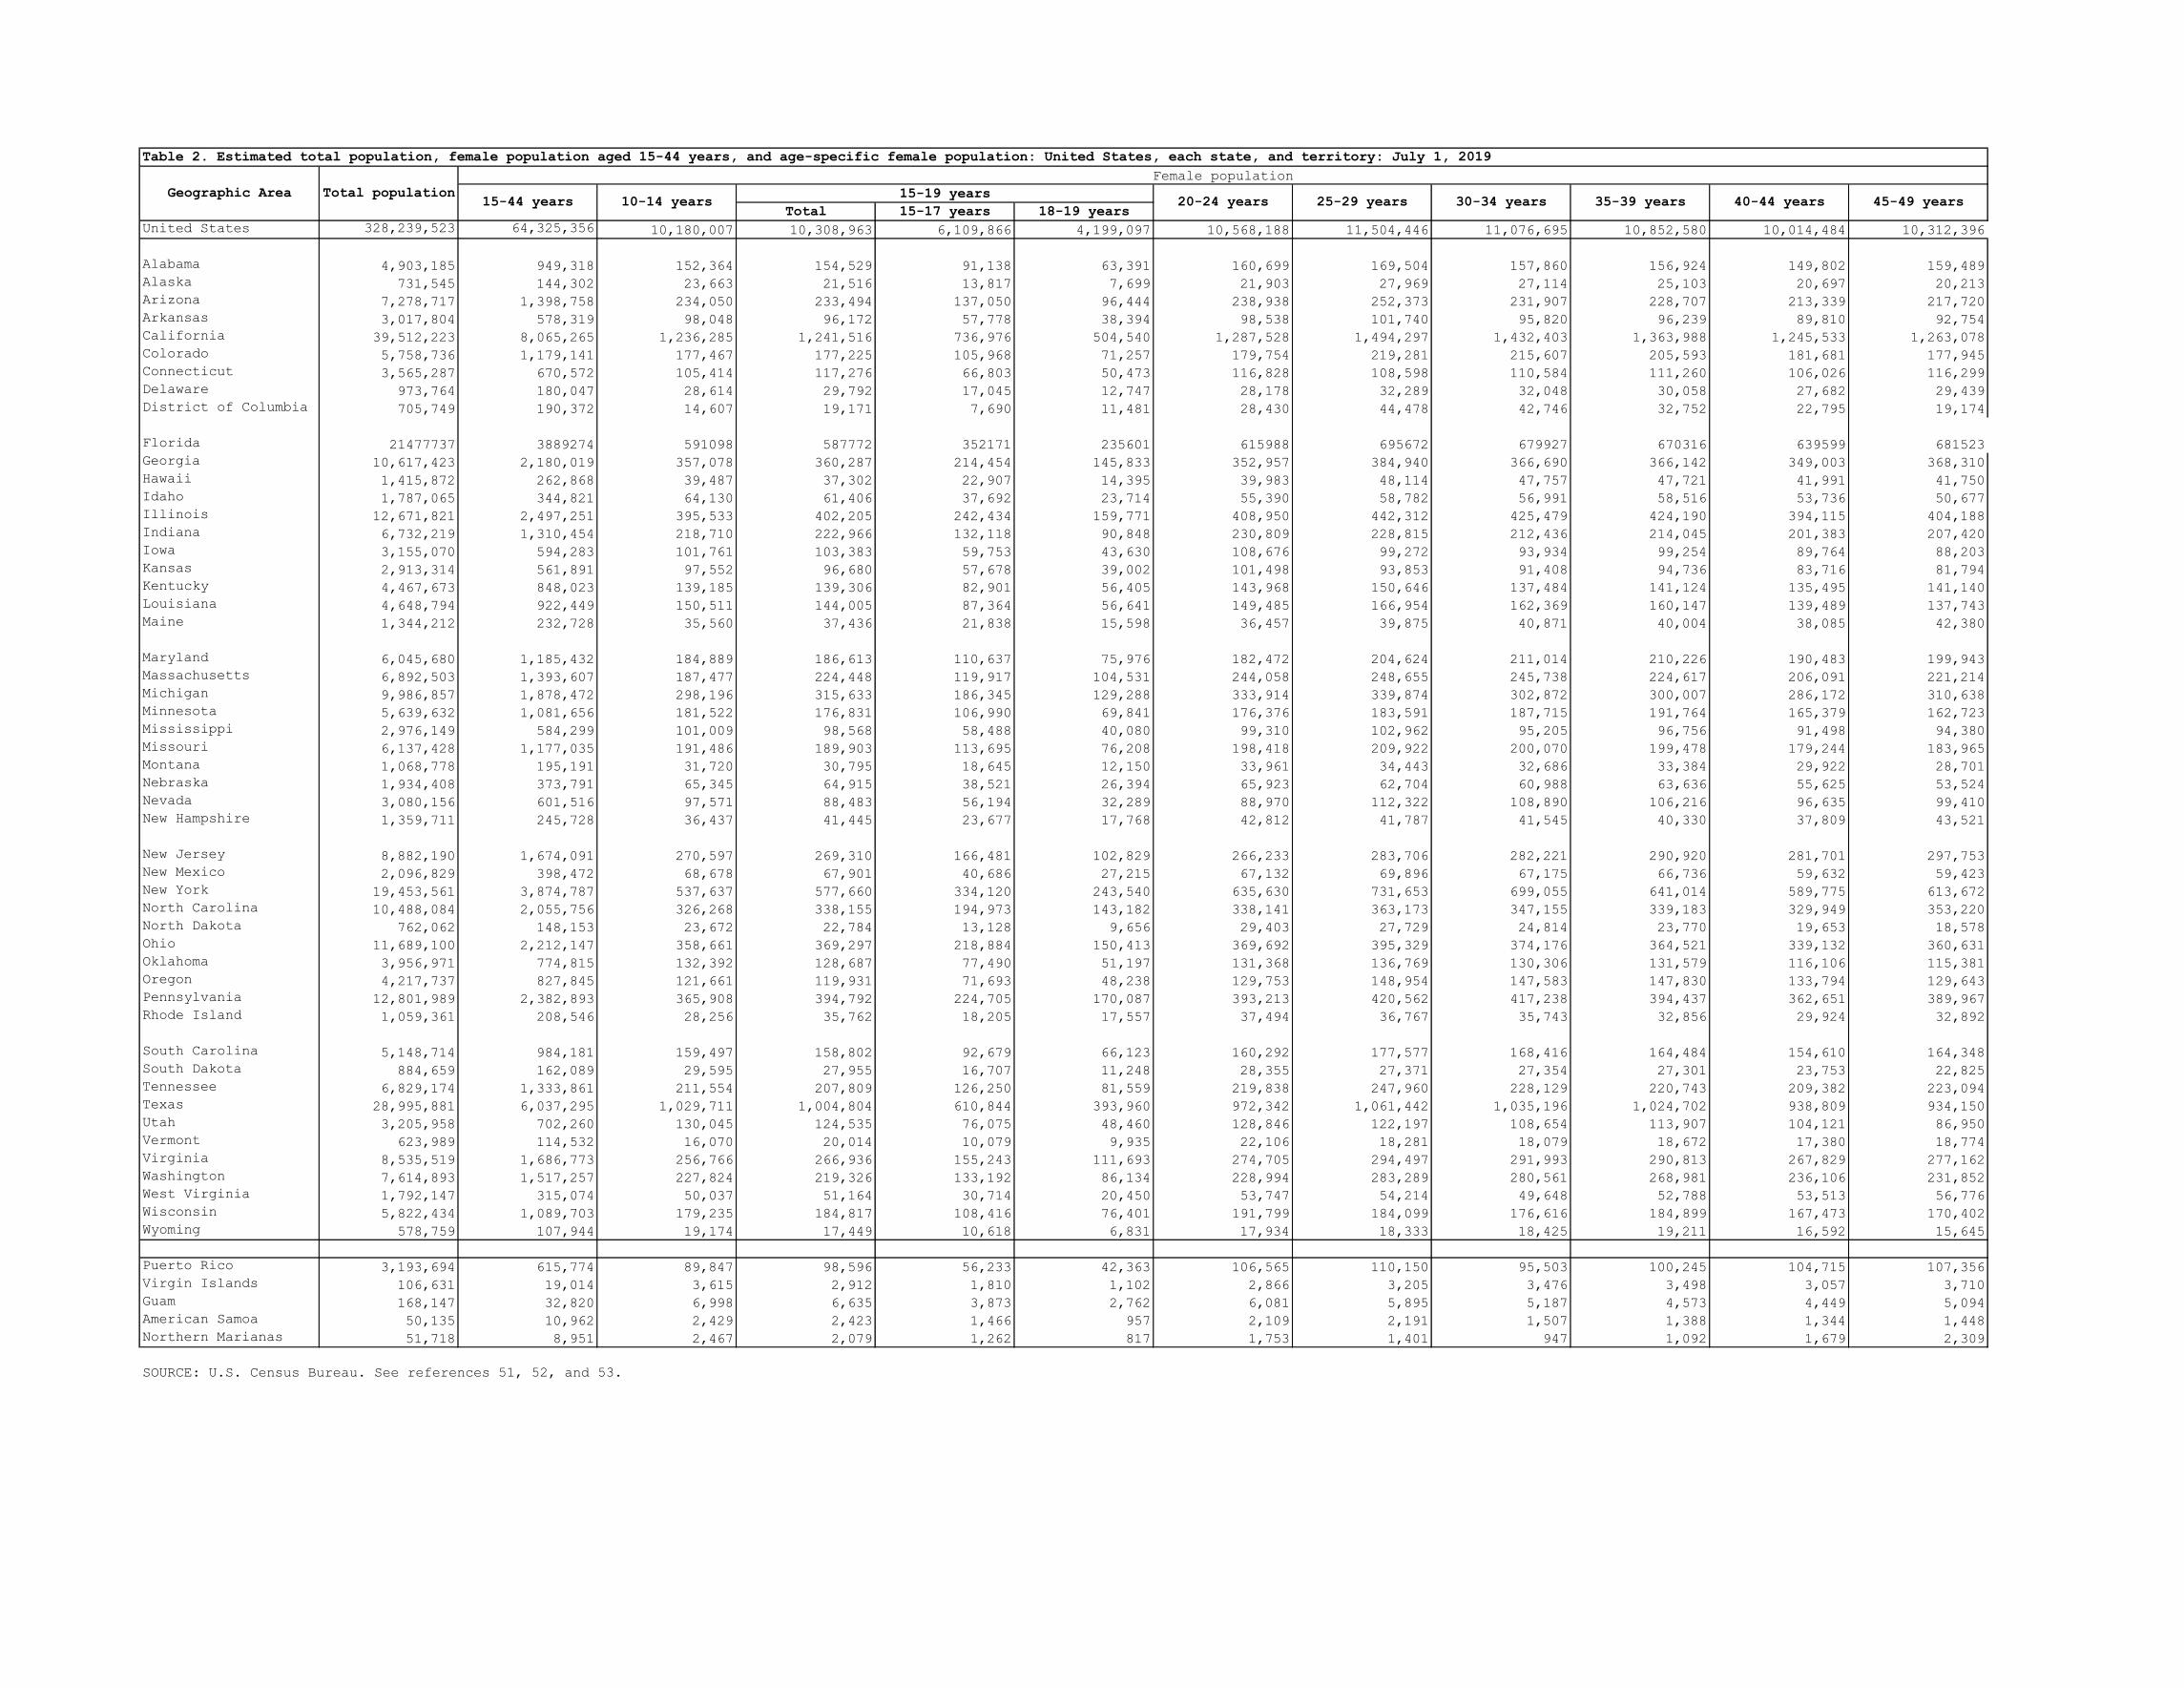
Table 2. Estimated total population, female population aged 15-44 years, and age-specific female population: United States, each state, and territory: July 1, 2019
Geographic Area Total population
Female population
15-44 years 10-14 years 15-19 years
20-24 years 25-29 years 30-34 years 35-39 years 40-44 years 45-49 years Total 15-17 years 18-19 years
United States 328,239,523 64,325,356 10,180,007 10,308,963 6,109,866 4,199,097 10,568,188 11,504,446 11,076,695 10,852,580 10,014,484 10,312,396
Alabama 4,903,185 949,318 152,364 154,529 91,138 63,391 160,699 169,504 157,860 156,924 149,802 159,489
Alaska 731,545 144,302 23,663 21,516 13,817 7,699 21,903 27,969 27,114 25,103 20,697 20,213
Arizona 7,278,717 1,398,758 234,050 233,494 137,050 96,444 238,938 252,373 231,907 228,707 213,339 217,720
Arkansas 3,017,804 578,319 98,048 96,172 57,778 38,394 98,538 101,740 95,820 96,239 89,810 92,754
California 39,512,223 8,065,265 1,236,285 1,241,516 736,976 504,540 1,287,528 1,494,297 1,432,403 1,363,988 1,245,533 1,263,078
Colorado 5,758,736 1,179,141 177,467 177,225 105,968 71,257 179,754 219,281 215,607 205,593 181,681 177,945
Connecticut 3,565,287 670,572 105,414 117,276 66,803 50,473 116,828 108,598 110,584 111,260 106,026 116,299
Delaware 973,764 180,047 28,614 29,792 17,045 12,747 28,178 32,289 32,048 30,058 27,682 29,439
District of Columbia 705,749 190,372 14,607 19,171 7,690 11,481 28,430 44,478 42,746 32,752 22,795 19,174
Florida 21477737 3889274 591098 587772 352171 235601 615988 695672 679927 670316 639599 681523
Georgia 10,617,423 2,180,019 357,078 360,287 214,454 145,833 352,957 384,940 366,690 366,142 349,003 368,310
Hawaii 1,415,872 262,868 39,487 37,302 22,907 14,395 39,983 48,114 47,757 47,721 41,991 41,750
Idaho 1,787,065 344,821 64,130 61,406 37,692 23,714 55,390 58,782 56,991 58,516 53,736 50,677
Illinois 12,671,821 2,497,251 395,533 402,205 242,434 159,771 408,950 442,312 425,479 424,190 394,115 404,188
Indiana 6,732,219 1,310,454 218,710 222,966 132,118 90,848 230,809 228,815 212,436 214,045 201,383 207,420
Iowa 3,155,070 594,283 101,761 103,383 59,753 43,630 108,676 99,272 93,934 99,254 89,764 88,203
Kansas 2,913,314 561,891 97,552 96,680 57,678 39,002 101,498 93,853 91,408 94,736 83,716 81,794
Kentucky 4,467,673 848,023 139,185 139,306 82,901 56,405 143,968 150,646 137,484 141,124 135,495 141,140
Louisiana 4,648,794 922,449 150,511 144,005 87,364 56,641 149,485 166,954 162,369 160,147 139,489 137,743
Maine 1,344,212 232,728 35,560 37,436 21,838 15,598 36,457 39,875 40,871 40,004 38,085 42,380
Maryland 6,045,680 1,185,432 184,889 186,613 110,637 75,976 182,472 204,624 211,014 210,226 190,483 199,943
Massachusetts 6,892,503 1,393,607 187,477 224,448 119,917 104,531 244,058 248,655 245,738 224,617 206,091 221,214
Michigan 9,986,857 1,878,472 298,196 315,633 186,345 129,288 333,914 339,874 302,872 300,007 286,172 310,638
Minnesota 5,639,632 1,081,656 181,522 176,831 106,990 69,841 176,376 183,591 187,715 191,764 165,379 162,723
Mississippi 2,976,149 584,299 101,009 98,568 58,488 40,080 99,310 102,962 95,205 96,756 91,498 94,380
Missouri 6,137,428 1,177,035 191,486 189,903 113,695 76,208 198,418 209,922 200,070 199,478 179,244 183,965
Montana 1,068,778 195,191 31,720 30,795 18,645 12,150 33,961 34,443 32,686 33,384 29,922 28,701
Nebraska 1,934,408 373,791 65,345 64,915 38,521 26,394 65,923 62,704 60,988 63,636 55,625 53,524
Nevada 3,080,156 601,516 97,571 88,483 56,194 32,289 88,970 112,322 108,890 106,216 96,635 99,410
New Hampshire 1,359,711 245,728 36,437 41,445 23,677 17,768 42,812 41,787 41,545 40,330 37,809 43,521
New Jersey 8,882,190 1,674,091 270,597 269,310 166,481 102,829 266,233 283,706 282,221 290,920 281,701 297,753
New Mexico 2,096,829 398,472 68,678 67,901 40,686 27,215 67,132 69,896 67,175 66,736 59,632 59,423
New York 19,453,561 3,874,787 537,637 577,660 334,120 243,540 635,630 731,653 699,055 641,014 589,775 613,672
North Carolina 10,488,084 2,055,756 326,268 338,155 194,973 143,182 338,141 363,173 347,155 339,183 329,949 353,220
North Dakota 762,062 148,153 23,672 22,784 13,128 9,656 29,403 27,729 24,814 23,770 19,653 18,578
Ohio 11,689,100 2,212,147 358,661 369,297 218,884 150,413 369,692 395,329 374,176 364,521 339,132 360,631
Oklahoma 3,956,971 774,815 132,392 128,687 77,490 51,197 131,368 136,769 130,306 131,579 116,106 115,381
Oregon 4,217,737 827,845 121,661 119,931 71,693 48,238 129,753 148,954 147,583 147,830 133,794 129,643
Pennsylvania 12,801,989 2,382,893 365,908 394,792 224,705 170,087 393,213 420,562 417,238 394,437 362,651 389,967
Rhode Island 1,059,361 208,546 28,256 35,762 18,205 17,557 37,494 36,767 35,743 32,856 29,924 32,892
South Carolina 5,148,714 984,181 159,497 158,802 92,679 66,123 160,292 177,577 168,416 164,484 154,610 164,348
South Dakota 884,659 162,089 29,595 27,955 16,707 11,248 28,355 27,371 27,354 27,301 23,753 22,825
Tennessee 6,829,174 1,333,861 211,554 207,809 126,250 81,559 219,838 247,960 228,129 220,743 209,382 223,094
Texas 28,995,881 6,037,295 1,029,711 1,004,804 610,844 393,960 972,342 1,061,442 1,035,196 1,024,702 938,809 934,150
Utah 3,205,958 702,260 130,045 124,535 76,075 48,460 128,846 122,197 108,654 113,907 104,121 86,950
Vermont 623,989 114,532 16,070 20,014 10,079 9,935 22,106 18,281 18,079 18,672 17,380 18,774
Virginia 8,535,519 1,686,773 256,766 266,936 155,243 111,693 274,705 294,497 291,993 290,813 267,829 277,162
Washington 7,614,893 1,517,257 227,824 219,326 133,192 86,134 228,994 283,289 280,561 268,981 236,106 231,852
West Virginia 1,792,147 315,074 50,037 51,164 30,714 20,450 53,747 54,214 49,648 52,788 53,513 56,776
Wisconsin 5,822,434 1,089,703 179,235 184,817 108,416 76,401 191,799 184,099 176,616 184,899 167,473 170,402
Wyoming 578,759 107,944 19,174 17,449 10,618 6,831 17,934 18,333 18,425 19,211 16,592 15,645
Puerto Rico 3,193,694 615,774 89,847 98,596 56,233 42,363 106,565 110,150 95,503 100,245 104,715 107,356
Virgin Islands 106,631 19,014 3,615 2,912 1,810 1,102 2,866 3,205 3,476 3,498 3,057 3,710
Guam 168,147 32,820 6,998 6,635 3,873 2,762 6,081 5,895 5,187 4,573 4,449 5,094
American Samoa 50,135 10,962 2,429 2,423 1,466 957 2,109 2,191 1,507 1,388 1,344 1,448
Northern Marianas 51,718 8,951 2,467 2,079 1,262 817 1,753 1,401 947 1,092 1,679 2,309
SOURCE: U.S. Census Bureau. See references 51, 52, and 53.

Table 3. Population of the United
States, 2010-2019
[Population enumerated as of April 1
for 2010 and estimated as of July 1
for all other years]
Year
United States
Population
including
Armed Forces
abroad
Population
residing in
area
2019 328,475,998 328,239,523
2018 327,403,909 327,167,434
2017 325,939,372 325,719,178
2016 323,348,770 323,127,513
2015 321,654,360 321,418,820
2014 319,133,003 318,857,056
2013 316,432,767 316,128,839
2012 314,250,437 313,914,040
2011 312,008,762 311,591,917
2010 309,178,489 308,745,538
SOURCE: Published data from the U.S.
Census Bureau; see reference 67.

Documentation Table 1. Number and percentage of live births by race and Hispanic origin of mother: United
States, 2019
Number Percentage Race
Total Non-Hispanic Total\1 Non-Hispanic
All races\2 3,747,540 2,825,286 100.0 100.0
One race 3,646,267 2,740,976 97.3 97.0
White 2,744,570 1,915,912 73.2 67.8
Black 600,281 548,075 16.0 19.4
American Indian and Alaska Native (AIAN) 36,381 28,450 1.0 1.0
Asian 252,099 238,769 6.7 8.5
Native Hawaiian and Other Pacific Islander (NHOPI) 12,936 9,770 0.3 0.3
More than one race 101,273 84,310 2.7 3.0
Two races 91,844 77,067 2.5 2.7
Black and White 42,299 35,570 1.1 1.3
Black and AIAN 3,138 2,637 0.1 0.1
Black and Asian 2,576 2,340 0.1 0.1
Black and NHOPI 623 545 0.0 0.0
AIAN and White 17,138 13,507 0.5 0.5
AIAN and Asian 437 335 0.0 0.0
AIAN and NHOPI 126 103 0.0 0.0
Asian and White 20,470 17,834 0.5 0.6
Asian and NHOPI 2,168 2,029 0.1 0.1
NHOPI and White 2,869 2,167 0.1 0.1
Three races 8,954 6,945 0.2 0.2
Black, AIAN and White 3,153 2,538 0.1 0.1
Black AIAN and Asian 121 107 0.0 0.0
Black, AIAN and NHOPI 43 36 0.0 0.0
Black, Asian and White 1,018 832 0.0 0.0
Black, Asian and NHOPI 140 123 0.0 0.0
Black, NHOPI, and White 208 165 0.0 0.0
AIAN, Asian and White 556 394 0.0 0.0
AIAN, NHOPI and White 131 82 0.0 0.0
AIAN, Asian and NHOPI 43 28 0.0 0.0
Asian, NHOPI and White 3,541 2,640 0.1 0.1
Four races 445 279 0.0 0.0
Black, AIAN, Asian and White 143 108 0.0 0.0
Black, AIAN, Asian, and NHOPI 12 8 * *
Black, AIAN, NHOPI and White 28 15 0.0 *
Black, Asian, NHOPI and White 75 54 0.0 0.0
AIAN, Asian, NHOPI and White 187 94 0.0 0.0
Five races
Black, AIAN, Asian, NHOPI and White 30 19 0.0 *
0.0 Quantity more than zero but less than 0.5.
* Estimate does not meet NCHS standards of reliability.
\1 Includes births to race and origin groups not shown separately, such as Hispanic, single-race white,
Hispanic, single-race black, non-Hispanic, multiple-race women, and births with origin not stated.
\2 Race and Hispanic origin are reported separately on birth certificates. Persons of Hispanic origin may be of
any race. In this table, non-Hispanic women are classified by race. Race categories are consistent with the
1997 Office of Management and Budget standards.
NOTE: Race categories are consistent with the 1997 Office of Management and Budget standards.


![Natality aNd Biopolitics iN HaNNaH areNdt - CONICYT · NATALITY AND BIOPOLITICS IN HANNAH ARENDT 139 “factical Dasein exists natively [das faktische Dasein existiert gebürtig]](https://static.documents.pub/doc/80x56/5b3caf2f7f8b9a5e1f8d8e0c/natality-and-biopolitics-in-hannah-arendt-conicyt-natality-and-biopolitics.jpg)


