Research ArticleUser Knowledge, Data Modelling, and Visualization:Handling through the Fuzzy Logic-Based Approach
Xiaoqun Liao,1 Shah Nazir ,2 Yangbin Zhou ,3 Muhammad Shafiq,4 and Xuelin Qi3
1Information and Network Center, Xi’an University of Science and DSTechnology, Xi’an 710054, China2Department of Computer Science, University of Swabi, Swabi, Pakistan3State Grid Tibet Electric Power Co., Ltd, Lhasa, 850000, China4Cyberspace Institute of Advance Technology, Guangzhou University, Guangzhou, China
Correspondence should be addressed to Yangbin Zhou; [email protected]
Received 9 October 2020; Revised 11 November 2020; Accepted 16 November 2020; Published 26 February 2021
In modern day technology, the level of knowledge is increasing day by day. .is increase is in terms of volume, velocity, andvariety. Understanding of such knowledge is a dire need of an individual to extract meaningful insight from it. With the ad-vancement in computer and image-based technologies, visualization becomes one of the most significant platforms to extract,interpret, and communicate information. In data modelling, visualization is the process of extracting knowledge to reveal thedetail data structure and process of data. .e proposed study aim is to know about the user knowledge, data modelling, andvisualization by handling through the fuzzy logic-based approach. .e experimental setup is validated through the data usermodelling dataset available in the UCI web repository..e results show that the model is effective and efficient in situations whereuncertainty and complexity arise.
1. Introduction
With the development of modern day technologies, userknowledge is increasing day by day. Users are trying tocapture the essential information from the domainknowledge which is large in volume. Capturing the im-portant information is toward the success for smoothfunctionality of user knowledge. Data exist in different formssuch as structured and unstructured. .e big data are thedata whose scale, diversity, and complexity need new al-gorithms, structures, techniques, and analytics for themanagements and visualizations and to pull out hiddeninformation [1]. According to IDC [2], in late 2011, about1.8 ZB of data was created as of that year. Worldwide,electronic data of approximately 1.2 ZB (1021) are generatedper year by different sources [3]. By 2020, 40 ZB data isexpected [4].
Visual contexts are made from the visualization of userknowledge and data to translate the information through
graphs or maps for making data easier for humans. In vi-sualization, patterns are identified from a large bulk of dataand are plotted through information visualization, graphics,and statistical graphics. Data visualization is one of theprocesses of data science in which data are collected,modelled, and processed, so the visualization should be inorder to draw conclusions from the data. Visualization ofdata has importance in every field of life. It can be used inteaching, healthcare, artificial intelligence, big data, andmany others to share the extracted information with thestockholders.
Knowledge, data, and information are widely used invisualization in interrelated perspectives. Visualization in-dicates diverse stages of understanding and abstraction.Visualization aim is to gain meaningful insights from thedata [5]. Advancements in visualization bring more venturereporting.
.rough data visualization, one can interact with dataand go for analysis. Several benefits can be gained from
HindawiComplexityVolume 2021, Article ID 6629086, 14 pageshttps://doi.org/10.1155/2021/6629086
visualization of data, such as efficient way to communicate,concrete, and abstract the message and innovative ap-proaches for scientific and engineering purposes. Visuali-zation of information is “the graphical presentation ofabstract data” which “attempts to reduce the time and themental effort users need to analyze large datasets.” [6]
.e contribution of the proposed research is to knowabout the user knowledge, data modelling, and visualizationby handling with applications of the fuzzy logic-based ap-proach. .e experimental setup of the proposed research isvalidated through the data user modelling dataset availablein the UCI web repository [7]. .e following are the keyconcepts of the proposed research:
(i) To know about the user knowledge, data modelling,and visualization
(ii) To use the fuzzy logic-based approach for handlinguser knowledge, data modelling, and visualization
(iii) To visualize the dataset in order to get meaningfulinsights
(iv) To validate the work by using the “data usermodelling dataset”
.e organization of the paper is as follows: Section 2represents the related work regarding user knowledge, datamodelling, and visualization with different literature studies.Section 3 shows the research method and modelling of theproposed study with the detail of visualization of the dataset.Section 4 discusses the results and discussion section of thepaper. .e paper is concluded in Section 5.
2. Related Work
Different approaches, tools, and techniques are used inpractice for user knowledge, data modelling, and visu-alization. Sahu and Dwivedi [8] proposed an approach ofknowledge transfer by the domain-independent use latentfactor for cross-domain recommender systems. .emethod used tr-factorization. .e authors in [9] studiedthe usage of media effects in online commentaries oncreating knowledge. .e user groups were divided intothree categories: passive participants, active participants,and bystander. .eir experimental results revealed thatthe active participants largely tend to use tablet PC andsmartphones for the creation of knowledge in the onlinespace. Flowers and Meyer [10] focused on the userknowledge value for entrepreneurs and tackled the gap inthe literature associated to the activities of entrepreneursand user knowledge in the digital services. .e frameworkof Innovation Opportunity Space was proposed and ap-plied on a UK-based mobile telephony supplier Giffgafffor the issues faced by the user knowledge application todigital services. Constant [11] extracted important in-sights from the crystal’s geometry and physical propertiesfor the creation of new structuring according to the
methodology of knowledge-visualization. Desimoni andPo [12] presented the analysis of the state-of-the-art toolsfor the visualization of linked data. Full list of 77 linkeddata visualization tool in the previous research and in-tegrating new tools published recently online. Based onusability and their features, the visualization tools arecompared and described.
Huang et al. [13] explored the cognitive approach forfollowing the user-centred process in visualization graphs.A graph-based visualization model was proposed which isa two-stage conceptualized assessment cycle. Silva et al.[14] proposed a solution of visual analytics based on theuse of several coordinate views for the description ofdiverse aspects of ontology and the technique of degree ofinterest use for reduction of complexity in the visualrepresentation of ontology. Yu and Shi [15] presented amini survey consisting of the user-based taxonomy thatconverts the works of the state of the art in the field. Luo[16] investigated how cognitive style, task difficulty, andspatial ability affect choice and preference of the visual-ization format and how the visualization selected affectsthe confidence and decision accuracy. Gebremeskel andBiazen [17] designed a system which is able to analyze andhandle large-scale data. .e authors in [18] presentedTrajAnalytics, open-source software, for modelling,transforming, and visualizing the urban trajectory data forthe study of urban and transportation. .e approachallows practitioners to understand the data of the pop-ulation mobility and find out knowledge. A conceptualmodel for data is presented which incorporates thegeostructure with trajectory data with the help of differentaccess queries of data.
Rojas and Villegas presented an approach of repre-sentation and scheme of investigative visualization for thedecision tree in the knowledge discovery database processfor data mining [19]. Macek and Atzmueller [20] pre-sented a new concept of visualization for the user historyinteractions. Association rules are derived and visualizedthrough heatmaps. .e impact of the approach is dem-onstrated by real-world examples of data such as Twitterdump of 2009. Giunchiglia et al. [21] proposed the SemUItool-based solution as the multitiered method consists ofthe (a) semantic layer which incorporates data throughthe notion of the entity of the real world and groups thembased on their differences and similarities and (b) layer ofvisualization which concurrently shows several viewsbased on entity properties. .e authors in [22] presentedan approach of visual analytics for the visual data miningand interactive machine learning. In the approach,techniques of multidimensional data visualization areapplied for the facilitation of user interactions with ma-chine learning and data mining process. Rafi [23] pro-posed a multidimensional interface for adopting theresource space model and presented its advantages in theproperty letting application. .e authors in [24] presented
2 Complexity
a methodology for exploiting visual language CoDe basedon the logic paradigm. CoDe gives the structure for or-ganizing visualization by the CoDe model and representsthe relationships between items of the informationgraphically. .e authors in [25] proposed a model ofvisual analytic knowledge generation to tie differentframeworks.
3. Research Methodology
.e following sections briefly explain the methodologysection of the proposed research.
3.1. Library-Based Search to Show the Status of the ExistingResearch. Different libraries were searched for identifyingrelevant information regarding the user knowledge, datamodelling, and visualization. .e purpose was to identifyinformation such as the number of publications in thegiven year, publication topics, publication disciplines,publication title, and type of publications. For the searchprocess, famous libraries such as IEEE, ScienceDirect,Springer, Tailor & Francis, Wiley online library, andMDPI were searched for showing the relevant informa-tion. .is information was presented in the form ofdifferent figures. Figure 1 represents the type of publi-cations in the IEEE library.
Figure 2 represents the conference locations where theconferences were held.
Figure 3 represents the topics of publications along withthe total number of publications.
Figure 4 represents the publication years and the numberin the ScienceDirect library.
Figure 5 represents the article types with the publicationnumber.
Figure 6 represents the publication title with the totalnumber of publications.
Figure 7 represents the article types along with the papernumber in the Springer library.
Figure 8 represents the content types along with the totalnumber of publications.
Figure 9 represents the publication topic with thenumber of papers.
Figure 10 represents the number of publications pub-lished in the given languages.
Figure 11 represents the discipline along with thenumber of publications in the Tailor & Francis library.
Figure 12 represents the discipline along with thenumber of publications in the Wiley online library.
Figure 13 represents the discipline of publication in theMDPI library.
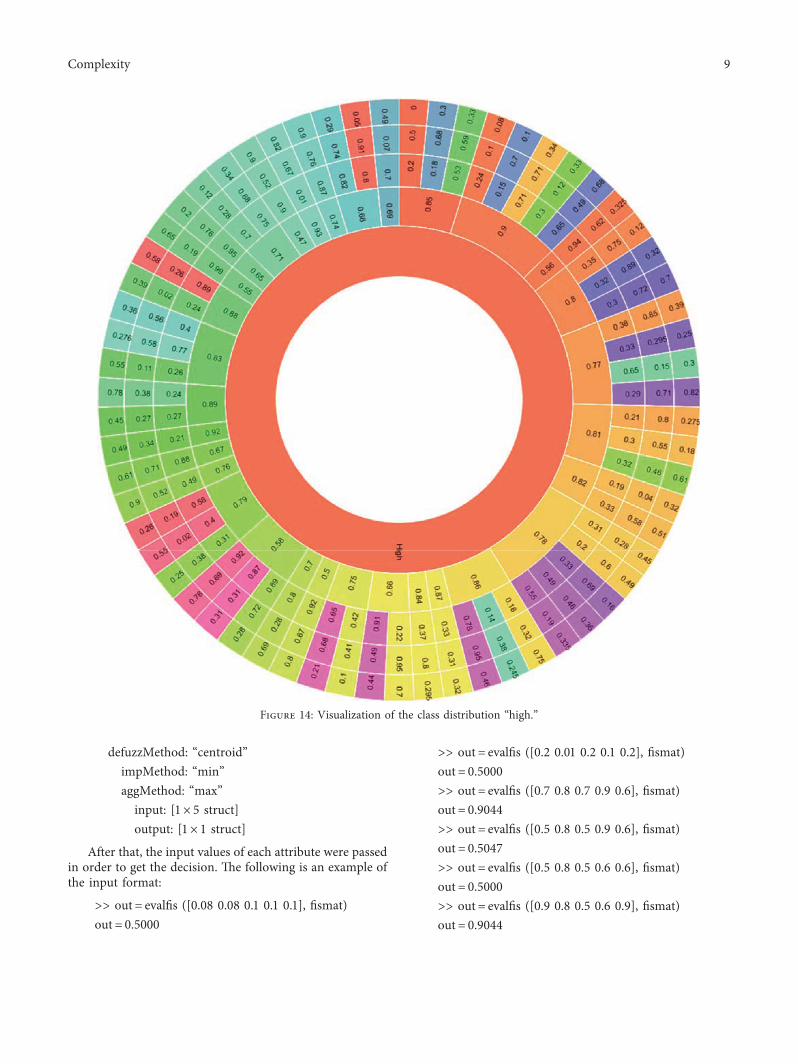
3.2. Visualization of the Dataset. .e purpose of userknowledge and visualization is to extract meaningfulinsights from the knowledge and present it in an orga-nized form to be easily understood and analysed. .e
experimental setup of the proposed research is validatedthrough the data user modelling dataset available in theUCI web repository [7]. Visualization of the class dis-tribution of the dataset was done to plot each class whichis very low, low, middle, and high. .e purpose of thisvisualization is to show the dataset which is easily un-derstandable to the reader as compared to study the actualdataset. Figure 14 represents the visualization of classdistribution “high”.
Figure 15 represents the visualization of class distribu-tion “very_low.”
Figure 16 represents the visualization of class distribu-tion “middle.”
Figure 17 represents the visualization of class distribu-tion “low.”
3.3. User Knowledge, Data Modelling, and Visualizationthrough the Fuzzy Logic. Visualization is to give a mean-ingful structure to huge data and to extract the significantinformation from them. With the help of visualization,information can be mined for the extraction of mean-ingful insights for the analysis under consideration. .eimportant terminologies used for visualization are shownin Figure 18.
.e fuzzy logic (FL) is a tool used to solve a situation ofvagueness and uncertainty. It was developed by A. Z. Loftiin 1965 [26, 27]. FL has several applications in differentfields of real life such as in control system, washingmachines, transmission system of cars, vacuum cleaner,and software system [28–32]. .e fuzzy inference systemused in the proposed research makes it simple to structurethe facts and provide a way out for the vague information.For more details regarding the fuzzy concept, refer Zadeh[26].
.e concept of fuzzy logic was used for user knowledge,data modelling, and visualization of the proposed study.Initially, different inputs STG, SCG, STR, LPR, PEG wereplotted with the membership functions (mf) low, medium,and high. .e output UNS was plotted with the mf very low,low, medium, high, and very high. Figure 19 shows theinput, output, and mf plotting process of the proposedmodel.
After plotting the inputs, output, and mf, rules weremade to model the proposed system of user knowledge, datamodelling, and visualization. Figure 20 shows the rule editorof the proposed system.
Different rules were designed from the mf. Some of theserules are given in the following:
(1) If (STG is Medium) and (SCG is Low) and (STR isLow) and (LPR is Low) and (PEG is Low) then (UNSis Very_low) (0.1)
(2) If (STG is Medium) and (SCG is Medium) and (STRis Low) and (LPR is Low) and (PEG is Low) then(UNS is Very_low) (0.2)
Figure 5: Article types with the total number of publications.
0
1000
2000
3000
4000
5000
6000
7000
Num
ber o
f pap
ers
2012 2014 2016 2018 2020 20222010Year
Figure 4: Years and the number of publications.
Procedia ComputerScience, 1,148
Expertsystems with
applications 842
Procedia CIRP,641
Future Generationcomputer systems, 513
Automation inConstruction, 483
Journal ofCleaner Production,
429
Journal ofSystems andSo�ware, 418
Neurocomputing, 409
Knowledge-Based Systems, 407 Computers in
Human Behavior, 405
Figure 6: Publication title with the total number of publications.
Complexity 5
(3) If (STG is Medium) and (SCG is Medium) and (STRis Medium) and (LPR is High) and (PEG is High)then (UNS is Very_high) (0.8)
(4) If (STG is High) and (SCG is Low) and (STR is Low)and (LPR is High) and (PEG is High) then (UNS isHigh) (0.61)
(5) If (STG is Low) and (SCG is Low) and (STR is High)and (LPR is High) and (PEG is High) then (UNS isHigh) (0.7)
(6) If (STG is Medium) and (SCG is Medium) and (STRis Medium) and (LPR is High) and (PEG is High)then (UNS is High) (0.8)
.e obtained model from the designing of rules is shownin Figure 21.
4. Results and Discussion
.e fuzzy inference system was designed for handling userknowledge, data modelling, and visualization. .e purposeof this study was to plot and visualize the user knowledgeand data modelling and to present the concept of visuali-zation to present the data in a meaningful form for thereader. .e model was designed from different inputs, mf,and output. Model description of the designed model isgiven in Table 1.
Figure 14: Visualization of the class distribution “high.”
Complexity 9
Figure 15: Visualization of class distribution “very_low.”
Figure 16: Visualization of class distribution “middle.”
10 Complexity
Figure 17: Visualization of class distribution “low.”
Figure 18: Common terminologies used for visualization.
Complexity 11
Figure 19: Input and output plotting process of the proposed model along with the mf.
Figure 20: Rule editor of the proposed system.
12 Complexity
5. Conclusion
.e data and information are the dire needs of modernday technology and real life. Both data and informationare rapidly increasing with the passage of time. It becomesvery difficult to understand all the things at the same time..e user needs meaningful extraction from the knowledgeof data and information. Visualization plays an importantrole to extract meaningful information and insights fromit. .e proposed study is an endeavour toward the userknowledge, data modelling, and visualization by handlingthrough the fuzzy logic-based approach. Fuzzy logic dealswith uncertainty and vagueness when they arise in thedata. Experimental setup of the proposed research isvalidated through the data user modelling dataset avail-able in the UCI web repository. Model of the fuzzy in-ference system was designed based on the inputs, mf,output, and fuzzy rules. .e results show that the model iseffective and efficient in situations where uncertainty andcomplexity arise.
Data Availability
No data were used to support this study.
Conflicts of Interest
.e authors declare that there are no conflicts of interestregarding the publication of this paper.
Acknowledgments
.is research was supported by Science and TechnologyProject of State Grid Xizang Electric Power Co., Ltd(SGXZJY00JHJS2000007) (Influence of Energy StorageTechnology Application on Power Grid) and Science andTechnology Project of State Grid Zizang Electric Power Co.,Ltd (SGXZJY00JHJS2000008) (Research Technology Serviceof Multi-Energy Complementary DemonstrationApplication).
References
[1] R. Bellazzi, “Big data and biomedical informatics: a chal-lenging opportunity,” IMIA Yearbook of Medical Informatics,vol. 22, no. 9, pp. 8–13, 2014.
[2] IDC, “Analyze the future,” 2014, http://www.idc.com/.[3] M. Hilbert and P. Lopez, “.e world’s technological capacity
to store, communicate, and compute information,” Science,vol. 332, no. 6025, pp. 60–65, 2011.
Figure 21: Proposed model obtained from the plotting of the mf and designing of rules.
[4] S. D. Sagiroglu, “Big data: a review,” in Proceedings of theInternational Conference on Collaboration Technologies andSystems (CTS ‘13), pp. 42–47, San Diego, CA, USA, May 2013.
[5] M. Chen, D. Ebert, H. Hagen et al., “Data, information, andknowledge in visualization,” IEEE Computer Graphics andApplications, vol. 29, no. 1, pp. 12–19, 2009.
[6] K. Pantazos and K. Pantazos, Custom visualization withoutreal programming, PhD.esis, University of Copenhagen, ITUniversity Of Copenhagen, Copenhagen, Denmark, 2012.
[7] H. T. Kahraman, I. Colak, and S. Sagiroglu, “Developing intuitiveknowledge classifier and modeling of users’ domain dependentdata in web, knowledge based systems,” 2013, https://archive.ics.uci.edu/ml/datasets/User+Knowledge+Modeling.
[8] A. K. Sahu and P. Dwivedi, “Knowledge transfer by domain-independent user latent factor for cross-domain recom-mender systems,” Future Generation Computer Systems,vol. 108, pp. 320–333, 2020.
[9] J. Chang and J. Hwang, “.e role of media in user partici-pation: focusing on the knowledge activity in online space,”Telematics and Informatics, vol. 51, 2020.
[10] S. Flowers and M. Meyer, “How can entrepreneurs benefitfrom user knowledge to create innovation in the digitalservices,” Journal of Business Research, 2020, In press.
[11] J. Constant, “Knowledge visualization and nano-crystalmodeling geometry,” Applied Surface Science, vol. 473,pp. 668–672, 2019.
[12] F. Desimoni and L. Po, “Empirical evaluation of Linked Datavisualization tools,” Future Generation Computer Systems,vol. 112, pp. 258–282, 2020.
[13] W. Huang, J. Luo, T. Bednarz, and H. Duh, “Making graphvisualization a user-centered process,” Journal of VisualLanguages & Computing, vol. 48, pp. 1–8, 2018.
[14] I. C. S. Silva, G. Santucci, and C. M. D. S. Freitas, “Visuali-zation and analysis of schema and instances of ontologies forimproving user tasks and knowledge discovery,” Journal ofComputer Languages, vol. 51, pp. 28–47, 2019.
[15] R. Yu and L. Shi, “A user-based taxonomy for deep learningvisualization,” Visual Informatics, vol. 2, no. 3, pp. 147–154,2018.
[16] W. Luo, “User choice of interactive data visualization format:the effects of cognitive style and spatial ability,” DecisionSupport Systems, vol. 122, Article ID 113061, 2019.
[17] G. B. Gebremeskel and B. H. B. Biazen, “Architecture andoptimization of data mining modeling for visualization ofknowledge extraction: patient safety care,” Journal of KingSaud University-Computer and Information Sciences, 2019, Inpress.
[18] S. Al-Dohuki, F. Kamw, Y. Zhao, X. Ye, J. Yang, andS. Jamonnak, “An open source trajanalytics software formodeling, transformation and visualization of urban trajec-tory data,” in Proceedings of the 2019 IEEE IntelligentTransportation Systems Conference (ITSC), pp. 150–155,Auckland, New Zealand, October 2019.
[19] W. A. C. Rojas and C. M. Villegas, “Graphical representationand exploratory visualization for decision trees in the KDDprocess,” in Proceedings of the 2012 XXXVIII ConferenciaLatinoamericana En Informatica (CLEI), pp. 1–10, Medellin,Colombia, October 2012.
[20] B. Macek and M. Atzmueller, “Visualizing the impact of timeseries data for predicting user interactions,” in Proceedings ofthe 2013 IEEE/ACM International Conference on Advances inSocial Networks Analysis and Mining (ASONAM 2013),pp. 1477-1478, Niagara Falls, ON, Canada, August 2013.
[21] F. Giunchiglia, S. R. Ojha, and S. Das, “SemUI: a knowledgedriven visualization of diversified data,” in Proceedings of the2017 IEEE 11th International Conference on Semantic Com-puting (ICSC), pp. 234–241, San Diego, CA, USA, January2017.
[22] S. F. H. Li, S. Mukhopadhyay, A. J. Saykin, and L. Shen,“Interactive machine learning by visualization: a small datasolution,” in Proceedings of the 2018 IEEE InternationalConference on Big Data (Big Data), pp. 3513–3521, Seattle,WA, USA, December 2018.
[23] M. A. Rafi, “Visualization of multi-dimensional resourcespace,” in Proceedings of the 2017 13th International Con-ference on Semantics, Knowledge and Grids (SKG), pp. 182–187, Beijing, China, August 2017.
[24] M. Risi, M. I. Sessa, M. Tucci, andG. Tortora, “CoDemodelingof graph composition for data warehouse report visualiza-tion,” IEEE Transactions on Knowledge and Data Engineering,vol. 26, no. 3, pp. 563–576, 2014.
[25] D. Sacha, A. Stoffel, F. Stoffel, B. C. Kwon, G. Ellis, andD. A. Keim, “Knowledge generation model for visual ana-lytics,” IEEE Transactions on Visualization and ComputerGraphics, vol. 20, no. 12, pp. 1604–1613, 2014.
[26] L. A. Zadeh, “Fuzzy logic,” Computer, vol. 21, no. 4, pp. 83–93,1988.
[27] Fuzzy Logic Tool box ™, 2 User’s Guide, .e MathWorks, Inc,Apple Hill Drive Natick, MA, USA, 2010.
[28] J. Yen and R. Langari, Fuzzy Logic: Intelligence, Control andInformation, Prentice-Hall, Upper Saddle River, NJ, 1st edi-tion, 1999.
[29] S. Nazir, S. Anwar, M. A. Khan, H. Khan, and M. Nazir, “Anovel fuzzy logic based software component selection mod-eling,” in Proceedings of the International Conference on In-formation Science and Application (ICISA), pp. 1–6, IEEE,Suwon, Korea, May 2012.
[30] S. Nazir and M. Nazir, “Comparisons of membership func-tions for fuzzy rules,” VAWKUM Transactions on ComputerSciences, vol. 3, pp. 10–14, 2014.
[31] S. Nazir, S. Shahzad, S. Mahfooz, and M. N. Jan, “Fuzzy logicbased decision support system for component securityevaluation,” International Arab Journal of Information andTechnology, vol. 15, pp. 1–9, 2015.
[32] S. Nazir, S. Shahzad, I. Zada, and H. Khan, “Evaluation ofsoftware birthmarks using fuzzy analytic hierarchy process,”in Proceedings of the Fourth International Multi-topic Con-ference, pp. 171–175, Jamshoro, Pakistan, October 2015.


![Modelling electromagnetic responses from seismic dataModelling electromagnetic responses from seismic data Dieter Werthmüller [Dieter.Werthmuller@ed.ac.uk], ... 2 :5 3 :5 4 :5 Velocity](https://static.documents.pub/doc/80x56/5e7595d3c15d63252e0339e1/modelling-electromagnetic-responses-from-seismic-data-modelling-electromagnetic.jpg)