Users & Buyers Global Insights Study 2021 The views of 802 users and buyers of insights and research, from 61 countries, fieldwork April/May 2021. In 2020, ESOMAR partnered by NewMR and Confirmit, and supported by a wide range of national associations – institut- ed a survey to benchmark the views, opinions and practices of users and buyers of insights and research. This report presents the findings from the second instalment, the fieldwork for which was conducted in May 2021. The original founding partnership was extended to include the support of InfoTools, and we were delighted that the collaborative list of national partners was extended to include: ABEP (Brazil), AEDEMO (Spain), AIM (Chile), AIMRO (Ireland), ARF (USA), ASSIRM (Italy), CEIM (Argentina), CEISMU(Uruguay), Confirmit, CRIC (Canada), CUBE (Belgium), ESOMAR, GreenBook, Infotools, Insight Management Academy (UK), Insights Association (USA), JMRA (Japan), NewMR, MOA (Netherlands), MRWeb, OFBOR (Poland), Potentiate, PTBRiO (Poland), PUMa (Germany), QRCA (USA), Quirks (USA), RANZ (New Zealand), SAIMO (Argentina), SORMA (Romania), The Research Society (Australia). Report Author: Ray Poynter
Transcript
Users & Buyers Global Insights Study 2021
The views of 802 users and buyers of insights and research, from 61 countries, fieldwork April/May 2021.
In 2020, ESOMAR partnered by NewMR and Confirmit, and supported by a wide range of national associations – institut-
ed a survey to benchmark the views, opinions and practices of users and buyers of insights and research. This report
presents the findings from the second instalment, the fieldwork for which was conducted in May 2021. The original
founding partnership was extended to include the support of InfoTools, and we were delighted that the collaborative list
(Germany), QRCA (USA), Quirks (USA), RANZ (New Zealand), SAIMO (Argentina), SORMA (Romania), The Research Society
(Australia).
Report Author: Ray Poynter
esomar.org 2
Table of Contents
The Big Picture ................................................................................................................. 4Foreword .......................................................................................................................... 4Executive Summary ........................................................................................................ 6
Internal is big, and getting bigger .........................................................................................................6More, often with less ................................................................................................................................6Diverse Challenges ...................................................................................................................................6Insight teams are very diverse ................................................................................................................6Key skills .....................................................................................................................................................6Key Priorities .............................................................................................................................................6Trends are only trends .............................................................................................................................6
Data Tables and Bases .................................................................................................... 7The Shift to Internal ........................................................................................................ 7
Suitability for Internalising Research ........................................................................................................ 10
More, often with less .................................................................................................... 11The Challenges .............................................................................................................. 14Understanding the Client-side Insight Function ....................................................... 15
Size of Insight Function ............................................................................................................................... 15Skills ............................................................................................................................................................... 16The Role of Insights ..................................................................................................................................... 17Technologies and Approaches ................................................................................................................... 18More detail? .................................................................................................................................................. 18
Summary and Recommendations ............................................................................... 19Internal is big and getting bigger ............................................................................................................. 19The volume of projects is increasing ........................................................................................................ 19Patterns and trends exist, but so do variations. ..................................................................................... 19Key Challenges ............................................................................................................................................. 19Democratisation........................................................................................................................................... 19
Countries ....................................................................................................................................................... 21Size of Company .......................................................................................................................................... 23Size of the Insights Team ............................................................................................................................ 23Industry Categorisation .............................................................................................................................. 24
The Big PictureAbout 50% of projects are being handled internally
by clients, and the proportion is growing.
ForewordAs economists have told us for many years, a commercial market requires two things: demand and supply; more pertinently, a successful market requires a third key element – service – such that where supply exceeds demand expectations, growth and development can fl ourish. However, for supply to exceed demand expectations, a thorough understanding of the demand “context” is required.
When a business spends time and eff ort developing and delivering a product or a service, without understanding a market or the client’s business, then the risk of that service being “misguided” increases exponentially. Equally, in times such as those we have just experienced – lockdown, lack of personal contact etc – it is ever more critical for service companies to understand what their clients are going through, and how their businesses are evolving.
Last year (2020), ESOMAR, NewMR and Confi rmit decided to institute an ongoing (short) barometer of how end-clients (brand owners) perceive, resource and apply, insights.
The purpose of the measure is two-fold:
i) to provide client-side researchers with a current, contextual understanding of what their peers are doing, and
ii) to provide supply-side agencies with a broader comprehension of the imperatives that their clients are facing, to allow them to determine what further service developments or evolutions they may wish to consider.
Lockdown, quarantine, working at distance and changing commercial imperatives has meant that the demand for speed, instant feedback, and an always-on digital off ering (be it surveying, reporting or warehousing), has occasionally
meant that a clearer understanding of how our clients work and business needs are evolving, has been relegated to a secondary importance as suppliers focus on the “now” and securing whatever budget is available.
A change in demand will necessitate a change in supply, and so to have a better understanding of how insights are viewed and commissioned within brand-owning organisations, and the key criteria applied to what is considered “good” and “successful” research, is essential to maintaining a vibrant and successful sector.
As a result, we owe a huge debt of gratitude to all of our client-side friends who responded to this survey, as well as all the Partner organisations who supported us; it is particularly gratifying to see that more organisations have partnered with us, more national associations have supported us, and more respondents have participated than in the fi rst wave…
Thank you to each and every one of you; we hope we may continue to count on your support for future instalments of this monitor. I’d like to add a special word of thanks to Confi rmit for hosting the survey, to InfoTools for hosting the database and providing respondents with complimentary access to it, and in particular, Ray Poynter, who oversaw the project on all our behalves, andauthored the report!
We sincerely hope you will enjoy the fi ndings in this report, and that you may be able to benefi t from some of the implications to ensure that your business remains at the leading edge of identifying and applying insights.
Finn Raben
Director General, ESOMAR
esomar.org 4
Harmonize, Collaborate and Share insights
from survey data in a single platform.
Easily. At scale.
Unlock the power of research.
infotools.com
esomar.org 6
Executive SummaryHere are the views of 802 buyers and users of research from 61 countries around the world, expressing their views, concerns and intentions in terms of insights. These views are contrasted with the views collected in 2020.
Internal is big, and getting biggerThe proportion of projects being handled internally is large (about 50%), it has been growing, and it is forecast to grow further.
More, often with lessMost clients are doing more projects and expect to be doing even more in the future. However, only about half of the team facing an increased workload are expecting to get a budget increase. Among those expecting a budget increase, only about half are expecting to spend it on additional primary research.
Diverse ChallengesDiff erent organisations face diff erent challenges. The societal and economic changes created by COVID are impacting companies in diff erent ways, from hyper busy to struggling to navigate the future. Integrating multiple strands of data is the key challenge for some, for others it is the digital transformation of research. Some companies are grappling with agile and democratisation, and there is still the perennial problem of quality, especially in data collection.
Insight teams are very diverseInsight teams diff er in several ways relating to headcount, degree of internalisation, priorities, and tools used.
Key skillsThe most common in-house skills are quantitative research and qualitative research. UX, CX and Storytellers are numerous, but more than 60% of participants said their organisation did not have these skills in-house.
Key PrioritiesThe key roles that insight teams are seeking to fi ll are providing insights instead of data, integrating diff erent sources, infl uencing change, and showing the ROI of insights.
Trends are only trendsThis study highlights a number of trends, some of which are strong trends. However, the variations between companies mean that exceptions to the trends are not rare. At the macro level, the trends are the dominant feature, but for individual suppliers and clients the micro-picture can be quite diff erent.
esomar.org 6 esomar.org 7
Data Tables and BasesTo keep the body of the report tidy, the bases, question texts, and data are all listed in the Appendix. Should you wish to have access to the database, InfoTools have provided complimentary subscriptions through Harmoni, for you to review the data. To avail of this, please contact: [email protected] and reference the email as ‘InfoTools access’.
The Shift to InternalOne of the most striking fi ndings from the 2020 wave of this study was the large number of projects being conducted internally by the clients, and the reported growth in the share of projects being conducted internally. The chart below shows that this pattern is confi rmed and appears to have increased. The share of research projects being conducted internally is now reported as being close to half.
We asked the buyers and users of research whether the proportion of research conducted internally was growing, staying the same, or decreasing.
0
20
40
60
80
100
Proportion of Projects ConductedInternally vs Externally
2020
Internal40%
Internal48%
External60%
External52%
2021
esomar.org 8
The chart above makes it clear that the proportion of research being conducted internally is growing for about half the buyers in the survey.
Note, this does not mean internal is key or growing for every organisation. There are companies who conduct 0% of their research internally, and there are also companies who are shrinking the proportion of projects they conduct internally. However, the trend is clear: internal is big and getting bigger.
The table below looks at the reported share of research conducted internally by region, and whether respondent buyers expect that to increase or decrease in the years ahead.
The regional picture
Africa, Middle- East & Pakistan APAC Europe
LatinAmerica
USA &Canada
Base 36 154 373 37 202
Internal % 50% 41% 45% 51% 58%
Internal growing % 58% 44% 52% 65% 50%
Internal decreasing % 11% 10% 5% 11% 7%
The regional picture shows that while there are diff erences among regions, the overall message is the same. Internal is big and getting bigger.
Is Internal growing, stayingthe same or declining?
2020 20210
20
40
60
80
100
Increase45%
Same42%
Increase51%
Same39% Decrease
7%6%7% 3%
esomar.org 8 esomar.org 9
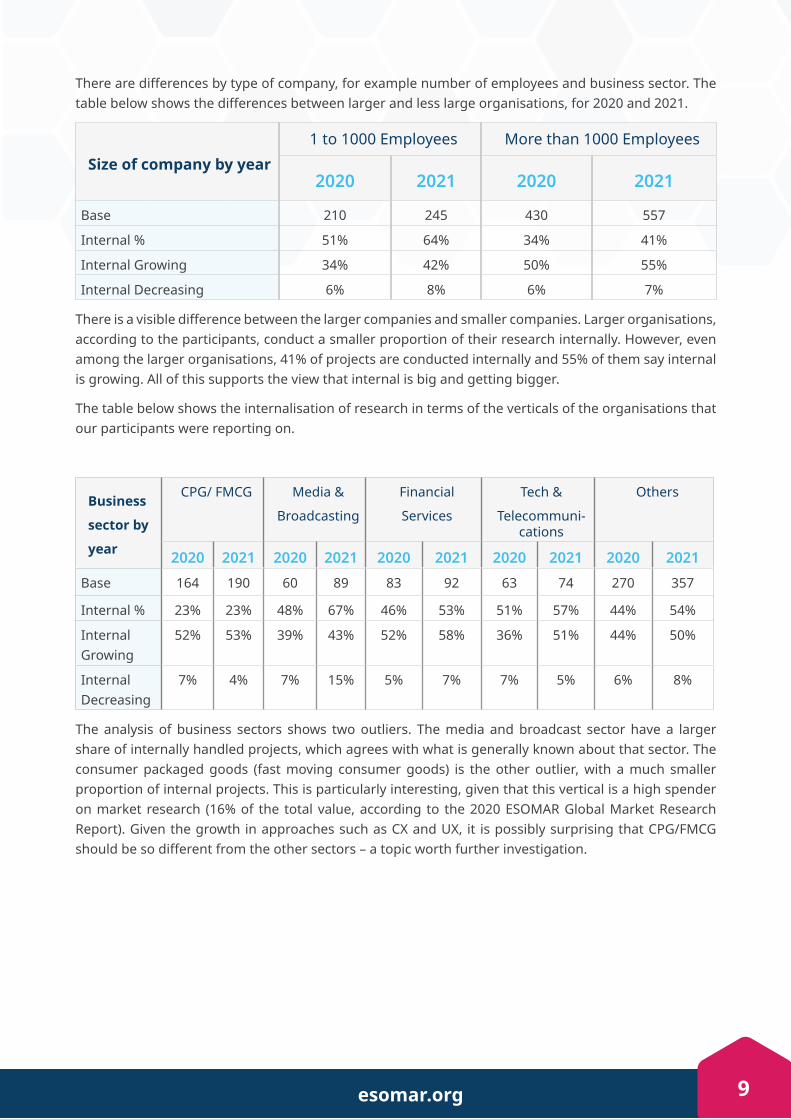
There are diff erences by type of company, for example number of employees and business sector. The table below shows the diff erences between larger and less large organisations, for 2020 and 2021.
Size of company by year1 to 1000 Employees More than 1000 Employees
2020 2021 2020 2021
Base 210 245 430 557
Internal % 51% 64% 34% 41%
Internal Growing 34% 42% 50% 55%
Internal Decreasing 6% 8% 6% 7%
There is a visible diff erence between the larger companies and smaller companies. Larger organisations, according to the participants, conduct a smaller proportion of their research internally. However, even among the larger organisations, 41% of projects are conducted internally and 55% of them say internal is growing. All of this supports the view that internal is big and getting bigger.
The table below shows the internalisation of research in terms of the verticals of the organisations that our participants were reporting on.
The analysis of business sectors shows two outliers. The media and broadcast sector have a larger share of internally handled projects, which agrees with what is generally known about that sector. The consumer packaged goods (fast moving consumer goods) is the other outlier, with a much smaller proportion of internal projects. This is particularly interesting, given that this vertical is a high spender on market research (16% of the total value, according to the 2020 ESOMAR Global Market Research Report). Given the growth in approaches such as CX and UX, it is possibly surprising that CPG/FMCG should be so diff erent from the other sectors – a topic worth further investigation.
esomar.org 10
In terms of the size of the insights team, there are diff erences between the current position and the speed of change towards the internalisation of research, as shown in the table below.
Size of Insights Team 1 to 9 People 10 to 99 100 +
Base 336 300 151
Internal % 53% 46% 43%
Internal growing % 45% 51% 63%
Internal decreasing % 8% 7% 5%
Smaller teams are doing more of their research internally than the larger teams, but more of the larger teams are increasing the share that is internal. Not surprisingly, there is a correlation between size of company and the size of the insights team, as shown in the table below.
Size of insights team by size of company 1 to 1000 Employees More Than 1000 Employees
Base 245 557
1 to 9 People 66% 31%
10 to 99 People 28% 41%
100 or More People 4% 25%
Other 2% 2%
Two-thirds of the smaller companies only have 1 to 9 people in the insight team, while two-thirds of the larger companies have more than 9 people in the insights team. However, the point about variation still raises its head, there are smaller companies with relatively large teams, and there are larger companies with small teams.
Suitability for Internalising ResearchWe asked participants to describe “Which sorts of projects are more suitable for internal teams to conduct?” and “Which sorts of projects are more suitable for external suppliers to conduct?”…these were open-ended questions, allowing respondents to provide as much detail as they wished.
The key message from the data is that there are few clear, overall patterns. Many clients said ‘All’ when describing which types of projects were suitable to be handled internally. However, many others said ‘All’ when describing which projects were suitable to be handled externally. This is not surprising when one considers that some clients conduct 100% of their research internally and some others use agencies for 100% of their research.
Two categories that were identifi ed as being more relevant for internal were 1) simple and/or quick projects and 2) the analysis and integration of existing data and data from other parts of the company. Although some clients go to agencies for CX and UX research, these are both more commonly cited as being suitable for internal research.
In terms of projects that are most typically conducted by agencies, the lead items are 1) larger projects, 2) projects requiring specifi c skills or benchmarks, and 3) those that require an external point of view.
esomar.org 10 esomar.org 11
More, often with lessIn 2020 and again this year, we asked participants to tell us about the volume of projects they are conducting and about the volume of projects they expect to be conducting in the future.
This resulted in three estimates:
• 2020 forecast of what will happen in 2021,
• 2021 statement of what is currently happening, and
• 2021 forecast of the number of projects being conducted in 2022.
These are shown in the chart below.
The 2020 forecast of 2021 appears to have been remarkably accurate. This concordance, between the 2020 forecast and 2021 experience, lends credence to the forecast for 2022.
The key message from both forecasts (the 2020 and 2021 ones) is that the number of projects is increasing for most insight teams – hopefully an implicit confi rmation that companies now appreciate the value of good data and insights.
In 2020 we asked people to say whether their current budgets were higher, the same, or lower than in 2019, and we asked them to forecast 2021. This year we asked them to tell us about this year’s budget and to forecast 2022. The data is shown in the chart below.
Volume of ProjectsForecasts and outomes
Decrease
0
20
40
60
80
100
Increase59%
Same, 29% Same, 27% Same, 32%
Increase62%
Increase64%
12% 11% 5%
2020->2021 2021->2021 2021->2022
esomar.org 12
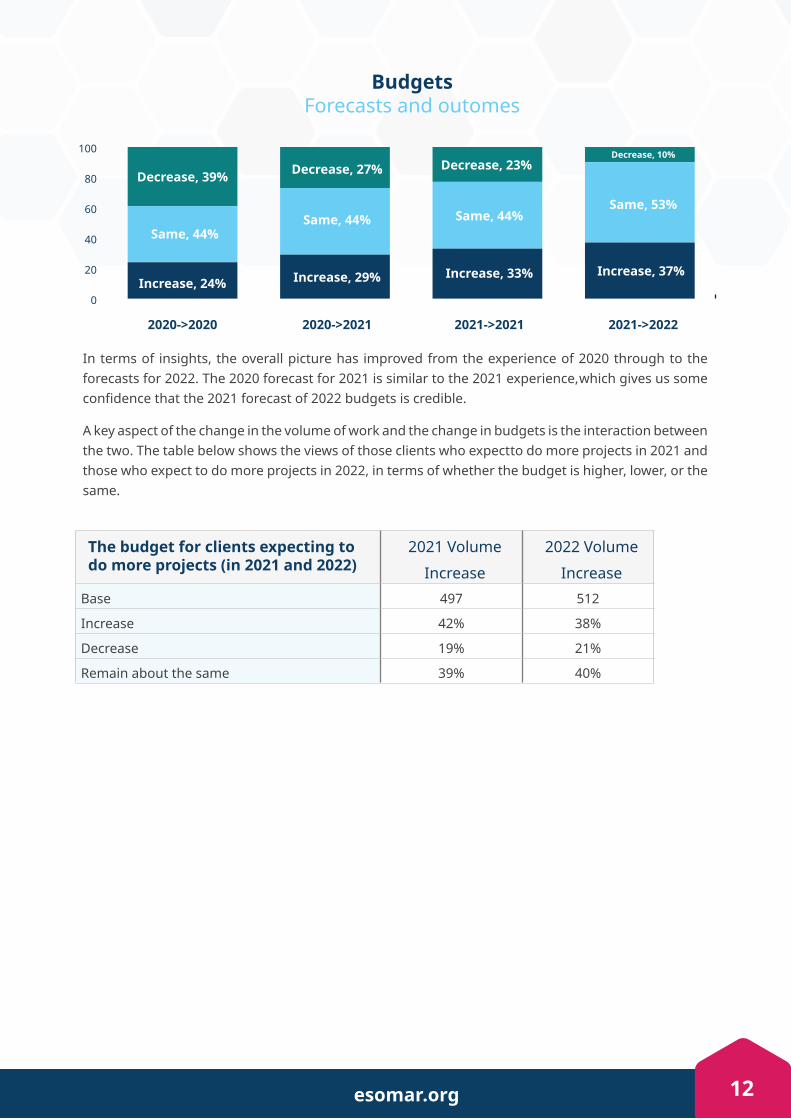
In terms of insights, the overall picture has improved from the experience of 2020 through to the forecasts for 2022. The 2020 forecast for 2021 is similar to the 2021 experience, which gives us some confi dence that the 2021 forecast of 2022 budgets is credible.
A key aspect of the change in the volume of work and the change in budgets is the interaction between the two. The table below shows the views of those clients who expect to do more projects in 2021 and those who expect to do more projects in 2022, in terms of whether the budget is higher, lower, or the same.
The budget for clients expecting to do more projects (in 2021 and 2022)
Amongst the almost two-thirds who expect be doing more projects, under half expect to have more budget. As we shall see in the ‘Challenges’ section below, the most common concern of clients relates to capacity, a higher workload with insuffi cient resources.
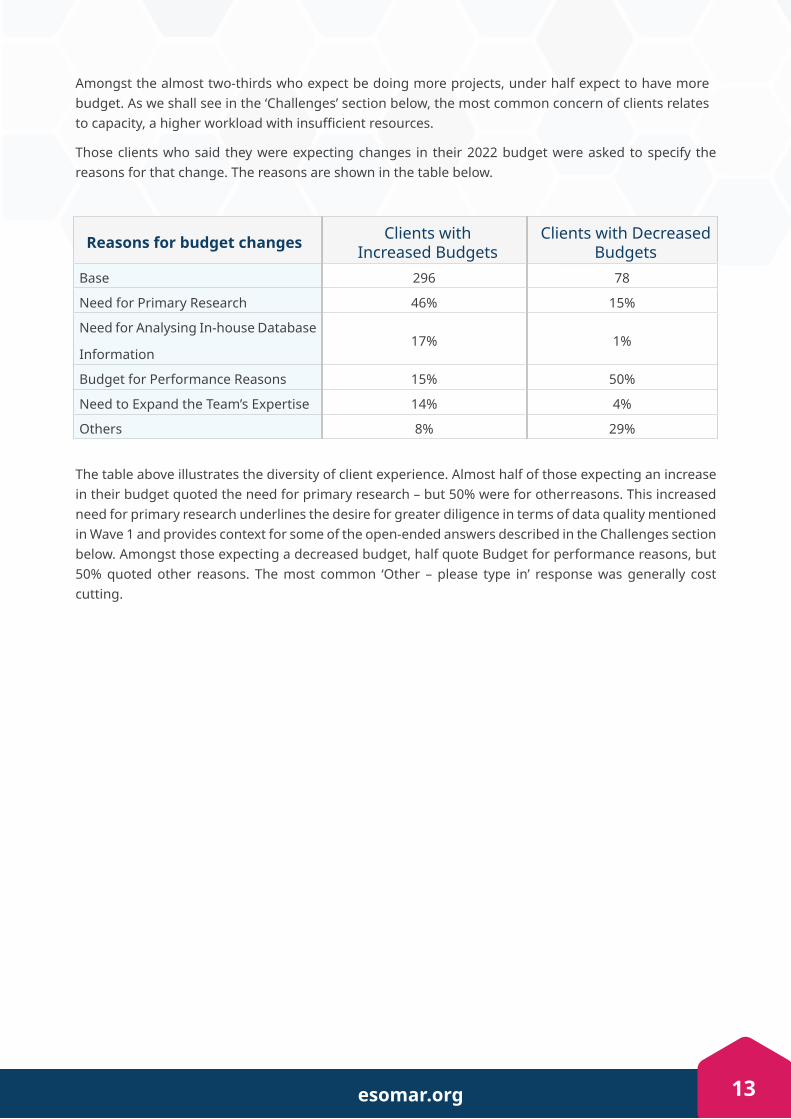
Those clients who said they were expecting changes in their 2022 budget were asked to specify the reasons for that change. The reasons are shown in the table below.
Reasons for budget changes Clients withIncreased Budgets
Clients with Decreased Budgets
Base 296 78
Need for Primary Research 46% 15%
Need for Analysing In-house Database
Information17% 1%
Budget for Performance Reasons 15% 50%
Need to Expand the Team’s Expertise 14% 4%
Others 8% 29%
The table above illustrates the diversity of client experience. Almost half of those expecting an increase in their budget quoted the need for primary research – but 50% were for other reasons. This increased need for primary research underlines the desire for greater diligence in terms of data quality mentioned in Wave 1 and provides context for some of the open-ended answers described in the Challenges section below. Amongst those expecting a decreased budget, half quote Budget for performance reasons, but 50% quoted other reasons. The most common ‘Other – please type in’ response was generally cost cutting.
esomar.org 14
The ChallengesWe asked, “What do you think will be the main challenges you expect to be facing over the next 2-5 years?” as an open-ended question.
The responses were coded into eight broad categories, as shown in the table below.
Share Description
23%Capacity — Insuffi cient resources, reduced budgets, increased workloads, doing more with less, improving skills & hiring staff .
18% External factors — COVID, market conditions, media complexity, laws and privacy.
16% Data rich — Integrating insights from multiple sources, big data, and analytics.
10%Creating value — Delivering insights not data, showing the value of insights, illustrating the ROI of research, creating infl uence & increasing our credibility.
9% New frontiers — Digital transformation of research, AI, innovation & automation.
In the current wave, these two factors are still signifi cant, but less so, and the topics have become less focused.
The richness of the open-ended comments emphasises the diversity of the challenges facing insight teams and research users. For some the key issue is the quality of data collection “Getting good respondent sample. Participation and representativeness seems to be dropping even as there are now a million companies trying to sell me sample.”
For others the key challenge relates to bringing research in-house, in the context of other challenges. For, example “Shift from external to internal, need to build internal capabilities (e.g., text mining), but with reduced budgets.” Others face the challenge of showing the value of their insight team in the face of democratisation, “Proving the value of deep expertise in the increasing mediocracy and democratisation of MR.” For others the challenge is making democratisation work better “Empowering decentralized research with right tools/methods/skills, fi nding a good balance between in depth research and fast ad hoc research.”
esomar.org 14 esomar.org 15
Understanding the Client-side Insight FunctionIn this section of the report, we look at some key characteristics of the insight functions of diff erent client organisations.
Size of Insight FunctionThe chart below shows the diff ering headcounts from one team to another.
Almost 80% of the sample falls into just two size categories: one to nine people and 10 to 99. About one-in-fi ve participants work in organisations that have more than 100 insight people (and 5% have more than 1000).
The size of insight teams does not vary greatly by region. However as mentioned earlier, there is a link between company size and the size of the insight function. Looking at companies with fewer than 1000 employees, 66% have fewer than 10 people in the insights team. Among companies with more than 1000 employees, only 31% have fewer than 10 people in insights. In terms of verticals, Tech and Telecommunications and Financial Services tend to have larger teams, but there are plenty that have smaller teams.
1 to 9 people,42%
10 to 99 people,37%
100 or more people,19%
Not sure, or NA,2%
Insight headcount in 2021
esomar.org 16
SkillsWe asked participants in the study to indicate “In terms of research and insights, which of the following skills/roles/professions do you have in your organisation?” Note, people could tick more than one box. For example, it would be possible to have a team of just one person and tick both qual and quant. The table below shows the results at the total level.
Perhaps the most surprising feature of the table above is how infrequently ‘Storytelling’ skills are described as being available.
The patterns by region are fairly consistent, but it would appear that Latin America and the Africa, Middle East Pakistan region have even fewer storytellers. Not surprisingly, organisations with larger insights headcounts had more specialities covered. The organisations with fewer than ten insight professionals were particularly short of CX and UX expertise. In terms of verticals, Financial Services and Tech and Telecommunications tend to have more skills in-house. CPG/FMCG are particularly weak in the area of UX and CX research, and more generally, it is surprising to see CX and UX rank lower, given the emphasis on needing to be closer to the customer during the pandemic. Media & Broadcast were much more likely to say they had skills in Storytelling (51% versus 32% for the total).
Which of these skills do youhave in your organisation?
QuantitativeMarket Researchers
QualitativeMarket Researchers
Stategic Analysts
Data Scientists
Web/ Digital Analysts
UX Researchers
CX Researchers
Storytellers
Others
None of these
86%
78%
62%
54%
49%
39%
38%
32%
4%
3%
esomar.org 16 esomar.org 17
The Role of InsightsWe asked the participants to identify “Which of the following are currently the key issues for insights in your organisation?”. The interesting point about this question is that many of the items in the list are potentially important, so the framing of the question makes clients make choices about their key priorities. The result of the choices is shown below.
The top end of the list is perhaps not surprising, e.g., insights instead of data, infl uencing change, and showing ROI. Perhaps integration of diff erent sources being number two (ahead of forecasting, agile, and democratisation) is a little more surprising?
One result that will disappoint many people is that ‘Being inclusive / diverse’ is the bottom item in the list. This could be an artefact of the way the question was framed. When people are asked ‘How important is diversity?’, they will often say important or very important. But, when they have to pick their top three priorities, inclusivity does not make the cut for 93% of these participants. The topic of diversity is rated as being a priority by a higher percentage in the US – but even in the US it is only selected by 16% of clients.
The Role of Insights
Providing Insights Instead of Data
Integrating Different Solutions
Influencing Change
Showing Risk of Insights
Forecasting and Foresighting
Being/ Becoming Agile
Data Science and Analytics
Democratising Insights
Risk Reduction
Being Inclusive/ Diverse
Others
None of the Above
42%
39%
36%
36%
31%
28%
27%
21%
8%
7%
3%
1%
esomar.org 18
Technologies and ApproachesWe asked the participants “Which of the following do you currently make use of internally for your insights?” and the results are shown in the table below.
This list and ranking illustrate the migration to self-serve platforms. Survey platforms are the most widely used internally (with about two-thirds of clients saying they use them), and which underlines that moving more research internally can be greatly facilitated by such platforms. At the other end of the scale are community software and video tools, and these are presumably more ‘full-serve’ than ‘self-serve’ at the moment.
Clients in the US are measurably more likely to be using more types of tools, with an average of 5.4 per company, compared with the rest of the world with an average of 4.2 per company. There is an even bigger gap between small insight teams and larger ones.
Companies with an insight team of one to nine people used an average of 3.5 types of research tools or approaches. Companies with more than 100 people working in insights had an average of using of 6.1 types of tools and approaches.
More detail?Note, if you are interested in more granularity of information, for example US versus Canada, you can review the data tables.
Technologies & Approaches Used Internally
Survey Platforms
Data Integration tools
Analystic tools
Social Media Analytics
Online Qual Platforms
Visualisation Tools
Text Analytics
Free Tools
Artificial Intelligence
Video Tools
Community Software
None of These
66%
64%
57%
55%
47%
39%
36%
28%
19%
14%
13%
4%
esomar.org 18 esomar.org 19
Summary and Recommendations
Internal is big and getting biggerIf you are a client and this is not true for you, perhaps it is time to do a strategic review of insights to ensure that you have the optimal mix of internal and external solutions.
Key issues for those buyers who are internalising and democratising are: 1) ensuring quality, 2) developing skills, and 3) dealing with the needs that can’t readily be handled by research technology.
The volume of projects is increasingAbout two-thirds of participants are saying that the number of projects in 2021 was larger than the number in 2020, and about two-thirds expect the volume to be larger in 2022. However, not all of these increases are matched by increases in budgets. For the last few years, the ESOMAR Global Prices Study has shown that the average price of projects has been falling over the years, and this seems destined to continue – given the volume is increasing faster than the available budgets.
Patterns and trends exist, but so do variations.About 50% of research projects are being handled internally, but that means 50% are not. The majority of clients are increasing the share of research projects conducted internally, but some are decreasing their internal share. There are no specifi c types of projects that everybody thinks should be internal, and none that everybody thinks should be external.
A key issue is, of course, that each client needs to make a conscious decision about what goes into which bucket, i.e., agency, insight team, democratised. However, ensuring that there are contingencies in place to deal with higher workloads appears to be a good idea.
Key ChallengesThe three key challenges are capacity (more projects, insuffi cient resources, skills and staffi ng), external factors (COVID, market conditions and laws/regulations) and being data rich (integrating insights from diff erent sources). This means clients need to continue to balance three key factors: doing more with less, being fl exible in the face VUCA times (volatile, uncertain, complex & ambiguous), while developing an enhanced ability to gain insights and value from ever larger amounts of data.
DemocratisationMany client-side insight professionals are unhappy with democratisation – partly through loss of their own status and partly because the research will not be of a suffi ciently high quality. However, there seems little doubt that more and more research will be democratised, i.e., handled by non-researchers utilising platforms without hands-on guidance. As a result, the challenge for most research teams is not to try to fi ght to stop this process, it should be to shape the process to allow greater productivity in ways that promote quality and insight.
esomar.org 20
Appendix
esomar.org 20 esomar.org 21
Project SummaryThe study was conducted with 802 buyers and users of insights during April/May 2021. The analysis of this project includes comparisons with the 2020 project (620 interviews conducted during September 2020).
The sample was sourced from more than 20 partners, shown below in alphabetical order.
ABEP (Brazil), AEDEMO (Spain), AIM (Chile), AIMRO (Ireland), ARF (USA), ASSIRM (Italy), CEIM (Argentina), CEISMU(Uruguay), Confi rmit, CRIC (Canada), CUBE (Belgium), ESOMAR, GreenBook, Infotools, Insight Management Academy (UK), Insights Association (USA), JMRA (Japan), NewMR, MOA (Netherlands), MRWeb, OFBOR (Poland), Potentiate, PTBRiO (Poland), PUMa (Germany), QRCA (USA), Quirks (USA), RANZ (New Zealand), SAIMO (Argentina), SORMA (Romania), The Research Society (Australia).
A copy of the questionnaire and key data tables are included in this report. The survey was scripted and hosted by Confi rmit and was managed by Ray Poynter. Participants were screened to ensure that only buyer-side individuals were included and the design ensured that the same individual only participated once.
CountriesResponses were collected from 69 countries
CountriesYear
Total 2020 2021Total 1442 640 802
Afghanistan 1 0 1
Albania 0 0 0
Algeria 1 1 0
Argentina 7 5 2
Australia 70 32 38
Austria 8 5 3
Belgium 11 6 5
Brazil 29 12 17
Canada 64 21 43
Chile 3 2 1
China (Total) 16 6 10
Colombia 16 10 6
Costa Rica 2 1 1
Croatia 4 3 1
Cyprus 1 0 1
Czech Republic 8 5 3
Denmark 9 5 4
Dominican Republic 2 2 0
Egypt 6 2 4
esomar.org 22
Estonia 1 1 0
Finland 9 4 5
France 43 18 25
Georgia 2 0 2
Germany 141 62 79
Ghana 1 1 0
Greece 5 3 2
Guatemala 3 2 1
Hungary 4 2 2
India 43 19 24
Indonesia 1 1 0
Iran 2 1 1
Ireland 85 38 47
Israel 3 2 1
Italy 14 8 6
Japan 78 37 41
Kenya 2 0 2
Kuwait 1 1 0
Latvia 1 0 1
Liechtenstein 1 1 0
Lithuania 1 1 0
Luxembourg 3 2 1
Malaysia 5 3 2
Malta 1 1 0
Mexico 16 9 7
Morocco 1 0 1
Netherlands 48 28 20
New Zealand 17 7 10
Nigeria 6 3 3
Norway 1 1 0
Pakistan 3 0 3
Panama 1 1 0
Peru 6 4 2
Philippines 16 6 10
Poland 34 2 32
Portugal 8 5 3
Puerto Rico 1 1 0
Qatar 2 1 1
esomar.org 22 esomar.org 23
Romania 21 11 10
Russia 3 3 0
Saudi Arabia 9 4 5
Serbia 3 2 1
Singapore 31 17 14
Slovakia 1 1 0
Slovenia 3 0 3
South Africa 17 11 6
South Korea 2 0 2
Spain 25 11 14
Sri Lanka 4 3 1
Sweden 16 7 9
Switzerland 38 16 22
Taiwan 2 2 0
Thailand 3 1 2
Turkey 11 8 3
Turkmenistan 1 0 1
United Arab Emirates 7 5 2
United Kingdom 128 54 74
United States 245 86 159
Uruguay 2 2 0
Venezuela 2 2 0
Countries with 30 or more responses are reported separately, all the data are reported by region.
Size of Company
Company Size DetailYear
Total 2020 2021Total 1442 640 802
1 Employee 42 18 24
2 to 9 Employees 65 28 37
10 to 99 Employees 91 40 51
100 to 199 Employees 49 25 24
200 to 1000 Employees 195 95 100
More than 1000 Employees 987 430 557
Not sure 13 4 9Almost 70% of the responses came from companies with more than 1000 employees.
esomar.org 24
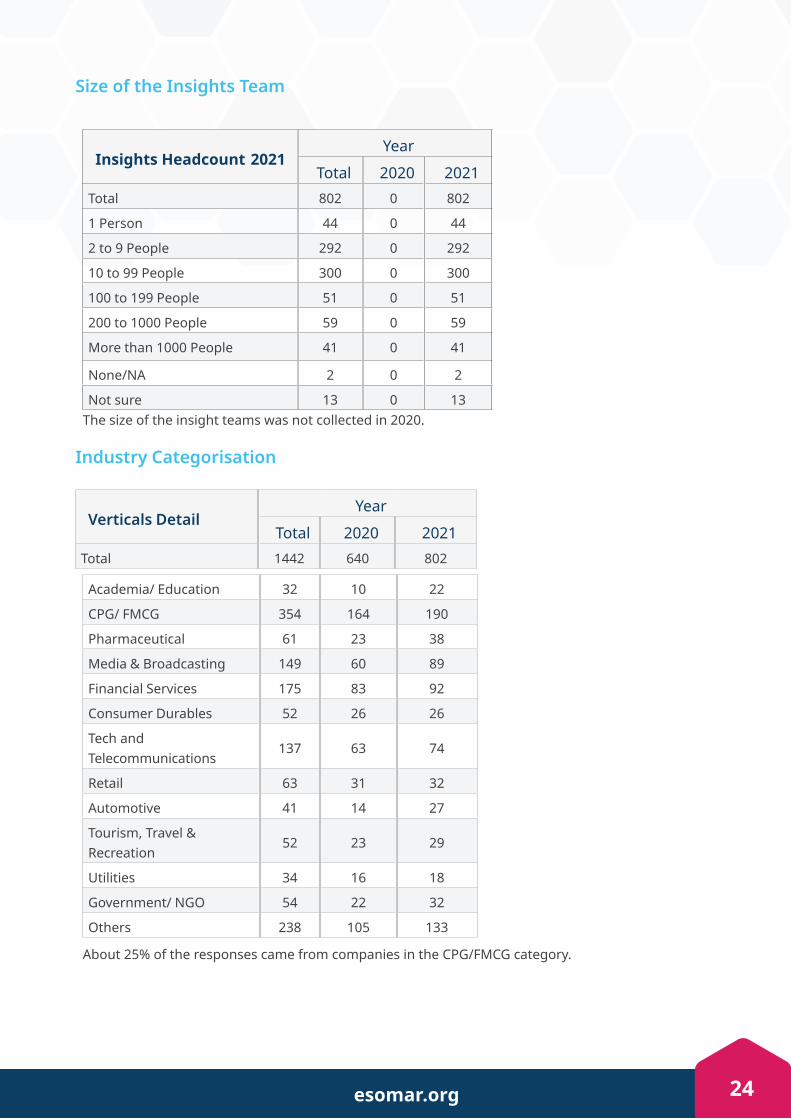
Size of the Insights Team
Insights Headcount 2021Year
Total 2020 2021Total 802 0 802
1 Person 44 0 44
2 to 9 People 292 0 292
10 to 99 People 300 0 300
100 to 199 People 51 0 51
200 to 1000 People 59 0 59
More than 1000 People 41 0 41
None/NA 2 0 2
Not sure 13 0 13The size of the insight teams was not collected in 2020.
Industry Categorisation
Verticals DetailYear
Total 2020 2021Total 1442 640 802
Academia/ Education 32 10 22
CPG/ FMCG 354 164 190
Pharmaceutical 61 23 38
Media & Broadcasting 149 60 89
Financial Services 175 83 92
Consumer Durables 52 26 26
Tech and Telecommunications
137 63 74
Retail 63 31 32
Automotive 41 14 27
Tourism, Travel & Recreation
52 23 29
Utilities 34 16 18
Government/ NGO 54 22 32
Others 238 105 133
About 25% of the responses came from companies in the CPG/FMCG category.
esomar.org 24 esomar.org 25
QuestionnaireNote the questionnaire was off ered in fi ve languages, Chinese, English, French, Japanese and Spanish. The English language questionnaire is shown below. The Median completion time was 6.7 minutes.
l - Language
Preferred Language / Langue préférée / Idioma preferido / 優先言語 / 选择您的语言 English (9) Français (12) Español (10)
日本語(17)
中文 (34820)
Introduction - Introduction
Thank you for taking part in this study which aims to determine changes in the purchase and use of data and insights globally and provide a benchmark for future studies. The study is being organised and supported by the organisations listed below and its purpose is to share key metrics and trends about the insights process worldwide. Everybody who takes part in the study will have the option at the end of the survey to register for a copy of the results.
This study is being conducted in partnership with ABEP (Brazil), AEDEMO (Spain), AIM (Chile), AIMRO (Ireland), ARF (USA), ASSIRM (Italy), CEIM (Argentina), CEISMU(Uruguay), Confi rmit, CRIC (Canada), CUBE (Belgium), ESOMAR, GreenBook, Infotools, Insight Management Academy (UK), Insights Association (USA), JMRA (Japan), NewMR, MOA (Netherlands), MRWeb, OFBOR (Poland), Potentiate, PTBRiO (Poland), PUMa (Germany), QRCA (USA), Quirks (USA), RANZ (New Zealand), SAIMO (Argentina), SORMA (Romania), The Research Society (Australia).
Please know that this survey is being conducted in accordance with the ICC/ESOMAR Code. The data you provide through this questionnaire will be kept anonymous and confi dential, treated with the utmost care and will not be used for any other purpose.
By participating in this survey, we will place a cookie on your device, which is solely designed to avoid duplicate responses. If you don’t agree with this, please close the browser.
For more information about how ESOMAR processes your personal data, please visit our privacy policy
esomar.org 26
S1 - Repeat Screener
This survey is being delivered by several partners, so you may be invited more than once. Have you already completed this questionnaire? Yes (1) No (2)
Screened –
Thank you for your co-operation. In order to create a high-quality representation of the industry it is important that people only complete the study once.
Q1 - Buyer
Which of the following best describes your organisation?
Brands who buy, use and create insights/research (eg P&G, IKEA, HSBC, Toyota, Coca-Cola etc) (1) Tech platform who buy, use and create insights/research (eg Facebook, Amazon, Google etc) (2) Business / Financial Consultants who buy, use and create insights/research (eg Bain, PWC, McKinsey, etc) (3) Media Advisor who buy, use and create insights/research (eg McCann Worldwide, Dentsu, JWT, etc) (4) Supplier of insights/research (eg Kantar, Nielsen, Ipsos, Intage, Macromill etc) (5) Supplier of services to insights/research (eg SPSS, Dynata, Cint etc) (6) Other (please specify) (7)
Screened –
Thank you for your co-operation. This study is focusing only on end clients. If you are a member of any of the partner organisations mentioned previously, please contact them to enquire about receiving a copy of the report.
Condition
S
TOP
C
ON
DIT
ION true
Question ()
STO
P
false
END
esomar.org 26 esomar.org 27
Q2 - Skills/roles
In terms of research and insights, which of the following skills/roles/professions do you have in your organisation?
Tick all that apply $ note some people may fall into more than one box.
Quantitative market researchers (1) Qualitative market researchers (2) Data scientists (3) Web/digital analysts (4) CX researchers (5) UX researchers (6) Strategic analysts (7) Storytellers (8) Other (please specify) (9) None of these (10)
Q3 - Insights Headcount
In your organisation how many people are working with and generating insights, research and analytics?
1 (1) 2 to 9 (2) 10 to 99 (3)
100 to 199 (4) 200 to 1000 (5) More than 1000 (6) None, Not Applicable (7) Not sure (8)
Q4 - Internal vs External
Firstly, thinking of the last 12 months, approximately what proportion of insight/research projects at your organisation are conducted internally, and what proportion are commissioned externally?
Internal (1) External (2)
Q4NS
Not sure (1)
Q5 - Change in Internal vs External
Is the proportion of insights/research done internally at your organisation increasing or decreasing?
Internal is increasing (1) Internal is declining (2) No major change (3) Not sure (99)
Q6a - Internal projects
Which sorts of projects are more suitable for internal teams to conduct?
#Q6a_1 {background-image: none;}
(1) None (2)
Q6b - External projects
Which sorts of projects are more suitable for external suppliers to conduct?
esomar.org 28
#Q6b_1 {background-image: none;}
(1) None (2)
Q7a - Quantity of work 2021
Thinking of your own workload, compared with last year has the quantity of projects you are involved in increased or decreased?
Increased (1) Decreased (2) Remained about the same (3)
Q7b - Quantity of work 2022
Looking ahead to next year, do you think the quantity of projects you are involved in will increase or decrease?
Increase (1) Decrease (2) Remain about the same (3)
Q8a - Budget 2020 a
Compared with last year, have your company resources for research/insights increased or decreased?
Increased (1)
Decreased (2) Remained about the same (3)
Q8b - Budget 2022 b
Looking ahead to next year, do you think the resources for research/insights will increase, decrease, or remain
the same?
Increase (1) Decrease (2) Remain about the same (3)
Q8c - Increase 2021
Thinking about the ^( f(‘Q8b’).any(‘1’) ) ? “increase” : “decrease”^ in your company resources for next year, do you think this comes from...
An ^( f(‘Q8b’).any(‘1’) ) ? “increase” : “decrease”^ in budget for performance reasons (1) A ^( f(‘Q8b’).any(‘1’) ) ? “greater” :”lesser”^ need for primary research (2) A ^( f(‘Q8b’).any(‘1’) ) ? “greater” :”lesser”^ need for analysing in-house database information (3) A ^( f(‘Q8b’).any(‘1’) ) ? “greater” :”lesser”^ need to expand the team’s expertise/skill sets (4) Other [please specify] (98)
Q9 - Main challenges next two years?
What do you think will be the main challenges you expect to be facing over the next 2-5 years?
esomar.org 28 esomar.org 29
Q10 - The Role of Insights
Which of the following are currently the key issues for insights in your organisation?
Select up to THREE.
Showing the ROI of insights (1) Being (or becoming) Agile (2) Being inclusive/diverse (3) Providing insights instead of data (4) Democratising insights (5) Risk reduction (6) Infl uencing change (7) Integrating different sources (8) Data science and analytics (9) Forecasting and foresighting (10) Other (please specify) (11) None of the above (12)
Q11 - Technologies and Approaches
Which of the following do you currently make use of internally for your insights?
Select all that apply
Survey platforms (e.g. Confi rmit or Qualtrics) (1) Visualisation tools (2) Data integration (and reporting) tools (e.g. Power BI,Tableau, Hive, Zoho etc) (3) Social media analytics (4) Text analytics (5) Artifi cial Intelligence (6) Analytic tools (e.g. SPSS) (7) Community Software (e.g. Alida/Vision Critical) (8) Video tools (e.g. VoxPopMe or LivingLens) (9) Free tools such as R and Python (10) Online qual platforms (e.g. discussions & focus groups) (11) None of these (99)
Descriptors - Descriptors
In this fi nal section we just need to ask a few questions about your organisation
Country/Market – Country/Market
Which country/market are you based in?
Abyssinia (1) Afghanistan (2) Albania (3) Algeria (4) Andorra (5) Angola (6) Anguilla (7) Antigua And Barbuda (8) Argentina (9) Armenia (10) Aruba (11) Australia (12) Austria (13) Azerbaijan (14) Bahamas (15)
esomar.org 30
Bahrain (16) Bangladesh (17) Barbados (18) Belarus (19) Belgium (20) Belize (21) Benin (22) Bermuda (23) Bhutan (24) Bolivia (25) Bonaire, Sint Eustatius And Saba (26) Bosnia And Herzegovina (27) Botswana (28) Brazil (29) Brunei Darussalam (30)
Bulgaria (31) Burkina Faso (32) Burundi (33) Cabo Verde (34) Cambodia (35) Cameroon (36) Canada (37) Cayman Islands (38) Central African Republic (39) Chad (40) Chile (41) China (Mainland) (42) Hong Kong (China) (43) Macao (China) (44) Colombia (45) Comoros (46) Congo (47) Cook Islands (48) Costa Rica (49) Côte D’Ivoire (50) Croatia (51) Cuba (52) Curaçao (53) Cyprus (54) Czech Republic (55) Dem. Rep. Congo (56) Denmark (57) Djibouti (58) Dominica (59) Dominican Republic (60) Ecuador (61) Egypt (62) El Salvador (63) Equatorial Guinea (64) Eritrea (65) Estonia (66) Ethiopia (67) Fiji (68) Finland (69) France (70) French Polynesia (71)
Honduras (84) Hungary (85) Iceland (86) India (87) Indonesia (88) Iran (89) Iraq (90) Ireland (91) Israel (92) Italy (93) Jamaica (94) Japan (95) Jordan (96) Kazakhstan (97) Kenya (98) Kiribati (99) Kosovo (100) Kuwait (101) Kyrgyzstan (102) Laos (103) Latvia (104) Lebanon (105) Lesotho (106) Liberia (107) Libya (108) Liechtenstein (109) Lithuania (110) Luxembourg (111)Madagascar (112)Malawi (113)Malaysia (114)Maldives (115)Mali (116)Malta (117) Marshall Islands (118)Martinique (119)Mauritania (120)Mauritius (121)Mexico (122)Micronesia (123)Moldova (124)Monaco (125)Mongolia (126)Montenegro (127)
esomar.org 32
Montserrat (128)Morocco (129)Mozambique (130)Myanmar (131) Namibia (132) Nauru (133) Nepal (134) Netherlands (135) New Caledonia (136)
New Zealand (137) Nicaragua (138) Niger (139) Nigeria (140) Niue (141) North Korea (142) North Macedonia (143) Norway (144) Oman (145) Pakistan (146) Palau (147) Panama (148) Papua New Guinea (149) Paraguay (150) Peru (151) Philippines (152) Pitcairn (153) Poland (154) Portugal (155) Puerto Rico (156) Qatar (157) Réunion (158) Romania (159) Russia (160) Rwanda (161) Saint Barthélemy (162) Saint Helena, Ascension And Tristan Da Cunha (163) Saint Kitts And Nevis (164) Saint Lucia (165) Saint Martin (French Part) (166) Saint Pierre And Miquelon (167) Saint Vincent And The Grenadines (168) Samoa (169) San Marino (170) Sao Tome And Principe (171) Saudi Arabia (172) Senegal (173) Serbia (174) Seychelles (175) Sierra Leone (176) Singapore (177) Sint Maarten (Dutch Part) (178) Slovakia (179) Slovenia (180) Solomon Islands (181) Somalia (182) South Africa (183)
esomar.org 32 esomar.org 33
South Korea (184) South Sudan (185) Spain (186) Sri Lanka (187) Sudan (188) Suriname (189)
Swaziland (190) Sweden (191) Switzerland (192) Syria (193) Taiwan (194) Tajikistan (195) Tanzania (196) Thailand (197) Timor-Leste (198) Togo (199) Tonga (200) Trinidad And Tobago (201) Tunisia (202) Turkey (203) Turkmenistan (204) Tuvalu (205) Uganda (206) Ukraine (207) United Arab Emirates (208) United Kingdom (209) United States (210) Uruguay (211) Uzbekistan (212) Vanuatu (213) Venezuela (214) Vietnam (215)Western Sahara (216) Yemen (217) Zambia (218) Zimbabwe (219)
CompanySize - Size of company
How many people work in your entire organisation (i.e. globally)?
1, just me (1) 2 to 9 (2) 10 to 99 (3) 100 to 199 (4) 200 to 1000 (5) More than 1000 (6) Not sure (99)
Vertical
Which of the following best describes the business your company is in?
Academia / Education (1) Automotive (2) Consumer durables (3) CPG / FMCG (4) Financial Services (5) Government / NGO (6)
Tech and Telecommunications (10) Tourism, Travel & Recreation (11) Utilities (12) Other (Specify) (98)
AnythingElse
Thank you for taking part in this project.
Is there anything else you would like to tell us about this topic or this survey?
Q16 - email report
If you would like a copy of the results, please enter your email address below, which will be held separately from your data and will be used to sign you up for a copy of the fi nal report
Complete –
STO
P
esomar.org 34 esomar.org 35
Data TablesThe data tables are available as a separate download. Below are some of the key tables.