134
IMAGINE Subpixel Classifier User’s Guide September 2008

IMAGINE Subpixel ClassifierUser’s Guide
September 2008

Copyright © 2008 ERDAS, Inc.
All rights reserved.
Printed in the United States of America.
The information contained in this document is the exclusive property of ERDAS, Inc. This work is protected under United States copyright law and other international copyright treaties and conventions. No part of this work may be reproduced or transmitted in any form or by any means, electronic or mechanical, including photocopying and recording, or by any information storage or retrieval system, except as expressly permitted in writing by ERDAS, Inc. All requests should be sent to the attention of:
Manager, Technical DocumentationERDAS, Inc.5051 Peachtree Corners CircleSuite 100Norcross, GA 30092-2500 USA.
The information contained in this document is subject to change without notice.
Government Reserved Rights. MrSID technology incorporated in the Software was developed in part through a project at the Los Alamos National Laboratory, funded by the U.S. Government, managed under contract by the University of California (University), and is under exclusive commercial license to LizardTech, Inc. It is used under license from LizardTech. MrSID is protected by U.S. Patent No. 5,710,835. Foreign patents pending. The U.S. Government and the University have reserved rights in MrSID technology, including without limitation: (a) The U.S. Government has a non-exclusive, nontransferable, irrevocable, paid-up license to practice or have practiced throughout the world, for or on behalf of the United States, inventions covered by U.S. Patent No. 5,710,835 and has other rights under 35 U.S.C. § 200-212 and applicable implementing regulations; (b) If LizardTech's rights in the MrSID Technology terminate during the term of this Agreement, you may continue to use the Software. Any provisions of this license which could reasonably be deemed to do so would then protect the University and/or the U.S. Government; and (c) The University has no obligation to furnish any know-how, technical assistance, or technical data to users of MrSID software and makes no warranty or representation as to the validity of U.S. Patent 5,710,835 nor that the MrSID Software will not infringe any patent or other proprietary right. For further information about these provisions, contact LizardTech, 1008 Western Ave., Suite 200, Seattle, WA 98104.
ERDAS, ERDAS IMAGINE, IMAGINE OrthoBASE, Stereo Analyst and IMAGINE VirtualGIS are registered trademarks; IMAGINE OrthoBASE Pro is a trademark of ERDAS, Inc.
SOCET SET is a registered trademark of BAE Systems Mission Solutions.
Other companies and products mentioned herein are trademarks or registered trademarks of their respective owners.

iii

iv

v
Table of ContentsTable of Contents . . . . . . . . . . . . . . . . . . . . . . . . . . . . . . . v
List of Tables . . . . . . . . . . . . . . . . . . . . . . . . . . . . . . . . . . ix. . . . . . . . . . . . . . . . . . . . . . . . . . . . . . . . . . . . . . . . . .x
Introduction . . . . . . . . . . . . . . . . . . . . . . . . . . . . . . . . . . 1IMAGINE Subpixel Classifier . . . . . . . . . . . . . . . . . . . .1
Benefits to Your Organization . . . . . . . . . . . . . . . . . . .1
Unique Features . . . . . . . . . . . . . . . . . . . . . . . . . . . . .2
Multispectral Processing . . . . . . . . . . . . . . . . . . . . . . .3
Subpixel Classification . . . . . . . . . . . . . . . . . . . . . . . .4
Subpixel Classifier Theory . . . . . . . . . . . . . . . . . . . . . .6
Applications . . . . . . . . . . . . . . . . . . . . . . . . . . . . . . .10Crop Detection . . . . . . . . . . . . . . . . . . . . . . . . . . . . . . . . 11Fuel Spill Detection . . . . . . . . . . . . . . . . . . . . . . . . . . . . . 11Wetlands Identification . . . . . . . . . . . . . . . . . . . . . . . . . . 11Waterway Mapping . . . . . . . . . . . . . . . . . . . . . . . . . . . . . 11
Conventions Used in this Book. . . . . . . . . . . . . . . . . .12
Getting Started with the Software . . . . . . . . . . . . . . . . . . . 13Integration with ERDAS IMAGINE . . . . . . . . . . . . . . .13
Data Quality Assurance . . . . . . . . . . . . . . . . . . . . . . .13
Guidelines for Data Entry . . . . . . . . . . . . . . . . . . . . .15
Running Time . . . . . . . . . . . . . . . . . . . . . . . . . . . . . .16
Tutorial . . . . . . . . . . . . . . . . . . . . . . . . . . . . . . . . . . .17
On-Line Help . . . . . . . . . . . . . . . . . . . . . . . . . . . . . . .17
Using IMAGINE Subpixel Classifier . . . . . . . . . . . . . . . . . . . 19Starting a Session . . . . . . . . . . . . . . . . . . . . . . . . . . .19
Process Flow . . . . . . . . . . . . . . . . . . . . . . . . . . . . . . .20Quality Assurance (optional) . . . . . . . . . . . . . . . . . . . . . . 21Preprocessing (required) . . . . . . . . . . . . . . . . . . . . . . . . . 21Environmental Correction (required) . . . . . . . . . . . . . . . . . 21Signature Derivation (required) . . . . . . . . . . . . . . . . . . . . 21Signature Combiner (optional) . . . . . . . . . . . . . . . . . . . . . 22Signature Evaluation and Refinement (optional) . . . . . . . . . 22MOI Classification (required) . . . . . . . . . . . . . . . . . . . . . . 22Scene-To-Scene Processing . . . . . . . . . . . . . . . . . . . . . . . 23
Quality Assurance . . . . . . . . . . . . . . . . . . . . . . . . . . .24Quality Assurance Utility Operational Steps . . . . . . . . . . . . 26Artifact Removal Utility Operational Steps . . . . . . . . . . . . . 28
Preprocessing . . . . . . . . . . . . . . . . . . . . . . . . . . . . . .29

vi
Operational Steps . . . . . . . . . . . . . . . . . . . . . . . . . . . . . . 30
Automatic Environmental Correction . . . . . . . . . . . . .31Operational Steps . . . . . . . . . . . . . . . . . . . . . . . . . . . . . . 31Guidelines for Selecting Clouds, Haze, and Shadows . . . . . . 36Evaluation and Refinement of Environmental Correction . . . 38
Signature Derivation . . . . . . . . . . . . . . . . . . . . . . . . .39Signature Development Strategy . . . . . . . . . . . . . . . . . . . 40Defining a Training Set . . . . . . . . . . . . . . . . . . . . . . . . . . 42Manual Signature Derivation . . . . . . . . . . . . . . . . . . . . . . 43Automatic Signature Derivation . . . . . . . . . . . . . . . . . . . . 52
Signature Combiner . . . . . . . . . . . . . . . . . . . . . . . . .61Using Signature Families . . . . . . . . . . . . . . . . . . . . . . . . . 61Components of Multiple Signature Files . . . . . . . . . . . . . . . 62Operational Steps . . . . . . . . . . . . . . . . . . . . . . . . . . . . . . 65
Signature Evaluation and Refinement . . . . . . . . . . . .67Signature Evaluation Only (SEO) . . . . . . . . . . . . . . . . . . . 68Operational Steps for SEO . . . . . . . . . . . . . . . . . . . . . . . . 69Signature Refinement and Evaluation (SRE) . . . . . . . . . . . . 71Operational Steps for SRE . . . . . . . . . . . . . . . . . . . . . . . . 73
MOI Classification . . . . . . . . . . . . . . . . . . . . . . . . . . .75Scene-to-Scene Processing . . . . . . . . . . . . . . . . . . . . . . . 76Operational Steps . . . . . . . . . . . . . . . . . . . . . . . . . . . . . . 77MOI Classification Results . . . . . . . . . . . . . . . . . . . . . . . . 81
Beyond Classification . . . . . . . . . . . . . . . . . . . . . . . .83Using the Raster Attribute Editor . . . . . . . . . . . . . . . . . . . 84Georeferencing . . . . . . . . . . . . . . . . . . . . . . . . . . . . . . . . 84Map Composer . . . . . . . . . . . . . . . . . . . . . . . . . . . . . . . . 85GIS Processing . . . . . . . . . . . . . . . . . . . . . . . . . . . . . . . . 86Recoding . . . . . . . . . . . . . . . . . . . . . . . . . . . . . . . . . . . . 86Image Interpreter . . . . . . . . . . . . . . . . . . . . . . . . . . . . . . 86
Tutorial . . . . . . . . . . . . . . . . . . . . . . . . . . . . . . . . . . . . . 89Starting IMAGINE Subpixel Classifier . . . . . . . . . . . .89
Preprocessing . . . . . . . . . . . . . . . . . . . . . . . . . . . . . .91
Automatic Environmental Correction . . . . . . . . . . . . .91
Manual Signature Derivation . . . . . . . . . . . . . . . . . . .93
MOI Classification . . . . . . . . . . . . . . . . . . . . . . . . . . .96
Viewing Verification Files . . . . . . . . . . . . . . . . . . . . 101
Classification Results . . . . . . . . . . . . . . . . . . . . . . . 102Area A: Training Site . . . . . . . . . . . . . . . . . . . . . . . . . . . 102Areas B and C: Grass Lawns in the Airport Complex . . . . . 102Results Compared to Traditional Classifier Results . . . . . . 102Summary . . . . . . . . . . . . . . . . . . . . . . . . . . . . . . . . . . 103
Tips on Using IMAGINE Subpixel Classifier . . . . . . . . . . . . 105Use NN Resampled Imagery . . . . . . . . . . . . . . . . . . 105
Sensors. . . . . . . . . . . . . . . . . . . . . . . . . . . . . . . . . . 105
Data Entry Guidelines . . . . . . . . . . . . . . . . . . . . . . . 106

vii
Tips for Increasing Processing Speed . . . . . . . . . . . 106
Whole Pixel Selection Strategies . . . . . . . . . . . . . . . 107
Analysis and Interpretation Approaches . . . . . . . . . 107Evaluating Material Pixel Fraction information . . . . . . . . . 107Multiple Signature Approach to improve accuracy . . . . . . . 108Combining Classification Results . . . . . . . . . . . . . . . . . . . 108Post-processing Schemes . . . . . . . . . . . . . . . . . . . . . . . 108
Signature Strategy/Training Sets . . . . . . . . . . . . . . 108
Tolerance . . . . . . . . . . . . . . . . . . . . . . . . . . . . . . . . 109
DLA Filter . . . . . . . . . . . . . . . . . . . . . . . . . . . . . . . . 109
Other Facts to Know . . . . . . . . . . . . . . . . . . . . . . . . 109
Troubleshooting . . . . . . . . . . . . . . . . . . . . . . . . . . . . . . 111Helpful Advice For Troubleshooting . . . . . . . . . . . . . 111
Error Message Tables . . . . . . . . . . . . . . . . . . . . . . . 111
Interface with ERDAS IMAGINE . . . . . . . . . . . . . . . . . . . . 115Viewer . . . . . . . . . . . . . . . . . . . . . . . . . . . . . . . . . . 115
Open Raster Layer. . . . . . . . . . . . . . . . . . . . . . . . . . 116
Raster Options . . . . . . . . . . . . . . . . . . . . . . . . . . . . 116
Arrange Layers . . . . . . . . . . . . . . . . . . . . . . . . . . . . 116
Raster Attribute Editor . . . . . . . . . . . . . . . . . . . . . . 116Changing Colors . . . . . . . . . . . . . . . . . . . . . . . . . . . . . . 116Making Layers Transparent . . . . . . . . . . . . . . . . . . . . . . 116
AOI Tools . . . . . . . . . . . . . . . . . . . . . . . . . . . . . . . . 117
Histogram Tools . . . . . . . . . . . . . . . . . . . . . . . . . . . 117
View Zoom . . . . . . . . . . . . . . . . . . . . . . . . . . . . . . . 117
Glossary . . . . . . . . . . . . . . . . . . . . . . . . . . . . . . . . . . . 119
Index . . . . . . . . . . . . . . . . . . . . . . . . . . . . . . . . . . . . . 121

viii

ix
List of TablesTable 1: File Naming Conventions . . . . . . . . . . . . . . . . . . . . . . . . . . . . . . . . . . . . . 16Table 2: IMAGINE Subpixel Classifier Functions . . . . . . . . . . . . . . . . . . . . . . . . . . . 23Table 3: Sample Signature Database Report . . . . . . . . . . . . . . . . . . . . . . . . . . . . . . 50Table 4: Sample Signature Description Document File . . . . . . . . . . . . . . . . . . . . . . . 51Table 5: Sample of a Multi-Scene File . . . . . . . . . . . . . . . . . . . . . . . . . . . . . . . . . . 56Table 6: Sample Automatic Signature Derivation Report File . . . . . . . . . . . . . . . . . . . 60Table 7: Example Signature Description Document File . . . . . . . . . . . . . . . . . . . . . . 63Table 8: Sample Signature Evaluation Report . . . . . . . . . . . . . . . . . . . . . . . . . . . . . 71Table 9: Sample Signature Refinement and Evaluation Report . . . . . . . . . . . . . . . . . . 75Table 10: Material Pixel Fraction Class Range . . . . . . . . . . . . . . . . . . . . . . . . . . . . . 78Table 11: Input Files and Verification Files for Tutorial . . . . . . . . . . . . . . . . . . . . . . . 90Table 12: Recommended Sensor Formats . . . . . . . . . . . . . . . . . . . . . . . . . . . . . . . 105Table 13: General Errors . . . . . . . . . . . . . . . . . . . . . . . . . . . . . . . . . . . . . . . . . . 111Table 14: Processing Errors . . . . . . . . . . . . . . . . . . . . . . . . . . . . . . . . . . . . . . . . 112

x

1Introduction
IntroductionThis chapter presents an overview of IMAGINE Subpixel Classifier™ software. It discusses the functions of the software and the benefits your organization may realize by using it. The unique features of this software, compared with traditional classification tools, are described. A brief introduction to multispectral processing and subpixel classification is included and several application examples are given. Finally, the conventions used in this document are introduced.
IMAGINE Subpixel Classifier
IMAGINE Subpixel Classifier is an advanced image exploitation tool designed to detect materials that are smaller than an image pixel, using multispectral imagery. It is also useful for detecting materials that cover larger areas but are mixed with other materials that complicate accurate classification. It is a powerful, low cost alternative to ground surveys, field sampling, and high-resolution imagery. It addresses the “mixed pixel problem” by successfully identifying a specific material when materials other than the one you are looking for are combined in a pixel. It discriminates between spectrally similar materials, such as individual plant species, specific water types, or distinctive man-made materials. It allows you to develop spectral signatures that are scene-to-scene transferable.
IMAGINE Subpixel Classifier is part of ERDAS IMAGINE® Professional software. It can be used with imagery from any 8-bit or 16-bit airborne or satellite multispectral imaging platform. Currently, the most common sensor used is the Landsat Thematic Mapper (TM). SPOT Multispectral (XS), DigitalGlobe QuickBird, and Space Imaging’s IKONOS imagery are also widely used data sources. The software can also be used with hyperspectral imagery. It is not designed for use with panchromatic or radar imagery.
IMAGINE Subpixel Classifier contains five major modules: Preprocessing, Environmental Correction, Signature Derivation, Signature Refinement, and Material of Interest (MOI) Classification. In addition, two Data Quality Assurance utilities are included for handling artifacts within Landsat imagery. Each of these modules is described in detail in “Using IMAGINE Subpixel Classifier” on page 19 of this document. The end result of the process is a classification image that can be viewed and manipulated using ERDAS IMAGINE functions.
You can generate a table reporting the number of whole and subpixel occurrences of the MOI using the ERDAS IMAGINE raster attribute editor. Material fractions are reported, in addition to the number of detections estimated to contain the MOI. The map coordinates of the MOI locations can also be reported using the ERDAS IMAGINE image rectification tools.
Benefits to Your Organization
Some advantages of using IMAGINE Subpixel Classifier include:

2 Introduction
• Classifies objects that are smaller than the spatial resolution of the sensor
• Identifies specific materials in mixed pixels
• Creates purer spectral signatures
• Can be used for many types of applications
• Develops scene-to-scene transferable spectral signatures, even at different times of the day and year
• Enables searches over wide geographic areas
IMAGINE Subpixel Classifier will enable you to improve the accuracy of your classification projects by making more complete detections. It offers you higher levels of spectral discrimination and classification accuracy by detecting MOIs even when other materials are present in the pixel. By applying an entirely different approach to background removal and signature development than used by traditional whole-pixel classifiers, IMAGINE Subpixel Classifier can detect and classify small, isolated MOIs in images with coarse resolution, using sensors previously unable to detect these MOIs.
Unique Features IMAGINE Subpixel Classifier provides unique capabilities to detect and classify MOIs on the subpixel level. It directly addresses and overcomes the limitations of other processes in addressing the “mixed pixel problem.” Whether the application involves the detection of small MOIs in isolated pixels or the classification of large regions spanning thousands of pixels, the mixed pixel problem can have a devastating impact on classification performance.
Unique features of IMAGINE Subpixel Classifier include:
• Multispectral detection of subpixel MOIs
• The detection and classification of materials that occupy as little as 20% of a pixel
• Detection based on spectral properties, not spatial properties
• Scene-to-scene signature transfer
For example, consider a pixel containing two different species of trees, tupelo (Nyssa aquatica) and cypress (Taxodium distichum). The two species have not been successfully discriminated using traditional tools due to forest debris, grasses, and other ground features visible through the tree crowns. To achieve discrimination between the two species, the unique spectral characteristics of each species must be identified and background materials must be properly removed from the composite pixel spectra.

3Introduction
IMAGINE Subpixel Classifier can characterize the background spectral properties for each pixel in a scene. It then subtracts the background from each pixel and compares the residual spectrum to the reference signature to determine acceptance or rejection as a detection. The residual spectrum after removal of the background is a relatively pure representation of the MOI.
Another unique feature of IMAGINE Subpixel Classifier is its Automatic Environmental Correction capability. This feature calculates an atmospheric correction factor and a solar correction factor for a satellite or airborne image to normalize atmospheric effects, which vary with the time of the day, season of the year, and local weather conditions when the image is collected. These correction factors are applied to the image during signature derivation and scene classification. They allow MOI signatures derived from one scene to be applied to scenes collected on different dates and in different geographic locations. Thus, MOI signatures can often be used with other scenes. This is known as scene-to-scene transferability.
The IMAGINE Subpixel Classifier signature generation process is made more automated and more accurate by using a technology called Automated Parameter Selection (APS). This technology makes it easier to generate a high-quality signature from a training set consisting of a subpixel MOI.Another advanced feature, Adaptive Signature Kernel (ASK) technology, allows you to create signature families that more accurately represent variations in materials, particularly when taking signatures scene-to-scene. This technology is used during Signature Evaluation and Refinement.
Multispectral Processing
Multispectral imagery is defined as data collected from two or more regions or bands of the electromagnetic spectrum at the same time by the same sensor. The sensor detects and measures reflections and emissions from the earth in the ultraviolet, visible, and infrared portions of the electromagnetic spectrum. The amount and type of radiation emitted or reflected is directly related to an object’s surface characteristics.
For example, the Landsat TM has seven detectors to record seven different spectral measurements for each pixel, creating seven different images with the collected data. The QuickBird and IKONOS satellites collect four-band multispectral images. Specific bands may be selected to emphasize desired features. These bands are spatially registered, that is, the pixel area covered by each band is the same.
Using spatially registered data is important when working with IMAGINE Subpixel Classifier.

4 Introduction
In the visible spectrum, energy in the blue region (0.40 to 0.50 microns) illuminates material in shadows, is absorbed by chlorophyll, and penetrates very clear water to a depth of about 40 meters. Energy in the green region (0.50 to 0.60 microns) penetrates water to about 13 meters, provides a contrast between clear and turbid water, discriminates oil on water, and is reflected by vegetation. Energy in the red region (0.60 to 0.70 microns) is useful for vegetation discrimination, soils discrimination, and urban features analysis.
Important features such as disturbed soils, vegetation, and water absorption are more easily detected using data collected in the infrared bands. Near infrared (NIR) reflectance (0.70 to 1.1 microns) is strongly affected by the cellular structure of leaf tissue and is used for vegetation analysis. NIR is useful for shoreline mapping since it can emphasize the contrast between water absorption and vegetation reflectance. It can also be used to distinguish between coniferous and deciduous vegetation.
Short wave infrared (SWIR) energy (1.1 to 3.0 microns) discriminates oil on water, detects moisture of soil and vegetation, and provides contrast between vegetation types. It is also useful for discriminating snow from clouds. Long wave infrared (LWIR) energy (5.0 to 14.0 microns) is used for thermal analysis, especially for obtaining temperatures. Emissivity differences may be useful in identifying MOIs.
The amount of energy detected by a sensor is not the same as the energy actually reflected by the MOI. Atmospheric scattering, absorption by water vapor, carbon dioxide, and ozone, and absorption by surface materials, as well as the efficiency of the sensor, all influence what the sensor receives. These conditions vary with the time of day, season of year, level of atmospheric haze, and other atmospheric conditions present when the image is collected. Therefore, environmental corrections must be made to compensate for these conditions. IMAGINE Subpixel Classifier can be used to calculate a set of correction factors for an image, and apply them to the image prior to signature derivation and scene classification. This allows MOI signatures derived from one scene to be applied to scenes collected on different dates or from different geographic locations. IMAGINE Subpixel Classifier spectral signatures are thus scene-to-scene transferable.
Subpixel Classification
IMAGINE Subpixel Classifier is capable of detecting and identifying materials covering an area as small as 20% of a pixel. This greatly improves your ability to discriminate MOIs from other materials, and enables you to perform wide area searches quickly to detect small or large features mixed with other materials. Subpixel classification represents a major breakthrough in image analysis.

5Introduction
Prior to the availability of IMAGINE Subpixel Classifier, image analysts and classification specialists could use only high-resolution imagery to detect difficult to classify MOIs such as small rivers or materials intermixed with others. However, high-resolution typically implies that the ground area covered by the sensor is relatively small. With IMAGINE Subpixel Classifier, low-resolution imagery can effectively be used to search a broader area.
Regardless of the sensor pixel size there will always be instances where the MOI makes up a fraction of the pixel size, whether it is 30 meter Landsat TM imagery or 4 meter Ikonos imagery. Finding subpixel occurrences of the MOI is difficult if not impossible with traditional classifiers. IMAGINE Subpixel Classifier’s classification process removes the background (other materials in the pixel) to arrive at a spectrum for the MOI that indicates its presence. This subpixel capability enables you to perform wide area searches with relatively low-resolution satellite and airborne data. Subpixel classification is also useful for MOIs that overlap into neighboring pixels.
The primary difference between IMAGINE Subpixel Classifier and traditional classifiers is the way in which signatures are derived from training sets and applied during classification. Traditional classifiers typically form a signature by combining the spectra of all training set pixels for a given feature. The resulting signature contains the contributions of all materials present in the training set pixels. In contrast, IMAGINE Subpixel Classifier derives a signature for the component that is common to the training set pixels (the MOI). This signature is therefore “purer” for a specific material and can more accurately detect the MOI.
IMAGINE Subpixel Classifier and traditional classifiers perform best under different conditions. IMAGINE Subpixel Classifier may work better to discriminate among species of vegetation, distinctive building materials, or specific types of rock or soil. Traditional classifiers may be preferred when the MOI is composed of a spectrally varied range of materials that must be included as a single classification unit. For example, a forest that contains a large number of spectrally distinct materials and spans multiple pixels in size may be classified better as “forest” using a minimum distance classifier. IMAGINE Subpixel Classifier could be used to search for subpixel occurrences of specific species of vegetation within that forest.
IMAGINE Subpixel Classifier is designed to work with raw unsigned 8-bit and 16-bit imagery. It is not necessary to convert the image data to radiance or reflectance units prior to processing. Signed data may be used, but all of the image data should be positive. Negative image data values will likely produce error messages and problems with the classification results. Floating point data and panchromatic data are not supported.

6 Introduction
Subpixel Classifier Theory
IMAGINE Subpixel Classifier is capable of detecting and identifying materials covering an area as small as 20% of a pixel. This greatly improves your ability to discriminate MOIs from other materials, and enable you to perform wide area searches quickly to detect small or large features mixed with other materials. This section describes the theory behind how Subpixel Classifier works and provides insight into when and how the software should be used.
Consider the figure at left which shows the ground area covered by the instantaneous field of view (IFOV) of the sensor at the time the image is acquired. For frame-capture sensors this can be considered the area covered by one pixel. For simplicity, consider that the land area covered by the pixel consists of two materials, one being the material of interest and the other a background material which could be
a mixture of several separate materials, but the mixture is considered one material.
The MOI has reflectance R1(λ) and covers area A1. The background material (mixture) has reflectance R2(λ) and covers area A2 such that A1+ A2 = A, the total area of the pixel. The incident irradiance on the pixel is I0(λ) and the upwelling radiance reflected by the pixel is I1(λ). The pixel radiance is a mixture of the radiance due to the two materials, as in
Introducing the material pixel fraction, k, such that A1=kA, the radiance becomes
Following atmospheric and sensor gain/offset correction, the pixel intensity P(λ) is proportional to the upwelling radiance so that
where S(λ)=R1(λ) is the MOI signature and B(λ)=R2(λ) is the background spectrum.
I0 I1
R1(λ)A1
R2(λ)A2
I0 I1
R1(λ)A1
R2(λ)A2
( )A
A)(RA)(R)(I)(I 221101
λ+λλ=λ
( ) ( ))(R)(I)k()(R)(Ik)(I λλ−+λλ=λ 20101 1
)(B)k()(Sk)(P λ×−+λ×=λ 1

7Introduction
The Subpixel Classifier signature derivation process derives a signature spectrum S(λ) from a set of training pixels. The software also estimates a set of potential background spectra Bi(λ). The subpixel classification process then attempts to find the correct background B(λ) and the associated correct material pixel fraction k that would produce the observed pixel intensity.
In order to find the correct background to subtract and the proper material pixel fraction, the software performs a number of steps. The first step, called Preprocessing, is to identify a representative set of background spectra in the image. This step is now performed as part of the Environmental Correction process and is transparent to you. The Preprocessing step performs an unsupervised, maximum likelihood classification of the image and divides the image into up to 64 background classes. Each background class mean spectrum is a candidate background spectrum to evaluate during classification. In addition to these general background spectra, the classification process also considers the eight local neighbors of the pixel being classified.
The Environmental Correction step in the process estimates a set of band-wise offset and scale factors that compensate for atmospheric path radiance and sensor offset as well as atmospheric scattering and sensor gain. These factors are applied to the pixel spectrum as follows:
During classification, the software computes a set of residuals from each of the background spectra (general backgrounds and local neighbors) and various fractions using the following formula:
The correct residual should be very similar to the signature spectrum S(λ). The process is thus one of finding the background spectrum and fraction that produce the residual that is closest to the signature spectrum.
( ) )n(SCF)n(ACF)n(P)n(P −=′
k)n(B)k()n(P)n(R
)n(B)k()n(Rk)n(P−−′
=
−+⋅=′
11
8 Introduction
However, in reality, materials present a range of appearances and Subpixel Classifier tries to accommodate that variability. Sometimes a material is slightly brighter or less bright and its spectral shape can vary due to sensor noise and material variability. Subpixel Classifier signatures contain additional information to help accommodate that variability. Based on the training set used to derive the signature, the process stores additional spectral representations of the material in addition to the mean signature. These representations are considered known variations of the material and can range from a handful to several thousand, depending on the training set. During classification, additional representations are created by mixing the signature into sampled pixels from throughout the image, in a process called doping. This process generates several thousand more representations of what the signature might look like in the scene.
In order to reduce the number of residuals examined, a set of filters are first applied to the residuals to reduce the number actually compared to the signature spectrum. The first filter is an average brightness filter (RAU filter). This avoids having to compare dark water to bright concrete, for example. A brightness range is established for each signature based on the training set variability and the brightness range in the doped pixel spectra. Only those candidate residuals whose mean intensity falls within the RAU range are considered as possible candidates.
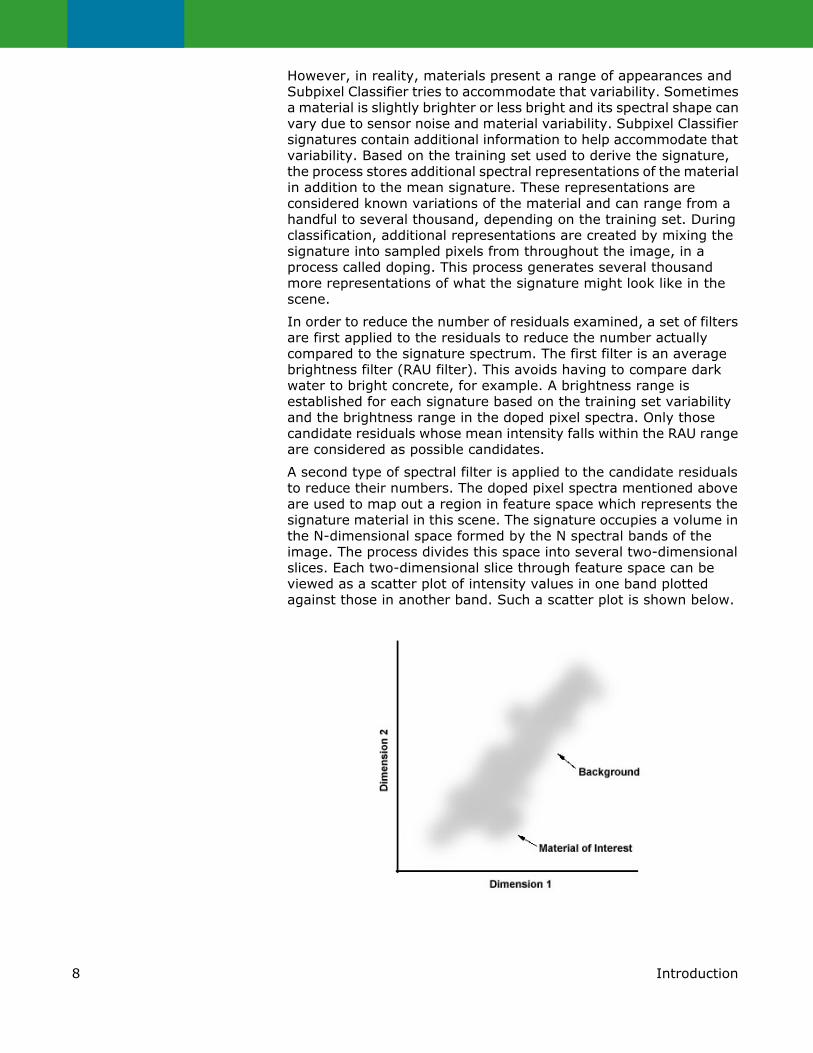
A second type of spectral filter is applied to the candidate residuals to reduce their numbers. The doped pixel spectra mentioned above are used to map out a region in feature space which represents the signature material in this scene. The signature occupies a volume in the N-dimensional space formed by the N spectral bands of the image. The process divides this space into several two-dimensional slices. Each two-dimensional slice through feature space can be viewed as a scatter plot of intensity values in one band plotted against those in another band. Such a scatter plot is shown below.
9Introduction
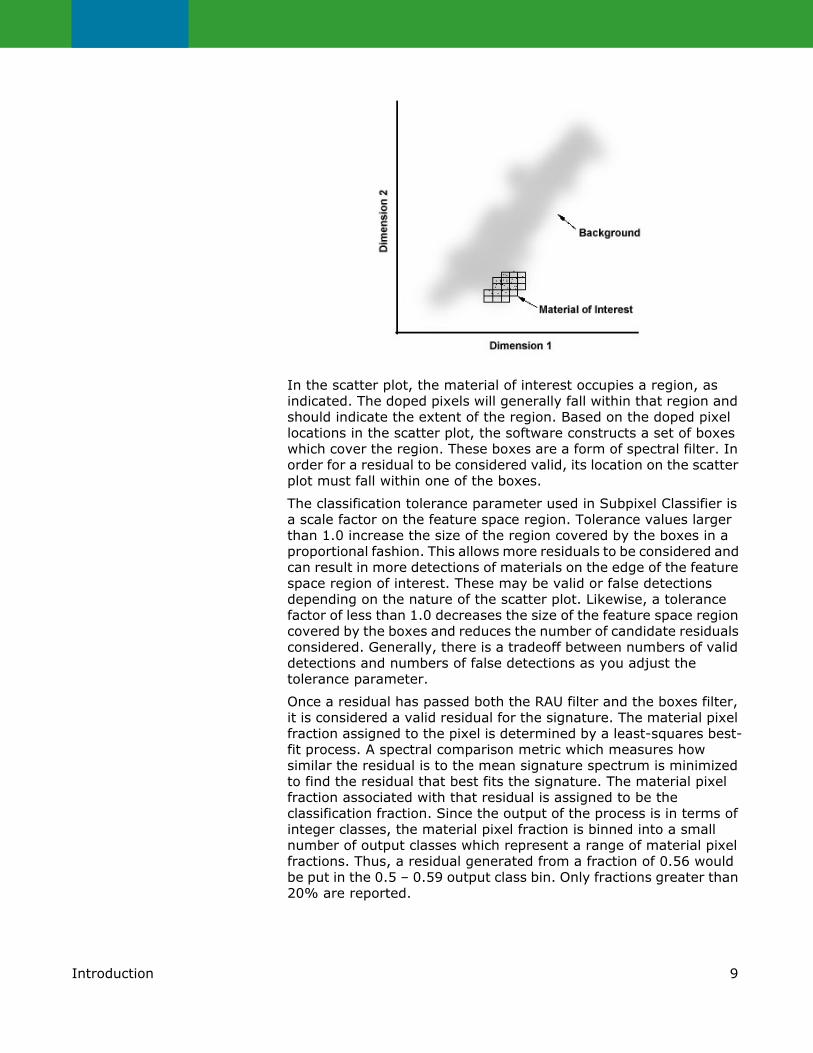
In the scatter plot, the material of interest occupies a region, as indicated. The doped pixels will generally fall within that region and should indicate the extent of the region. Based on the doped pixel locations in the scatter plot, the software constructs a set of boxes which cover the region. These boxes are a form of spectral filter. In order for a residual to be considered valid, its location on the scatter plot must fall within one of the boxes.
The classification tolerance parameter used in Subpixel Classifier is a scale factor on the feature space region. Tolerance values larger than 1.0 increase the size of the region covered by the boxes in a proportional fashion. This allows more residuals to be considered and can result in more detections of materials on the edge of the feature space region of interest. These may be valid or false detections depending on the nature of the scatter plot. Likewise, a tolerance factor of less than 1.0 decreases the size of the feature space region covered by the boxes and reduces the number of candidate residuals considered. Generally, there is a tradeoff between numbers of valid detections and numbers of false detections as you adjust the tolerance parameter.
Once a residual has passed both the RAU filter and the boxes filter, it is considered a valid residual for the signature. The material pixel fraction assigned to the pixel is determined by a least-squares best-fit process. A spectral comparison metric which measures how similar the residual is to the mean signature spectrum is minimized to find the residual that best fits the signature. The material pixel fraction associated with that residual is assigned to be the classification fraction. Since the output of the process is in terms of integer classes, the material pixel fraction is binned into a small number of output classes which represent a range of material pixel fractions. Thus, a residual generated from a fraction of 0.56 would be put in the 0.5 – 0.59 output class bin. Only fractions greater than 20% are reported.

10 Introduction
The above discussion illustrates several important points regarding how Subpixel Classifier works and what to expect from the software. For example, if your training set contains spectrally similar materials with little variability, the resulting feature space may be quite small. This will allow you to make very fine discrimination between spectrally similar materials, but the process may not detect some variations of the material of interest or it may not fill in material areas to the extent expected. Increasing the classification tolerance can help in that case.
Also, if the number of training set pixels is small, the region in feature space covered by the boxes may be irregularly shaped. This can result in unexpected behavior. For example, the software may detect one set of pixels, but not a spectrally similar set of pixels. Increasing the classification tolerance may help, but redefining the training set may be a better approach. The main point is that you want a training set that represents the range of signature diversity that you want to detect. You are not necessarily interested in finding the purest representation of the material in your training set. Subpixel signature derivation will find pure representations of the mean signature, but you also want to map out the region in feature space that contains your material of interest. The extent to which the material of interest blends in with other materials in feature space will determine how distinguishable that material is from other materials.
In some cases multiple signatures may be required to fully detect all the variations in a material. If the feature space for the material is complex and disjoint, multiple signatures can better cover the various areas in feature space and still provide a very discriminating material detection.
In summary, IMAGINE Subpixel Classifier and traditional classifiers perform best under different conditions. IMAGINE Subpixel Classifier may work better to discriminate among species of vegetation, distinctive building materials, or specific types of rock or soil. Traditional classifiers may be preferred when the MOI is composed of a spectrally varied range of materials that must be included as a single classification unit. For example, a forest that contains a large number of spectrally distinct materials and spans multiple pixels in size may be classified better using a minimum distance classifier. IMAGINE Subpixel Classifier could be used to search for subpixel occurrences of specific species of vegetation within that forest.
Applications IMAGINE Subpixel Classifier has been applied to solve problems in the fields of agriculture, environmental analysis, waterway mapping, and national defense. Some examples of successfully completed projects are described below.

11Introduction
Crop Detection A seed producer was looking for a method to more accurately assess acreage and monitor cultivation of a specific crop found in different parts of the world. This crop is often planted in remote areas interspersed over large tracts of land. Discriminating this crop from other crops is very difficult. Ground survey over such large, remote areas is nearly impossible. High resolution airborne imagery is prohibitively expensive. The software had to be able to process scenes in mixed environments in many different countries.
IMAGINE Subpixel Classifier was able to use satellite images to accurately identify the locations of the crop using a pair of reference signatures, one leaf oriented and the other stem oriented. Its Environmental Correction feature allowed portability of spectral signatures of the MOI to scenes in Texas, Kansas, Mexico, and Brazil over a four year period.
Fuel Spill Detection Jet fuel was accidently spilled at a large airfield. Fuel had seeped into the soil in several locations. The airfield owner wanted to know if there were additional contaminated sites on the base. Access to the area was limited and historical records were incomplete. The budget was low and results were needed quickly. Ground survey and high resolution imagery methods were too expensive and time consuming.
The hydrocarbon residue of the spilled fuel altered the spectral signatures of the soil, tarmac, and other building materials. Utilizing a Landsat TM scene, IMAGINE Subpixel Classifier was able to detect seven potential spill sites on the tarmac, on the runway, in the soil, and at a marine repair facility. Most of the detected sites were confirmed by on-site inspection.
Wetlands Identification Researchers were interested in finding a way to identify wetlands in a forested area of rural South Carolina under development pressure. Cypress and Tupelo trees are wetland indicator species. If they could be identified, development plans could be modified at an early stage to avoid the strictly regulated wetland areas. Land cover classifiers cannot typically discriminate between different tree species. High-resolution aerial photography was not viable. Cypress and Tupelo are often found in a very mixed, complex forest environment, making species identification using panchromatic airborne or satellite imagery almost impossible.
IMAGINE Subpixel Classifier identified Cypress and Tupelo in this forest environment, allowing quick and accurate mapping of wetland areas. A detailed field verification study demonstrated detection accuracy near 90% for both species. IMAGINE Subpixel Classifier’s unique Environmental Correction feature allowed signatures used in processing this scene to be successfully applied to other scenes in South Carolina and Georgia.
Waterway Mapping The Tingo Maria area of Peru is a mountainous, inaccessible region. Waterways serve as a key element in the area’s transportation and communication network. Hundreds of miles of uncharted waterways exist in the region. The area is too vast and mountainous for airborne imagery to be collected and effectively used for mapping.

12 Introduction
IMAGINE Subpixel Classifier identified hundreds of miles of small rivers and streams using signatures derived from a large river in the area. Multiple training signatures were required to develop signatures for a range of depths and water quality conditions. Other spatial filtering and interpolation techniques were applied to compensate for an abundance of overhanging growth partially obstructing the waterways. The end product was a comprehensive waterway map for the region generated using Landsat TM imagery.
Conventions Used in this Book
In ERDAS IMAGINE, the names of menus, menu options, buttons, and other components of the interface are shown in bold type. For example:
“In the Select Layer To Add dialog, select the Fit to Frame option.”
When asked to use the mouse, you are directed to click, Shift-click, middle-click, right-click, hold, drag, etc.
• click—designates clicking with the left mouse button.
• Shift-click—designates holding the Shift key down on your keyboard and simultaneously clicking with the left mouse button.
• middle-click—designates clicking with the middle mouse button.
• right-click—designates clicking with the right mouse button.
• hold—designates holding down the left (or right, as noted) mouse button.
• drag—designates dragging the mouse while holding down the left mouse button.
The following paragraphs are used throughout the ERDAS IMAGINE documentation:
These paragraphs contain strong warnings.
These paragraphs contain important tips.
These paragraphs provide software-specific information.
These paragraphs lead you to other areas of this book or other ERDAS® manuals for additional information.
NOTE: Notes give additional instruction.

13Getting Started with the Software
Getting Started with the SoftwareThis chapter gives you the preliminary information you should know before using IMAGINE Subpixel Classifier. It discusses how the software is integrated with ERDAS IMAGINE and provides an introduction to the Data Quality Assurance function provided with IMAGINE Subpixel Classifier. Guidelines for data entry and tips on how to minimize processing time are also discussed. Finally, the Tutorial and On-line Help functions are introduced.
Integration with ERDAS IMAGINE
ERDAS IMAGINE is the industry leading geographic imaging software package that incorporates the functions of both image processing and geographic information systems (GIS). These functions include importing data, viewing images, creating training sets, and altering, overlaying, and analyzing raster and vector data sets.
IMAGINE Subpixel Classifier is tightly integrated with ERDAS IMAGINE to take advantage of its extensive image handling tools. The ERDAS IMAGINE tools most commonly used with IMAGINE Subpixel Classifier are:
• Viewer for Image Display
• Open Raster Layer
• Raster Options
• Arrange Layers
• Raster Attribute Editor
• Area of Interest (AOI) Tools
• Histogram Tools
• View Zoom
“Interface with ERDAS IMAGINE” on page 115 contains a discussion of these ERDAS IMAGINE functions.
Data Quality Assurance
Data integrity is critical to the accurate classification of MOIs. IMAGINE Subpixel Classifier includes two Quality Assurance utilities to enable you to insure that only valid data is processed. The Artifact Removal utility scans imagery for several types of artifacts and produces a clean image ready for processing. A second Quality Assurance utility specifically searches imagery for occurrences of Duplicate Line Artifacts (DLAs). Either utility can be used to prepare imagery for processing with IMAGINE Subpixel Classifier.
14 Getting Started with the Software
The IMAGINE Subpixel Classifier Artifact Removal utilitity may be used to remove several types of artifacts from Landsat TM imagery. The process takes an input image with artifacts and produces an output image with the artifact areas removed. The Artifact Removal process automatically detects and removes the following types of artifacts:
• edge artifacts
• saturated pixels
• peppered area artifacts
• duplicate line artifacts (DLAs)
Edge artifacts appear as a ragged, discolored edge along one side of the image. Edge artifact pixels contain at least one zero value in their spectra. They are typically located within about 30 pixels of the image edge.
Saturated pixels contain at least one spectral value that is equal to the maximum value allowed by the bit depth of the image data type. Note that it is possible for pixels to contain saturated values which are lower than the maximum value allowed. These are values at which the sensor has stopped responding to increasing brightness even though the maximum allowable data value has not been reached yet. This form of saturated pixel is not detected by the Artifact Removal utility.
Peppered area artifacts are small areas with an irregular spatial pattern of very high or very low values in one particular band. The spectral values in that band are very different from the surrounding area and give that area a distinctive appearance when the band is included as one of the display colors. Such areas are typically less than 20 pixels on a side and are scattered throughout the image. It is important to remove these areas since the anomalous band values can skew the environmental correction factors and lead to poor classification performance.
DLAs occur in older Landsat images when a row of recorded satellite information is duplicated during resampling to fill gaps in data. In Landsat 4 images, DLAs appear every 16 rows in bands 2 and 5 due to dead detectors. Other DLAs in Landsat 4 and 5 images are due to sensor vibration or scan mirror bumper wear. This wear extends the mirror's scanning period, leaving gaps of unrecorded data DLAs can be removed using the Artifact Removal utiltity or the Quality Assurance utility which applies to Signature Derivation only.
When DLAs occur in imagery being classified for MOIs, it is important that the overlay file generated by the Quality Assurance function be reviewed. Depending on the frequency and location of DLAs in an image, the integrity of the image or the classification results may be degraded.

15Getting Started with the Software
The Quality Assurance utility is important for evaluating Landsat TM imagery resampled using the nearest neighbor (NN) process. It generally is not necessary to use Quality Assurance on cubic convolution (CC) or bilinear interpolation (BI) resampled Landsat TM or SPOT imagery. These formats are discussed in “Tips on Using IMAGINE Subpixel Classifier” on page 105.
DLAs introduced during resampling are more easily recognized in NN resampled data than in CC or BI resampled data. For NN data, the DLAs generally appear as long, isolated pairs of rows (typically greater than 100 pixels in length). The DLAs are also generally periodic, separated by either 16, 32, 48, or 64 rows within an image plane (band). Closely spaced, short row segments in NN data are generally not valid DLAs, but rather they are the result of natural spatial homogeneity.
The valid DLAs are most easily recognized when quality assurance output is displayed one band at a time.
Valid DLAs are not as reliably identified in CC or BI data. The CC or BI resampling process artificially homogenizes data. The missing lines of data still exist and are artificially filled during the resampling process, as they are in NN data. They also generally occur every 16, 32, 48, or 64 rows, as in the NN data. However, extra artificial averaging introduced by CC or BI processing renders artificially duplicated data undetectable.
Although DLAs can still produce errors in the classification results and degrade training set quality, their presence cannot be reliably detected in CC or BI data because of extra averaging. The detected valid DLA features appear as short and disconnected row-pair segments, even though the entire row is a DLA.
Additionally, the artificial averaging causes more highlighted duplicated rows to appear in spatially homogeneous areas, such as water bodies and cloud tops. The increased abundance of these natural duplicated rows makes the recognition of valid DLAs in CC or BI data even more difficult. The principal characteristic to search for is the 16, 32, 48, or 64 row periodicity of DLA features, even though some DLA features appear as short, disconnected segments while other DLA features may be missing altogether.
Guidelines for Data Entry
Data necessary to perform IMAGINE Subpixel Classifier functions is entered via dialogs. An explanation of the type of information to enter is displayed at the bottom of the dialog. For example, if the cursor is positioned just below the words output signature file, the message name of output IMAGINE Subpixel Classifier signature database file is displayed at the bottom of the dialog.
These important data entry guidelines must be followed when using IMAGINE Subpixel Classifier.

16 Getting Started with the Software
IMAGINE Subpixel Classifier currently only accepts images in the IMAGINE .img format. To work with files in other formats, such as .lan, use the IMAGINE IMPORT/EXPORT option to convert imagery to .img format.
IMAGINE Subpixel Classifier is designed to work with raw unsigned 8-bit and 16-bit imagery. It is not necessary to convert the image data to radiance or reflectance units prior to processing. Signed data may be used, but all of the image data should be positive. Negative image data values will likely produce error messages and problems with the classification results. Floating point data and panchromatic data are not supported.
Running Time IMAGINE Subpixel Classifier’s core algorithm performs complex mathematical computations when deriving subpixel material signatures. Therefore, processing times may be longer than those of traditional classifiers. Running time can be accelerated by following the guidelines below.
1. Process subscenes of the larger image prior to final classification.
Table 1: File Naming Conventions
File Name Extensions Description
.aasap Output file from 'preprocessing'
.asd IMAGINE Subpixel Classifier signature database (asd) output file from 'signature derivation'
.atr Temporary output file generated when each IMAGINE Subpixel Classifier process is run
.ats IMAGINE Subpixel Classifier training set (ats) pixels used in developing a training signature
.corenv Output file from 'environmental correction'
.sch Processing history file
qa.img Output file from 'quality assurance'
.aoi IMAGINE AOI file
.img Sensor image or classification file; output file from IMAGINE Subpixel Classifier MOI Classification

17Getting Started with the Software
During Signature Derivation and refinement, for example, a 512 x 512 image is more than adequate. For MOI Classification, small AOI files defining the test areas should be used to evaluate a signature's performance. Process only those areas where results are needed. If looking for vegetation, for example, exclude large areas of water or clouds.
2. Limit the size of the training set used in Signature Derivation. It is quality, not quantity, that is important.
3. Process files on disk drives mounted on the same workstation as IMAGINE Subpixel Classifier. Accessing files across a network typically results in slower processing times.
The time to derive a IMAGINE Subpixel Classifier signature for a mean Material Pixel Fraction of .90 (whole pixel) is significantly less than that for a fraction less than .90 (subpixel). This is because subpixel signature derivation is considerably more CPU intensive than whole pixel signature derivation.
Tutorial “Tutorial” on page 89 contains a tutorial for IMAGINE Subpixel Classifier. The tutorial takes you step by step through the image processing sequence: Preprocessing, Environmental Correction, Signature Derivation, and MOI Classification. A SPOT 350 x 350 pixel multispectral image of Rome, New York is used to define a signature for grass. The signature is then applied to the entire image and detections are reviewed.
On-Line Help IMAGINE Subpixel Classifier uses the same On-Line Help system that IMAGINE does. Each dialog in IMAGINE Subpixel Classifier has a help button that takes you directly to the specific help page for that dialog. You can also use a table of contents, search, and browse topics.
Open the Help system by clicking the Help button in any function dialog or as follows:
1. Click the IMAGINE Subpixel Classifier icon in the toolbar.
The IMAGINE Subpixel Classifier main menu opens.

18 Getting Started with the Software
2. Click Utilities. The Utilities menu opens.
3. Click Help Contents to open the On-Line Help system.
19Using IMAGINE Subpixel Classifier
Using IMAGINE Subpixel ClassifierThis chapter explains in detail how to perform the main IMAGINE Subpixel Classifier functions: Quality Assurance, Preprocessing, Automatic Environmental Correction, Signature Derivation/Refinement, and MOI Classification. It discusses the results of the classification process and provides tips for additional uses of these results.
IMAGINE Subpixel Classifier functions allow you to prepare data, derive signatures, and classify imagery to locate Materials of Interest as characterized by their spectral signature.
See "Tutorial" to work through an exercise using IMAGINE Subpixel Classifier functions.
Starting a Session To begin using IMAGINE Subpixel Classifier do the following:
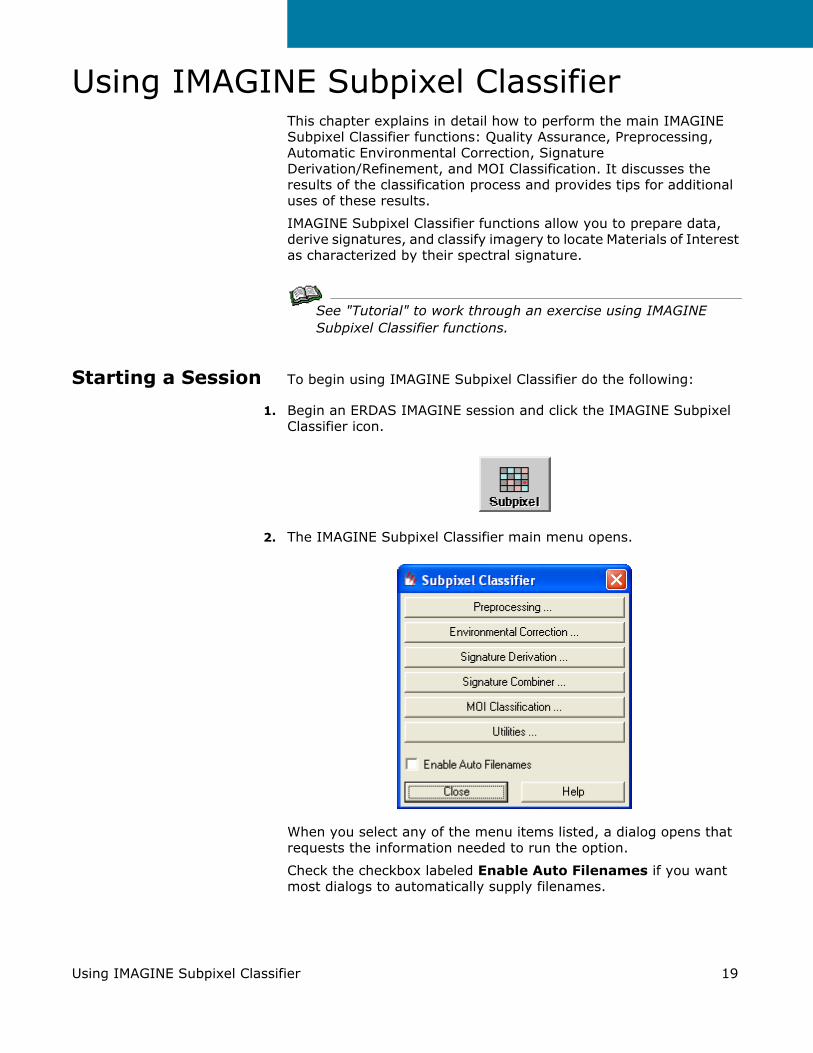
1. Begin an ERDAS IMAGINE session and click the IMAGINE Subpixel Classifier icon.
2. The IMAGINE Subpixel Classifier main menu opens.
When you select any of the menu items listed, a dialog opens that requests the information needed to run the option.
Check the checkbox labeled Enable Auto Filenames if you want most dialogs to automatically supply filenames.

20 Using IMAGINE Subpixel Classifier
When Enable Auto Filenames option is checked, the software creates and maintains a processing history file for each image processed. History file are text files and have the same name as the associated image except with the .sch extension. History files not only provide a record of what processing was done to a particular image file, but also provide a means of recalling the last file used.
In addition to recalling previously created intermediate files, the IMAGINE Subpixel Classifier dialogs will suggest output file names when the Automatic Filenames option is selected. These suggestions are based on a file naming convention that has been successfully used to manage the proliferation of files that often result when processing an image. With this option you can either accept the suggested file name, edit it, or completely override it. To disable this feature, uncheck the option box labeled Enable Auto Filenames.
Process Flow IMAGINE Subpixel Classifier is comprised of four required and three optional processing functions. The four required functions are:
• Preprocessing
• Environmental Correction
• Signature Derivation
• MOI Classification
Each plays an important role in the development and application of subpixel signature derivation and classification, and must be run in the order described here. The required functions appear as separate, executable functions from the IMAGINE Subpixel Classifier main menu.
If you already have a signature derived from another scene, then Signature Derivation is not required for the current scene. In that case you should generate a scene-to-scene Environmental Correction file, skip Signature Derivation, and proceed directly to Classification.
The optional processing functions are:
• Quality Assurance
• Signature Combiner
• Signature Refinement

21Using IMAGINE Subpixel Classifier
These provide advanced capabilities or handle special situations. The Quality Assurance function can be run at any time from the Utilities menu. Signature Refinement and Signature Combiner are used to generate families of signatures to more accurately characterize signature variability or scene-to-scene differences.
Quality Assurance (optional)
This function checks images for the occurrence of Duplicate Line Artifacts. Duplicate Line Artifacts (DLAs) are sometimes found in older satellite images. They occur when a row of recorded satellite information is duplicated during resampling to fill gaps in data. Depending on their frequency and location, DLAs may compromise the integrity of the image or the classification results.
Preprocessing (required) This function identifies a list of potential backgrounds used during the signature extraction and MOI classification functions. To derive a subpixel signature or detection, the software must remove other materials, leaving a candidate MOI spectrum. The backgrounds identified by preprocessing are retained in a separate file for this purpose.
Environmental Correction (required)
The Automatic Environmental Correction feature prepares imagery for Signature Derivation and MOI Classification by automatically generating a set of environmental correction factors. These correction factors are necessary for scene-to-scene transferability of MOI signatures as well as for development of in-scene signatures. Inputs include the image file name and the correction type (scene-to-scene or in-scene). The final output is a file containing environmental correction factors that are used as input to the Signature Derivation and MOI Classification functions. In-scene files are used for Signature Derivation and Classification within the same scene. Scene-to-scene files are used when classifying an image using a signature developed from another image.
Signature Derivation (required)
This function allows you to develop an IMAGINE Subpixel Classifier signature to be used in classifying an image. The signature is developed using a training set defined by ERDAS IMAGINE’s AOI tool from pixels in your source image.
The signature produced is specific to IMAGINE Subpixel Classifier and contains information used only in IMAGINE Subpixel Classifier classification.
There are two ways to derive a signature from a training set: Manual and Automatic Signature Derivation. You can use Manual Signature Derivation to develop a whole-pixel signature from a whole-pixel training set. You can also use Manual Signature Derivation to develop a signature from a subpixel training set when you are confident of the material pixel fraction in the training set. Normally it is best to use Automatic Signature Derivation to derive a signature from a subpixel training set.
22 Using IMAGINE Subpixel Classifier
Developing a high quality signature from a subpixel training set is often an iterative process of developing, testing, and refining the signature. Automatic Signature Derivation greatly simplifies this process by automating the process of generating and testing signatures created using different material pixel fractions in conjunction with your training set. This process creates sample signatures and uses MOI Classification to test these signatures using a measure of effectiveness applied to areas that you define. The process automatically identifies the five top performing signatures associated with different material pixel fractions in your training set.
Signature Combiner (optional)
This function allows you to combine two or more signatures developed from the IMAGINE Subpixel Classifier Signature Derivation process. A combined signature is useful when a single signature will not detect all the diverse elements of the material of interest. The output from the IMAGINE Subpixel Classifier Signature Evaluation and Refinement function can also be used as input to the Signature Combiner. With these tools you can develop a family of related signatures to use in MOI Classification.
Signature Evaluation and Refinement (optional)
Signature Evaluation and Refinement can be used to further improve the performance of your signatures, especially when using them scene-to-scene. This function has two options. The first option will evaluate existing signature files. If you have a multiple signature file created using the Signature Combiner, you can compare the performance of the individual signatures within this file, or you can compare the performance of separate signatures. This process generates a performance metric based on classification results within selected AOIs.
The second option will refine the input signature(s) and create a new .asd file to use as an input to MOI classification. This new signature is called a “child” signature and is said to be derived from a “parent” signature. This process allows you to evaluate the performance of child signatures in comparison with parent signatures.
MOI Classification (required)
This function applies a selected IMAGINE Subpixel Classifier signature to an image and generates an overlay image file. Inputs to this function include selection of the image, an environmental correction file, the signature, and a threshold tolerance number to control false detections. Output from the IMAGINE Subpixel Classifier classification function is an image overlay stored in an IMAGINE-format file. The overlay contains information on pixel fraction and the locations of the MOI. Classification results are displayed using an ERDAS IMAGINE Viewer.
23Using IMAGINE Subpixel Classifier
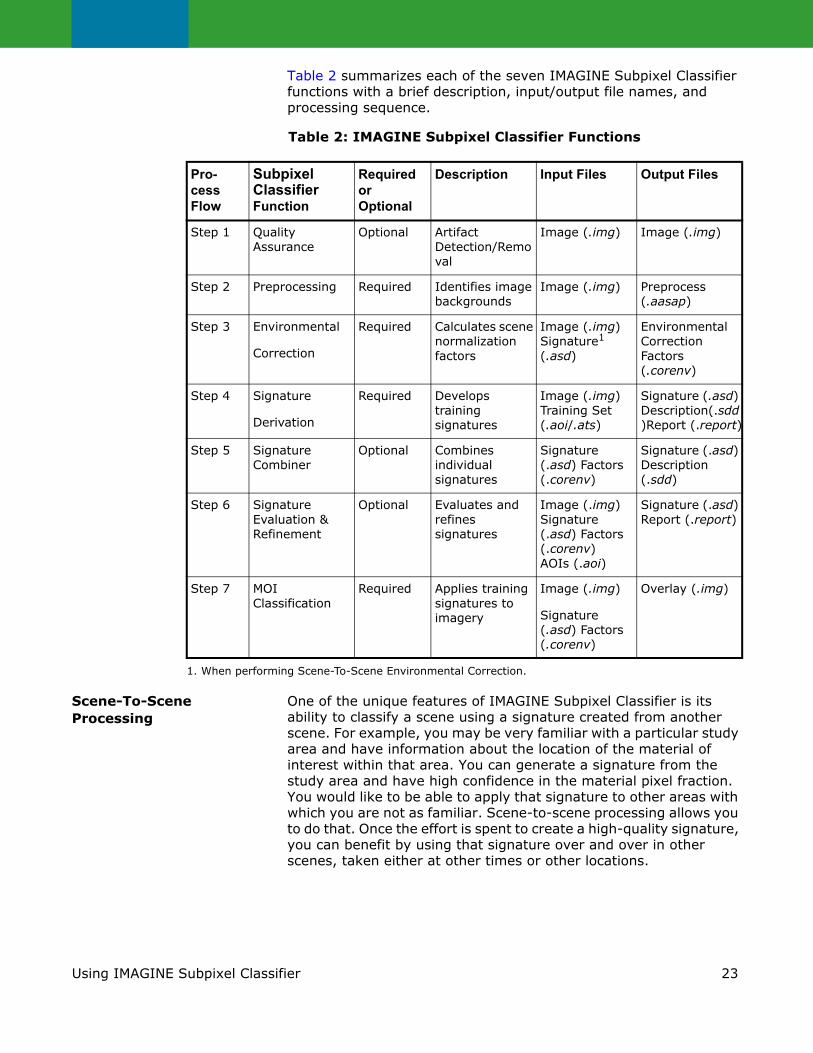
Table 2 summarizes each of the seven IMAGINE Subpixel Classifier functions with a brief description, input/output file names, and processing sequence.
Scene-To-Scene Processing
One of the unique features of IMAGINE Subpixel Classifier is its ability to classify a scene using a signature created from another scene. For example, you may be very familiar with a particular study area and have information about the location of the material of interest within that area. You can generate a signature from the study area and have high confidence in the material pixel fraction. You would like to be able to apply that signature to other areas with which you are not as familiar. Scene-to-scene processing allows you to do that. Once the effort is spent to create a high-quality signature, you can benefit by using that signature over and over in other scenes, taken either at other times or other locations.
Table 2: IMAGINE Subpixel Classifier Functions
Pro-cess Flow
Subpixel Classifier Function
Required or Optional
Description Input Files Output Files
Step 1 Quality Assurance
Optional Artifact Detection/Removal
Image (.img) Image (.img)
Step 2 Preprocessing Required Identifies image backgrounds
Image (.img) Preprocess (.aasap)
Step 3 Environmental
Correction
Required Calculates scene normalization factors
Image (.img) Signature1 (.asd)
Environmental Correction Factors (.corenv)
Step 4 Signature
Derivation
Required Develops training signatures
Image (.img) Training Set (.aoi/.ats)
Signature (.asd) Description(.sdd)Report (.report)
Step 5 Signature Combiner
Optional Combines individual signatures
Signature (.asd) Factors (.corenv)
Signature (.asd) Description (.sdd)
Step 6 Signature Evaluation & Refinement
Optional Evaluates and refines signatures
Image (.img) Signature (.asd) Factors (.corenv)AOIs (.aoi)
Signature (.asd) Report (.report)
Step 7 MOI Classification
Required Applies training signatures to imagery
Image (.img)
Signature (.asd) Factors (.corenv)
Overlay (.img)
1. When performing Scene-To-Scene Environmental Correction.

24 Using IMAGINE Subpixel Classifier
Scene-to-scene processing is not a separate process, but rather is built into all Subpixel Classifier processes. In particular, scene-to-scene processing involves Environmental Correction and MOI Classification. IMAGINE Subpixel Classifier signatures are always generated using the In-Scene Environmental Correction factors (.corenv file) that apply to the scene containing the training set. To apply a signature to another scene, all you have to do is create Scene-To-Scene Environmental Correction factors for the new scene and use them during Classification. The scene-to-scene correction factors compensate for differences in conditions between the two scenes.
A typical scenerio involving scene-to-scene processing is as follows. You select a scene where you are confident that the material of interest exists and that you can identify a training set using IMAGINE AOI tools. Using this scene, you run Preprocessing and then Environmental Correction using In-Scene for the correction type. Next you create a signature using either Manual Signature Derivation or Automatic Signature Derivation. You test the signature's performance by running classification on this scene. At that point you are confident that you have a good signature. So far all processing has been of the in-scene type.
Now you want to apply your new signature to another scene. Using the new scene, you run Preprocessing and then Environmental Correction. This time you select Scene-To-Scene for the correction type. The dialog will require that you select a signature file (.asd file) or environmental correction file (.corenv file). Select the signature file you created from your original scene. Alternatively, you could select the in-scene environmental correction file from the original scene that you used when you developed the signature. A set of Scene-To-Scene correction factors is generated and placed in your Environmental Correction file (.corenv file). This file should only be used for scene-to-scene processing between your original scene and the new scene since it specifies how the conditions changed between the two scenes. You skip the signature derivation step since you have a signature already. In Classification you specify the scene-to-scene correction file you just created and the signature you created from the original scene. The remaining inputs are the same as for regular classification. The resulting classification image represents MOI detections in the new scene using a signature developed in the original scene.
Quality Assurance Prior to applying IMAGINE Subpixel Classifier functions, it is important to verify that the input image data is valid. As with any process, invalid data can lead to invalid results. Past experience has demonstrated that a number of image data artifact types can skew the preprocessing and environmental correction factors. This, in turn, can lead to poor classification performance in ways that are not always readily apparent. It is therefore important to pre-screen input imagery to verify that the data are reasonable.
The following types of artifacts have been identified as being a problem in some Landsat TM imagery:
25Using IMAGINE Subpixel Classifier
• edge artifacts
• saturated pixels
• peppered area artifacts
• duplicate line artifacts (DLAs)
These artifacts are described in more detail in Data Quality Assurance on page 13.
Other sensors may exhibit the same or different types of artifacts. Visual inspection of the imagery often reveals potential problems. Band histograms and statistics are also a good source of information to help identify data quality problems.
If you suspect that your input imagery may contain artifacts, you may either subset out the areas containing artifacts or you can apply one of the data quality assurance utilities. The Quality Assurance utility specifically identifies DLAs and provides a means of filtering them from use in the manual Signature Derivation process. The more general Artifact Removal utility searches for all of the artifacts listed above and removes them from an image. This image can then be used with all IMAGINE Subpixel Classifier processes.
The Quality Assurance function enhances your ability to verify good imagery by screening satellite data to identify DLAs. DLAs occur when the image supplier resamples an image prior to shipment to the end user. During resampling, missing data is filled by duplicating data from either the line below or the line above. Gaps in images are the result of sensor vibration, wear on the satellite sensor, and dead detectors.
Output from Quality Assurance is an overlay (.img) file that highlights rows of data which have data numbers that are identical to those in an adjacent row. The detection of duplicate rows is performed independently for each image plane (band). Some of the duplicate rows may reflect a spatially homogeneous material, such as a body of water or cloud top. These are not valid DLAs and can be ignored. Other duplicated rows are data artifacts introduced during resampling of the raw data. It is these latter features that can affect classification accuracy and signature training set quality.
Knowledge of the location of DLAs is important for assessing the use of pixels for signature derivation and when interpreting classification results. The DLA Filter option in Signature Derivation can be used to automatically remove training pixels that are part of a DLA.
Explanations of how to interpret occurrences of DLAs when developing a signature or reviewing classification results are provided in “Signature Derivation” and “Signature Evaluation and Refinement”.

26 Using IMAGINE Subpixel Classifier
The Artifact Removal function automatically identifies and removes several types of artifacts from Landsat TM imagery, even the newer Landsat 7 ETM imagery. The process takes an input image with artifacts and produces an output image with the artifact areas removed. Pixel spectra judged to represent artifacts are replaced with all zeros. IMAGINE Subpixel Classifier ignores pixel spectra with values that are all zero. Since the utility also identifies and remove DLAs, this process may be used as an alternative to the Quality Assurance function.
Quality Assurance Utility Operational Steps
1. Click Quality Assurance from the Utilities menu.
The Image Quality Assurance dialog opens.
2. Under Input Image File, select the image on which to perform quality assurance.
27Using IMAGINE Subpixel Classifier
3. Under Output QA File, a suggested output name is displayed after the input image is selected (Input Image File name with a _qa.img extension). The QA output file name can be edited if a different name is desired. This file will have the same dimensions and number of bands as the input file.
4. Click OK to start the process.
5. A job status dialog is displayed indicating the percent complete. When the status reports 100%, select OK to close the dialog.
6. To view the results, display the image selected in Step 3 above in an ERDAS IMAGINE Viewer using the following instructions:
6.A Select File-Open-Raster and select the output _qa.img file from Step 3 above that contains the QA results.
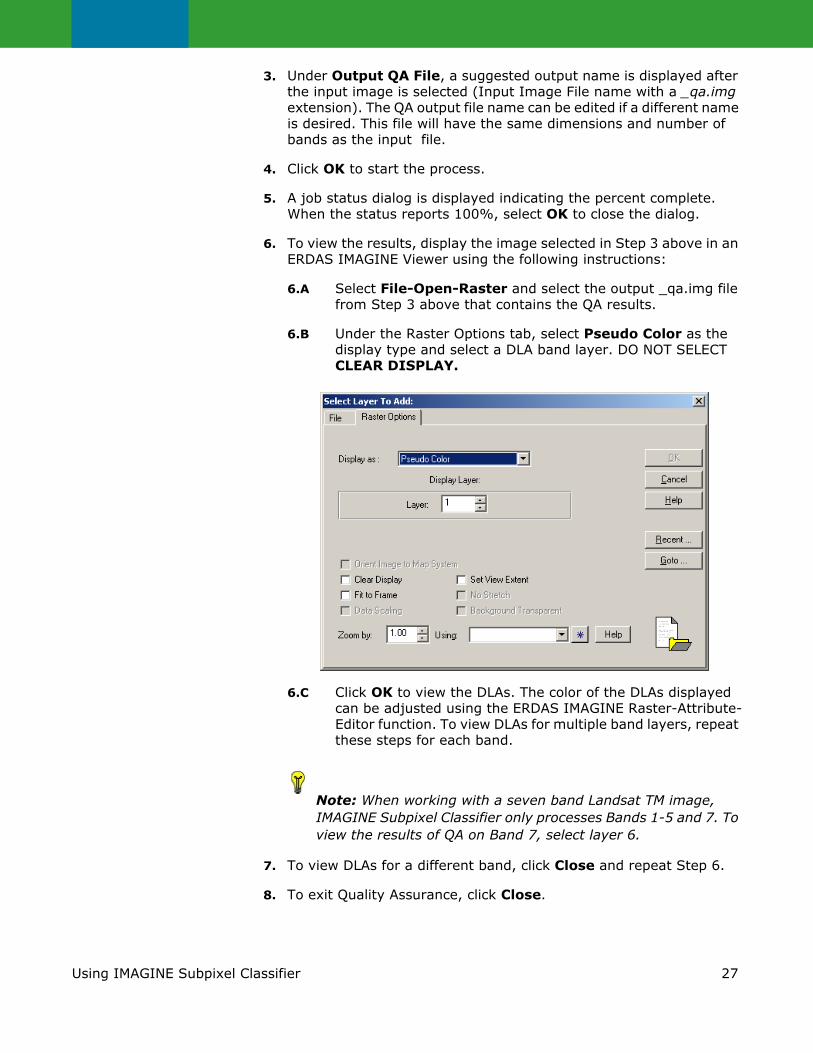
6.B Under the Raster Options tab, select Pseudo Color as the display type and select a DLA band layer. DO NOT SELECT CLEAR DISPLAY.
6.C Click OK to view the DLAs. The color of the DLAs displayed can be adjusted using the ERDAS IMAGINE Raster-Attribute-Editor function. To view DLAs for multiple band layers, repeat these steps for each band.
Note: When working with a seven band Landsat TM image, IMAGINE Subpixel Classifier only processes Bands 1-5 and 7. To view the results of QA on Band 7, select layer 6.
7. To view DLAs for a different band, click Close and repeat Step 6.
8. To exit Quality Assurance, click Close.

28 Using IMAGINE Subpixel Classifier
It is very important to view the results of the Quality Assurance function both before and after generating a training signature or running a classification. Viewing the DLA overlay file prior to developing a signature allows you to assess the quality of the image and training set.
Correction of training sets known to contain DLAs is performed by the DLA Filter option in the Signature Derivation function. The DLA Filter automatically eliminates training pixels that fall on DLAs and creates a new training set.
After classification, use the overlay file in conjunction with the detection file to confirm whether detections fell on DLAs.
The Inquire Cursor tool can be used to determine whether detections fall on specific row and column locations.
Artifact Removal Utility Operational Steps
1. Click Artifact Removal from Utilities menu.
The Artifact Removal dialog opens.
29Using IMAGINE Subpixel Classifier
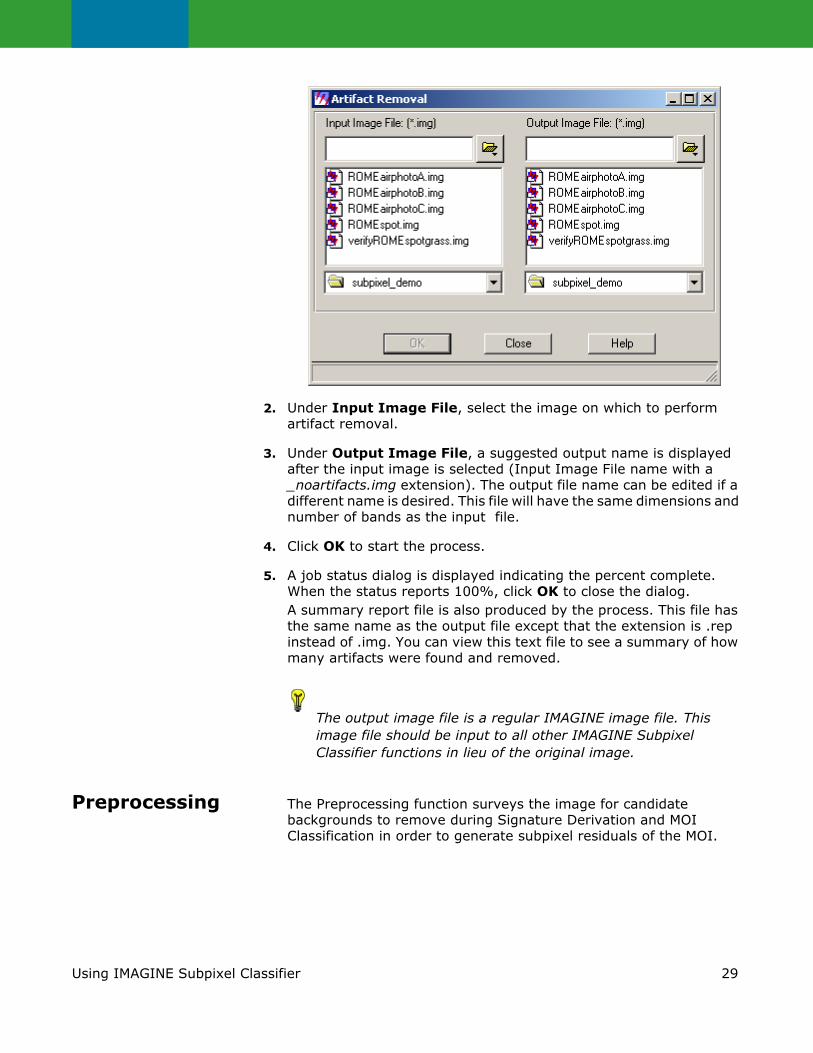
2. Under Input Image File, select the image on which to perform artifact removal.
3. Under Output Image File, a suggested output name is displayed after the input image is selected (Input Image File name with a _noartifacts.img extension). The output file name can be edited if a different name is desired. This file will have the same dimensions and number of bands as the input file.
4. Click OK to start the process.
5. A job status dialog is displayed indicating the percent complete. When the status reports 100%, click OK to close the dialog. A summary report file is also produced by the process. This file has the same name as the output file except that the extension is .rep instead of .img. You can view this text file to see a summary of how many artifacts were found and removed.
The output image file is a regular IMAGINE image file. This image file should be input to all other IMAGINE Subpixel Classifier functions in lieu of the original image.
Preprocessing The Preprocessing function surveys the image for candidate backgrounds to remove during Signature Derivation and MOI Classification in order to generate subpixel residuals of the MOI.
30 Using IMAGINE Subpixel Classifier
The Preprocessing function must be run prior to initiating other IMAGINE Subpixel Classifier functions. Other IMAGINE Subpixel Classifier Classification functions cannot run unless a .aasap file created by Preprocessing exists.
The .aasap file must be kept in the same directory as the image that is being processed. If you subset the image, you must re-run Preprocessing.
Operational Steps
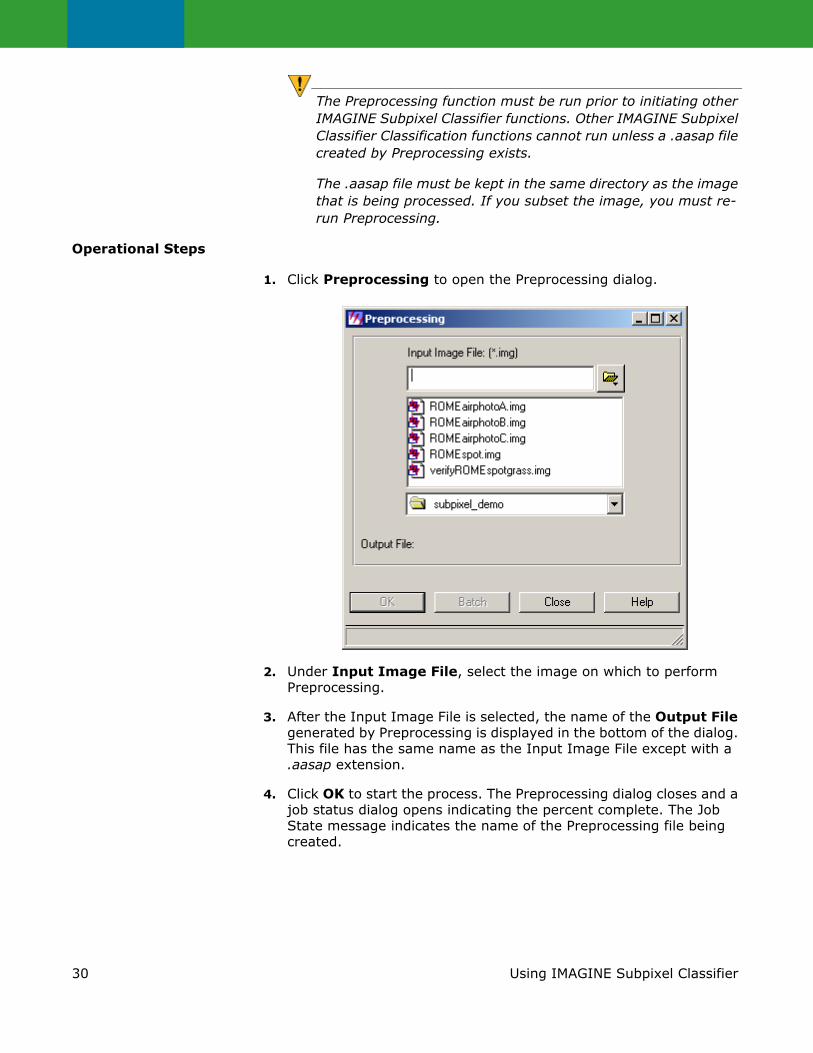
1. Click Preprocessing to open the Preprocessing dialog.
2. Under Input Image File, select the image on which to perform Preprocessing.
3. After the Input Image File is selected, the name of the Output File generated by Preprocessing is displayed in the bottom of the dialog. This file has the same name as the Input Image File except with a .aasap extension.
4. Click OK to start the process. The Preprocessing dialog closes and a job status dialog opens indicating the percent complete. The Job State message indicates the name of the Preprocessing file being created.

31Using IMAGINE Subpixel Classifier
5. Once Preprocessing has completed, the Job State message changes to “Done”. Select OK to close the dialog. Note that the session log also contains process status information, including any error or warning messages generated.
There are no results to view from this process. The .aasap file is now available for use by other IMAGINE Subpixel Classifier functions. This process must be run even though the output file is never selected as an input file to any of the other IMAGINE Subpixel Classifier functions. Use of this output file by IMAGINE Subpixel Classifier is automatic and transparent to you.
Automatic Environmental Correction
The Environmental Correction function calculates a set of factors to compensate for variations in atmospheric and environmental conditions during image acquisition. These correction factors, which are output to a .corenv file, are then applied to an image during signature derivation and classification.
Environmental Correction factors are used in two different situations. If you are developing a signature and using that signature in the same scene, atmospheric compensation is required since the energy detected by the sensor is not the same as the energy actually reflected from the MOI due to atmospheric scattering, absorption by water vapor, and other atmospheric distortions. This was discussed in “Multispectral Processing”.
If you want to apply a signature you have already created in one scene to a different scene, scene-to-scene correction factors are used to compensate for atmospheric and environmental variations between the two scenes. This allows IMAGINE Subpixel Classifier signatures to be applied to scenes of differing dates and geographic regions, making the signature scene-to-scene transferable. You do not have to rederive the signature in the new scene. This was discussed in “Scene-To-Scene Processing”.
Operational Steps
1. Click Environmental Correction in the main menu. The Environmental Correction dialog opens.

32 Using IMAGINE Subpixel Classifier
You must run the Preprocessing function prior to the Environmental Correction function. The Preprocessing output file, <imagename>.aasap, must reside in the same directory as the input image.
2. Under Input Image, enter the image on which to perform Environmental Correction. This should be the same image that Preprocessing was run on.
3. Under Output File, the .corenv extension is added automatically to the input image file name. If you wish to rename it, select the output file name and enter the name you prefer.
4. To perform In-Scene Environmental Correction, highlight the In-Scene button under Correction Type. No further action is required in this step. Proceed to Step 5.To perform scene-to-scene Environmental Correction, highlight the Scene-to-Scene button under Correction Type. In this case, the software will prompt you for the name of either a signature file (.asd file) or an in-scene environmental correction file (.corenv file) developed from the other scene.

33Using IMAGINE Subpixel Classifier
Select or enter the name of the signature file or environmental correction file that you developed from the other scene. This file contains information about the other scene’s environmental correction factors. That information is used to develop a set of scene-to-scene correction factors.
You can use the scene-to-scene correction file (.corenv file) that you created with any signature created in the original scene. You do not need to regenerate a new correction file for each signature as long as the signature was generated in the original scene and is being used in the new scene. If you want to use a signature generated from a third scene, you will have to generate a new set of correction factors that translate from that scene to your new scene.
Click OK to proceed with your selection. The name of file you selected will appear below the Scene-to-Scene button on the Environmental Correction dialog. Click Cancel to revert to In-Scene.
The next operation involves cloud selection. If the scene is cloud-free, you may complete the process without selecting clouds, as described in Step 5. If you suspect the scene contains clouds, you may select them in a special viewer. Steps 6-11 describe the cloud selection process.
5. If you are certain there are no clouds in the image, click OK in the main dialog. The software will verify that you wish to proceed without selecting clouds.
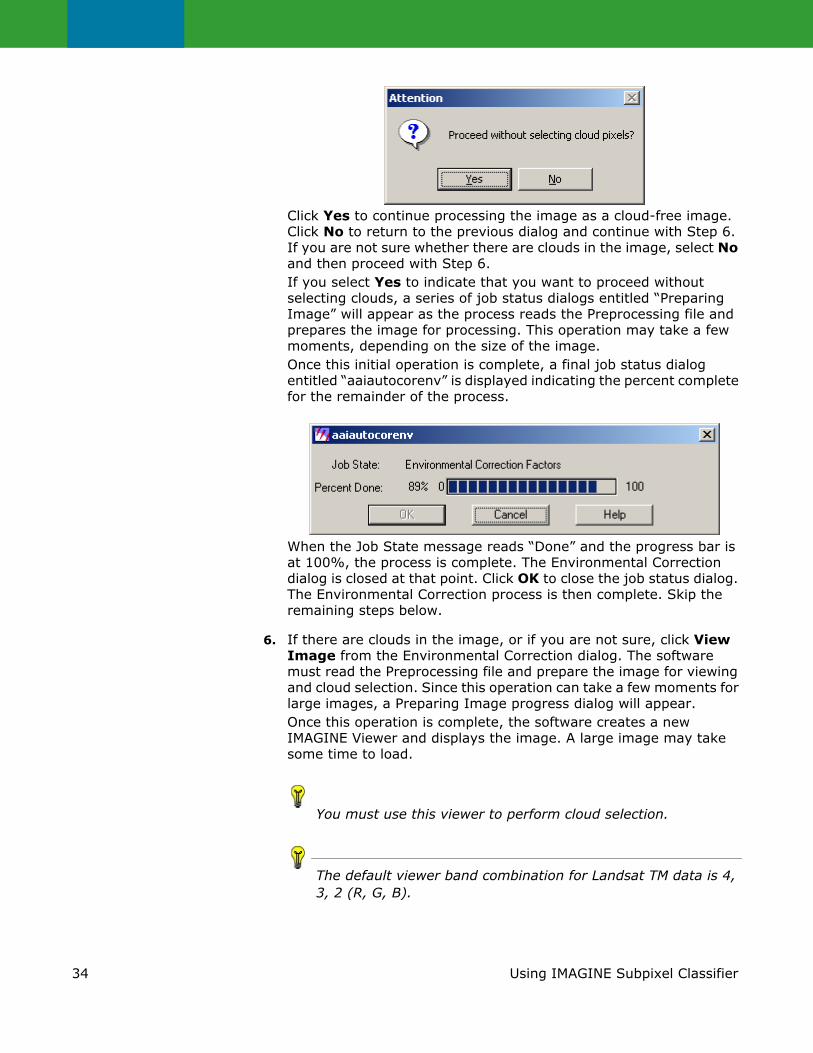
34 Using IMAGINE Subpixel Classifier
Click Yes to continue processing the image as a cloud-free image. Click No to return to the previous dialog and continue with Step 6. If you are not sure whether there are clouds in the image, select No and then proceed with Step 6.If you select Yes to indicate that you want to proceed without selecting clouds, a series of job status dialogs entitled “Preparing Image” will appear as the process reads the Preprocessing file and prepares the image for processing. This operation may take a few moments, depending on the size of the image.Once this initial operation is complete, a final job status dialog entitled “aaiautocorenv” is displayed indicating the percent complete for the remainder of the process.
When the Job State message reads “Done” and the progress bar is at 100%, the process is complete. The Environmental Correction dialog is closed at that point. Click OK to close the job status dialog. The Environmental Correction process is then complete. Skip the remaining steps below.
6. If there are clouds in the image, or if you are not sure, click View Image from the Environmental Correction dialog. The software must read the Preprocessing file and prepare the image for viewing and cloud selection. Since this operation can take a few moments for large images, a Preparing Image progress dialog will appear.Once this operation is complete, the software creates a new IMAGINE Viewer and displays the image. A large image may take some time to load.
You must use this viewer to perform cloud selection.
The default viewer band combination for Landsat TM data is 4, 3, 2 (R, G, B).

35Using IMAGINE Subpixel Classifier
The viewer has full functionality. You can zoom and pan with the appropriate tools from the tool bar. It is recommended that you use these tools when selecting unwanted features.
7. If you have previously run Environmental Correction for this image and you saved your cloud selection to a file (see Step 10), then click Input Cloud File checkbox to open a file selection dialog.
Select the file and click OK. Click Cancel to not use a cloud selection file. Specifying a cloud selection file causes the program to select an initial set of cloud areas based on your previous selections. These selections will appear in the viewer if you selected View Image in Step 6 or if you select it now. You can continue the process with this cloud selection or you can modify it as described in the next two steps.
8. If you wish to select cloud areas within the image, select the cross-hair (+) tool labeled Pick cloud pixel and then use the left mouse button to select a pixel that lies within a cloud. You must use the viewer that was created in Step 6 to perform this operation. The viewer will redraw the image and color in the cloud pixels corresponding to the cloud selected by the cross-hair (+). Repeat this procedure until all cloud-covered regions are colored in.
Be sure to follow the guidelines for selecting out clouds and haze, described in Section “Guidelines for Selecting Clouds, Haze, and Shadows” on page 36. To aid in selecting out clouds, use the zoom and pan functions.

36 Using IMAGINE Subpixel Classifier
You can also select other regions to exclude from the environmental correction process. These might include pixels that are invalid or are saturated.
9. To deselect a cloud in the image, select the cross-hair (+) tool and select a previously selected cloud with the left mouse button. All features within the image with that selected color are deselected and returned to the original image color. These regions will then be used in subsequent processing to determine environmental correction factors.
10. Once all clouds and/or image features to be ignored have been colored in, click OK to start the Environmental Correction process.If you selected any cloud areas under Step 8, the program will display a dialog asking whether you wish to save your selections to a cloud selection file.
Click Yes if you wish to save your selections.The program will automatically create a cloud selection file with the name <output>.corenv.cld where <output> is the output file name specified in Step 3. This readily associates your cloud selection file with the corresponding .corenv file. If desired, you may rename the file, but you should retain the .cld extension.Click No if you do not wish to save your selections. The process will continue without saving the cloud selections.
11. When the status reports 100%, click OK to close the dialog. The Environmental Correction process is complete.
An example output .corenv file is shown below:
Guidelines for Selecting Clouds, Haze, and Shadows
The Environmental Correction process automatically searches the entire image for bright and dark areas within the scene and then develops environmental correction factors based on the spectral data from these areas. To ensure accurate results, the selected pixels should be representative of your study area and reflect the full atmospheric path.
ACF= 32.134 8.199 7.058 5.843 3.867 0.000SCF= 90.060 75.516 129.369 112.936 229.508 124.640ARAD_FACTOR= 0.000 3.867 5.843 7.058 8.199 32.134SUN_FACTOR= 124.640 229.508 112.936 129.369 75.516 90.060DATA_START=

37Using IMAGINE Subpixel Classifier
This is why it is important to exclude clouds from the search. Clouds are bright objects, but they are high above the ground such that the complete atmospheric path between the sensor and the ground is not sampled.
To exclude clouds from the process, see “Operational Steps for Automatic Signature Derivation”.
Keep in mind that clouds can sometimes be translucent, allowing a fraction of the light energy reflected by MOIs to pass through them to reach the sensor. When a cloud is selected, bright land features are sometimes selected also. If these land features make up 10% or less of the total selected areas, leave them selected.
If the cloud region being examined contains more than 10% land features, de-select the region by positioning the cross-hair cursor (+) in the Environmental Correction Factor dialog over the color in question and press the left-mouse button. The image will refresh and the features will no longer be selected.
This rule is subjective. Sometimes it is difficult to determine what percentage of a color is land and what percentage is cloud. Use your best judgement, and if you are uncertain, run the Environmental Correction function twice.
Make the first run with the region in question colored in. Make the second run without the region colored in. Examine the ARAD_FACTOR and SUN_FACTOR lists to decide which of the two produced the best results.
Use the .corenv file that produced the best results in all subsequent processing.
Cloud shadows should NOT be selected.
Haze
Low-level haze is not necessarily bad if it is near the ground and extends throughout the study area. But extensive haze may artificially distort the SCF and SUN_FACTOR values, which may in turn cause additional false-alarm detections. If your image appears to contain a large amount of haze, try selecting it with the cross-hair (+).
If areas other than haze are colored-in, deselect them, or create a subset of your image that does not contain any haze. When creating this subset, try to maintain the diversity of features present in the original image. If subsetting is not possible, note that a large amount of haze may degrade performance.
You MUST re-run Preprocessing on the subset image before running the Environmental Correction process.

38 Using IMAGINE Subpixel Classifier
Shadows
Normally, shadow regions on the ground should not be selected. An exception may occur when the scene contains a combination of low-elevation areas and mountainous areas. High elevation terrain shadows may skew the correction factors because these areas experience a different atmospheric path than low elevation areas.
In general, if there are elevation differences of several thousand feet between different parts of the scene, a single set of environmental correction factors may not be adequate because you are sampling different atmospheric path lengths. In that case, you should consider subsetting the image to include only low elevation areas or only high elevation areas. These areas may then be processed separately to produce different environmental correction factors.
Evaluation and Refinement of Environmental Correction
The quality of the Environmental Correction results can be assessed by examining the two spectra in the .corenv file. The .corenv file is an ASCII text file whose contents can be viewed or printed. An example of a .corenv file is shown below.
One of the environmental correction spectra is labeled ACF, which stands for atmospheric correction factor. The other spectrum is labeled either SCF (Sun Correction Factor) for the In-Scene option, or ECF (Environment Correction Factor) for the scene-to-scene option. The spectra consist of a set of numbers that are listed from left to right in order of increasing band number.
For example, in Landsat TM, the first number on the left is for TM band 1. The last number on the right is for TM band 7, For SPOT, the four numbers from left to right represent bands 1, 2, 3, 4 respectively.
The ACF spectrum is utilized by the Signature Derivation and MOI Classification processes to compensate for variations in atmosphere and environmental conditions. The SCF spectrum is applied during In-Scene MOI Classification to compensate for the illumination source. The ECF spectrum is used by scene-to-scene MOI Classification to compensate for differences between the signature's source scene illumination and that of the image being classified.
The ACF spectrum can be evaluated by comparing it to a dark pixel spectrum from a body of water (lake, ocean) in the image. The Digital Number (DN) in each band of the ACF spectrum should generally be lower than the corresponding DN in a pixel spectrum of water. Note that the DNs are not necessarily the minimum water DNs in each band. DNs could, in some cases, be slightly higher.
ACF= 37.406 9.747 7.330 5.460 0.000 0.000SCF= 147.503 91.308 120.409 199.351 201.008 131.259ARAD_FACTOR= 0.000 0.000 5.460 7.330 9.747 37.406SUN_FACTOR= 131.259 201.008 199.351 120.409 91.308 147.503DATA_START=
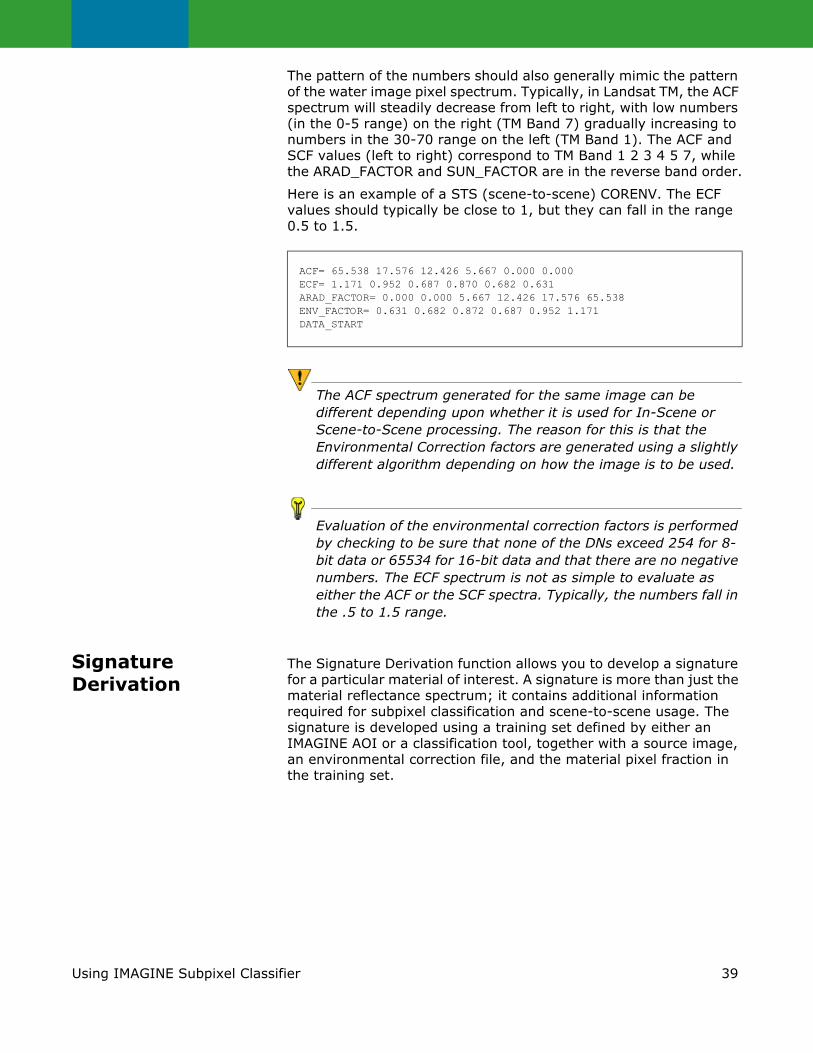
39Using IMAGINE Subpixel Classifier
The pattern of the numbers should also generally mimic the pattern of the water image pixel spectrum. Typically, in Landsat TM, the ACF spectrum will steadily decrease from left to right, with low numbers (in the 0-5 range) on the right (TM Band 7) gradually increasing to numbers in the 30-70 range on the left (TM Band 1). The ACF and SCF values (left to right) correspond to TM Band 1 2 3 4 5 7, while the ARAD_FACTOR and SUN_FACTOR are in the reverse band order.
Here is an example of a STS (scene-to-scene) CORENV. The ECF values should typically be close to 1, but they can fall in the range 0.5 to 1.5.
The ACF spectrum generated for the same image can be different depending upon whether it is used for In-Scene or Scene-to-Scene processing. The reason for this is that the Environmental Correction factors are generated using a slightly different algorithm depending on how the image is to be used.
Evaluation of the environmental correction factors is performed by checking to be sure that none of the DNs exceed 254 for 8-bit data or 65534 for 16-bit data and that there are no negative numbers. The ECF spectrum is not as simple to evaluate as either the ACF or the SCF spectra. Typically, the numbers fall in the .5 to 1.5 range.
Signature Derivation
The Signature Derivation function allows you to develop a signature for a particular material of interest. A signature is more than just the material reflectance spectrum; it contains additional information required for subpixel classification and scene-to-scene usage. The signature is developed using a training set defined by either an IMAGINE AOI or a classification tool, together with a source image, an environmental correction file, and the material pixel fraction in the training set.
ACF= 65.538 17.576 12.426 5.667 0.000 0.000ECF= 1.171 0.952 0.687 0.870 0.682 0.631ARAD_FACTOR= 0.000 0.000 5.667 12.426 17.576 65.538ENV_FACTOR= 0.631 0.682 0.872 0.687 0.952 1.171DATA_START

40 Using IMAGINE Subpixel Classifier
You can develop a signature using either a whole-pixel or subpixel training set as described below. Regardless of the training set used, the signature can be used to classify the material of interest at either the whole-pixel or subpixel level. A signature developed from a subpixel training set does not just apply to the material pixel fraction in the training set, it can be used for any material pixel fraction. In subpixel signature derivation, the process extracts the subpixel part of the material signature that is common to all pixels in the training set. The resulting signature is equivalent to a whole pixel signature of that common material.
Signature Development Strategy
The IMAGINE Subpixel Classifier Signature Derivation function requires a series of steps that vary in complexity, depending on the strategy and method employed for deriving the signature. Two factors essential to deriving a successful signature are the quality of the training set and an effective strategy for its use. Suggestions for signature strategies are provided below.
The biggest savings in effort and complexity are realized when whole-pixel signatures rather than subpixel signatures are used to classify materials. Whole-pixel signatures refer to signatures derived from training set pixels that contain greater than 90% of the MOI. They can still be used to make subpixel detections.
A typical whole pixel signature strategy is one for which a multispectral classifier, such as a maximum likelihood classifier, is able to define the whole-pixel occurrences of an MOI. For example, whole-pixel classification may have effectively identified a particular species of vegetation. Using those pixels as the training set file, a signature could be derived.
IMAGINE Subpixel Classifier Classification is then used to report the additional subpixel occurrences of the material in the image. Subpixel results can then be appended to the original maximum likelihood classification output (whole pixel plus subpixel classification results). The end result is a more complete classification of the MOI.
See Whole Pixel Selection Strategies on page 109 for more information.
Another example of a whole-pixel signature strategy uses the IMAGINE AOI Region Growing tool to define a training set containing whole-pixel occurrences of an MOI. The training set is then used by IMAGINE Subpixel Classifier to derive a subpixel signature for the MOI.

41Using IMAGINE Subpixel Classifier
A subpixel signature strategy should be applied only when a whole pixel signature cannot provide satisfactory performance. This is evidenced by the inability to discriminate pixels in the training set area using either IMAGINE Subpixel Classifier or traditional multispectral classifiers. It is also evidenced when discrimination degrades in areas away from the training site. When either or both of these conditions occur, it is recommended that a subpixel signature be developed.
Subpixel signature derivation involves more steps and analysis, but the payoff can be well worth the effort. The Automatic Signature Derivation module was developed to simplify the generation of a high-quality subpixel signature while improving classification accuracy. This process automatically generates a set of signatures for several Material Pixel Fractions and uses the MOI Classification process to assess their performance using a measure of effectiveness. You specify an AOI believed to contain the MOI and one containing false alarm materials you wish to exclude from classification. The process reports the five best signatures corresponding to different Material Pixel Fractions.
For some applications, classification accuracy can be improved by using more than one signature. These applications fall into two basic categories:
• Applications where multiple signatures provide more complete detection of the MOI
• Applications where the MOIs consist of two or more co-existing characteristic materials
For example, a species of vegetation might be detected in a late summer scene, but not in a late spring scene. A family of signatures may more accurately represent the seasonal variation of the plant's spectral characteristics than a single signature.
For the second category, separate signatures for a plant's leaves and seed pods may generate false detections, but together provide a very discriminating signature of the plant. Classification performance can sometimes be improved for these applications by developing a signature for each characteristic material and accepting as valid detections only those pixels detected by the set of signatures.
The need for multiple signatures can be evidenced by discovering during signature derivation that there is either more than one optimal Material Pixel Fraction for the training set or that the best performance is achieved using the classification results in combination rather than individually.

42 Using IMAGINE Subpixel Classifier
The Multiple Signature Classifier provides the convenience of classifying associated (user defined) signatures in a single classification run ending in an output file that contains layers for each signature processed. Before you can classify multiple signatures those signatures and their companion environmental correction files must be combined using the Signature Combiner.
Defining a Training Set Care should be taken to define a training set that contains only the specific MOI. Guidelines for defining a training set, the Material Pixel Fraction, and confidence value for a subpixel signature are described below.
Remember that it is the quality of the training set pixels and not the quantity of pixels that is crucial in developing a good signature. For Manual Signature Derivation, the Material Pixel Fraction and confidence level settings are an important element of signature derivation.
Selection of these parameters is described in "Manual Signature Derivation" on page 43.
For Automatic Signature Derivation, the best Material Pixel Fraction for the training set is automatically identified.
The training set pixels can be selected using the IMAGINE Training AOI point, rectangle, polygon, and Region Growing tools. Alternatively, the training set can be defined using a class value from a thematic raster layer, such as a class from a maximum likelihood classification process. The AOI files should be created from the input image.
• Choose pixels that are expected to contain as much of the MOI as possible. Signatures can be derived from pixels containing as little as 20% of the MOI, but signature quality is generally higher when pixels contain larger material pixel fractions.
• Whenever possible, pixels should be from spatially large occurrences of the MOI, covering multiple contiguous pixels. If the MOI occurs in isolated pixels, take care to ensure that the pixels have a high probability of actually containing the material.
• The selected pixels should contain similar Material Pixel Fractions. The Material Pixel Fraction is the fraction of the pixel that contains the MOI. If training pixels are suspected to contain distinctly different Material Pixel Fractions, the .ats file created by the Signature Derivation function should be edited to reflect these differences.

43Using IMAGINE Subpixel Classifier
The .ats file is an ASCII file. Each pixel in the training set is listed on a separate line along with the Material Pixel Fraction, which can be edited.
• The selected pixels should sample the natural variations in the spectral properties of the MOI. Extreme variations may require multiple signatures.
• The pixels should include a diversity of backgrounds, if possible, for example, white pine plus grass, white pine plus trees, and white pine plus soil for a white pine signature.
• There should be no fewer than five pixels in the training set. Larger training sets are recommended, although the signature derivation processing time is affected by the training set size. For Material Pixel Fractions less than 90%, the training set should be less than approximately 100 pixels. Larger training sets are permitted, but they are automatically sampled down to 100 pixels.
For Material Pixel Fractions greater than or equal to 90%, the training set should be less than 1000 pixels. Larger training sets are automatically sampled down to 1000 pixels.
• The number of extraneous pixels that do not contain the MOI should be minimized. If it is not practical to exclude certain extraneous pixels, the training set confidence level can be reduced to reflect the presence of suspected extraneous pixels.
Manual Signature Derivation
Manual Signature Derivation is used to generate a single signature from a fixed set of input parameters. Use Manual Signature Derivation when you want to generate a signature from a whole-pixel training set. You can also use Manual Signature Derivation to generate a signature from a subpixel training set when you are confident of the Material Pixel Fraction in the training set.
The Manual Signature Derivation process automatically creates a signature file (.asd file) as well as a signature description document (.sdd file). The .sdd file is a companion file to the .asd file and must always be kept in the same directory. This file contains parameters specific to the output signature file such as Family number. Since the .sdd file is an ASCII file, which can be edited, you can change the Family parameters to affect the MOI Classification output.
These parameters are explained in Section “MOI Classification” on page 75.

44 Using IMAGINE Subpixel Classifier
Other IMAGINE Subpixel Classifier functions, requiring an input signature, cannot run unless a .sdd file created by Signature Derivation exists. The .sdd file must be kept in the same directory as the input signature file.
Operational Steps for Manual Signature Derivation
1. Click Signature Derivation from the main menu to open Signature Derivation menu.
2. Click Manual Signature Derivation to open the Signature Derivation dialog:

45Using IMAGINE Subpixel Classifier
3. Under Input Image File, select the image on which to perform signature derivation.
4. Under Input CORENV File, select the environmental correction file that was derived for the image selected. If the environmental correction file has not been created, then exit Signature Derivation and run the Environmental Correction function.
5. Under Input Training Set File, select the name of the file that contains known locations of the material being classified. This file can be one of three choices: an ERDAS IMAGINE Area of Interest file (.aoi file), an ERDAS IMAGINE whole-pixel classification file (.img file), or a previously created .ats file. The .ats file can also be created or edited using an ASCII text editor.

46 Using IMAGINE Subpixel Classifier
If the selected Input Training Set File does have a .ats file name extension, please continue with Step 10.
The size of the input training set impacts the length of time it takes to derive a signature. Therefore, be selective in deciding which training set is best. A strategy for selecting training set pixels is provided in the introduction to this section.
6. If the selected Input Training Set File does not have a .ats file name extension (.img or .aoi), then the Convert .aoi or .img to .ats dialog opens:
The Input Training Set File that was selected in step 5. is now shown as the Output Training Set File (with .ats file extension). This file name can be edited if a different name is desired, but keep the .ats extension.
7. The Material Pixel Fraction is the fraction of the pixel’s spatial area occupied by the material. For Material Pixel Fraction, enter the average amount of the material for the pixels in the training set. For example, if one pixel contains 50% material and another pixel contains 100% material, then the Material Pixel Fraction would be 75%. Although a training set may appear to be comprised of a single material, nearly all pixels contain other materials as well. In general, more conservative estimates of Material Pixel Fraction will yield higher quality signatures.

47Using IMAGINE Subpixel Classifier
The Material Pixel Fraction estimate can have a significant impact on the quality of the signatures derived. First, it can control which material is selected for signature derivation. The training set pixels can contain more than one common material. One of the materials may have a different Material Pixel Fraction than the other. An improperly estimated Material Pixel Fraction can potentially derive a signature for the wrong material.Second, the Material Pixel Fraction can control the purity of the signature (amount of background contamination). If the signature contains an unwanted background contribution, it can cause incomplete classification of materials or regionally variable performance.If the Material Pixel Fraction is estimated to be 90% or greater, enter 0.9 and continue with Step 10.To select the Material Pixel Fraction for fractions less than 90%, consider using Automatic Signature Derivation. This process automates the task of finding the proper Material Pixel Fraction for your training set. If you wish to manually derive a subpixel signature, the following steps are recommended:
7.A Derive a set of signatures using the selected training set pixels for a series of mean Material Pixel Fractions that range from .15 minimum to .90 maximum in .05 increments. A narrower range can be selected, if appropriate.
The Automatic Signature Derivation process automates the procedure described here and can save you considerable time overall.
7.B Perform IMAGINE Subpixel Classifier Classification for each signature from Step A on a small AOI in the image containing known occurrences of the MOI as well as areas that do not contain the MOI. Select the best signature(s) from Step A based on relative classification performance (maximum number of detections in desired areas and minimum number of detections in undesired areas). Note that there may be more than one optimal fraction.
7.C Repeat Step A for Material Pixel Fractions ranging from .04 below and .04 above the best signature's fraction in Step B, in .01 increments. For example, if the best signature generated so far has a Material Pixel Fraction of .55, then re-derive the signatures using a range from .51 to .59 in .01 increments.
7.D Repeat Step B with the Step C signatures. Compare Step B and Step D classification results to select the best performing signatures.

48 Using IMAGINE Subpixel Classifier
8. The optional Class Value field is only needed when the Input Training Set selected is an ERDAS IMAGINE .img classification file. An initial value of “1” is assigned. This number must be changed to the class value in the classification image that best represents the MOI.
9. Select OK to generate the Output Training Set File. The IMAGINE Subpixel Classifier Signature Derivation dialog is re-opened with a new .ats file as the Input Training Set File.
10. For Confidence Level, enter the estimated percentage of pixels in the training set that are believed to contain the MOI. Estimate conservatively. Although a training set may appear to be dominantly comprised of pixels containing the MOI, a fraction of them probably will not.Use the default Confidence Level (0.80) if you believe that 80% or more of the training set pixels contain the MOI. Reduce the Confidence Level if you suspect that a significant fraction of the training set pixels are extraneous. For example, if only two-thirds of the training set pixels are believed to contain the MOI, set the confidence level to .67. If it is unknown how many of the training pixels are extraneous, use the default Confidence Level.
11. At this point, the IMAGINE Subpixel Classifier DLA Filter function can be applied to the training set, if desired. The purpose of this function is to refine the training set used in Signature Derivation. Use of this filter requires that the Quality Assurance process be applied to this data. The DLA Filter compares the locations of the training set pixels to the DLAs detected by Quality Assurance. If any of the training set pixels fall on DLAs, the DLA Filter function will create a new training set removing questionable pixels. It is recommended that the DLA Filter function be used with Landsat TM NN resampled data in all cases except those where the MOI occupies large, homogenous areas. In order to initiate the DLA filter, a .ats file must be input into the Input Training Set File Name dialog. If you do not wish to apply the IMAGINE Subpixel Classifier DLA Filter function, please continue with Step 18.
12. Select DLA Filter from the Signature Derivation menu. The Training Set DLA Filter dialog is displayed:

49Using IMAGINE Subpixel Classifier
13. Next to Input Training Set File, the name of the training set file selected in the Signature Derivation dialog is displayed. This is the input training set to be filtered.
14. Under Input QA File, select the _qa.img file for the same image that the training set was extracted from. Section “Quality Assurance” on page 24 provides details on how to produce this file.
15. Under Output Training Set, enter the name of the file that will contain the refined training set pixels. It is not necessary to add the .ats extension.
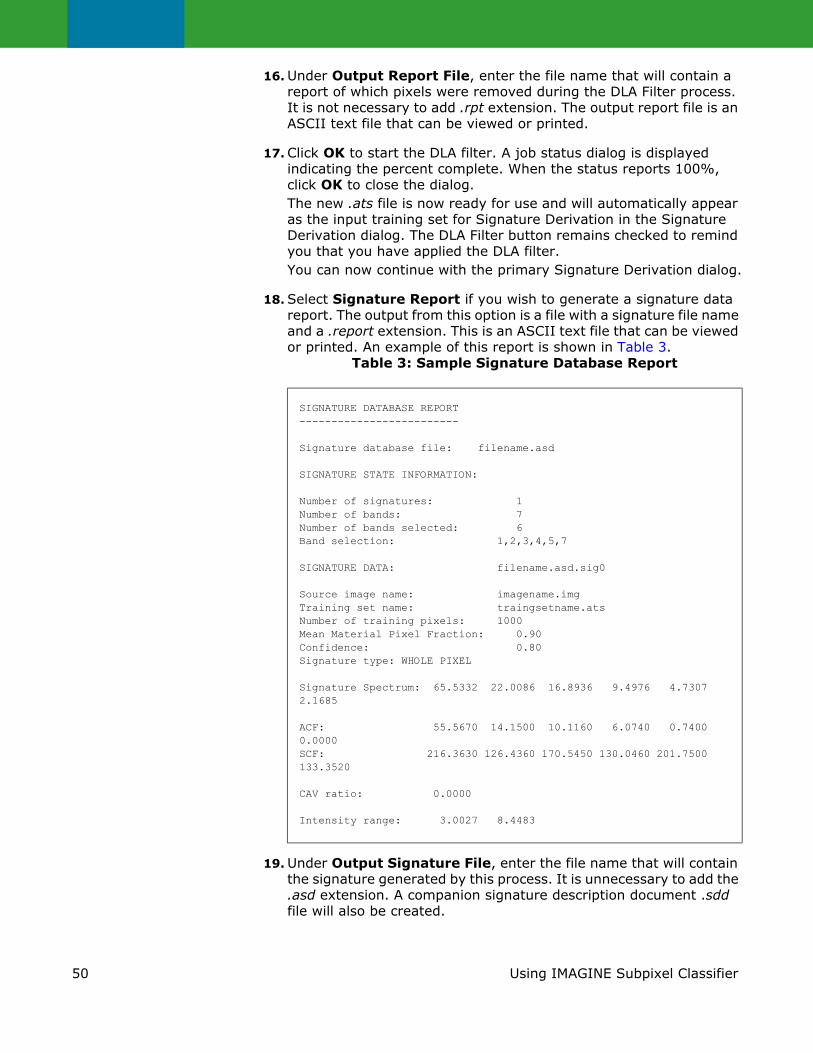
50 Using IMAGINE Subpixel Classifier
16. Under Output Report File, enter the file name that will contain a report of which pixels were removed during the DLA Filter process. It is not necessary to add .rpt extension. The output report file is an ASCII text file that can be viewed or printed.
17. Click OK to start the DLA filter. A job status dialog is displayed indicating the percent complete. When the status reports 100%, click OK to close the dialog.The new .ats file is now ready for use and will automatically appear as the input training set for Signature Derivation in the Signature Derivation dialog. The DLA Filter button remains checked to remind you that you have applied the DLA filter. You can now continue with the primary Signature Derivation dialog.
18. Select Signature Report if you wish to generate a signature data report. The output from this option is a file with a signature file name and a .report extension. This is an ASCII text file that can be viewed or printed. An example of this report is shown in Table 3.
Table 3: Sample Signature Database Report
19. Under Output Signature File, enter the file name that will contain the signature generated by this process. It is unnecessary to add the .asd extension. A companion signature description document .sdd file will also be created.
SIGNATURE DATABASE REPORT-------------------------
Signature database file: filename.asd
SIGNATURE STATE INFORMATION:
Number of signatures: 1Number of bands: 7Number of bands selected: 6Band selection: 1,2,3,4,5,7
SIGNATURE DATA: filename.asd.sig0
Source image name: imagename.imgTraining set name: traingsetname.atsNumber of training pixels: 1000Mean Material Pixel Fraction: 0.90Confidence: 0.80Signature type: WHOLE PIXEL
Signature Spectrum: 65.5332 22.0086 16.8936 9.4976 4.7307 2.1685
ACF: 55.5670 14.1500 10.1160 6.0740 0.7400 0.0000SCF: 216.3630 126.4360 170.5450 130.0460 201.7500 133.3520
CAV ratio: 0.0000
Intensity range: 3.0027 8.4483

51Using IMAGINE Subpixel Classifier
Table 4: Sample Signature Description Document File
The .sdd and .asd files must reside in the same directory.
20. Click OK to start Signature Derivation. A job status dialog is displayed indicating the percent complete. When the status reports 100%, click OK to close the dialog.
The time to derive an IMAGINE Subpixel Classifier signature for a mean Material Pixel Fraction of .90 (whole pixel) is significantly less than that for a fraction less than .90 (subpixel). This difference is due to the subpixel signature derivation algorithm being more CPU intensive than whole pixel signature derivation.
21. To exit Signature Derivation, click Close. Once the signature is developed, the next step in the processing sequence is to run MOI Classification, or Signature Evaluation and Refinement to test the signature. After reviewing the results, the signature may need to be modified. Signature derivation is typically an iterative process often requiring several passes to develop and refine a high-quality signature.
Interpreting the Manual Signature Report
The Manual Signature Derivation Report is an ASCII text file that provides information about the signature spectrum, the number of training pixels detected, the intensity range, and the C Average (CAV) Ratio. Each of these is discussed below.
The signature spectrum is the equivalent spectrum of a pixel that is exclusively inhabited by the MOI. The numbers in the spectrum are presented from left to right in order of increasing band number. With the exception of unusually bright materials, the numbers in the spectrum should fall within the range 0-255 for 8-bit imagery and 0-65,535 for 16-bit imagery.
#ID Family Rank Sep CAV Ratio#Signature-Name#Source-Image#Evaluation-Image1 1 1 0.46830583 0.00018689134filename.asdfilename.img

52 Using IMAGINE Subpixel Classifier
If the numbers fall outside of this range, the signature may have to be re-derived. The signature spectrum can also be compared to pixel spectra of similar materials in the image to see if they have similar characteristics to the signature spectrum. If the signature spectrum is significantly different than expected, the signature is either of a different material, or may be an artifact of an improper training set or a Material Pixel Fraction.
The number of training pixels detected by the signature should be compared to the number of training pixels used to derive the signature. More than half of the training set pixels are typically detected by a valid signature. The IMAGINE Subpixel Classifier Signature Derivation function derives a signature for a material that is common to the training set. Therefore, it is not unusual for training sets to be only partially detected by a signature.
If the number of detected pixels is less than 50% of the training set size, multiple signatures may be required, or the signature should be re-derived.
To assess the quality of the signature, examine the intensity range. Intensity is the average of the DNs in a spectrum, i.e., the mean intensity of the spectrum. The intensity range indicates the range of intensities of the spectra for the MOI in the detected training set pixels. The narrower the range, the more similar the detected materials are to each other. A broader range may indicate that the training set is too diverse with respect to the material's spectral characteristics. Confirm this by examining the CAV Ratio.
The CAV Ratio measures the diversity of spectral characteristics associated with the detected training set pixels. This number should be less than 1.0. If the CAV Ratio is significantly larger than 1.0, the signature should be re-derived.
Automatic Signature Derivation
The Automatic Signature Derivation program automates the process of choosing the best signature from a training set with a subpixel MOI. This process is used when you have evaluated a whole pixel classification output and determined the need for a subpixel signature or when you know the material pixel fraction in the training set is subpixel.
With this process, you can specify two optional AOIs, one surrounding an area where you believe the MOI is present (Valid Detection AOI) and one where the MOI is not present (False Detection AOI) but which may represent a source of false detections. The process performs IMAGINE Subpixel Classifier Classification on 94 possible subpixel signature candidates using the Valid and False Detection AOIs defined by you.
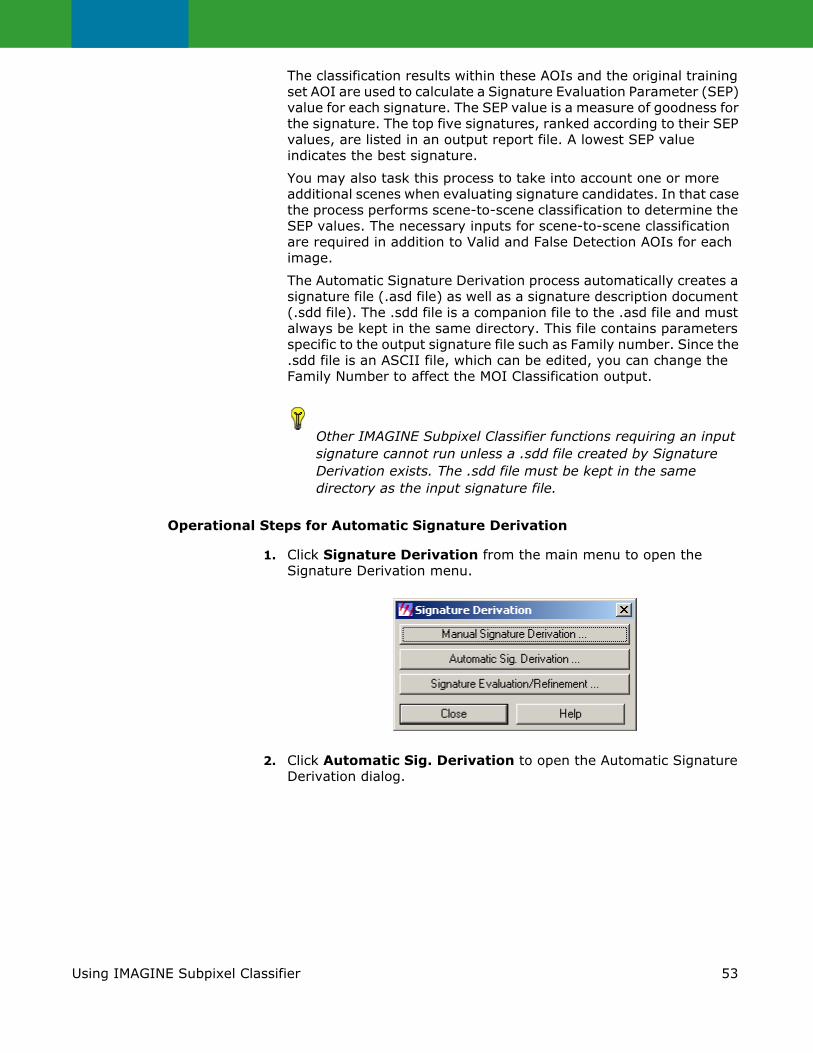
53Using IMAGINE Subpixel Classifier
The classification results within these AOIs and the original training set AOI are used to calculate a Signature Evaluation Parameter (SEP) value for each signature. The SEP value is a measure of goodness for the signature. The top five signatures, ranked according to their SEP values, are listed in an output report file. A lowest SEP value indicates the best signature.
You may also task this process to take into account one or more additional scenes when evaluating signature candidates. In that case the process performs scene-to-scene classification to determine the SEP values. The necessary inputs for scene-to-scene classification are required in addition to Valid and False Detection AOIs for each image.
The Automatic Signature Derivation process automatically creates a signature file (.asd file) as well as a signature description document (.sdd file). The .sdd file is a companion file to the .asd file and must always be kept in the same directory. This file contains parameters specific to the output signature file such as Family number. Since the .sdd file is an ASCII file, which can be edited, you can change the Family Number to affect the MOI Classification output.
Other IMAGINE Subpixel Classifier functions requiring an input signature cannot run unless a .sdd file created by Signature Derivation exists. The .sdd file must be kept in the same directory as the input signature file.
Operational Steps for Automatic Signature Derivation
1. Click Signature Derivation from the main menu to open the Signature Derivation menu.
2. Click Automatic Sig. Derivation to open the Automatic Signature Derivation dialog.

54 Using IMAGINE Subpixel Classifier
3. Under Input Image File, select the image on which to perform Automatic signature derivation.
4. Under Input Corenv File, select the environmental correction file derived for the image selected in Step 3.
5. Under Input Training Set File, select the name of the AOI file that contains known locations of the material being classified.
6. If you have identified a valid AOI, select the file name under Input Valid AOI File. This AOI should be created from pixels that you have identified as containing valid detection areas in the image to be classified. This input is optional, but recommended. The signature selection process will attempt to maximize the number of detections within this AOI.

55Using IMAGINE Subpixel Classifier
7. If you have identified a false AOI, select the file name under Input False AOI File. This AOI should be created from pixels that you have identified as false detection areas in the image to be classified. These areas may be spectrally similar to the desired MOI in which case they represent false detections you wish to discriminate against. This input is optional, but recommended. The signature selection process will attempt to minimize the number of detections within this AOI.Important information about Valid and False Detection AOI Files is listed below:
• Valid and/or False Detection AOI files are not required to run Automatic Signature Derivation. You may specify one and not the other. If you do not specify these AOIs, the process evaluates signatures based on the training set AOI alone.
• At least one of the Valid and/or False Detection AOI files is required when using the Additional Scenes option.
• The Training Set, Valid, and False Detection AOIs can be any size but if they exceed 250 pixels the process will downsample to 250 pixels.
8. Under Output Report File, enter the name of the report file that will contain the list of the top five signature files produced by the process. It is not necessary to add the file extension .aps.
9. Under Report File Options, select the desired type of reporting output from the Automatic Signature Derivation process; either Short Form or Long Form.The Short Form option causes the process to output the top five performing signature files, the individual signature report files for these signatures, the corresponding signature description documents (.sdd files), the training set .ats files, and the output report file (.aps file). These files are placed in the working directory you specified. The Long Form option gives additional information in the .aps output report file and also writes all 94 candidate signatures, signature reports, and signature description documents to the working directory. SEP data is contained in the report file. Since all candidate files and reports are retained, this option will write a maximum of 289 files to your working directory.
The Long Form option will cause the process to write a maximum of 289 files to your working directory.
10. Select a value for the Classification Threshold. The valid classification threshold range is 0.2 to 1.0, representing the lowest acceptable material pixel fraction to be considered during IMAGINE Subpixel Classifier Classification. Accept the default threshold value of 0.2 to allow the process to use all the fraction classes in the Classification output histogram when calculating the SEP value.

56 Using IMAGINE Subpixel Classifier
Increase the threshold value to exclude lower fraction classes from consideration. For example if you choose the classification threshold to be 0.5, only those Classification fraction classes that represent a material pixel fraction above 0.5 are assessed for the SEP value. The threshold value may be entered manually or incrementally adjusted using the toggle buttons to the right.
11. Under Classification Classes, select the number of Classification output classes to be used when evaluating signature candidates. The default value of 8 is recommended. You may select values of either 2, 4, or 8 Material Pixel Fraction classes.
12. If you are not using additional scenes to evaluate signature candidates, click OK to begin Automatic Signature Derivation. Otherwise continue with Step 13.A job status dialog is displayed indicating the percent complete of each individual operation in the process. When the status reports Done, select OK to close the dialog. See further information below on evaluating the APS Signature Reports.
13. Click the Additional Scenes button if you would like the process to take into account Valid and/or False Detection AOIs generated from additional scenes during the signature evaluation process. This is an advanced feature of the software designed to improve the scene-to-scene performance of signatures. You should also consider using Signature Evaluation and Refinement when developing high quality scene-to-scene signatures.Automatic Signature Derivation uses scene-to-scene classification within these additional AOIs when selecting the best-performing signature. Therefore, when using this option, the process will require access to the additional image and its associated preprocessing file, a scene-to-scene environmental correction file, and the Valid and/or False AOI files. The required information is stored in a Multi-Scene File (.msf file).
Table 5: Sample of a Multi-Scene File
A Multi-Scene file is an ASCII text file which holds information about the additional images that you want to include in the Automatic Signature Derivation process. You create a Multi-Scene file using the Multi-Scene dialog described in the steps below. You can also create a Multi-Scene file using a text editor.
11 1imagename.imgimagename.aasapimagename-scene-to-scene.corenvimagename-valid.aoiimagename-false.aoi

57Using IMAGINE Subpixel Classifier
The Multi-Scene (.msf) file reads as follows. The first line of the Multi-Scene file holds a number which represents the number of additional images to be used in Automatic Signature Derivation. The second line indicates whether or not Valid and False detection AOIs have been selected (1=Yes, 0=No). The rest of the file lists the required files for those additional images, selected by you when filling in the Create Multi-Scene file dialog.
14. When you select the Additional Scenes option, the Additional Scenes dialog opens.
If you have already created a Multi-Scene file, you may select it here under Input Multi-Scene File (.msf). Click OK to return to the Automatic Signature Derivation dialog. The .msf filename is displayed at the bottom of the dialog next to the Additional Scenes option button. Skip to Step 26 to start the Automatic Signature Derivation process.
15. If you do not have a Multi-Scene file, select the Create Scene File button. The Multi-Scene dialog opens to assist you in automatically creating a new Multi-scene file.
16. The Multi-Scene dialog opens:

58 Using IMAGINE Subpixel Classifier
17. Under Input Image File, select the additional image on which to perform Automatic signature derivation.
18. Under Input STS Corenv File, select the scene-to-scene environmental correction file that was derived for the image selected in Step 17 above.
19. Under Input Valid Detections AOI File, select a valid detections AOI derived from pixels in the additional scene that are believed to contain the MOI.
20. Under Input False Detections AOI File, select a false detections AOI derived from pixels in the additional scene that are NOT believed to contain the MOI.Important information about Valid and False Detection AOI Files is listed below:
• You must input at least one of the Valid and/or False Detection AOI files. The process will run with one or both as input.
• Use the Insert Null option when you are creating a Multi-Scene file with more than one additional scene and are not including both Valid and False Detection AOIs as input.

59Using IMAGINE Subpixel Classifier
• The Valid and False Detection AOIs can be any size but if they exceed 250 pixels the process will down sample to 250 pixels.
21. Under Output Multi-Scene File, enter the name of the file that will contain the multiple scene information. It is not necessary to add the .msf extension.
22. Click OK. The Multi-Scene dialog is closed and you return to the Automatic Signature Derivation dialog. The .msf filename you just created is displayed at the bottom of the dialog next to the Additional Scenes button.
23. Click OK to start Automatic Signature Derivation. A job status dialog is displayed indicating the percent complete of each individual operation in the process. When the status reports Done, click OK to close the dialog. See further information below on evaluating APS Signature Reports.
Interpreting the Automatic Signature Derivation Report
The Automatic Signature Derivation Report file includes the five best subpixel signatures resulting from the Automatic Signature Derivation process. For each of these signatures, the training set name, the SEP value, the number of pixels in the training set, and signature description information are listed.
The five best signatures are ranked by their associated SEP values. The signatures with the lowest SEP values are the best. To calculate the SEP value for each signature the process evaluates ninety four different signature derived from the input training set. It uses the Training Set, Valid, and False Detection AOIs in this evaluation.
In the process of trying all of the signature options, the program creates different variations of the input training set. These are output as .ats files. The report file lists the training set used to derive each of the top five signatures listed.
The Automatic Signature Derivation Report file includes the five best subpixel signatures. You can then input these new signatures into MOI Classification.
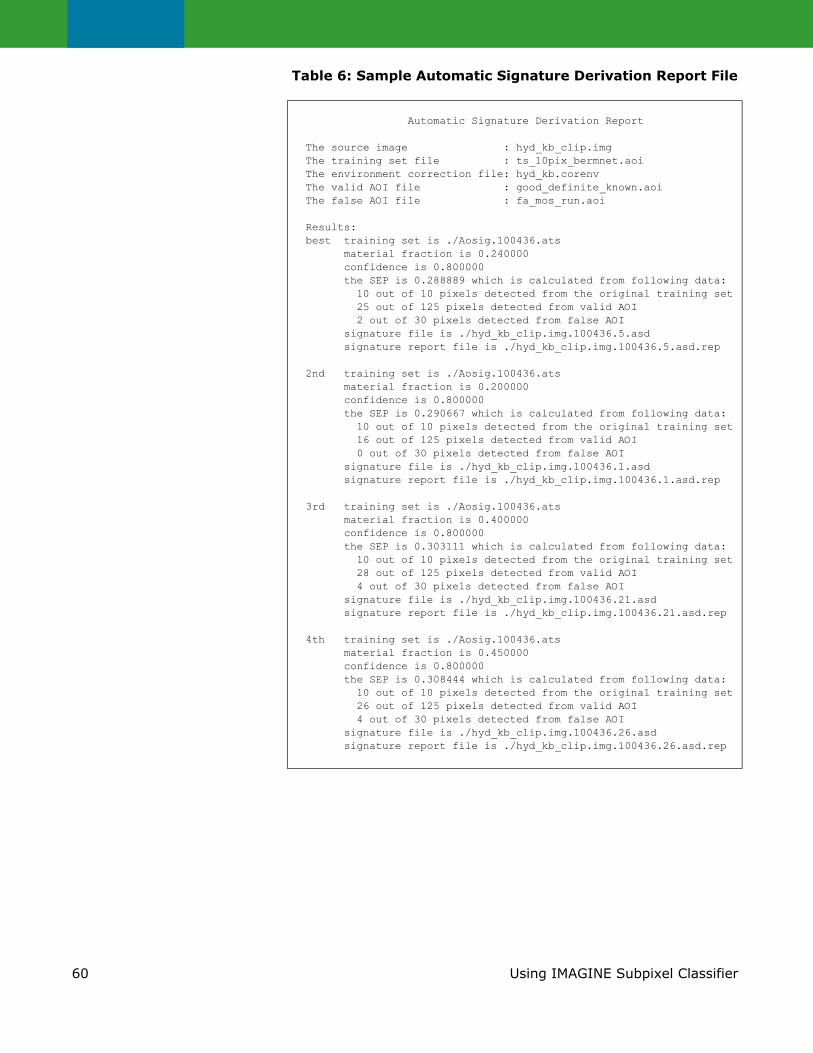
60 Using IMAGINE Subpixel Classifier
Table 6: Sample Automatic Signature Derivation Report File
Automatic Signature Derivation Report
The source image : hyd_kb_clip.img The training set file : ts_10pix_bermnet.aoi The environment correction file: hyd_kb.corenv The valid AOI file : good_definite_known.aoi The false AOI file : fa_mos_run.aoi
Results: best training set is ./Aosig.100436.ats material fraction is 0.240000 confidence is 0.800000 the SEP is 0.288889 which is calculated from following data: 10 out of 10 pixels detected from the original training set 25 out of 125 pixels detected from valid AOI 2 out of 30 pixels detected from false AOI signature file is ./hyd_kb_clip.img.100436.5.asd signature report file is ./hyd_kb_clip.img.100436.5.asd.rep
2nd training set is ./Aosig.100436.ats material fraction is 0.200000 confidence is 0.800000 the SEP is 0.290667 which is calculated from following data: 10 out of 10 pixels detected from the original training set 16 out of 125 pixels detected from valid AOI 0 out of 30 pixels detected from false AOI signature file is ./hyd_kb_clip.img.100436.1.asd signature report file is ./hyd_kb_clip.img.100436.1.asd.rep
3rd training set is ./Aosig.100436.ats material fraction is 0.400000 confidence is 0.800000 the SEP is 0.303111 which is calculated from following data: 10 out of 10 pixels detected from the original training set 28 out of 125 pixels detected from valid AOI 4 out of 30 pixels detected from false AOI signature file is ./hyd_kb_clip.img.100436.21.asd signature report file is ./hyd_kb_clip.img.100436.21.asd.rep
4th training set is ./Aosig.100436.ats material fraction is 0.450000 confidence is 0.800000 the SEP is 0.308444 which is calculated from following data: 10 out of 10 pixels detected from the original training set 26 out of 125 pixels detected from valid AOI 4 out of 30 pixels detected from false AOI signature file is ./hyd_kb_clip.img.100436.26.asd signature report file is ./hyd_kb_clip.img.100436.26.asd.rep

61Using IMAGINE Subpixel Classifier
Signature Combiner
The Signature Combiner will combine existing signatures and environmental correction factors for input into the IMAGINE Subpixel Classifier MOI Classification process. You can combine signatures to form a signature family, that is, a collection of signatures representing variations in a single material of interest. The use of signature families is discussed below. You can also combine signatures of different materials such that they are not in the same family. Whether or not a set of signatures is grouped into a Signature Family determines how the signature is processed in MOI Classification.
The two or more individual signature files that are combined by the Signature Combiner will retain their own individual signature properties. You control the family membership (Family Number) of the newly combined signatures either using an option in the Signature Combiner dialog or by manually editing the associated .sdd file for the combined signature. The .sdd file is an ASCII text file that describes the multiple signature contents and parameters.
Signature Combiner is also used to combine the signature’s companion environmental correction files since each signature must have a set of corresponding environmental correction factors. These new multiple signature and environmental correction files can be used as input to MOI Classification.
Using Signature Families Multiple signature files containing signature families can be used to classify materials that exhibit variability in their spectral signature, either in-scene or scene-to-scene. The natural variability of the MOI is represented by the signature family members. The Multiple Signature Classification process forces signatures from different families to compete against each other. The signature that best matches some fraction (value from 0.0 to 1.0) of the pixel is awarded that fraction. All of the signatures compete for the remaining fraction of the pixel again. The signature that best matches the remainder is awarded its corresponding fraction of the remainder, and so on until a minimum fraction is reached.
By grouping signatures into a family, you instruct the MOI Classification process to treat each member signature independently during classification. In effect, family members do not compete with each other during classification since they represent variations of the same material. The average fraction for the family best represents the Material Pixel Fraction of that material.
The use of signature families is best illustrated through an example. Suppose you wish to more fully classify a material which exhibits variability over time, such as a plant species that exhibits a different appearance at different times during its growing cycle. Your area of interest may contain the plant species at different stages of development. You can more accurately identify the plant species by developing a signature family consisting of, for example, three signatures derived from different images at different stages in the development of the plant species.

62 Using IMAGINE Subpixel Classifier
You would use Signature Combiner to create the signature family from the three individual signatures. Each signature is in the same family which means it has the same Family Number (see below). During MOI Classification, signatures from the same family are treated independently. They do not compete with each other. In this example, when using signature 1, a given pixel is classified as containing 50% of the MOI, as containing 60% using signature 2, and as containing 60% using signature 3. The total is well over 100%, but the average fraction is 56.7%. The classification output for each pixel would consist of 4 layers, one for each signature and a fourth layer representing the average Material Pixel Fraction. The fourth layer gives you the best overall view of where the material exists within the scene and at what amount. Each individual layer, best represents classification results for individual signature variations.
Now suppose you want to combine this signature family with a different, unrelated signature. You might want to detect variations of the plant species in conjunction with the location of a different material, such as a particular type of soil. The plant signatures and the soil signature are for very different materials and a given pixel can contain no more than 100% of their combined fractions.
You can think of the classification output in terms of sets of signatures. A signature set contains one and only one member from each family. This means that there will never be two members from the same family in the same set. In this example, there are three sets of signatures. The first set contains the soil signature and the first member of the plant signature family. The second set contains only the second member of the plant signature family and the third set contains only the third member of the plant signature family.
During classification using the first signature set, the soil signature competes with the first member of the plant signature family. The signature that best matches a fraction of the pixel is awarded that fraction. The remainder of the pixel is tested against these two signatures again. If one makes a detection, that fraction is recorded. The combination of the plant and soil signatures cannot exceed 100%.
Next, using the remaining two signature sets, the two plant signatures are tested against the full pixel without regard to the soil signature or to each other. The MOI Classification output consists of five layers, four representing the individual signatures and one combined layer. In this case, the last layer (combined layer) represents the total amount of the pixel classified by both plant and soil signatures. The fraction is computed by taking the average fraction from all three signature sets. This may or may not be a useful indicator, depending on the application.
Components of Multiple Signature Files
Multiple signature files are constructed using the Signature Combiner process. Each member signature is stored in its own signature file (.asd file). Signature description documents (.sdd files) contain additional information about the signature including family membership.

63Using IMAGINE Subpixel Classifier
Signature Description Document (.sdd) File
Signature Derivation generates a signature (.asd) file and a companion signature description document (.sdd) file. This companion .sdd file contains parameters specific to the output signature file, including the parameter Family which can be used to manipulate the MOI Classification output.
Table 7: Example Signature Description Document File
In this example, there are four lines of information for each signature. Lines beginning with “#” represent comments. The first line of information contains the signature ID (an integer), a Family number (an integer), a Rank (should always be 0), a SEP value (should always be 0.0), and a CAV Ratio. The second line contains the signature name. The third line contains the source image (the image from which the signature was derived). The fourth line contains the name of the image where this signature was evaluated. Since the name of the evaluation-image is unknown, a blank line is shown in this example. Further information on each element in the file is provided below.
ID
The ID number determines the order of the classification output planes.
Do not change the ID value in the .sdd file.
Family Number
A Family represents signatures related by a common characteristic, such as variations of a single MOI. The Family number identifies which family a signature belongs to in a multiple signature file. You control which signatures are related, i.e., which signatures belong to which family. You can specify how signatures are placed in families using the Signature Combiner. You can also edit the .sdd file of the combined signature to control family membership.
#ID Family Rank Sep CAV Ratio#Signature-Name#Source-Image#Evaluation-Image1 1 0 0.000 0.00018689134filename.asdfilename.img

64 Using IMAGINE Subpixel Classifier
Assigning a Family Number to a Signature
Family numbers for combined signatures are created based on one of three options that you specify when using Signature Combiner. You can elect to have signatures placed in separate families or the same family. A third option, to preserve family membership, is useful when you run Signature Combiner more than once to combine multiple signature files. This way you can create signature families and then combine them while preserving family relationships. Combining multiple signature families is an advanced option that should be used with care.
The Family Number of a signature is defined in the second column of the first line of the .sdd file. You can change the Family Number by editing the .sdd file. The Family Number identifies the family membership of a signature. For example, if you have two or more signatures in the .sdd file that have the same family number, such as 1, then they belong to the same family. If they have different values, for example 1 and 2, they belong to different families.
What Happens When You Alter Family Numbers
The individual classification layers and the final combined output plane of a MOI classification detection file are influenced by the assignment of Family Numbers. If the Family Numbers in the .sdd file are the same for all single signatures, then those signatures will not compete with each other during classification. If those family numbers are not the same, then the single signatures in different families will compete during detection.
When the signatures do compete, the combined percent of the pixels occupied cannot be greater than 100%. If the signatures do not compete, the combined percent of the pixel occupied can be over 100%. This is because each family member’s detection percentage is independent of other family members. Two signatures in the same family could each represent 60% of the pixel while some other material represents 40%. The sum of all three is greater than 100%, but the combination of percentages from different families is less than or equal to 100%.
Rank
The signature Rank parameter is reserved for future use. Currently its value should always be set to 0. In the future, this value will control which signature is reported in which layer in a multiple signature classification situation.
SEP Value
This value is reserved for future use and is always 0.0 in this version of the software.
Refer to “Interpreting the Automatic Signature Derivation Report” and “Automatic Signature Derivation” to review the SEP Value explanation.

65Using IMAGINE Subpixel Classifier
CAV Ratio
The CAV Ratio measures the diversity of spectral characteristics associated with the detected training set pixels. This number should be less than 1.0. If the CAV Ratio is significantly larger than 1.0, the signature should be re-derived.
Operational Steps Inputs for the Signature Combiner include:
• Existing Signature Files and the companion .sdd files (signature description document)
• Existing companion Environmental Correction files.
The Environmental Correction files MUST be input in the same order as their corresponding signatures. The same corenv file must be entered multiple times if multiple signatures from the same scene are to be combined.
Signatures and corenv files derived from different scenes can also be combined. In this case the input corenv files will determine the mode of classification (in-scene or scene-to-scene) in the Multiple Signature Classifier.
1. Click Signature Combiner from the Signature Combiner dialog to open:
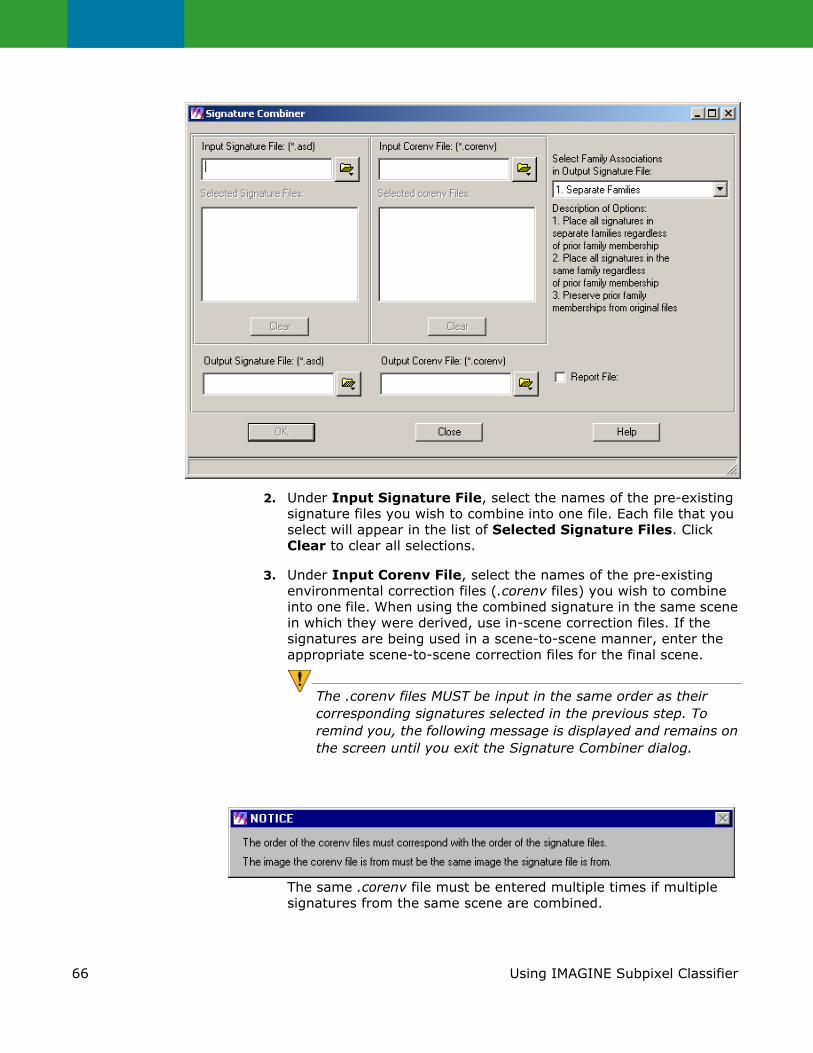
66 Using IMAGINE Subpixel Classifier
2. Under Input Signature File, select the names of the pre-existing signature files you wish to combine into one file. Each file that you select will appear in the list of Selected Signature Files. Click Clear to clear all selections.
3. Under Input Corenv File, select the names of the pre-existing environmental correction files (.corenv files) you wish to combine into one file. When using the combined signature in the same scene in which they were derived, use in-scene correction files. If the signatures are being used in a scene-to-scene manner, enter the appropriate scene-to-scene correction files for the final scene.
The .corenv files MUST be input in the same order as their corresponding signatures selected in the previous step. To remind you, the following message is displayed and remains on the screen until you exit the Signature Combiner dialog.
The same .corenv file must be entered multiple times if multiple signatures from the same scene are combined.

67Using IMAGINE Subpixel Classifier
4. Select the type of family associations that should be used when combining the input signatures. You can elect to have the signatures placed in separate families or in one single family. A third option, to preserve family membership, is useful when you run Signature Combiner more than once to combine multiple signature files. This way you can create signature families and then combine them while preserving family relationships created before.
Combining multiple existing signature families is an advanced option that should be used with care.
5. Under Output Signature File, enter the name of the file that will contain the multiple signature file generated by this process. It is not necessary to add the .asd extension.
6. Under Output Corenv File, enter the name of the file that will contain the multiple corenv file generated by this process. It is not necessary to add the .corenv extension.
7. If you wish to generate an ASCII text signature report file, click the Signature Report button. A report file name is automatically created by adding the extension .asd.report to the name you entered for Output Signature File.
8. Click OK to start Signature Combiner. A job status dialog is displayed indicating the percent complete. When the status reports 100%, click OK to close the dialog.
9. At this point, you can combine other signatures or click Close to close the Signature Combiner dialog.
Signature Evaluation and Refinement
Developing a quality signature is an iterative process. After a signature is created, the MOI Classification function is used to test its performance. The Signature Evaluation and Refinement capability with IMAGINE Subpixel Classifier uses Signature Derivation and MOI Classification to refine a signature to improve it's performance, both in-scene and scene-to-scene
Two separate functions exist within the Signature Evaluation and Refinement tool: Signature Evaluation Only (SEO) and Signature Refinement and Evaluation (SRE). With SEO, you can evaluate existing signatures using classification results and user-defined AOIs. The classification results are derived from the respective signatures while the AOIs reflect valid or false locations of the MOI within the classification output.
The SRE option refines an existing signature by creating a new signature (the child) and evaluate the new child signature in comparison to the original (parent signature). Three AOI's (false detection, valid detection, and missed detection locations) are optional but recommended for SRE.

68 Using IMAGINE Subpixel Classifier
Two additional inputs to both SEO and SRE are required: Target Area and Level of Importance. Both parameters control how the signature Evaluation Value (figure of merit) is calculated. Target Area refers to the number of pixels surrounding each point within any of the input AOIs. A Target Area kernel size larger than the 1x1 default will add additional pixels to the evaluation process. For example, the 3x3 kernel will evaluate the point plus the eight neighboring pixels of each point for all of the input AOIs.
Level of Importance is also important in determining how the signature performs. For each of the AOIs entered, a level of importance can be specified. The Level of Importance value is used as a weighting factor in the calculation of the Evaluation Value, which is reported in the output report. The Evaluation Value describes the performance of the signature based on the input AOIs. The weighting factor for Level of Importance High is 3 while the weighting value for Low is 1.
An example of how the level of importance can be used in SRE is as follows. If the valid AOI is very important and you do not want to give up these detections with the child signature, you would set the level of importance for the Valid AOI to High and set the value for the False and Missed AOIs to Low. This tells the program to weight the valid AOI detections more heavily when computing the Evaluation Value. This allows the signature that detects the most pixels from the Valid AOI to achieve a larger figure of merit than a signature that detects more pixels in the Missed AOI or less pixels in the False AOI.
Signature Evaluation Only (SEO)
Signature Evaluation Only (SEO) is used to evaluate and compare two or more existing signatures. This evaluation process can be used for individual signatures or multiple signatures that produce both in-scene and scene-to-scene classification results. The process output is a report file which includes an Evaluation Value. The signature with the lower Evaluation Value is the better signature.
You can process single signatures one at a time and compare the Evaluation Values manually or input a multiple signature file and have the process automatically rank the Evaluation Values of the individual signatures.
You can contribute to the evaluation process by pointing out detections, from classification results created with the input signature, that are valid and false detections using the ERDAS IMAGINE AOI tool. Further description of the AOI's can be found below in the SRE section. Manually comparing single signatures is only effective when the SAME False Detection and Valid Detection AOI files are input to the SEO run.
Inputs for the Signature Evaluation Only option include:
• Selection of the image and its companion preprocessing file
• An environmental correction file
• A signature file with its companion .sdd file (signature description documentation)

69Using IMAGINE Subpixel Classifier
• A Detection file derived from the input signature
• A classification tolerance value equal to that used in the input detection file NOTE: This value can be changed but in order to evaluate signatures fairly should be consistent with the input detection files tolerance.
• A Valid Detection AOI File (Optional)
• A False Detection AOI File (Optional)
A Valid Detection AOI File includes detections from the classification output file in which you have more than 90% confidence that these pixels do contain the material of interest.
A False Detection AOI File includes detections from the classification output detection file in which you have more than 90% confidence that these pixels do not contain any of the materials of interest.
Operational Steps for SEO
1. Click Signature Evaluation/Refinement from the Signature Derivation menu.
The Signature Evaluation/Refinement (Signature Evaluation Only) dialog opens.

70 Using IMAGINE Subpixel Classifier
2. Click the Signature Evaluation Only radio button.
3. Under Input Image File, select the input image used to create the Input Detection file.
4. Under Input Corenv File, select the name of the environmental correction factor file used to create the Input Signature.
5. Under Input Signature File, select the name of the pre-existing signature file that you want to evaluate.
6. Under Input Detection File, select the name of the pre-existing classification output created with the signature file from Step 3.
7. Input a False Detection AOI, if you wish to add to the accuracy of the evaluation process by using false detections from the Input Detection File.
8. Input a Valid Detection AOI, if you wish to add to the accuracy of the evaluation process by using valid detections from the Input Detection File.
9. Choose the Level of Importance (weighting factor) for either of the two AOI files input.

71Using IMAGINE Subpixel Classifier
10. Under Target Area, select a kernel size.Any Target Area kernel size larger than 1x1 default will add additional pixels to the signature evaluation process. For example, the 3x3 kernel will add the eight neighbors of each pixel in the Valid, False, and Missed AOI to the evaluation process.
11. Under Classification Tolerance, input the classification tolerance used during the processing of the Input Detection File.
12. Under Report File, you have the option of changing the default output report file name. It is not necessary to add the .report file extension.
13. Click OK to start Signature Evaluation Only.The Signature Evaluation Report is an ASCII text file that lists the number of signatures evaluated, the names of the signatures and the Evaluation Values computed for each. The Evaluation Value is the same as the SEP value for the signature.
Table 8: Sample Signature Evaluation Report
Signature Refinement and Evaluation (SRE)
The Signature Refinement and Evaluation (SRE) function evaluates an existing signature using MOI classification output created from the signature and creates a refined signature based on these detections and three AOIs input by you. The AOIs define detection locations for valid, false, and missed detections. The SRE option will produce a new signature called the child. This program automatically performs an evaluation process on the output child signature in comparison to the parent signature. The results of this comparison are included in an output report file.
The three possible input AOIs are described as follows.
The Valid Detection AOI File includes detections from the classification output file in which you have more than 90% confidence that these pixels contain the material of interest.
The Missed Detection AOI File includes pixels from the image that should have been detected by the signature but were not. You should be at least 90% confident that these pixels contain the material of interest.
The False Detection AOI File includes detections from the classification output file in which you have more than 90% confidence that these pixels do not contain any of the materials of interest.
These three AOIs are often point AOIs; but polygons could be used if there were contiguous patches of false, missed, or valid detection pixels.
The number of signatures evaluated: 1The name of the signature is:spot_grass_M53C80T150.asdThe evaluation value is 0.009306

72 Using IMAGINE Subpixel Classifier
The way in which the signature is derived depends on which of the three AOIs are provided to the program. You should be aware of two possible scenarios. First, if no AOIs are input to the program, all detections are assumed valid and used for child signature derivation. Second, if only a False AOI is input, any pixel in the detection file not located in the false AOI is used for child signature generation (all detections not located in the False AOI are ASSUMED valid). The best case scenario is to input all three AOIs so the program will make no assumptions about valid detections.
Here is an example of how the Level of Importance specification can be used in performing Signature Refinement/Evaluation. If the valid AOI is very important and you do not want to give up these detections with the child signature, you should set the level of importance for the Valid AOI to High and set the value for the False and Missed AOIs to Low. This tells the program to weight the valid AOI detection more heavily when calculating the evaluation equation. Thus the signature that detects the most pixels from the Valid AOI will achieve a larger figure of merit than a signature that detects more pixels in the Missed AOI or less pixels in the False AOI.
Signature Evaluation and Refinement can be used for in-scene and scene-to-scene processing. The Input Image to Signature Refinement and Evaluation is always the same image used to create the detection file. Inputs for the Signature Refinement and Evaluation option include:
• Selection of the Image and its companion preprocessing file
• An environmental correction file
• A pre-existing signature file and its companion .sdd file
• A detection file created from the pre-existing signature file and the input image file.
• A False Detection AOI File
• A Valid Detection AOI File
• A Missed Detection AOI File
The required AOI files are:
• A Valid Detection AOI File includes detections from the classification output file in which you have more than 90% confidence that these pixels do contain the material of interest.
• A False Detection AOI File includes detections from the classification output detection file in which you have more than 90% confidence that these pixels do not contain any of the materials of interest.

73Using IMAGINE Subpixel Classifier
• A Missed Detection AOI File includes known detection locations from the Input Image file that were not detected in the Detection File.
Operational Steps for SRE
1. Click Signature Evaluation/Refinement from the Signature Derivation menu. The Signature Evaluation/Refinement (Signature Refinement and Evaluation) dialog opens.
2. Click the Signature Refinement and Evaluation radio button.
3. Under Input Image File, select the image used in conjunction with the Input Signature to create the Input Detection File.
4. Under Input Corenv File, select the name of the environmental correction factor file created for the image selected in Step 3.
5. Under Input Signature File, select the name of the pre-existing signature that you want to evaluate and refine.

74 Using IMAGINE Subpixel Classifier
If you input a Multiple Signature file into SRE, the valid, false, and missed AOIs will represent detections on the combined detection layer from the MOI classification output.
6. Under Input Detection File, select the name of a pre-existing classification output created with the Input Signature File from Step 5.
7. Under Output Signature File, enter the name of the file that will contain the refined signature generated by this process. It is not necessary to add the .asd extension.
8. Input a False Detection AOI if you wish to add to the accuracy of the refinement and evaluation process by using false detections from the Input Detection File.
9. Input a Missed Detection AOI if you wish to add to the accuracy of the refinement and evaluation process by using pixels known to contain the material of interest but where not detected in the Input Image File from Step 3.
10. Input a Valid Detection AOI if you wish to add to the accuracy of the refinement and evaluation process by using valid detections from the Input Detection File from Step 6.
11. Choose the Level of Importance for each of the three AOIs that were input.
12. Under Target Area, select a kernel size. Any Target Area kernel size larger than 1x1 default will add additional pixels to the signature evaluation process. For example, the 3x3 kernel will add the eight neighbors of each pixel in the Valid, False, and Missed AOI to the evaluation process.
13. Under Classification Tolerance, input the classification tolerance used during the processing of the Input Detection File.
14. Under Report File, you have the option of changing the default output report file name. It is not necessary to add the .report file extension.
15. Click OK to start Signature Refinement and Evaluation.The Signature Refinement and Evaluation Report is an ASCII text file that lists the number of signatures refined, the names of the signatures refined and those created, and the Evaluation Values computed for each signature along with a remark indicating the quality of the refined signature. The Evaluation Value is the same as the SEP value for the signature.
Refer to "Automatic Signature Derivation" on page 52 for more information about SEP values.
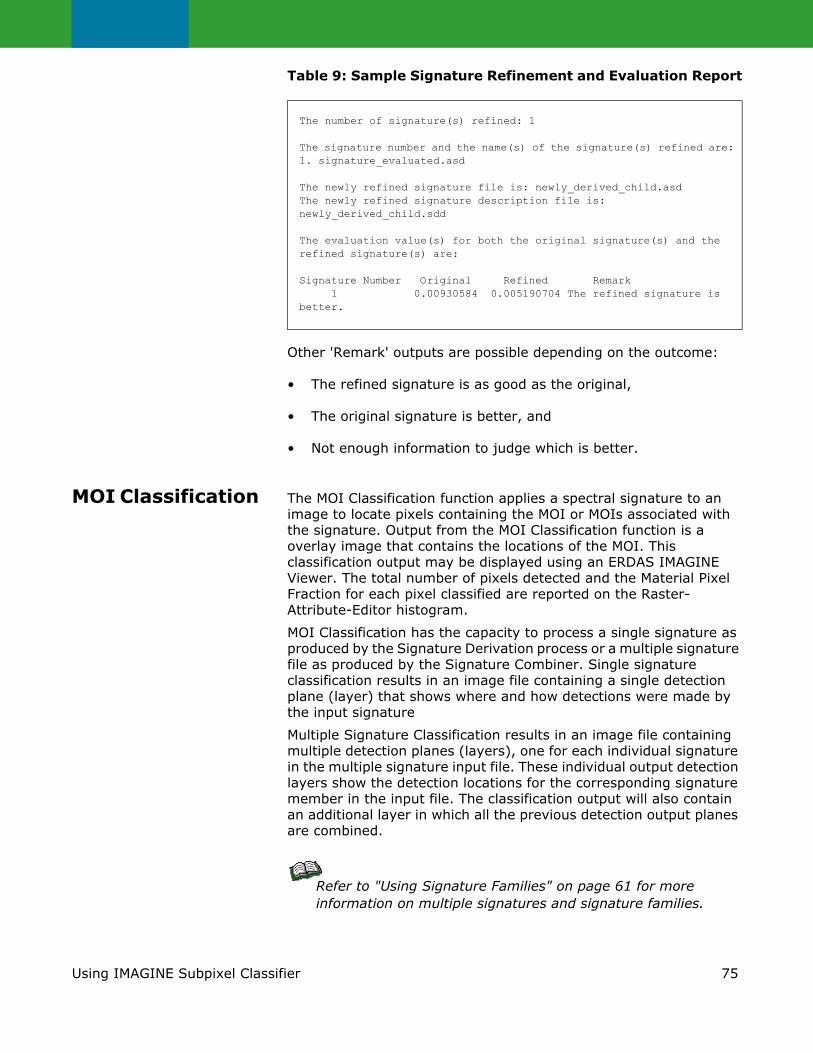
75Using IMAGINE Subpixel Classifier
Table 9: Sample Signature Refinement and Evaluation Report
Other 'Remark' outputs are possible depending on the outcome:
• The refined signature is as good as the original,
• The original signature is better, and
• Not enough information to judge which is better.
MOI Classification The MOI Classification function applies a spectral signature to an image to locate pixels containing the MOI or MOIs associated with the signature. Output from the MOI Classification function is a overlay image that contains the locations of the MOI. This classification output may be displayed using an ERDAS IMAGINE Viewer. The total number of pixels detected and the Material Pixel Fraction for each pixel classified are reported on the Raster-Attribute-Editor histogram.
MOI Classification has the capacity to process a single signature as produced by the Signature Derivation process or a multiple signature file as produced by the Signature Combiner. Single signature classification results in an image file containing a single detection plane (layer) that shows where and how detections were made by the input signature
Multiple Signature Classification results in an image file containing multiple detection planes (layers), one for each individual signature in the multiple signature input file. These individual output detection layers show the detection locations for the corresponding signature member in the input file. The classification output will also contain an additional layer in which all the previous detection output planes are combined.
Refer to "Using Signature Families" on page 61 for more information on multiple signatures and signature families.
The number of signature(s) refined: 1
The signature number and the name(s) of the signature(s) refined are:1. signature_evaluated.asd
The newly refined signature file is: newly_derived_child.asdThe newly refined signature description file is:newly_derived_child.sdd
The evaluation value(s) for both the original signature(s) and the refined signature(s) are: Signature Number Original Refined Remark 1 0.00930584 0.005190704 The refined signature is better.

76 Using IMAGINE Subpixel Classifier
Inputs to the MOI Classification process include:
• Selection of the image
• A preprocessing file
• An environmental correction file
• A signature file and its companion signature description document file
• A classification tolerance number to control the number of false detections
Scene-to-Scene Processing
You can apply a signature to a different image with the Multiple Signature Classifier. Some considerations for scene-to-scene processing are as follows:
Scene-to-Scene with a Single Signature
The only difference between single signature scene-to- scene classification and in-scene classification is the use of a scene-to-scene environmental correction file and a signature derived from another scene.
Scene-to-Scene with a Multiple Signature
There are other possible scenarios when using combined signatures scene-to-scene.
• All the single signatures combined are derived from the same image and are used to process that same (source) image.
• A combination of source scene (the image being classified) and scene-to-scene (a new image) single signatures.
• A combination of single scene-to-scene signature files. These single scene-to-scene signature files may be derived from different images.
When processing scene-to-scene with a multiple signature file, join the correct environmental correction file with each individual signature in the Signature Combiner.
The combined scene-to-scene multiple signature file can only be applied to the image from which the in-scene and/or scene-to-scene environmental correction factors were derived. Otherwise the environmental correction factors are incorrect.

77Using IMAGINE Subpixel Classifier
Operational Steps
1. Click MOI Classification from the main menu to open the MOI Classification dialog.
2. Under Image File, select the image on which to perform MOI Classification.
3. Under CORENV File, select the name of the environmental correction factor file created for the image selected in Step 2.
4. Under Signature File, select the name of the signature to be applied to the image.
5. Under Detection File, enter the name of the file that will contain the classification results. It is not necessary to add the .img extension.

78 Using IMAGINE Subpixel Classifier
6. For Classification Tolerance, select or accept the default classification tolerance (1.0). The tolerance value can be increased to include more pixels into the detection set or decreased to reduce unwanted false detections. This number may be entered manually or incrementally adjusted.
Modification of the Classification Tolerance will result in increased processing times.
You should not increase the tolerance by a large number. If detections appear too sparse, then adjusting the tolerances may help to fill in the missing detections. If they are still too sparse with a tolerance of 2.00 or higher, this indicates a degree of variance in the MOI that may require multiple signatures to obtain more complete detections.
See "Signature Development Strategy" on page 40.
The largest Classification Tolerance the IMAGINE Subpixel Classifier will accept is 6.00 and the smallest is 0.10. If you try to enter a tolerance larger than 6.00, the IMAGINE Subpixel Classifier will automatically default back to 6.00. If a tolerance less than 0.10 is entered, then the entry defaults to 0.10.
7. Under Output Classes, specify the number of output classes in the classification detection plane(s). You may select 2, 4, or 8 Material Pixel Fraction classes. The default value is 8. Table 10 details the Material Pixel Fraction Class Ranges for each class selection.
Table 10: Material Pixel Fraction Class Range
Output Class 2
Output Class 4
Output Class 8
0.20-0.59 0.20-0.39 0.20-0.29
0.60-1.00 0.40-0.59 0.30-0.39
0.60-0.79 0.40-0.49
0.80-1.00 0.50-0.59
0.60-0.69
0.70-0.79
0.80-0.89
0.90-1.00
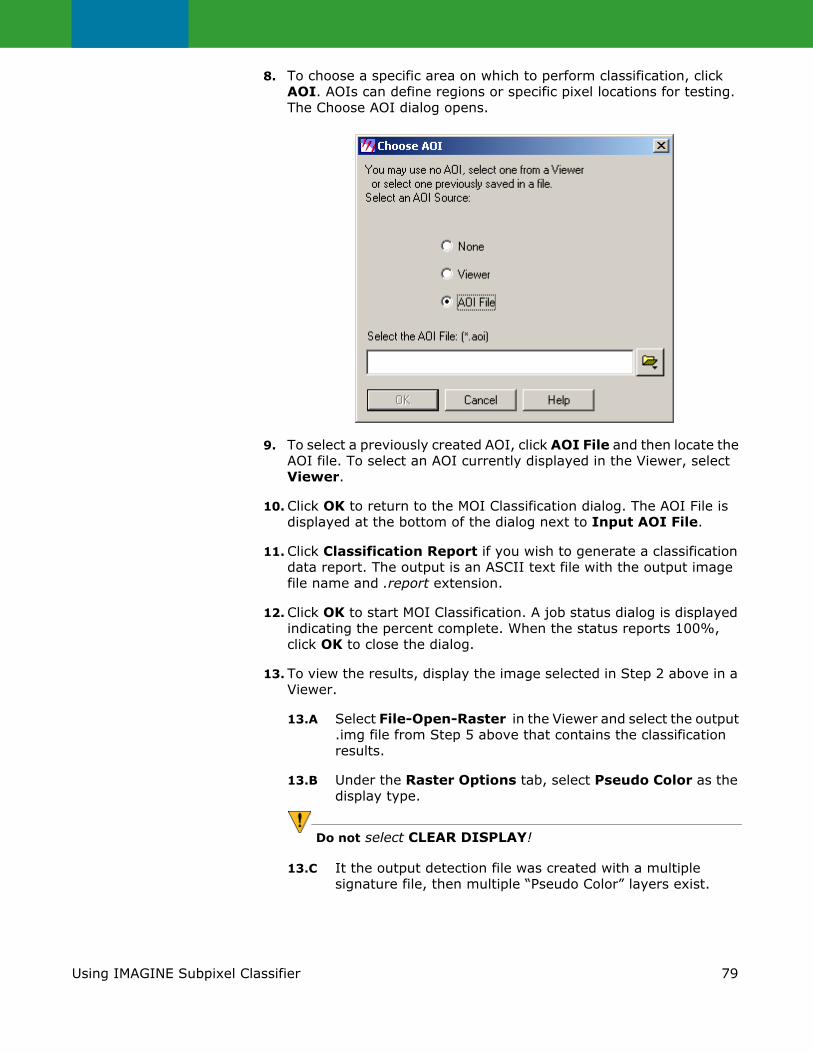
79Using IMAGINE Subpixel Classifier
8. To choose a specific area on which to perform classification, click AOI. AOIs can define regions or specific pixel locations for testing. The Choose AOI dialog opens.
9. To select a previously created AOI, click AOI File and then locate the AOI file. To select an AOI currently displayed in the Viewer, select Viewer.
10. Click OK to return to the MOI Classification dialog. The AOI File is displayed at the bottom of the dialog next to Input AOI File.
11. Click Classification Report if you wish to generate a classification data report. The output is an ASCII text file with the output image file name and .report extension.
12. Click OK to start MOI Classification. A job status dialog is displayed indicating the percent complete. When the status reports 100%, click OK to close the dialog.
13. To view the results, display the image selected in Step 2 above in a Viewer.
13.A Select File-Open-Raster in the Viewer and select the output .img file from Step 5 above that contains the classification results.
13.B Under the Raster Options tab, select Pseudo Color as the display type.
Do not select CLEAR DISPLAY!
13.C It the output detection file was created with a multiple signature file, then multiple “Pseudo Color” layers exist.
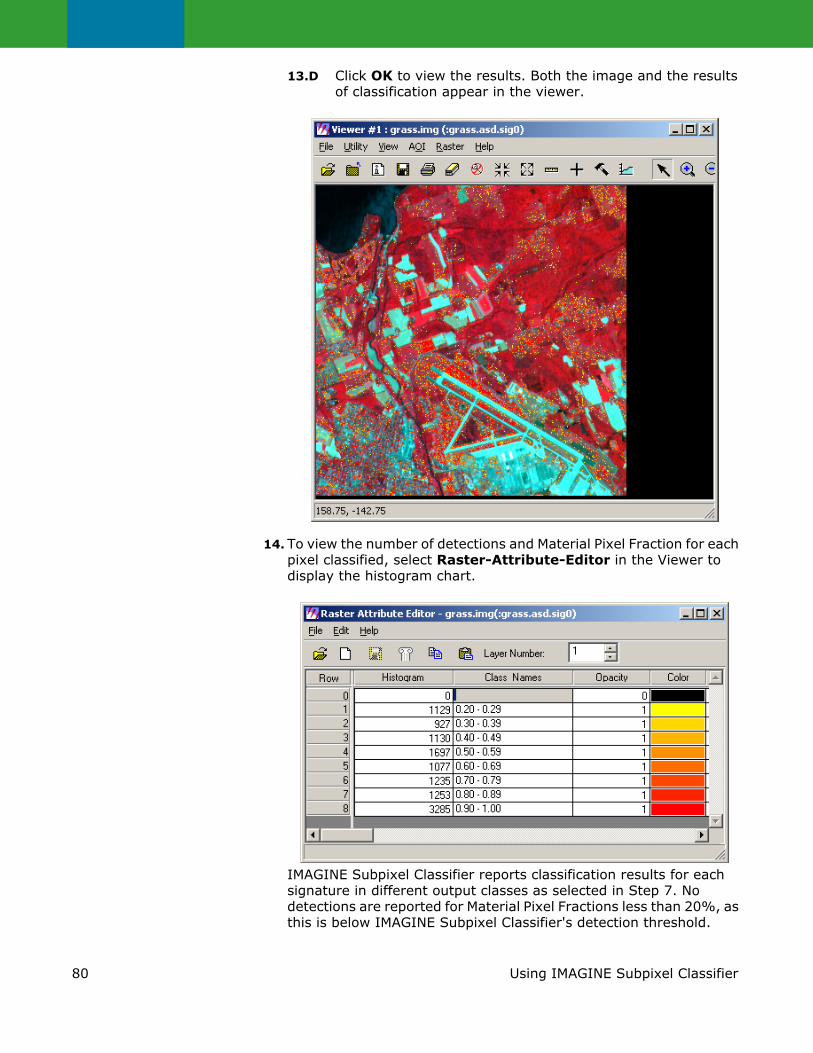
80 Using IMAGINE Subpixel Classifier
13.D Click OK to view the results. Both the image and the results of classification appear in the viewer.
14. To view the number of detections and Material Pixel Fraction for each pixel classified, select Raster-Attribute-Editor in the Viewer to display the histogram chart.
IMAGINE Subpixel Classifier reports classification results for each signature in different output classes as selected in Step 7. No detections are reported for Material Pixel Fractions less than 20%, as this is below IMAGINE Subpixel Classifier's detection threshold.

81Using IMAGINE Subpixel Classifier
15. To modify the color of each class in the overlay file, select the color patch for a class and select a color choice, or select Other to open the Color Chooser dialog.
16. To exit MOI Classification, click Close.When reviewing the results of the MOI Classification, you can overlay and determine the impact of DLAs on the image. To do this, display the Quality Assurance output file overlaid with the classification results. Detections on a pixel known to contain a DLA may be incorrect because its spectral characteristics may have been altered by the supplier during the duplication process.If the classification results are less than expected, the classification tolerance in MOI Classification can be modified or the signature can be re-derived and refined.
MOI Classification Results
The end products of running Classification are:
• The MOI Classification image which shows the MOI detection locations with the help of the ERDAS IMAGINE Viewer. This image may be overlaid on the original image. You can use the ERDAS IMAGINE Raster Attribute Editor to display statistics about the classification image.
• A Classification Report which summarizes the number of detections for each output class (see Table 5-2).
The MOI Classification Report provides several pieces of information about the MOI Classification results:
• A record of the MOI Classification detection file name, image file name, .corenv file name, signature file name, classification tolerance value, and the input .aoi file used in classification.
• The total number of pixels of the MOI detected and a histogram of detections as a function of the Material Pixel Fraction.

82 Using IMAGINE Subpixel Classifier
• A record of the signature spectrum, the environmental correction spectra (ACF and SCF), and whether the processing mode was in-scene or scene-to-scene.
MOI Classification results can be assessed to evaluate signature quality. Whole-pixel detections in the classification output can be used to assess whether the signature is of the desired MOI. Whole pixels, which contain 90-100% of the MOI, are assigned a class value of 8 in the Raster Attribute Editor cell array (when 8 output classes are requested for the classification output). These whole pixels are spectrally similar to the signature, and likely to be comprised entirely of the MOI represented by the signature. For example, detections in a grassy field rather than on large parking lots or rooftops may indicate that the signature is of grass along a road rather than of the road material being sought. If this occurs, the Material Pixel Fraction or choice of training pixels should be refined.
Refining Your Training Set
If assessment of the Signature Report and MOI Classification output indicates that the training set is too diverse, re-examine the recommendations for training set selection to be sure they have been followed.
The principal cause of excessive diversity is related to the Material Pixel Fraction of the training set. Try adjusting the choice of training set pixels to achieve more uniform Material Pixel Fractions and/or material characteristics. For example, try using the AOI Region Growing tool. Check to be sure that the other guidelines for selecting training set pixels, Material Pixel Fractions, and confidence value have been followed. The confidence value may need to be reduced to limit the diversity. If the detections are too sparse, it may also be necessary to increase the training set size in conjunction with lowering the confidence value. If the diversity is still too high, multiple signatures may be required to represent the unique characteristics of the materials in the training set.
Selecting the Material Pixel Fraction
MOI Classification output can also be assessed by evaluating the number of pixels detected in areas known to contain the MOI compared with the number of pixels detected in areas where the MOI is known to be absent. The relative number of detections in these areas provides an indication of the level of discrimination that is being achieved by the signature. The Material Pixel Fraction should be adjusted to optimize this discrimination. If the Material Pixel Fraction alone does not provide adequate discrimination, the choice of training set pixels, confidence value, or environmental correction may need to be refined.

83Using IMAGINE Subpixel Classifier
If the signature is different than expected, the most likely source of the problem is an improperly selected Material Pixel Fraction. Consider using Automatic Signature Derivation.
Use the recommended guidelines for selecting the Material Pixel Fraction to be sure that the optimum fraction has been selected. If the Material Pixel Fraction does not seem to be the problem, the training set pixels may need to be re-selected.
See "Defining a Training Set" on page 42.
If the signature still does not perform adequately, the environmental correction may need to be refined. The environmental correction spectra applied are listed in the Signature Report.
See Automatic Environmental Correction on page 31.
If the level of discrimination appears to be reasonable but the detections are sparse, then either the diversity of the training set is un-representative of the material being sought, or the environmental correction should be refined.
It should be noted that IMAGINE Subpixel Classifier classification output is frequently sparser than classification output from traditional whole pixel multispectral classifiers. This is because the IMAGINE Subpixel Classifier signature is for a specific material common to the training set pixels, rather than a collection of materials. In other words, IMAGINE Subpixel Classifier excludes dissimilar materials where more traditional classification techniques include all materials. The specific material is detected only in those training set pixels with large enough Material Pixel Fractions (greater than 20%). Thus, sparser detections than expected may occur.
Beyond Classification
This section contains some tips for improving the presentation of your classification results and making them more useful. Once you have your subpixel classification image, there are a number of post-processing techniques you can use to create an informative, easy to interpret presentation that is customized to your particular needs.
These techniques utilize ERDAS IMAGINE image processing tools such as Geometric Correction, Ground Control Point, Raster Attribute Editor, and Viewer tools such as Swipe, Blend Fade, Layer Stack, Color, and Opacity.

84 Using IMAGINE Subpixel Classifier
Using the Raster Attribute Editor
Color Gradients
A color gradient can be created to analyze histogram results utilizing the ERDAS IMAGINE Raster Attribute Editor. The standard gradient is from yellow to red, that is, the classification output’s lowest percentage would be represented in yellow and highest percentage in red. This technique allows you to see at a glance what percent of occurrences of the MOI is associated with each pixel.
1. Open the image in Pseudo Color in the Viewer.
2. Select the raster attribute row numbers from 1-8.
3. Move the mouse to Edit-Colors.
4. Select the Start Color yellow and the End Color red. Choose the minimal color for Hue Variation.
Example: Forestry data is often found in a natural gradient. Thick forests gradually give way to the edge of the forest and then to a road or clearing.
Viewing subpixel data matching the gradient of nature will give you a better understanding of the meaning of the subpixel detections.
Cursor Inquiry
Open the Attribute Editor and select the desired pixel in the Viewer. The Raster Attribute Editor will indicate to which class the detection belongs.
Opacity
The opacity column in the Raster Attribute Editor can be changed for each class. Any value between 0 and 1 can be used. This is an alternative to, or supplement for, the use of color to designate the percent of occurrences of the MOI in individual pixels.
Georeferencing Assigning map coordinates to IMAGINE Subpixel Classifier output and input images is recommended as a post-processing step. The ERDAS IMAGINE Rectification tools are utilized to georeference these images.
1. Display the base image in the Viewer.
2. Start the Geometric Correction Tool.
3. Record ground control points (GCPs).
4. Compute a transformation matrix.
5. Resample the image.
6. Verify the rectification.

85Using IMAGINE Subpixel Classifier
7. Save the result of rectification in a .gms file.
8. Apply this model to the IMAGINE Subpixel Classifier output, using the Open Existing Model option in the Geometric Correction menu.
9. Place results on top of the rectified base image.
10. Now you can use the inquire cursor to obtain the coordinates of IMAGINE Subpixel Classifier results. You do this by positioning the inquire cursor over every detection point you want coordinates for, and then hand writing the coordinates individually.This step may be replaced by the following procedure.
Semi-automatic collection of coordinates
Instead of using the inquire cursor and manually obtaining the coordinates one by one, you can use the AOI tool in the Viewer to semi-automate the process.
10.A Rectify the classification results by applying the *.gms geographic model to the IMAGINE Subpixel Classifier output .img file.
10.B Create a point AOI within the rectified classification image of the detections for which you want coordinates. Save this AOI.
10.C Go to Session-Utilities-Convert Pixels to ASCII.
10.D In Input Image, enter: IMAGINE Subpixel Classifier results.img.
10.E Select ADD.
10.F In Type of Criteria, enter: AOI (input the point AOI created in Step B above).
10.G In Output file, enter: an ASCII text file that contains a table that can be opened with a text editor.
Map Composer The ERDAS IMAGINE Map Composer is a WYSIWYG (What You See Is What You Get) editor for creating cartographic quality maps and presentation graphics. Its annotation capabilities allow you to automatically generate text, legends, scale bars, georeferenced grid lines, borders, symbols, and other graphics. You can select from over 16 million colors and more than 60 text fonts.
Maps are created and displayed in Map Composer Viewers. To start Map Composer, click the Composer icon on the ERDAS IMAGINE icon panel.

86 Using IMAGINE Subpixel Classifier
GIS Processing IMAGINE Subpixel Classifier Classification output can be combined and integrated with other classification output, imagery, and ancillary data using GIS manipulations. Because the quantitative Material Pixel Fraction information is in .img format, it is ready for use in GIS modeling. The mean pixel fraction data can be used in GIS processing to indicate what percentage of each pixel is classified by multiple IMAGINE Subpixel Classifier signatures.
Recoding IMAGINE Subpixel Classifier Material Pixel Fraction classes can be recoded by assigning “weighting” values using the ERDAS IMAGINE Recode tool. Recoding the output allows you to emphasize the importance of some classes based upon specific criteria you may have for your application. For example, you may be looking for a certain vegetative species growing in a certain soil.
This tool can be accessed in the Raster dialog. Select the Recode Data option. Then select the Setup Recode button. The Recode dialog opens. See the ERDAS IMAGINE Tour Guide for specific instructions in the use of the Recode tool.
Image Interpreter The ERDAS IMAGINE Image Interpreter is a group of more than 50 utility functions that can be applied to enhance images. The Convolution, Focal Analysis, Layer Stack, and Subset functions are described here.
Convolution
The ERDAS IMAGINE Convolution function enhances the image using the values of individual and surrounding pixels. It can be useful as a filter to remove false detections. For example, certain species of vegetation are usually found clustered together.
To use the Convolution feature:
1. Click the Interpreter icon in the IMAGINE icon panel.
2. Click the Spatial Enhancement button.
3. Click Convolution. This tool provides a list of standard filters and lets you create new kernels, which can be saved to a library.
4. Select the kernel to use for the convolution. From the scrolling list under Kernel, select 3 x 3 Edge Detect. Select File-Close-OK.
Focal Analysis
The ERDAS IMAGINE Focal Analysis function enables you to analyze class values in an image file to emphasize areas of clustered MOI detections and de-emphasize isolated and scattered detections. You can remove isolated false detections and “fill in” non-classified pixels between classified pixels based on the density of classified pixels.
Multiple passes of Focal Analysis progressively “fills in” between classified pixels. This approach is useful in agricultural applications where isolated false detections (for example, a few pixels classified as corn in a wheat field) must be filtered out, and incomplete detections within a field must be “filled in”.

87Using IMAGINE Subpixel Classifier
Layer Stack
The ERDAS IMAGINE Layer Stack allows you to rearrange or remove layers of data in a file. This enables you to make a composite image of several subpixel results.
Subset
The Subset utility allows you to copy a selected portion of an input data file into an output data file. This function can be employed when your MOI detections are all in one portion of the image to create a new image of the AOI, thereby saving space and processing time.

88 Using IMAGINE Subpixel Classifier

89Tutorial
TutorialThis chapter provides a simple example of how IMAGINE Subpixel Classifier functions are used to process an image and detect a Material of Interest. It is intended as a first introduction to the software. It provides detailed instructions as it walks you through the basic Preprocessing, Environmental Correction, Manual Signature Derivation, and MOI Classification processes. In this example, you will define a signature for a field of grass from a SPOT multispectral image and then apply the signature. Some of the more advanced aspects of signature derivation and refinement are not covered.
This section will take you through the steps necessary to solve a real problem with IMAGINE Subpixel Classifier. The basic IMAGINE Subpixel Classifier functions (Preprocessing, Environmental Correction, Manual Signature Derivation, and MOI Classification) are used to define a signature for grass and detect grass fields in a 350 x 350 pixel SPOT multispectral image of Rome, New York. The signature is applied to the entire image, and the detections of the grass are verified.
The image used in this demo was provided by SPOT Image Corporation, copyright 1995 CNES. The level 1A format image was acquired on June 16, 1992. To evaluate the training set pixel selection and IMAGINE Subpixel Classifier classification results, two aerial photograph files in .img format are provided. These color photographs were acquired on June 14, 1992. Some color variations in the photographs are due to heavy broken cloud cover.
It is recommended that you actually try the tutorial using the input files provided with the software. Carefully follow the steps described, particularly if you are new to ERDAS IMAGINE. You can compare the output files against the set of verification files provided. Should questions arise while running the demonstration, please refer to “Using IMAGINE Subpixel Classifier” on page 19 for further explanation of the functions and data entry fields.
Starting IMAGINE Subpixel Classifier
Sample data sets are separately installed from the data DVD. For the purposes of documentation, <ERDAS_Data_Home> represents the name of the directory where sample data is installed.
1. All the data needed to run this demo is stored in <ERDAS_Data_Home>\examples\subpixel_demo. Verification files are also stored here. Copy this folder to a workspace on your disk where you have write permission. Use the ERDAS IMAGINE Preferences tool to make the copied subpixel_demo directory your default directory for the duration of the tutorial. This directory should contain the input files listed in Table 11 below.

90 Tutorial
Table 11: Input Files and Verification Files for Tutorial
2. To start ERDAS IMAGINE, select ERDAS from the Windows Start menu and navigate to select ERDAS IMAGINE [version]. The icon panel opens.
3. To start IMAGINE Subpixel Classifier, select its icon.
The IMAGINE Subpixel Classifier main menu opens.
Input Files Verification Files
ROMEspot.img verifyROMEspotgrass.img
ROMEspotgrass.aoi verifyROMEspot.corenv
ROMEspotarea.aoi verifyROMEspotgrass.asd.report
verifyROMEspotgrass.img.report
verifyROMEspotgrass.ovr
ROMEairphotoA.img
ROMEairphotoB.img
ROMEairphotoC.img

91Tutorial
Preprocessing The Preprocessing function surveys the image for backgrounds to be removed during Signature Derivation and MOI Classification to generate subpixel residuals of the MOI. Output from this function is a .aasap file that must co-exist with the input image when running subsequent IMAGINE Subpixel Classifier functions.
To derive the Preprocessing file for ROMEspot.img:
1. Select Preprocessing from the IMAGINE Subpixel Classifier main menu. The Preprocessing dialog opens.
2. Under Input Image File, select ROMEspot.img.
3. Under Output File, the default ROMEspot.aasap is displayed.
4. Select OK to start the process. The Preprocessing dialog will close and a job status dialog opens. This dialog indicates the name of the file begin created and the percentage completion of the process. When the status box reports “Done” and 100% complete, select OK to close the job status dialog.
Automatic Environmental Correction
The Automatic Environmental Correction function calculates a set of factors to compensate for variations in atmospheric and environmental acquisition conditions. These correction factors, which are output to a .corenv file, are then applied to the image during Signature Derivation and MOI Classification. By compensating for atmospheric and environmental variations, signatures developed using IMAGINE Subpixel Classifier may be applied to scenes of differing dates and geographic regions making the signature scene-to-scene transferable.
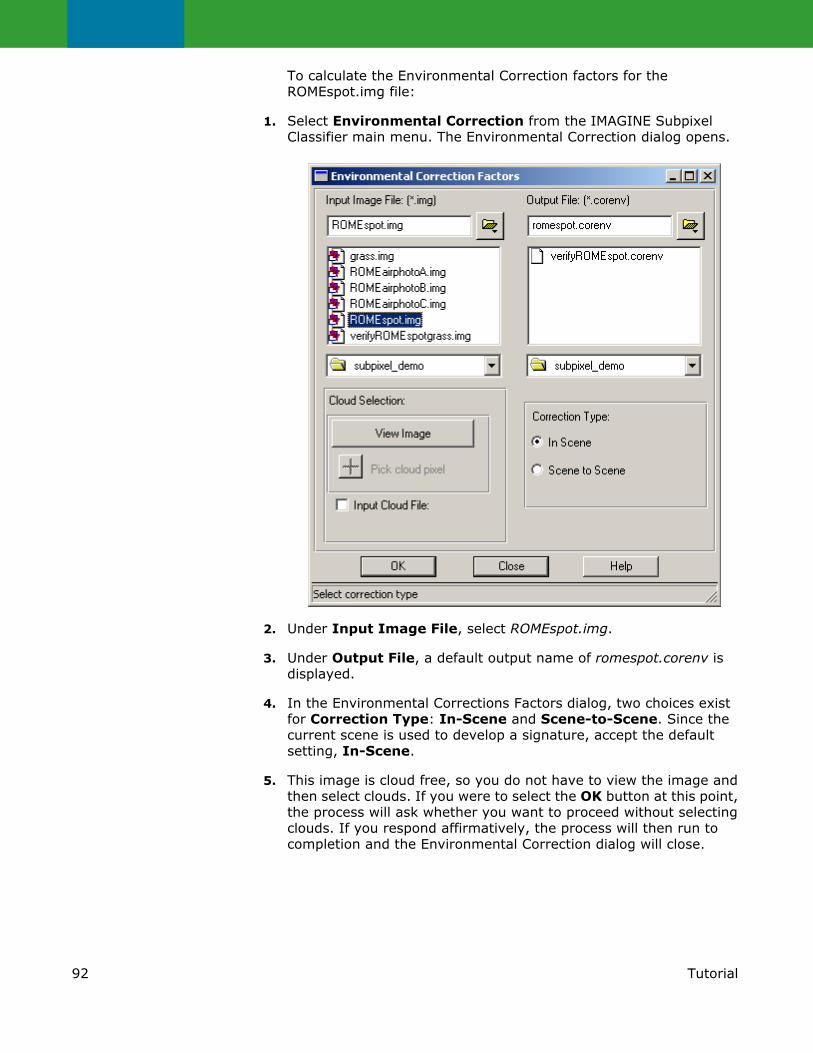
92 Tutorial
To calculate the Environmental Correction factors for the ROMEspot.img file:
1. Select Environmental Correction from the IMAGINE Subpixel Classifier main menu. The Environmental Correction dialog opens.
2. Under Input Image File, select ROMEspot.img.
3. Under Output File, a default output name of romespot.corenv is displayed.
4. In the Environmental Corrections Factors dialog, two choices exist for Correction Type: In-Scene and Scene-to-Scene. Since the current scene is used to develop a signature, accept the default setting, In-Scene.
5. This image is cloud free, so you do not have to view the image and then select clouds. If you were to select the OK button at this point, the process will ask whether you want to proceed without selecting clouds. If you respond affirmatively, the process will then run to completion and the Environmental Correction dialog will close.

93Tutorial
For this tutorial, suppose you are unsure whether the image contains clouds and you want to check the image. Select the View Image button on the Environmental Correction dialog. The process must read the Preprocessing file and prepare to display the image in a new cloud selection viewer. The following progress bar indicates the progress in reading the Preprocessing file and preparing the image.When the process has completed preparing the image, the progress bar is closed and the process opens a new viewer and displays the image in the viewer. At this point, if the image had clouds, you could select them using the + tool.
6. Begin the Environmental Correction process by selecting OK. A new job status dialog is displayed indicating the percent complete. When the status reports 100%, select OK to close the dialog.
Output from the Environmental Correction process is an ASCII text file that contains two spectra. This romespot.corenv file, which is input to the Signature Derivation and MOI Classification functions, is an ASCII text file that can be viewed or printed.
To verify the output generated by this demonstration is correct, a verifyROMEspot.corenv file is provided. "Evaluation and Refinement of Environmental Correction" on page 38 provides a detailed explanation of how the output from this function is evaluated and refined.
Manual Signature Derivation
The Manual Signature Derivation function develops a single signature for a material that occupies either a whole pixel or a subset of a pixel. The signature is derived using a training set which is typically defined by an ERDAS IMAGINE AOI, a source image, an environmental correction file, and a Material Pixel Fraction. Signature Derivation on page 39 of this document provides a detailed explanation of signature derivation strategies and methods of deriving training sets.
For this demonstration, a field containing grass was identified using aerial photography that coincided with the ROMEspot.img file. Using the ERDAS IMAGINE point AOI tool, 190 pixels in a grassy field were selected and saved as ROMEspotgrass.aoi. Evaluation of the field in the aerial photograph revealed that the training set pixels in the polygon represent close to whole-pixel occurrences of grass. Therefore, the Material Pixel Fraction was estimated to be 0.90.
Operational steps begin on the next page.
To derive a signature for grass using the image file ROMEspot.img:
1. Select Manual Signature Derivation from the IMAGINE Subpixel Classifier Signature Derivation submenu. The Manual Signature Derivation dialog is displayed.
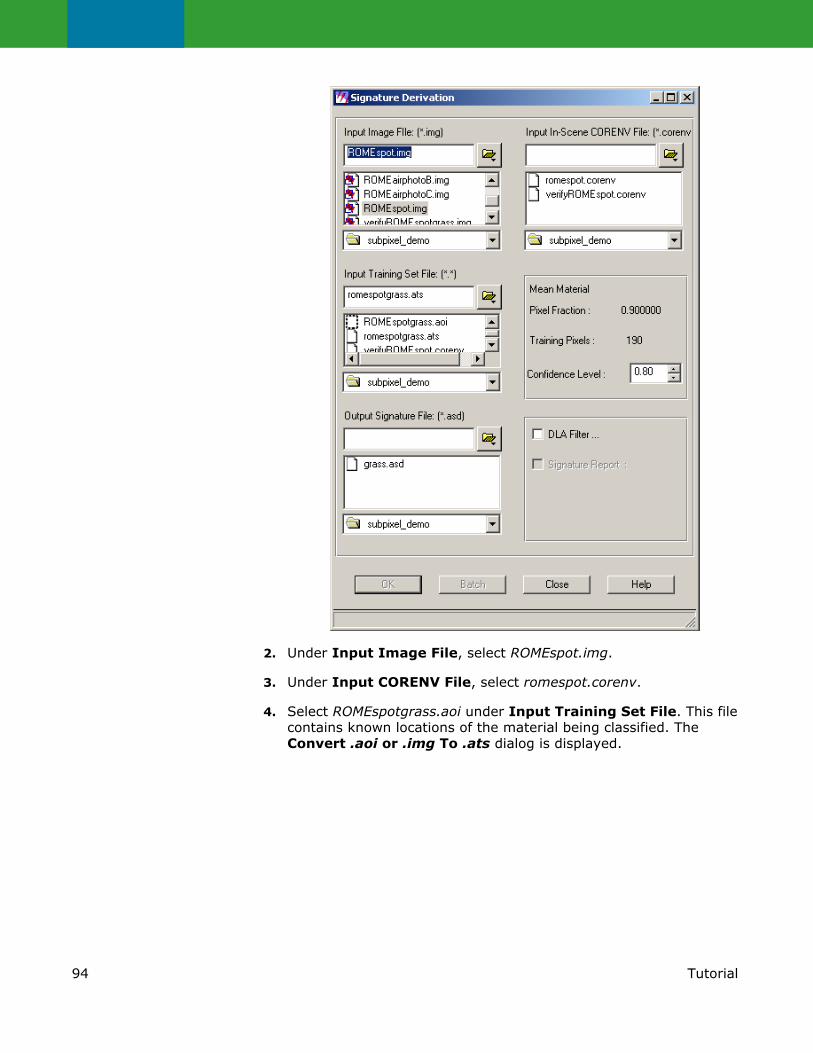
94 Tutorial
2. Under Input Image File, select ROMEspot.img.
3. Under Input CORENV File, select romespot.corenv.
4. Select ROMEspotgrass.aoi under Input Training Set File. This file contains known locations of the material being classified. The Convert .aoi or .img To .ats dialog is displayed.

95Tutorial
5. The Input Training Set File that was previously selected is now displayed in the Output Training Set File data field as romespotgrass.ats.
6. For Material Pixel Fraction, accept the default value of .90 since the grass identified in the image represents a whole-pixel occurrence of the material. A fraction of .90 or greater yields a whole-pixel signature. Whole-pixel signatures can always be used to make either whole-pixel or subpixel detections with IMAGINE Subpixel Classifier.Press the left-mouse button in the Material Pixel fraction box and press <RETURN> to activate the OK button.
7. Select OK to generate the Output Training Set File. After a short time, the IMAGINE Subpixel Classifier Manual Signature Derivation dialog is updated showing the new romespotgrass.ats file as the Input Training Set File.
8. For Confidence Level, use the default Confidence Level of 0.80. This fraction represents the estimated percentage of pixels in the training set that actually contain the MOI.
9. Under Output Signature File, enter romespotgrass.asd and press <RETURN>.
10. Do not select DLA Filter. The image does not contain DLAs. See Quality Assurance on page 24 for information on DLAs.
11. Select Signature Report to generate a signature data report. The output from this option is a file whose name is the signature file name with a .report extension: ROMEspotgrass.asd.report.

96 Tutorial
12. Select OK to start Signature Derivation. A job status dialog is displayed indicating the percent complete. When the status reports 100%, select OK to close the dialog.
13. To exit the Manual Signature Derivation dialog, select Close.
Output from Manual Signature Derivation is a signature report file (ROMEspotgrass.asd.report) and a signature file (romespotgrass.asd). The contents of the signature report can be viewed or printed.
To verify that the output generated by this demonstration is correct, a verifyROMEspotgrass.asd.report file is provided. You can compare this report to the one you generate to ensure that you have performed the function properly. The signature file is now ready for input to the MOI Classification function.
MOI Classification The MOI Classification function applies a signature to an image to locate pixels containing MOIs. Inputs include selection of the image, an environmental correction file, the signature, and a classification tolerance number to control the number of false detections. Output from the IMAGINE Subpixel Classifier MOI Classification function is a single-layer image file that contains the locations of the MOI. The classification output may be displayed using an ERDAS IMAGINE Viewer. The total number of pixels detected and Material Pixel Fraction for each pixel classified are reported using the ERDAS IMAGINE Raster-Attribute-Editor histogram.
In this demonstration, a field containing grass is identified and a signature is derived. Using the MOI Classification function, this signature is applied to an AOI within the image and the detections are displayed.
To detect occurrences of grass in the ROMEspot.img:
1. Select MOI Classification from the IMAGINE Subpixel Classifier main menu. The MOI Classification dialog is displayed.

97Tutorial
2. Under Image File, select ROMEspot.img.
3. Under CORENV File, select romespot.corenv.
4. Under Signature File, select romespotgrass.asd.
5. Under Detection File, enter ROMEspotgrass.img and press <RETURN>.
6. For Classification Tolerance, enter a classification tolerance of 1.0. Typically a tolerance of 1.0 would be selected initially. If the initial result is unsatisfactory, additional tolerances could be evaluated.
7. Select the AOI option to select an AOI in the image to process. The AOI Source dialog is displayed.

98 Tutorial
8. Select File and select ROMEspotarea.aoi. This .aoi file defines areas within the scene to process. To view the contents of the .aoi file, display ROMEspot.img in an ERDAS IMAGINE Viewer. Then open the ROMEspotarea.aoi, by doing the following: In the ERDAS IMAGINE Viewer, choose File-Open-AOI Layer. Select ROMEspotarea.aoi.
9. Select OK to exit the AOI Source dialog.
10. Under Output Classes, accept the default of 8.
11. Select Report File to generate an MOI Classification report.
12. Select OK to start MOI Classification. A job status dialog is displayed indicating the percent complete. When the status reports 100%, select OK to close the dialog.The output from the MOI Classification function is an ERDAS IMAGINE image file (ROMEspotgrass.img) and a classification report file (ROMEspotgrass.img.report). The report file can be viewed or printed.To verify that the output generated by this demonstration is correct, verifyROMEspotgrass.img and verifyROMEspotgrass.img.report files are provided.You can compare your output files with the verify files of the same name to ensure that they are the same.
13. To view the results, display ROMEspot.img in an ERDAS IMAGINE Viewer if it is not already displayed.
13.A Select File-Open-Raster and select the ROMEspotgrass.img file that contains the classification results.
13.B Select Pseudo Color.
Do not select CLEAR DISPLAY!
13.C Select OK to view the results. Both the image and the results of classification appear in the viewer.

99Tutorial
14. To view the number of detections and Material Pixel Fraction for each pixel classified, select Raster-Attributes to get to the Raster Attribute Editor. It displays the histogram chart.
IMAGINE Subpixel Classifier reports classification results for each signature in 2, 4 or 8 classes. In this demonstration, the default of 8 was used.

100 Tutorial
Results reported for Class Number 1, with a .20-.29 Material Pixel Fraction, indicates that those detections contain 20-29% of the MOI. Class 2 contains 30-39% of the MOI, and so on. See Table 10 on page 78 to learn how classification classes relate to Material Pixel Fraction.To modify the color of each class in the overlay file, select on the color patch for a class and select a color choice, or select Other and a Color Chooser dialog will appear.
15. To exit MOI Classification, select Close.

101Tutorial
An explanation of the detections made by IMAGINE Subpixel Classifier is provided in the following sections.
Viewing Verification Files
To verify the output generated by this demonstration is correct, four files have been included: verifyROMEspotgrass.img, verifyROMEspotgrass.corenv, verifyROMEspotgrass.asd.report, and verifyROMEspotgrass.img.report. Compare the contents of these files to the corresponding output files generated from the demonstration.
To view the verification files:
1. Keep the Viewer on the monitor that displays the results from Steps 13 and 14. Select Viewer from the ERDAS IMAGINE icon panel to open a second viewer. Enlarge the viewer to fill most of the screen.
2. Select File-Open-Raster Layer and select ROMEspot.img.
3. Select true color from the Raster Options tab, and fit to frame.
4. Select OK to display ROMEspot.img.
5. Select File-Open-Raster Layer and select the verifyROMEspotgrass.img file that contains the verification results.
6. Select the Raster-Options tab. Select Pseudo Color in the Display As box.
Do not select CLEAR DISPLAY!
7. Select OK to display verifyROMEspotgrass.img.
8. Select Raster-Attributes to get to the Raster Attribute Editor, which displays the histogram chart.
9. From the Viewer window, select on File-Open-Annotation and select the verifyROMEspotgrass.ovr that contains the annotation file.
10. Select OK to view the results. It may be necessary to enlarge the Viewer to see the entire image.
It is important to compare the histograms from both viewers to make sure the results are the identical. The histograms are also in the report files.
The ROMEspotgrass.img.report can be compared to the verifyROMEspotgrass.img.report. The ROMEspotgrass.asd.report can be compared to the verifyROMEspotgrass.asd.report. If these files do not have the same ACF, SCF, and signature spectra, then repeat the tutorial, being careful to select the files as specified.

102 Tutorial
Classification Results
Three aerial photographs are provided for analysis of the results generated. These areas correspond to those indicated as A, B, C in the annotation file displayed in Step 9 above. Area A corresponds to the area from which the training set pixels were selected for signature derivation. Areas B and C correspond to areas containing subpixel detections. A detailed explanation of these points of interest follows.
To view the aerial photograph files:
1. Select Viewer from the ERDAS IMAGINE icon panel to open a new viewer.
2. Select File-Open-Raster. Select ROMEairphotoA.img for area A. Repeat the preceding steps to view ROMEairphotoB.img of area B and ROMEairphotoC.img for area C.
Area A: Training Site The majority of the field is classified as containing .80-1.0 grass. Other pixels, particularly along the edges of the field, are classified as containing smaller fractions of grass. Looking at the aerial photograph of the field and the SPOT 3, 2, 1, color composite image, shading variations within the square in the center of the field can be observed. Note that the grass in the northern part of the field is slightly different than the grass in the southern part of the field. Thirty two of the 190 training set pixels were not detected as containing grass; they were spectrally different from the other training pixels.
In the adjacent field west of the training set field, there are many pixels classified as containing low fractions of grass. The aerial photograph of this field reveals that it contains grass, and also soil, trees, and shrubs intermixed with grass.
Areas B and C: Grass Lawns in the Airport Complex
The aerial photographs reveal that grass detections in this area correspond to grass lawns. The grass in these lawns is various shades of green and brown, indicating variations in the conditions of the grass. Not all of the lawn areas are classified as containing grass, but the grass areas that are spectrally similar to the training site grass are classified. Note that these pixels are classified as containing low fractions of grass because most of these small patches of lawn occur in mixed pixels containing sidewalks, parking lots, bare soil, etc.
Results Compared to Traditional Classifier Results
For a given training set, IMAGINE Subpixel Classifier will often classify different pixels than a traditional classifier such as a maximum likelihood classifier. When developing a signature, IMAGINE Subpixel Classifier excludes subpixel components of the training pixels that are not common. Traditional signature derivation typically averages all training pixel components. Traditional classification is based primarily on spectral intensity differences. IMAGINE Subpixel Classifier’s classification of subpixel residuals is based upon differences between band to band relationships as well as upon spectral intensity.

103Tutorial
Using the grass-field training set in this demonstration with traditional supervised classification techniques would produce a spectral signature that contains more diverse spectral variation than the IMAGINE Subpixel Classifier signature. Maximum likelihood classification results would probably include more diverse types of grass. IMAGINE Subpixel Classifier, however, would classify only those pixels containing the more specific type of grass that is common to the training set pixels.
Summary IMAGINE Subpixel Classifier is a classification tool for MOIs which have very specific spectral characteristics with minimal spectral variability. For materials or land cover types that have broad spectral characteristics and variability, such as “water,” “urban,” or “forest,” traditional classifiers will produce more complete but less specific classification results than IMAGINE Subpixel Classifier. IMAGINE Subpixel Classifier is designed for use on materials such as individual plant species, specific water types, or building materials.

104 Tutorial

105Tips on Using IMAGINE Subpixel Classifier
Tips on Using IMAGINE Subpixel ClassifierUsage tips and observations are presented in this chapter so that you may benefit from the experience of the developers of IMAGINE Subpixel Classifier, who have run this code with many different data types for numerous applications. These tips will help you to maximize your efficiency and minimize running time.
Use NN Resampled Imagery
The three most commonly used resampling techniques are NN, BI, and CC. NN resampling provides consistently superior signature quality and discrimination performance.
See Data Quality Assurance on page 13.
NN best preserves the spectral integrity of the image pixels since it provides only radiometrically corrected raw data measurements. BI and CC resampling perform spectral averaging with neighboring pixels, yielding pixels with spectral properties that deviate from the properties of radiometrically corrected raw data. BI and CC resampled imagery can significantly reduce the quality of derived signatures, as well as the level of discrimination for classification.
Sensors IMAGINE Subpixel Classifier can be used with either 8-bit or 16-bit data. The code requires at least 3 bands of multispectral data. It works with 3-band SPOT multispectral images and 6 of the 7 Landsat TM spectral bands. The sixth (thermal) band is ignored for all processing. Multispectral imaging is frequently available in several formats. IMAGINE Subpixel Classifier can be used with any available format.
Certain formats provide distinct advantages with respect to the quality of derived signatures and the discrimination performance of classifications. Table 12 provides recommended sensor formats.
Table 12: Recommended Sensor Formats
Sensor Recommended Format
Spot MS 20-meter Level 1A format
Landsat TM 30-meter geometrically-uncorrected, radiometrically-correct format
Other Sensors NN resampling and minimized band-to-band registration error

106 Tips on Using IMAGINE Subpixel Classifier
Landsat TM offers data in several pixel size formats. The sensor samples the terrain with only a 30-meter ground sampling distance. However, Landsat data is available in 30-, 28.5-, and 25-meter pixel size formats. To produce the smaller pixel sizes, pixels are artificially duplicated and inserted into the scene. These extra pixels can degrade spectral quality and ultimately affect signature quality and discrimination performance. Therefore, the 30-meter format is recommended for Landsat TM.
Both SPOT MS and Landsat TM data are available in geometrically-uncorrected and geometrically-corrected formats. Geometrically-uncorrected data generally produces superior signature quality and classification performance. The geometric correction process in Landsat TM data introduces DLAs, as discussed in Data Quality Assurance on page 13, and can produce significant band-to-band mis-registration, which significantly degrades the spectral integrity of image pixels. The highest spectral integrity is available in the radiometrically-corrected, geometrically-uncorrected format option for TM data. For SPOT imagery, Level 1A processing provides the highest spectral integrity.
Data Entry Guidelines
IMAGINE Subpixel Classifier only accepts images in the IMAGINE .img format. Use the IMAGINE IMPORT/EXPORT option to convert imagery in other formats to IMG.
Consistent naming of input and output files is highly recommended. See Table 1 on page 16.
IMAGINE Subpixel Classifier is designed to work with raw unsigned 8-bit and 16-bit imagery. It is not necessary to convert the image data to radiance or reflectance units prior to processing. Signed data may be used, but all of the image data should be positive. Negative image data values will likely produce error messages and problems with the classification results. Floating point data and panchromatic data are not supported.
Tips for Increasing Processing Speed
IMAGINE Subpixel Classifier’s core algorithm performs complex mathematical computations in deriving subpixel material residuals. Therefore, some of the processes such as preparing data sets, deriving signatures, and classifying imagery will take longer than traditional methods. Also, these complex calculations require more swap space compared with traditional classification techniques.
These tips should increase processing speed:
• Process a subscene of the larger image.
A 512 x 512 pixel image is more than adequate during signature derivation and classification refinement. Use a small AOI defining test areas to evaluate a signature’s performance during subpixel (Material Pixel Fraction less than .90) signature derivation.

107Tips on Using IMAGINE Subpixel Classifier
• Limit the size of the training set used in signature derivation. Quality, not quantity, is the important factor here.
• Process files on disk drives mounted locally, that is, on the same workstation as IMAGINE Subpixel Classifier is running on.
• Accessing large files across a network will usually result in slower processing times.
• Use whole or pure pixels (mean pixel of at least .90 MOI) in the signature derivation training set whenever possible.
The biggest savings in time, effort and complexity are realized when whole pixel signatures are used. Use subpixel (pixel less than .90 MOI) signature derivation only when a whole pixel signature cannot provide satisfactory performance.
The processing time to derive a IMAGINE Subpixel Classifier signature for a mean Material Pixel Fraction of at least .90 (whole pixel) is significantly less than that for a fraction less than .90 (subpixel). This is because subpixel signature derivation is more CPU intensive than whole pixel signature derivation.
Whole Pixel Selection Strategies
• Use any IMAGINE AOI tool to select the training pixels which contain greater than 90% of the MOI. The training set is then used by IMAGINE Subpixel Classifier to derive a whole pixel signature for the MOI.
• Use a traditional multispectral classifier, such as a maximum likelihood classifier, to define whole pixel occurrences of the MOI.
Example: A maximum likelihood classification may have effectively identified a particular species of vegetation. Using those pixels as the training set file, a IMAGINE Subpixel Classifier whole pixel signature could be derived. IMAGINE Subpixel Classifier Classification is then used to report the additional subpixel occurrences of the material in the image. These subpixel results can then be appended to the original maximum likelihood classification output. The end result is a more complete classification of the MOI.
Analysis and Interpretation Approaches
Below are several techniques that may be employed when it is time to analyze the results of your classification.
Evaluating Material Pixel Fraction information
• Classification output is divided into a user-specified number of classes of Material Pixel Fraction information.
• Each class contains all the pixels that were classified as containing a certain amount of the MOI, that is, 50% - 60% of the pixel area.

108 Tips on Using IMAGINE Subpixel Classifier
• Classes can be assigned different colors using the viewer/raster attribute editor. The number of pixels and spatial distribution of each class can be analyzed to understand conditions and patterns of the MOIs.
Multiple Signature Approach to improve accuracy
Classification accuracy may be improved by using multiple signatures when incomplete detections or non-uniform scene-to-scene performance occurs. This may indicate the need for multiple signatures to provide more complete detection of the MOI.
Example: A family of signatures may more accurately represent the seasonal variation of a plant’s spectral characteristics, that is, a vegetative species is detected in a late summer scene, but not in a late spring scene.
The MOI consists of two or more co-existing but spectrally different materials. Classification can sometimes be improved by developing a signature for each characteristic material and accepting as valid detections only those pixels detected by the set of signatures.
Example: Separate signatures for a plant’s leaves and seed pods may generate false detections, but together provide a discriminating signature of the plant.
Combining Classification Results
Subpixel classification results can be combined with traditional and other subpixel classification results using IMAGINE GIS and spatial modeling tools.
Post-processing Schemes A variety of post-processing schemes can be used to further extract and manipulate information from subpixel classification results for display, map output, and operational uses.
Examples:
• Material pixel fraction classes can be weighted for spatial clustering by using techniques such as IMAGINE Focal Analysis to retain classified pixels in high density areas and eliminate classified pixels in low density areas.
• Coincident pixels classified by two separate signatures can be treated as a single classification output.
• Mixed pixel material fraction data can be used in GIS modeling.
Signature Strategy/Training Sets
• Pixels can be selected using the IMAGINE AOI point, rectangle, polygon, and region growing tools. Training set pixels can also be defined using a thematic raster layer from a maximum likelihood classification.
• If MOIs occur in isolated pixels, take care to ensure that pixels have a high probability of actually containing the material
• Selected pixels should contain similar Material Pixel Fractions. You should minimize the use of extraneous pixels that do NOT contain the MOI.

109Tips on Using IMAGINE Subpixel Classifier
• When estimating Material Pixel Fraction, more conservative estimates usually yield higher quality signatures.
Improperly estimated Material Pixel Fraction could yield a signature for the wrong material or cause incomplete classification or regionally variable performance.
Tolerance The default setting is 1.0. If detections appear too sparse with a tolerance of 2.0 or higher, multiple signatures may be required. When a relatively wide range of material spectral conditions are present, one of IMAGINE’s traditional classifiers may be appropriate.
See "Signature Development Strategy" on page 40.
DLA Filter Use of the DLA filter is recommended when using older Landsat TM NN resampled data in all cases except when the MOI occupies large, homogeneous areas.
Other Facts to Know
• IMAGINE Subpixel Classifier does not operate on IMAGINE calibrated images. Calibrated images should be de-calibrated using Viewer/Layer Info/Delete Map Model.
• IMAGINE Subpixel Classifier will not accept AOI files created from a calibrated image.
• The DLA option in signature derivation is only available if a .ats file is input as a training set.

110 Tips on Using IMAGINE Subpixel Classifier

111Troubleshooting
TroubleshootingAn On-Line Help system is provided with your software to assist you with troubleshooting. Refer to the Error Message Tables following for error messages you may encounter to explain why the problem may have occurred and to suggest resolutions.
Check the IMAGINE Session Log when an error occurs for a more detailed error message.
Helpful Advice For Troubleshooting
• Is sufficient disk space available to run the IMAGINE Subpixel Classifier functions?
Sufficient disk space must be available in your directory to install the software, create output files, and create temporary files. Each time IMAGINE Subpixel Classifier is run, the software creates temporary files. These files are automatically deleted when the program finishes. The temporary file directory should be checked periodically to ensure that old files are removed. Check the disk space requirements for your system and be sure that sufficient space exists before starting a process.
• Is the system overloaded?
Under Windows, the performance meter found under the Windows Task Manager will display a chart plotting system activity.
• Were the data files moved recently to a new location?
Many times programs fail because the software cannot find all the files needed. Therefore, make sure that all files were copied to the new location.
• Are the working directory's permissions set properly?
Make sure that the directory's permissions are properly set to access that directory. You must have write permission for the directory where the image is located. You cannot process images stored on read-only media.
• Were the correct input files selected?
Double check the files selected. If you select a a file with the wrong file name extension, IMAGINE Subpixel Classifier will try to process it. But the program will terminate because the file's header is incompatible and cannot be read.
Error Message Tables
Table 13: General Errors
Type Messages General Explanation

112 Troubleshooting
Table 14: Processing Errors
File I/O I/O error
Fseek failed
Cannot open attribute file
Not enough free disk space.
File I/O Cannot open for append
Cannot read pixel file
Eimg_LayerGetNames( ) failed
Accessing an invalid hard or soft link.
File I/O Eimg_LayerOpen( ) failed
Error reading attributes
Error with the image data
Accessing an invalid temp directory.
File I/O Cannot find attribute file
Cannot open file name
Unexpected EOF reached
Inadequate file permission
Memory Cannot initialize pixel access system
Corrupt pixel line
Data is corrupted or incomplete
Apparently corrupted *.aasap file
Corrupted .img, .asd, or .aasap file; recreate file.
Other Cannot open display
Cannot find path to IMAGINE Subpixel Classifier executable file
Cannot register with the Session Manager
Initialization or environment errors.
Module Messages Suggestion
Preprocessing Not enough non-zero sample data points
Attempt to identify and use the high variance image bands (minimum of 3 bands)
Environmental Correction
ARAD output is too sparse
Low input difmat residual count
Reselect the clouds.
(See "Guidelines for Selecting Clouds, Haze, and Shadows" on page 36)
Signature Derivation
Could not derive a signature Modify the input training set pixels. Modify the input mean pixel fraction.

113Troubleshooting
Classification Could not initialize feature space.
Filters not generated.
An incomplete set of filters may have been generated.
Check system resource availability (disk, RAM, and swap). Use only the recommended input image types (See Guidelines for Data Entry on page 15).

114 Troubleshooting

115Interface with ERDAS IMAGINE
Interface with ERDAS IMAGINEIMAGINE Subpixel Classifier is integrated with ERDAS IMAGINE to take advantage of its powerful image handling tools.
Inputs to IMAGINE Subpixel Classifier are entered the same way as in IMAGINE. IMAGINE Subpixel Classifier is shown as an option on the IMAGINE icon panel. Click this icon to open a menu of the IMAGINE Subpixel Classifier functions.
To detect subpixel MOIs, you have to learn only the specific signature derivation and image classification techniques for IMAGINE Subpixel Classifier. Familiar IMAGINE tools are used for importing data, viewing images, creating training sets, and overlaying results.
The IMAGINE tools most commonly used with IMAGINE Subpixel Classifier are described here. They are:
• Viewer for Image Display
• Open Raster Layer
• Raster Options
• Arrange Layers
• Raster Attribute Editor
• AOI Tools
• Histogram Tools
• View Zoom
Viewer The ERDAS IMAGINE Viewer is a powerful tool for image visualization and enhancement. It is the main window for displaying raster, vector, annotation, and AOI data. It makes data visible as images, and can be used as a tool for image processing and raster GIS modeling. The Viewer displays layers as one of the following types: annotation, vector, pseudo color, gray scale, or true color. It is possible to overlay multiple layers of all types in a single Viewer. Parameters for the Viewer may be set with the ERDAS IMAGINE Preference Editor. You may open multiple Viewers.
Viewer functions are accessed with the Viewer menu bar across the top of the window, the Viewer tool bar below the Viewer menu bar, or a Quick View menu that displays when you right hold the mouse cursor in a Viewer window.
The ERDAS IMAGINE Essentials Tour Guide contains a tutorial for how to use the Viewer.
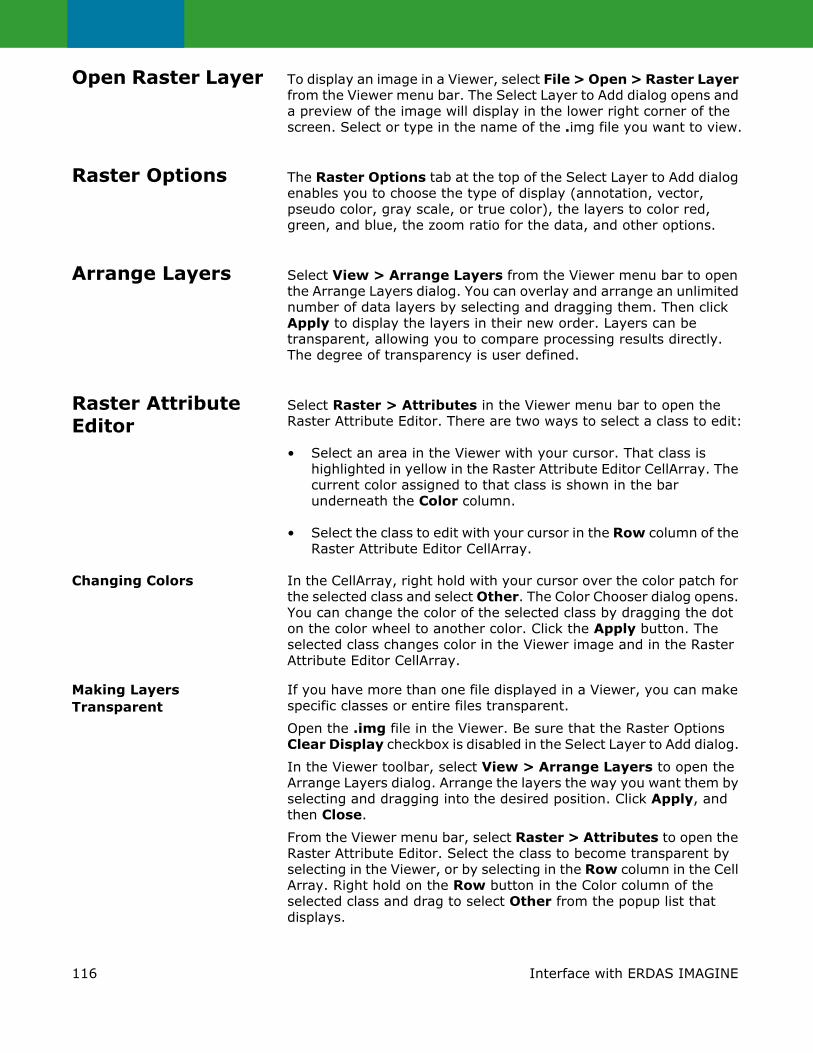
116 Interface with ERDAS IMAGINE
Open Raster Layer To display an image in a Viewer, select File > Open > Raster Layer from the Viewer menu bar. The Select Layer to Add dialog opens and a preview of the image will display in the lower right corner of the screen. Select or type in the name of the .img file you want to view.
Raster Options The Raster Options tab at the top of the Select Layer to Add dialog enables you to choose the type of display (annotation, vector, pseudo color, gray scale, or true color), the layers to color red, green, and blue, the zoom ratio for the data, and other options.
Arrange Layers Select View > Arrange Layers from the Viewer menu bar to open the Arrange Layers dialog. You can overlay and arrange an unlimited number of data layers by selecting and dragging them. Then click Apply to display the layers in their new order. Layers can be transparent, allowing you to compare processing results directly. The degree of transparency is user defined.
Raster Attribute Editor
Select Raster > Attributes in the Viewer menu bar to open the Raster Attribute Editor. There are two ways to select a class to edit:
• Select an area in the Viewer with your cursor. That class is highlighted in yellow in the Raster Attribute Editor CellArray. The current color assigned to that class is shown in the bar underneath the Color column.
• Select the class to edit with your cursor in the Row column of the Raster Attribute Editor CellArray.
Changing Colors In the CellArray, right hold with your cursor over the color patch for the selected class and select Other. The Color Chooser dialog opens. You can change the color of the selected class by dragging the dot on the color wheel to another color. Click the Apply button. The selected class changes color in the Viewer image and in the Raster Attribute Editor CellArray.
Making Layers Transparent
If you have more than one file displayed in a Viewer, you can make specific classes or entire files transparent.
Open the .img file in the Viewer. Be sure that the Raster Options Clear Display checkbox is disabled in the Select Layer to Add dialog.
In the Viewer toolbar, select View > Arrange Layers to open the Arrange Layers dialog. Arrange the layers the way you want them by selecting and dragging into the desired position. Click Apply, and then Close.
From the Viewer menu bar, select Raster > Attributes to open the Raster Attribute Editor. Select the class to become transparent by selecting in the Viewer, or by selecting in the Row column in the Cell Array. Right hold on the Row button in the Color column of the selected class and drag to select Other from the popup list that displays.

117Interface with ERDAS IMAGINE
In the Color Chooser dialog, select on the Use Opacity checkbox. Lower the number to the percent opacity you want, using either the number field or the slider bar. Select Apply in the Color Chooser dialog. The selected color becomes partially transparent, allowing you to see the image underneath.
AOI Tools You can restrict many operations to a particular AOI. AOIs are created in the Viewer and used in classification and other applications. You can create an AOI with one or more points, lines, and polygons using the AOI drawing tools on the screen. You can save an AOI to a file for later use.
Select AOI > Tools from the Viewer menu bar, or select the Tools icon.
The AOI Tool Palette opens. Select the rectangle icon. Move the cursor into the Viewer window. Drag and release to draw a rectangle over the AOI.
A rectangular AOI displays in the Viewer. You can move the AOI by dragging the box to a new location. You can resize the AOI by dragging any of the handles at the corners and sides of the box.
Histogram Tools In the Viewer menu bar, select Raster > Contrast > Breakpoints.
The Breakpoint Editor opens, showing a set of three histograms for your image, representing the red, green, and blue bands.
The x axis represents the range of values (0-255 for 8 bit data).
The y axis represents the frequencies of the histogram and the range of output values for the lookup table.
The Histogram Edit Tools are:
• Insert Breakpoint
• Cut Breakpoint
• Left-Right Curve
• Right-Left Curve (create a curve between two break points)
• Reference Line
View Zoom Select View > Zoom from the Viewer menu bar to zoom in or out in the image at the magnification factor you choose.
Move the scroll bars on the bottom and side of the Viewer to view other parts of the image.
There are also zoom icons on the toolbar.
You can enlarge the Viewer by dragging any corner.

118 Interface with ERDAS IMAGINE

119Glossary
GlossaryArea of Interest (AOI) A collection of pixels grouped using an IMAGINE digitized
polygon file.
CAV Ratio The C average ratio is a mathematical expression that measures the diversity of spectral characteristics associated with the detected training set pixels.
Class Value A data file value of a thematic file which identifies a pixel as belonging to a particular class.
Classification The process of finding pixels within a scene having spectral properties that are similar to a given signature of an MOI.
Classification Tolerance A parameter used to adjust the number of detections reported by IMAGINE Subpixel Classifier. Increasing the tolerance includes more pixels in the classification result. Decreasing the tolerance reduces false detections.
Confidence Level The percentage of training set pixels believed to actually contain the MOI.
CORENV See Environmental Correction.
DN Digital Number. Refers to a raw pixel spectrum value.
Duplicate Line Artifacts (DLAs)
DLAs occur during image resampling when gaps of missing data are filled in using duplicated pixels from an adjacent row.
Environmental Correction
A IMAGINE Subpixel Classifier function (CORENV) that compensates for variations in atmosphere and environmental conditions, enabling signatures to be used in different images.
Material of Interest (MOI)
A natural or man-made material to be detected. MOIs could be waterways, vegetation, hazardous materials, etc.
Material Pixel Fraction The fraction of a pixel containing the MOI.
Mean Material Pixel Fraction
The mean of the MOI fractions contained in each pixel of a training set.
MOI Classification A IMAGINE Subpixel Classifier function that applies a signature to an image to locate pixels containing the MOI.
Preprocessing A IMAGINE Subpixel Classifier function that surveys the image for possible backgrounds to be removed during Signature Derivation and MOI Classification to generate subpixel residuals of the MOI. Preprocessing must be run prior to other IMAGINE Subpixel Classifier functions, since its output serves as the input to all other IMAGINE Subpixel Classifier functions.

120 Glossary
Quality Assurance The process of identifying DLAs in imagery. QA enhances your ability to verify “good” imagery and to avoid DLAs when selecting the training set. (See Duplicate Line Artifacts).
SEP Signature Evaluation Parameter. A figure of merit value between zero and one generated by Automatic Signature Derivation, Signature Evaluation Only (SEO), and Signature Refinement and Evaluation (SRE). The best signature would have a SEP of zero and the worst would have a SEP of one.
Signature A description of the spectral properties of an MOI.
Signature Derivation A IMAGINE Subpixel Classifier function that develops a signature for an MOI from training set pixels.
Signature Report A text file containing information about the signature such as the number of pixels in the training set, the signature spectrum, and the specified input parameters.
Subpixel Less than 90% of a pixel contains the MOI.
Subpixel Classification See MOI Classification.
IMAGINE Subpixel Classifier
A supervised, non-parametric classifier that uses multispectral imagery data to classify materials that occupy as little as 20% of a pixel.
Subpixel Signature Output of the IMAGINE Subpixel Classifier Signature Derivation function, consisting of a signature spectrum and other information about the MOI. The signature spectrum is the equivalent of the set of image plane DNs for an image pixel comprised entirely of the MOI, with atmospheric radiances removed.
Training Set A set of pixels selected by you which contains the MOI for input to the signature derivation process. The development of a successful signature depends on the quality of the training set.
Whole Pixel A pixel containing greater than 90% of the MOI.
Whole-pixel Classification
Traditional image classifiers, such as Maximum Likelihood, Minimum Distance, Cluster, and ISODATA.

121Index
IndexAACF Spectrum 38Adaptive Signature Kernel 3AOI
Classification AOI 79, 97False AOI 55, 56, 58, 69, 72File Name Extension 16Missed Detection AOI 73MOI Classification 17, 57, 59, 79Refining Training Set 82Signature Derivation 21, 39Valid AOI 54, 56, 58, 69, 72
Automatic Signature Derivation 21, 52APS 3Interpreting Report 59Module 41Operational Steps 53
BBenefits 1BI. See Bilinear InterpolationBilinear Interpolation 15
Quality Assurance 15
CCAV Ratio 51, 65CC. See Cubic Convolution.Child Signature 67Class Value
Defining a Training Set 42In MOI Classification 82Input field 48Using IMAGINE Focal Analysis 86
Classification Threshold 55Cloud File 36Clouds
Important to Exclude 37Shadows 38
Confidence LevelIn Signature Derivation 48In Training Set 42, 43
Correction Type 21, 32, 92Cubic Convolution 15
Quality Assurance 15
DData Entry 15Data Formats
Geometric Correction 106
Pixel Size 5, 106Resampling 14, 15, 105
Data Quality Assurance 13Digital Number 38Disk Space
Related Error Messages 112DLA Filter 25DLAs 13, 21
Quality Assurance 13
EECF Spectrum 38Environmental Correction 21, 31–39
Elevation Considerations 38Evaluation and Refinement 38File Name .corenv 16In Tutorial 91–93Selecting Clouds, Haze, and Shadows 36
Environmental Corrections 3ERDAS IMAGINE
AOI Tools 117Arrange Layers 116Convolution Function 86Focal Analysis Function 86Geometric Correction 83Ground Control Point 83Histogram Tools 117Image Interpreter 86Layer Stack Utility 87Map Composer 85Open Raster Layer 116Preference Editor 115Raster Attribute Editor 83, 116Raster Options 116Recode Tool 86Rectification Tools 84Subpixel Classifier 1View Zoom 117Viewer 115Viewer tools 83
Error Messages 111
FFalse Detection AOI 52False Detections
Focal Analysis 86MOI Classification 22, 76Multiple Signatures 41
Family Number 63Assigning to Signature 64Manually Changing 64
Features 2File Names

122 Index
.aasap 16, 91
.aoi 16
.aps 55
.asd 16, 95
.atr 16
.ats 16, 95
.corenv 16, 91
.img 16
.msf 56
.sch 16, 20
.sdd 51, 53Input/Output File Names 23qa.img 16
GGeometric Correction 83, 85, 106
In Landsat TM 106Geometric Correction Tool
Geometric Referencing 84Georeferencing 84GIS Modeling 86, 108, 115Glossary 119
Area of Interest 119CAV Ratio 119Class Value 119Classification 119Confidence Level 119CORENV 119DLAs 119DN 119Environmental Correction 119Material Pixel Fraction 119Mean Material Pixel Fraction 119MOI 119MOI Classification 119Preprocessing 119Quality Assurance 120Signature 120Signature Derivation 120Signature Report 120Signature Tolerance 119Subpixel 120Subpixel Classification 120Subpixel Classifier 120Subpixel Signature 120Training Set 120Whole Pixel 120Whole Pixel Classification 120
HHaze, Selecting 37
IIKONOS 1, 5
LLandsat TM 1, 3, 5, 38Level of Importance 68, 70, 72
MMaterial Pixel Fraction 17, 21, 40, 41, 42,46, 82MOI 1MOI Classification 22
.img Output File 16In Tutorial 96–101
Multiple Signature Classifier 75Multi-Scene File 56, 57Multispectral Imagery 3Multispectral Processing 3–4
NNN 105NN Resampled Imagery 105
OOnline Help 17Opacity 84
PPixel DN 38Pixel Registration 3Pixel Size 5, 106Preprocessing 21, 29–31
In Tutorial 91Process Flow 20–23
QQuality Assurance 13, 21, 24–28
RRaster Attribute Editor 80, 84, 99, 116
Changing Colors 116Making Layers Transparent 116
SSCF Spectrum 38Sensors 1SEO
See Signature Evaluation Only 68SEP
See Signature Evaluation Parameter 53,120

Index 123
SEP Value 64Shadows, Selecting 38Signature Combiner 22, 23, 61–??, 61, ??–67Signature Derivation 21, 39–52
Evaluating and Refining 51In Tutorial 93–96Report 50
Signature Description Document 51, 53, 61,63Signature Evaluation Only 68
Inputs 68Operational Steps 69
Signature Evaluation Parameter 53Scene-to-Scene Evaluation 53SEP Data Files 55SEP Value 53, 120Signature Ranking 59
Signature Family 61Creating 62Family Number 63Signature Sets 62
Signature Refinement and Evaluation 71Inputs 72Level of Importance 68Operational Steps 73Target Area 68
SPOT 1, 89SRE
See Signature Refinement & Evaluation 71Starting a Session 19Subpixel Classification 4–5Subpixel Classifier 1
Applications 6, 10Benefits 1Features 2Functions 19Integration with ERDAS IMAGINE 13Modules 1Process Flow 20
TTarget Area 68, 71Training Set
Defining 42Size 43, 45, 52
Troubleshooting 111Tutorial 89–103
VValid Detection AOI 52View Zoom 117
WWhole Pixel
In Signature Derivation 17Selection Strategies 107Signatures 107

124 Index


