31
B1X1-0030-01ENZ0(00) July 2010 Windows Interstage Business Process Manager Analytics V11.1 Process Discovery (BPM-E) Web Flow Viewer User's Guide

B1X1-0030-01ENZ0(00)July 2010
Windows
Interstage Business Process Manager Analytics V11.1
Process Discovery (BPM-E)Web Flow Viewer User's Guide

About this ManualThis manual explains the web-based “flow viewer” component of the Business Process Management by Evidence, or BPM-E software.
This audience of this document includes consultants and business process analysts who work for organizations that are using the servicesof a Business Process Visualization provider.
Intended Audience
This manual is intended for use by the system administrator. It assumes that the reader has a working knowledge of the following:
- Operating system administration
- Database administration
This Manual Contains:
Chapter Title Description
1 Introduction Overview of this manual.
2 Execution environment How to prepare an environment for the BPM-E flow viewer.
3 Operation in detail How to operate the BPM-E flow viewer.
4 Definition of terms Description of definition of terms used in BPM-E flow viewer.
Typographical Conventions
The following conventions are used throughout this manual:
Example Meaning
command Text, which you are required to type at a command line, is identifiedby Courier font.
screen text Text, which is visible in the user interface, is bold.
Reference Reference material is in italics.
Parameter A command parameter is identified by Courier font.
Reference Materials
The following reference materials for Interstage BPM Analytics are also available:
- Release Notes
Contains an overview of Interstage BPM Analytics, and late-breaking information that could not make it into the manuals.
- Installation Guide
Explains how to install Interstage BPM Analytics.
- Dashboard / Output Guide
Explains how to use the Dashboard to display Analytical data.
- Administration Guide
Contains Administration tools and tips, Message references and Troubleshooting.
- Analytics Studio Guide
Explains how to use the Analytics Studio to configure the parameters to enable Interstage BPM Analytics features.
- Management Console Guide
Explains how to use Management Console and Management Commands to configure the core parameters, how to start/stop theInterstage BPM Analytics service and how to display the Interstage BPM Analytics status.
- i -

Abbreviations
The following references for BPM Analytics are also available:
Formal name Abbreviation
Microsoft(R) Windows Server(TM) 2003, Standard EditionMicrosoft(R) Windows Server(TM) 2003, Enterprise EditionMicrosoft(R) Windows Server(TM) 2003 R2, Standard EditionMicrosoft(R) Windows Server(TM) 2003 R2, Enterprise Edition
Windows Server
Microsoft(R) Windows Server(TM) 2003, Standard x64 EditionMicrosoft(R) Windows Server(TM) 2003, Enterprise x64 EditionMicrosoft(R) Windows Server(TM) 2003 R2, Standard x64 EditionMicrosoft(R) Windows Server(TM) 2003 R2, Enterprise x64 Edition
Windows Server 2003( x64),or Windows Server 2003
Microsoft(R) Windows Server(R) 2008 StandardMicrosoft(R) Windows Server(R) 2008,EnterpriseMicrosoft(R) Windows Server(R) 2008 R2 StandardMicrosoft(R) Windows Server(R) 2008 R2 Enterprise
Windows Server
Microsoft(R) Windows(R) XP Professional operating systemMicrosoft(R) Windows(R) XP Home Edition operating system
Windows XP, or Windows
Microsoft(R) Windows Vista(R) BusinessMicrosoft(R) Windows Vista(R) EnterpriseMicrosoft(R) Windows Vista(R) Ultimate
Windows Vista, or Windows
Microsoft(R) Windows(R) 7 Home PremiumMicrosoft(R) Windows(R) 7 ProfessionalMicrosoft(R) Windows(R) 7 Ultimate
Windows 7, or Windows
Microsoft(R) Internet Information ServerMicrosoft(R) Internet Information Services
IIS
Microsoft(R) Internet Explorer 6.0Microsoft(R) Internet Explorer 7.0Microsoft(R) Internet Explorer 8.0
Internet Explorer
Microsoft(R) Excel Excel
Solaris(TM) 10 operating system Solaris 10, or Solaris
Red Hat Enterprise Linux ASRed Hat Enterprise Linux ESRed Hat Enterprise Linux 5
Linux
Interstage Application Server Enterprise EditionInterstage Application Server Standard-J Edition
Interstage Application Server
Interstage Studio Enterprise EditionInterstage Studio Standard-J Edition
Interstage Studio, or Studio
Interstage Business Process Manager IBPM
Oracle Database 10g Enterprise Edition R10.1.0/R10.2.0Oracle Database 10g Standard Edition R10.1.0/R10.2.0Oracle Database 10g Standard Edition One R10.1.0/R10.2.0
Oracle10g, or Oracle
Oracle Database 11g Enterprise EditionOracle Database 11g Standard EditionOracle Database 11g Standard Edition OneOracle Database 11g R2 Enterprise EditionOracle Database 11g R2 Standard EditionOracle Database 11g R2 Standard Edition One
Oracle11g, or Oracle
- ii -

Formal name Abbreviation
Microsoft SQL Server 2005 Standard EditionMicrosoft SQL Server 2005 Enterprise Edition
SQL Server 2005, or SQL Server
Microsoft SQL Server 2008 Standard EditionMicrosoft SQL Server 2008 Enterprise Edition
SQL Server 2008, or SQL Server
Export regulations
Fujitsu documents may include special technology regulated by foreign exchange and foreign trade regulation laws. If special technologyis included, permission must be obtained under these laws before exporting a document or providing it to a non-resident.
Trademarks
- Microsoft, Windows, and Windows Server are trademarks or registered trademarks of Microsoft Corporation in the United States andother countries.
- Sun, Sun Microsystems, the Sun Logo, Solaris and all Solaris based marks and logos are trademarks or registered trademarks of SunMicrosystems, Inc. in the United States and other countries, and are used under license.
- Linux is a registered trademark or trademark of Linus Torvalds in the United States and other countries.
- Red Hat is a trademark or registered trademark of Red Hat Inc. in the United States and other countries.
- Java and all Java-related trademarks and logos are trademarks or registered trademarks of Sun Microsystems, Inc. in the United Statesand other countries.
- Oracle is a registered trademark of Oracle Corporation (USA).
- SQL Server is a Microsoft Corporation (USA) product.
- "DB2" is a registered trademark of IBM Corporation (USA).
- All other company and product names referred to in this document are general trademarks or registered trademarks of their respectiveowners.
Requests
- This document may be revised without notice.
- Do not pass on this document to other parties without permission.
- Fujitsu bears no responsibility for third-party infringements of patent or other rights arising out of use of the data contained in thisdocument.
Copyright
Copyright 2010 FUJITSU LIMITED
July 2010 First Edition
- iii -

ContentsChapter 1 Introduction..............................................................................................................................................................1
Chapter 2 Execution environment............................................................................................................................................22.1 Components of BPM-E flow viewer...................................................................................................................................................22.2 Tool operating environment.................................................................................................................................................................22.3 Installation...........................................................................................................................................................................................22.4 Starting up............................................................................................................................................................................................22.5 Shutting down......................................................................................................................................................................................22.6 Uninstallation.......................................................................................................................................................................................2
Chapter 3 Operation in detail....................................................................................................................................................33.1 Project selection panel.........................................................................................................................................................................33.2 Flow display screen.............................................................................................................................................................................3
3.2.1 Display and non-display switch of INITIAL_STATE and FINAL_STATE...............................................................................63.2.2 Searching a specified node name..................................................................................................................................................7
3.3 Control panel........................................................................................................................................................................................83.3.1 Slider...........................................................................................................................................................................................10
3.4 Flow instance display.........................................................................................................................................................................113.5 Flow type display...............................................................................................................................................................................14
3.5.1 Basic sorting...............................................................................................................................................................................163.5.2 Advanced sorting........................................................................................................................................................................17
3.6 Exceptional flow display...................................................................................................................................................................183.6.1 Basic sorting...............................................................................................................................................................................203.6.2 Advanced sorting........................................................................................................................................................................21
3.7 Parallel analysis display.....................................................................................................................................................................22
Chapter 4 Definition of terms..................................................................................................................................................254.1 Repetition frequency..........................................................................................................................................................................254.2 Process return frequency....................................................................................................................................................................254.3 Typical flow deviation degree...........................................................................................................................................................26
- iv -

Chapter 1 IntroductionBPM-E flow viewer is a web-based business process flow diagram viewer.
Generate data using the BPM-E Event Extraction process before using the BPM-E flow viewer. Event extraction is performed by a BPM-E service provider and requires one or more sets of comma separated variable (CSV) files which are extracted from your business systems.
Ask your Business Process Visualization provider for details about event extraction.
- 1 -

Chapter 2 Execution environmentThis chapter describes how to prepare an environment for the BPM-E flow viewer.
2.1 Components of BPM-E flow viewerBPM-E flow viewer consists of the following components:
- Server-side functions
- Server-side functions include a web server and database. These functions run on the same platform as the Event Extraction Tooland are explained in the "Event Extraction Tool Operation Guide".
- Client-side functions
- Functions provided by a browser are known as Client-side function. These functions are explained in this manual.
- Client-side functions cannot be used when the Server-side is shut down.
2.2 Tool operating environmentThe system requirements of BPM-E flow viewer are:
- OS: Microsoft® Windows XP or Windows Vista
- Recommended hardware
- CPU
- Intel® Core2 Duo 2GHz or faster
- Memory
- 2GB or more
- Broadband network
- Required software
- Web browser
- Microsoft Windows Internet Explorer 7 or 8
- Mozilla Firefox 3
- Adobe® Flash Player 9 or later
2.3 InstallationBPM-E flow viewer is a web-application. It doesn't need to be installed.
2.4 Starting upStart BPM-E Flow Viewer by opening a browser and specifying the URL that your service provider issued.
2.5 Shutting downTerminate BPM-E flow viewer by clicking the "x" button in the upper right corner of the browser window.
2.6 UninstallationThere is no need to uninstall BPM-E flow viewer.
- 2 -

Chapter 3 Operation in detailThis chapter describes how to operate the BPM-E flow viewer.
3.1 Project selection panelA project selection panel, similar to the one shown in Figure 3.1 Project selection panel, appears when the "Select a Project" button isclicked. The list of projects which are stored in the server is displayed in the upper part of the panel. Select one project from the list andclick the "Select" button.
Figure 3.1 Project selection panel
Elements on this screen are described below.
No. Name Purpose
1 Project name Shows the name of a project. The associated flow data’s period is oftenused as the project name.
2 Last Update Shows the last updated date and time of the project.
3 Distinguish of event repeat Shows the method used to distinguish repeating events. In this version"Distinct all" is the only method used.
4 Select button Completes the selection of the highlighted project.
5 x button Closes the project selection panel. When this panel is first opened first itcannot be closed without selecting a project.
3.2 Flow display screenThe Flow display screen is the most basic view of BPM-E flow viewer. It displays an integrated flow diagram which includes multipleflow instances.
The screen layout and the menus of flow display screen are explained below.
An example of the flow display screen is shown in Figure 3.2 Flow display screen. The upper part contains buttons and a menu-bar. Thecenter part is the main flows display area. The bottom part is an information area.
- 3 -

Figure 3.2 Flow display screen
Elements on this screen are described below.
No. Name Function
1 (Business flow diagram displayarea)
The business flow diagram is displayed in the center of the screen. Theview box of the business flow diagram can be moved by dragging thebusiness flow diagram display area with mouse's left button, when apart of the business flow diagram is displayed.
2 Model series name Shows the current target model series name.
3 Project name Shows the current target project name.
4 Percentage Shows the current slider percentage.
5 Flow update time Shows the time when the flow diagram was updated.
6 Select a Project button Shows the project selection panel.See 3.1 Project selection panel.
7 Show Controls Shows the control panel. See 3.3 Control panel.
8 File->Save Image menu Saves the current business flow diagram to a file. Three types of formatare available: SVG format, PNG format, and XPDL format.
- 4 -

No. Name Function
9 View -> Zoom In menu The same as clicking the "Zoom In" button in the control panel. See3.3 Control panel.
10 View -> Zoom Out menu The same as clicking the "Zoom Out" button in the control panel. See3.3 Control panel.
11 View -> Display All menu The same as clicking the "Display All" button in the control panel. See3.3 Control panel.
12 View -> Show flow endpointsmenu
INITIAL_STATE and FINAL_STATE are displayed as flow endpointsif this is checked. If the check is removed, INITIAL_STATE andFINAL_STATE are not displayed. Refer to 3.2.1 Display and non-display switch of INITIAL_STATE and FINAL_STATE for details.
13 View -> Flow Type Displaymenu
Detailed information of the business process flow and the transition ofeach flow type of the business process flow displayed in flow displayscreen by a present flow frequency (one have thought the processinstance of the same event flow to be one) is displayed.Refer to 3.5 Flow type display for details.
14 View -> Select Exception Flowmenu
Displays the screen to retrieve the exceptional flow.Refer to 3.6 Exceptional flow display for details.
15 View -> Display Count/Timemenu
Selects one or more options to be displayed in the business process flowdiagram. Available options are "Transition Count", "AverageTransition Time", and "Standard Deviation of Transition Time"."Emphasize Long Transition Time" option is also available to show thetransitions which have the longest transition time in red. The time unitcan be selected from day, hour, minute, and second.
16 View -> Config Setting menu Configure the flow viewer settings.
17 View -> New Window Opens a new window containing the same process flow model as wasin the original window.
18 View -> Node Name SearchPanel
Displays the Node Name Search Panel.See 3.2.2 Searching a specified node name.
19 Analysis->Detect Typical Flowmenu
The same as "Typical" button in the control panel.See 3.3 Control panel.
20 Analysis->Parallel Analysismenu
Shows the Parallel Analysis Display.See 3.7 Parallel analysis display.
21 Help menu Shows the version of BPM-E flow viewer.
- The notation used in the business flow diagram is as follows:
- An event (or activity) is expressed in a rounded box. The character string in the box is the event name.
Note
Only the administrator can rename an event. Contact the administrator to have events renamed.
- A transition is expressed by an arrow.
- The numerical values displayed at the arrow are the items selected by the View -> Display Count/Time menu.
- The numerical values displayed in each node are the number times the event occurred, the average execution time of the event andthe standard deviation of the event execution time. They correspond to the items selected by View -> Display Count/Time menu.
- 5 -

- The node named INITIAL_STATE, if displayed, is the starting point. It is automatically connected to each real business event. Thedisplay and non-display mode can be switched as described in section 3.2.1 Display and non-display switch of INITIAL_STATE andFINAL_STATE.
- Similarly, the node named FINAL_STATE, if displayed, is the finishing point. The end of each real business event is automaticallyconnected to this node. The display and non-display mode can be switched as described in section 3.2.1 Display and non-displayswitch of INITIAL_STATE and FINAL_STATE.
- The transition arrows are displayed in black and gray.
- Black: Transitions of the flow with the highest frequency.
- Gray: Other transitions.
3.2.1 Display and non-display switch of INITIAL_STATE and FINAL_STATETo easily recognize the beginning and the end of the business flow diagram in the flow display screen, virtual events namedINITIAL_STATE and FINAL_STATE are used. These correspond to the Initial node and Final node in a UML activity diagram.
Choose whether the INITIAL_STATE and FINAL_STATE are displayed by toggling the “Show flow endpoints” from the menu.
Figure 3.3 Flow endpoints not displayed shows an example of INITIAL_STATE and FINAL_STATE not displayed.
INITIAL_STATE and FINAL_STATE are displayed by default.
- 6 -

Figure 3.3 Flow endpoints not displayed
3.2.2 Searching a specified node nameSelect "Node Name Search Panel" in the "View" menu to open a searching panel. This panel can be used for searching for a specifiednode name in the current flow diagram.
- 7 -

Figure 3.4 Searching for a node containing "price" in its name
Elements on this screen are described below.
No. Name Function
1 Text box Input a target keyword for searching.
2 "Search" button Start the search.
3 "Event display name search" Select this option to search the “event display names” for the targetkeyword.Note: Each node has two names. One is its “event name” which is theoriginal name created from the business data. The other is its “eventdisplay name” which is a user entered name. In the flow diagram the“event display name” is used as a node name.
4 "Event name search" Select this option to search the “event names” for the target keyword.
5 "Close" button Close this panel.
3.3 Control panelClick the "Show Controls" button to display the Control panel. Use the Control panel to set parameters for the current flow.
- 8 -

Figure 3.5 Control Panel
Elements on this screen are described below.
No. Name Function
1 "Zoom In" button Zoom the business flow diagram in.The same as the View->Zoom In from the menu.
2 "Zoom Out" button Zoom the business flow diagram out.The same as the View->Zoom Out from the menu.
3 "Display All" button Scales the business flow diagram so it can all be shown in the displayarea.The same as the View->Display All from the menu.
4 Slider position Sets the frequency threshold for a flow to be displayed. Only flows thatmeet or exceed the value set by the slider are shown. Drag and releasethe slider to update the display.Refer to 3.3.1 Slider for details.
5 Slider percentage Shows the value associated with the current position of the slider.Specifying a new value is the same as moving the slider.
- 9 -

No. Name Function
6 "Typical" button
(Detect typical flow button)
Shows the most frequent flow. This is the flow which has the highestpercentage of events where the degree of inputs and outputs is no greaterthan three.Note: This ignores the transitions associated with “initial” and “final”states.
7 Number of unique flows Shows the number of types of flow represented in the current display.Specifying a value is the same as moving the slider.
8 Total number of flows Shows the number of flow instances represented in the current display.This value must be at least as large as the number of unique flows becauseone flow type will usually have more than a single flow instances. Thisvalue cannot be updated.
9 x button Close this panel.
3.3.1 SliderThe business flow diagram that corresponds with the flow frequency set by the slider is displayed. Drag and release the slider to updatethe business flow diagram. The slider position and slider percentage input field are synchronized.
The numerical value of the percentage selected by the slider is the ratio of the number of process instances displayed to the total numberof process instances.
Flow types are sorted in descending order of the number of process instances that they represent. Each flow type is assigned a numberwhich is the percentage of the total number of flow instances that are associated with flow types that have fewer instances.
Flows with assigned percentages that are not greater than the slider value are selected and displayed.
For example, suppose there are only two flow types: flow 1 and flow 2, and suppose flow 1 had 100 instances and flow 2 had 50 instances.
First sort on descending order of number of instances …
Flow type Instances
Flow 1 100
Flow 2 50
Now add the number of instances with higher counts and calculate the percentage.
Flow type Instances Total instances of types with higher counts … as a percentage
Flow 1 100 0 0%
Flow 2 50 100 67%
In this case flow 1 corresponds to 0% and flow 2 corresponds to 67%. When "75%" is selected by the slider, for example, flow 1 and flow2 are both displayed in the view.
- 10 -

Figure 3.6 Flow frequency
3.4 Flow instance displayRight click on a node or a transition arrow and select "Display flow instance" to show the “flow instance display”. This display shows alist of all flow types involved in the node or transition that was clicked. For example, clicking the node "Event-X" where “Event-X” wasinvolved in flows from three types, would result in three flow types being shown in the list.
Select a flow type in the upper list results to see its flow instances shown in the lower list. Select a flow instance in the lower list and click the“Display details” button to see details of that instance.
- 11 -
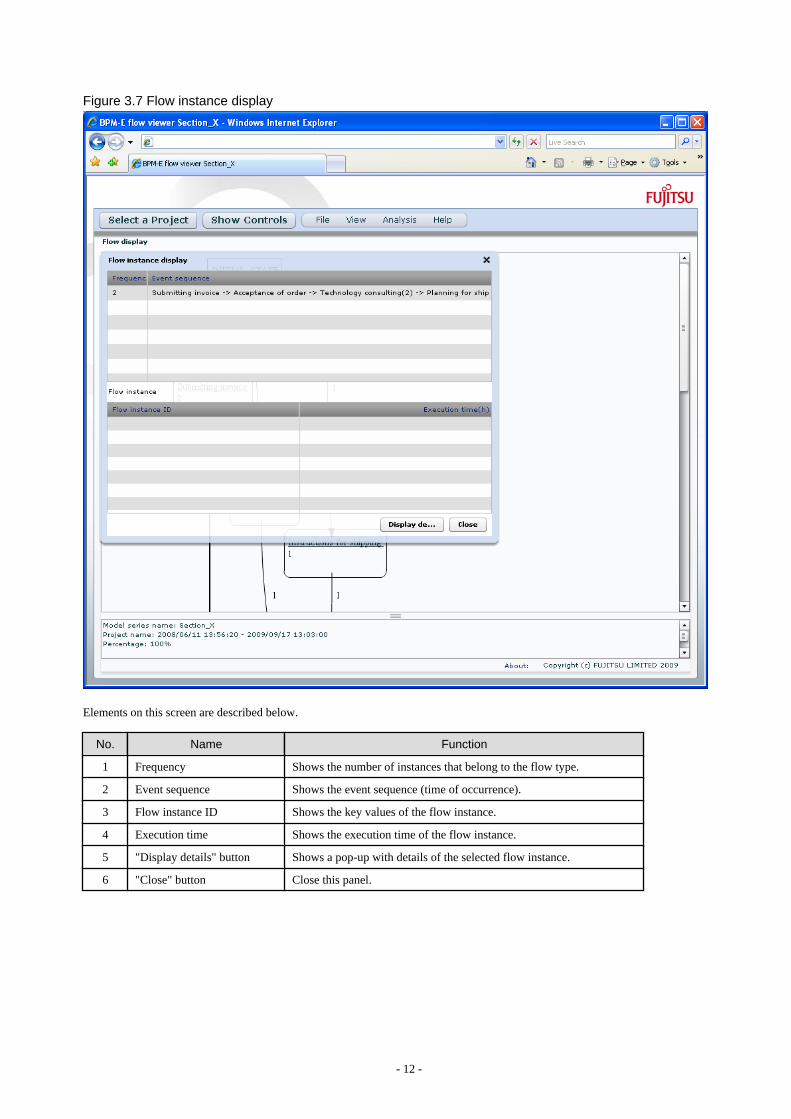
Figure 3.7 Flow instance display
Elements on this screen are described below.
No. Name Function
1 Frequency Shows the number of instances that belong to the flow type.
2 Event sequence Shows the event sequence (time of occurrence).
3 Flow instance ID Shows the key values of the flow instance.
4 Execution time Shows the execution time of the flow instance.
5 "Display details" button Shows a pop-up with details of the selected flow instance.
6 "Close" button Close this panel.
- 12 -

Figure 3.8 Flow instance details display
Elements on this screen are described below.
No. Name Function
1 Execution time Shows the execution time of the flow instance.
2 Flow instance ID Shows the key values of the flow instance.
3 Order Shows the sequence number of the event.
4 Event Shows the name of the event.
5 Occurrence time Shows the time when the event began.
6 End time Shows the time when the event finished.
7 Property name Shows the name of the property. Properties are information about theoriginal data associated with the corresponding event.
8 Property value Shows the value of the property.
9 "OK" button Close this panel.
- 13 -

3.5 Flow type displayDetailed information about each flow type is displayed in the upper part in flow type display mode.This is called a flow type list. Onlyflow types with a percentage not greater than the slider value are displayed. Set the slider frequency to 100% to show all flow types in theflow type list.
A flow type may have multiple flow instances in which the event sequence is the same. The number of the flow instances of each flowtype with the same event sequence is displayed in the "Frequency" column.
A flow diagram of the selected flow type is shown in the lower left of the display. When multiple flow types are selected their diagramsare all displayed.
Information about each transition of the selected flow types is displayed in lower right part of the display.
Figure 3.9 Flow type display
Elements on this screen are described below.
No. Name Function
1 (Flow type list) Display the list of flow types in the upper part. The list is arranged indescending order of "Frequency" by default. Click a list header torearrange the list in ascending order or descending order of clickedvalues.
- 14 -

No. Name Function
2 Sort button "Flow sorting" panel is opened for advanced sorting.Refer to 3.5.2 Advanced sorting for details.
3 Event sequence Shows the sequence of the events of the flow type.
4 Frequency Shows the total number of instances of each flow type.
5 Average time Shows the average execution time of each flow.The initial unit of time is hour (h).
6 Maximum time Shows the maximum execution time of each flow.The initial unit of time is hour (h).
7 Minimum time Shows the minimum execution time of each flow type.The initial unit of time is hour (h).
8 Repetition frequency Shows the number of repetition of the events of each flow type.Refer to 4.1 Repetition frequency for details.
9 Process return frequency Shows the process return frequency of each flow type.Refer to 4.2 Process return frequency for details.
10 Sort score The sort score is indicated in this field if Advanced sorting was used.Refer to 3.5.2 Advanced sorting for details.
11 (Business process flowdiagram display)
Display the business process flow diagrams of all selected flow types inthe lower left area. Multiple flow types can be selected.
12 (Transition details) Show “Transition details” of each transition of each selected flow typein the lower right. Each row shows the type of the transition, the numberof instances of the transition, average value, the maximum value, andthe minimum value of the execution time of the transition in"Transition", "Frequency", "Average time", "Maximum time", and"Minimum time" columns respectively. Click a list header to rearrangethe list in ascending order or descending order of clicked values.
13 No. Shows the line number of the Event/ Transition.
14 Transition Shows the type of the transition.
15 Frequency Shows the total number of the transitions in the flow type.
16 Average time Shows the average execution time of each flow type.
17 Maximum time Shows the maximum execution time of each flow type.
18 Minimum time Shows the minimum execution time of each flow type.
19 Select a Project button Show the project selection panel.See 3.1 Project selection panel for detail.
20 Show Controls Show the control panel. See 3.3 Control panel for detail.
21 File->Save Image menu Output the current business flow diagram to a file in SVG format, PNGformat or XPDL format.
22 View -> Zoom In menu The same as clicking the "Zoom In" button in the control panel. See 3.3Control panel for detail.
23 View -> Zoom Out menu The same as clicking the "Zoom Out" button in the control panel. See3.3 Control panel for detail.
24 View -> Display All menu The same as clicking the "Display All" button in the control panel. See3.3 Control panel for detail.
25 View -> Show flow endpointsmenu
INITIAL_STATE and FINAL_STATE are displayed as flow endpointsif this is checked. If the check is removed, INITIAL_STATE andFINAL_STATE are not displayed. Refer to 3.2.1 Display and non-display switch of INITIAL_STATE and FINAL_STATE for details.
- 15 -

No. Name Function
26 View -> Flow View Displaymenu
The screen to view the integrated flow diagram is displayed. Refer to3.2 Flow display screen for details.
27 View -> Select ExceptionFlow menu
The screen to retrieve the exceptional flow is displayed.Refer to 3.6 Exceptional flow display for details.
28 View -> Display Count/Timemenu
Select display options for the business process flow diagram from"Transition Count", "Average Transition Time", and "StandardDeviation of Transition Time". Use the "Emphasize Long TransitionTime" option to show the transitions which have the longest transitiontime in red. Select the “time unit” from day, hour, minute, second.
29 View -> Sequential Numbermenu
Check this setting to display the flow in a format where the sequentialnumber (in parentheses) is attached to each transition. In this case,neither the frequency nor the time is displayed.
Uncheck this setting to enable the non-display/ display to be controlledfrom the "Count" and "Time" menu as well as from the "Flow display"screen (The "Transition Count" and the "Average Transition Time" aredisplayed in the state of an initial display).
The "Sequential Number" is unchecked automatically when two or morelines are selected in the "Flow type list".
30 View -> Config Setting menu Configure settings for the flow viewer.
31 Help menu Show the version of BPM-E flow viewer.
3.5.1 Basic sortingClick a header of the flow type list to sort the list by the value in that column. Ascending order and descending order are switched witheach click. The list can be sorted using these values.
- Event sequence
- The sequence of the event
- Frequency
- The total number of process instances for each flow type
- Average time
- The average execution time of each flow type
- Maximum time
- The maximum execution time of each flow type
- Minimum time
- The minimum execution time of each flow type
- Repetition frequency
- See 4.1 Repetition frequency.
- Process return frequency
- See 4.2 Process return frequency.
- Sort score
- The result of advanced sorting is stored in this field. See 3.5.2 Advanced sorting.
- 16 -

3.5.2 Advanced sortingClick the "Sort" button to display the flow sorting panel as shown below. Check either the "Select flows containing the transition below",or "Descending order of flows that don't meet a condition" radio button.
Figure 3.10 Flow sorting panel
Elements on this screen are described below.
No. Name Function
1 Select flows containing thetransition below (Sort inappearance frequencydescending order) radiobutton
When this radio button is selected, the number of the transition which youspecified is counted for each flow type. Then the flow type list is sortedby the number. To specify the transition, select the transition source andtransition destination.
2 Transition source, Transitiondestination list box
Transition source and transition destination list box are used as a pair tospecify the transition.
3 Descending order of flowsthat don't meet a condition
When this radio button is selected, you have to specify following two typesof event as sorting condition.
- Target event
- Target event precondition
- One or more events which should occur before the target event.
Each flow type is determined whether the type satisfies the condition ornot. If the type satisfies the condition, the score of the type becomes 0. Ifthe type doesn't satisfy the condition, the score becomes 1.
Note that if the flow type doesn't contain the target event, the score of thetype becomes 0.
4 Target event list box Select a target event.
- 17 -

No. Name Function
5 Target event precondition Specify one or more events that should occur before the targeted event.Multiple events mean that all the events should occur before executing thetarget event.
6 Apply button The sorting gets executed and the result is reflected to "Sort score" fieldof the flow type list.
7 x button Close this panel.
3.6 Exceptional flow displayUse the exceptional flow display mode to search the exceptional flow type list ordered by a specified condition and see the exceptionalflow highlighted in the flow diagram. Use this feature to analyze each flow type which exhibits some exceptional behavior, for example,one that has many repetitions.
Use the View->Select Exception Flow menu to display the exceptional flow screen (Figure 3.11 Exceptional flow screen). This screenshows a list of exceptional flows in its upper part. Select a flow from the list to have its flow overlaid on the flow view with red dashedlines. The numbers in parentheses shows the execution order. The events which are included in the selected flow are displayed even if theoverlaid flow does not contain the events. The flow shown with red dashed lines is displayed in the center of the screen.
The exceptional flow list is sorted in descending order of "Frequency" value by default. There are two ways to reorder the list: basic sortingand advanced sorting.
In basic sorting, headers of the list are used for sorting. Click a header to reorder the list based on the value of the clicked column. Fordetails, refer to 3.6.1 Basic sorting.
Click the "Sort" button for advanced sorting. This displays the "Flow sorting" panel and complex sorting conditions can be constructed.For details, refer to 3.6.2 Advanced sorting.
- 18 -

Figure 3.11 Exceptional flow screen
Elements on this screen are described below.
No. Name Function
1 Number of unique exceptionflows
The number of unique exception flows. This number is equal to thenumber of lines in the exceptional flow list.
2 Display target Shows the current slider setting.
3 Sort button Display the "Flow sorting" panel for advanced sorting.Refer to 3.6.2 Advanced sorting for details.
4 (Exceptional flow list) The list of exceptional flow types is displayed in the upper part. These"exceptional" flow types are not shown in the diagram in the flow viewdisplay at the specified percentage. The list is arranged in descendingorder of "Frequency" by default. Click each header of the list to rearrangethe list in ascending order or descending order of the clicked column’svalues.
5 Exception event sequence Event classes are displayed in order of the time series, joined by "->".The numerical value in parentheses to the right of event class shows thenumber of occurrence of the same kind of event.
- 19 -

No. Name Function
6 Frequency Number of flow instances.
7 Typical flow deviation degree The distance between the most frequent flow type and each flow type isdisplayed.Refer to 4.3 Typical flow deviation degree for details.
8 Repetition frequency The number of repetitions of the events of each flow type is displayed.Refer to 4.1 Repetition frequency for details.
9 Process return frequency The process return frequency of each flow type is displayed. Refer to 4.2Process return frequency for details.
10 Sort score Shows the sort score if Advanced sorting was used.Refer to 3.6.2 Advanced sorting for details.
11 (Exceptional flow diagramdisplay)
The flow diagram of selected exceptional flow type is displayed. In thisdiagram, the selected exceptional flow is indicated by red-dashed linesand the normal flow diagram at the specified percentage is indicated byblack lines.
12 Select a Project button Shows a project selection panel. See 3.1 Project selection panel.
13 Show Controls button Shows a control panel. See 3.3 Control panel.
14 File->Save Image menu Output the current business flow diagram to a file in SVG format or PNGformat.
15 View -> Zoom In menu The same as clicking the "Zoom In" button in the control panel. See 3.3Control panel.
16 View -> Zoom Out menu The same as clicking the "Zoom Out" button in the control panel. See 3.3Control panel.
17 View -> Display All menu The same as clicking the "Display All" button in the control panel. See3.3 Control panel.
18 View -> Show flow endpointsmenu
INITIAL_STATE and FINAL_STATE are displayed as flow endpointsif this is checked. If the check is removed, INITIAL_STATE andFINAL_STATE are not displayed. Refer to 3.2.1 Display and non-displayswitch of INITIAL_STATE and FINAL_STATE for details.
19 View -> Flow View Displaymenu
Display the screen to view the integrated flow diagramRefer to 3.2 Flow display screen for details.
20 View -> Flow Type Displaymenu
Display detailed information of the business process flows that areselected based on the current settings.Refer to 3.5 Flow type display for details.
21 View -> Display Count/Timemenu
In this mode, only "Transition Count" item is selectable.
22 View -> Config Setting menu Configure settings of the flow viewer.
23 Help menu Shows the version of BPM-E flow viewer.
3.6.1 Basic sortingClick a header of the exceptional flow list to sort the list by the values in the clicked column. Ascending order and descending order areswitched with each click. The list can be sorted using these values.
- Exception event sequence
- The sequence of the event
- Frequency
- The total number of the process instances of each exceptional flow type
- 20 -

- Typical flow deviation degree
- Distance between the target flow and the frequent flow
- Repetition frequency
- See 4.1 Repetition frequency.
- Process return frequency
- See 4.2 Process return frequency.
- Sort score
- The result of advanced sorting is stored in this field. See 3.6.2 Advanced sorting.
3.6.2 Advanced sortingClick the "Sort" button to display the flow sorting panel. Check either the "Select flows containing the transition below", or "Descendingorder of flows that don't meet a condition" radio button.
Figure 3.12 Flow sorting panel
Elements on this screen are described below.
No. Name Function
1 Select flows containing thetransition below (Sort inappearance frequencydescending order) radiobutton
When this radio button is selected, the number of the transition whichyou specified is counted for each exceptional flow type. Then the flowtype list is sorted by the number. To specify the transition, select thetransition source and transition destination.
2 Transition source, Transitiondestination list box
Specify the transition source and destination.
3 Descending order of flowsthat don't meet a condition
When this radio button is selected, you have to specify following twotypes of event as sorting condition.
- 21 -

No. Name Function
- Target event
- Target event precondition
- One or more events which should occur before the target event.
Each exceptional flow type is determined whether the type satisfies thecondition or not. If the type satisfies the condition, the score of the typebecomes 0. If the type doesn't satisfy the condition, the score becomes1.
Note that if the flow type doesn't contain the target event, the score ofthe type becomes 0.
4 Target event list box Select a target event.
5 Target event precondition Specify one or more events that should occur before the targeted event.Multiple events mean that all the events should occur before executingthe target event.
6 Apply button Perform the sort and reflect the result in the "Sort score" field of theexceptional flow type list.
7 x button Close this panel without sorting flows.
3.7 Parallel analysis displayIn parallel analysis mode, all kind of parallel execution types (hereinafter referred to as the "parallel type") are shown in the list. Note thatit is different from the flow type list. A parallel type is a group of several flow instances that have same sequence of the event beginningtime and the event completion time. By Gantt chart, you can recognize what events are executed in parallel. If the particular parallel patterncauses some problems, you can find it by this view.
- 22 -

Figure 3.13 Parallel analysis display
Elements on this screen are described below.
No. Name Function
1 Frequency The number of instances of the parallel type.
2 Average time The average execution time of the parallel type.
3 Gantt chart The Gantt chart of the parallel type. In this chart, the length of each bardoesn't reflect the actual execution time of each event. The chart should beused to recognize the parallel execution pattern.
4 Select a Project button Shows the project selection panel. See 3.1 Project selection panel.
5 View -> Flow ViewDisplay menu
Display the screen to view the integrated flow diagramRefer to 3.2 Flow display screen for details.
6 View -> Flow TypeDisplay menu
Display detailed information of the business process flows that are selectedbased on the current settings.Refer to 3.5 Flow type display for details.
7 View -> Select ExceptionFlow menu
Display the screen to retrieve the exceptional flow.Refer to 3.6 Exceptional flow display for details.
- 23 -

No. Name Function
8 View -> Time Unit menu Select the time unit from day, hour, minute, second.
9 Help menu Show the version of BPM-E flow viewer.
- 24 -

Chapter 4 Definition of termsThis chapter describes definition of terms used in BPM-E flow viewer.
4.1 Repetition frequencyRepetition frequency is the total number of times that an event is repeated in a process flow.
Consider this example where the execution of events is A->B->B->C->D->D->D. The numbers in parentheses show the execution orderof events. Event B is execute twice (one additional time) and event D is executed three time (two additional times). There is one extra Bin the flow B->B, and there are the two extra Ds in the flow D->D->D… so the repetition frequency value is three.
Figure 4.1 Repetition frequency
4.2 Process return frequencyProcess return frequency is the total number of times that an event backtracks to an event is the same flow that has already been executed.
Consider this example where the execution of events is A->B->C->D->B->C->D->E->D->E. The numbers in parentheses show theexecution order of events. Transitions (4) and (8) are backtracks … so the process return frequency value is two. Note that transitions (5),(6), and (9) occurred because of the backtracking and are not counted as process returns.
Figure 4.2 Figure 15 - Process return frequency
- 25 -

4.3 Typical flow deviation degreeTypical flow deviation degree is the distance between the reference flow (the most frequent flow) and a target flow. The distance betweenthe flows is the minimum number of insertion/ deletion/ substitution operations required to transform the target flow into the referenceflow.
An example of typical flow deviation degree is shown below.
Figure 4.3 Typical flow deviation degree
- 26 -


![80 100 125 150 170 [BPM] STYLES & TEMPO IN ELECTRONIC … · 2019. 3. 6. · Dubstep [130-145 BPM] Trap [120-160 BPM] [140 BPM] Hardstyle [150 BPM] Breakbeat [140-170 BPM] Jungle](https://static.documents.pub/doc/80x56/6018bad90f937c130a7c6c52/80-100-125-150-170-bpm-styles-tempo-in-electronic-2019-3-6-dubstep.jpg)


