377
User's Guide
User's Guide
Using ZWCAD (Edition:2012)
Contents User's Guide............................................................................. 1
1. Introduction and Installation ......................................... 1
1.1. ZWCAD Introduction ................................................................................................. 1
1.1.1. About ZWCAD and other CAD software .......................................................... 1
1.1.2. Comparing ZWCAD drawing with manual drafting.......................................... 2
1.1.3. Working with other data and programs .............................................................. 8
1.1.4. Using advanced CAD features ........................................................................... 9
1.1.5. Getting more information ................................................................................... 9
1.2. Installation................................................................................................................... 9
1.2.1. System requirements ........................................................................................... 9
1.2.2. Installing ZWCAD............................................................................................ 10
2. The User Interface ........................................................ 11
2.1. MENUS and Shortcut Menus ................................................................................... 11
2.1.1. MENUS ............................................................................................................ 11
2.1.2. Shortcut Menus ................................................................................................. 11
2.2. Toolbars ..................................................................................................................... 12
2.3. The Command Window ............................................................................................ 13
2.3.1. Enter Commands or System variables .............................................................. 13
2.3.2. Edit Within the Command Window ................................................................. 15
2.3.3. Switch between Dialog Boxes and the Command line .................................... 16
2.4. Dynamic input ........................................................................................................... 17
2.5. Customize the Drawing Environment ...................................................................... 17
2.5.1. Set Interface Options ........................................................................................ 17
2.5.2. Save and Restore Profiles ................................................................................. 20
2.6. Tool Palettes .............................................................................................................. 20
3. Create and Save a Drawing .......................................... 22
3.1. Create a new drawing ............................................................................................... 22
3.1.1. Start a Drawing from Scratch ........................................................................... 22
3.1.2. Use a Setup Wizard ........................................................................................... 22
3.1.3. Use a Template File to Start a Drawing ............................................................ 23
3.2. Open an Existing Drawing........................................................................................ 24
3.2.1. Find and open a Drawing File .......................................................................... 24
3.2.2. Work with Multiple Open Drawings ................................................................ 26
3.2.3. Recover a Damaged File ................................................................................... 26
3.3. Save a Drawing ......................................................................................................... 27
3.4. Error Report .............................................................................................................. 29
4. Control the Drawing Views .......................................... 31
4.1. Redrawing and regenerating a drawing .................................................................... 31
4.2. Magnify a View (Zoom) ........................................................................................... 31
4.3. Pan a View ................................................................................................................ 35
4.4. Use Aerial View window to pan and zoom drawings .............................................. 37
4.5. Display Multiple Views in Model Space .................................................................. 37
4.5.1. Set Model Space Viewports .............................................................................. 38
4.5.2. Working with multiple drawings ...................................................................... 40
4.6. Save and Restore Views ............................................................................................ 41
4.7. Specify a 3D View .................................................................................................... 42
4.7.1. View a Parallel Projection in 3D ...................................................................... 42
4.7.2. Setting the viewing direction ............................................................................ 42
4.7.3. Isometric ........................................................................................................... 43
4.7.4. Define a 3D View with Coordinate Values or Angles ...................................... 44
4.7.5. Change a 3D View Dynamically ...................................................................... 45
4.7.6. Hide Lines or Shade 3D Objects ...................................................................... 45
4.7.7. Creating rendered images ................................................................................. 46
4.7.8. Creating custom rendered images .................................................................... 47
4.7.9. Printing a rendered image ................................................................................. 48
5. Precision Tools and the Properties of drawing ........... 50
5.1. Specify Units, Angles and Scale ............................................................................... 50
5.2. Drawing Limits ......................................................................................................... 53
5.3. Grid and Grid Snap ................................................................................................... 53
5.4. Use Object Snaps ...................................................................................................... 56
5.5. Use Polar Tracking and Object Snap Tracking ........................................................ 58
5.6. Use Orthogonal Locking (Ortho Mode) ................................................................... 60
5.7. Work with Linetypes ................................................................................................. 61
5.7.1. Load and use Linetypes .................................................................................... 61
5.7.2. Change the Linetype of an Object .................................................................... 61
5.7.3. Control Linetype Scale ..................................................................................... 62
5.8. Work with Layers ...................................................................................................... 63
5.8.1. Overview of Layers .......................................................................................... 64
5.8.2. Create and Name Layers ................................................................................... 64
5.8.3. Change Layer Settings and Layer Properties ................................................... 65
5.8.4. Filter and Sort the List of Layers ...................................................................... 69
5.8.5. Save and Restore Layer Settings ...................................................................... 70
5.9. Work with Colors ...................................................................................................... 71
5.9.1. Using index colors ............................................................................................ 71
5.9.2. Using true colors ............................................................................................... 72
5.9.3. Using color books ............................................................................................. 72
5.10. Control Lineweights ................................................................................................. 73
5.10.1. Overview of Lineweights ................................................................................. 73

5.10.2. Display Lineweights ......................................................................................... 73
5.10.3. Change the Lineweight of an Object ................................................................ 74
5.11. Control the Display of Overlapped Objects ............................................................. 75
5.12. Extract or Calculate Geometric Information from Objects ...................................... 77
5.12.1. Calculating areas ............................................................................................... 77
5.12.2. Calculating distances and angles ...................................................................... 79
5.12.3. Displaying information about your drawing .................................................... 80
5.13. Specify Intervals on Objects ..................................................................................... 81
6. Coordinates And Coordinate System .......................... 85
6.1. Coordinates ............................................................................................................... 85
6.1.1. Enter 2D Coordinates ....................................................................................... 85
6.1.2. Using three-dimensional coordinates ............................................................... 88
6.1.3. Use Coordinate Filters ...................................................................................... 89
6.2. Control the User Coordinate System ........................................................................ 91
6.2.1. Coordinate System ............................................................................................ 91
6.2.2. Control the User Coordinate System in 3D ...................................................... 92
6.2.3. Defining and naming user coordinate systems ................................................. 93
6.2.4. Setting the current user coordinate system ....................................................... 94
6.2.5. Use UCS Presets ............................................................................................... 94
6.2.6. Control the User Coordinate System ................................................................ 94
7. Create Objects ............................................................. 100
7.1. Draw Linear Objects ............................................................................................... 100
7.1.1. Lines ................................................................................................................ 100
7.1.2. Rays................................................................................................................. 101
7.1.3. Construction Lines .......................................................................................... 101
7.1.4. Multiple-Line Objects ..................................................................................... 102
7.1.5. Polylines .......................................................................................................... 103
7.1.6. Create Polylines from the Boundaries of Objects .......................................... 105
7.1.7. Polygons .......................................................................................................... 107
7.1.8. Rectangles ....................................................................................................... 108
7.1.9. Points............................................................................................................... 108
7.1.10. Traces .............................................................................................................. 109
7.1.11. Freehand Sketches .......................................................................................... 109
7.2. Draw Curved Objects ............................................................................................. 111
7.2.1. Arcs ................................................................................................................. 111
7.2.2. Circles ............................................................................................................. 114
7.2.3. Ellipses and Ellipse arcs ................................................................................. 116
7.2.4. Splines ............................................................................................................. 117
7.2.5. Dounts ............................................................................................................. 119
7.3. Create 3D Objects ................................................................................................... 121
7.3.1. Set 3D thickness and elevation ....................................................................... 122
7.3.2. Create Wireframe Models ............................................................................... 123
7.3.3. Create Surfaces ............................................................................................... 124
7.3.4. Create 3D Solids ............................................................................................. 131
7.4. Create Regions ........................................................................................................ 141
7.5. Create Revision Clouds .......................................................................................... 143
7.6. Create Break Lines.................................................................................................. 143
7.7. Create Wipeouts ...................................................................................................... 144
8. Modify Objects ............................................................ 146
8.1. Select Objects ......................................................................................................... 146
8.1.1. Select Objects Individually ............................................................................. 146
8.1.2. Select Multiple Objects .................................................................................. 148
8.1.3. Quick selection ............................................................................................... 150
8.1.4. Group Objects ................................................................................................. 151
8.2. Modify Objects ....................................................................................................... 152
8.2.1. Remove Objects .............................................................................................. 152
8.2.2. Copy Objects................................................................................................... 153
8.2.3. Mirror Objects................................................................................................. 154
8.2.4. Offset an Object .............................................................................................. 156
8.2.5. Create an Array of Objects ............................................................................. 157
8.2.6. Move Objects .................................................................................................. 160
8.2.7. Rotate Objects ................................................................................................. 162
8.2.8. Align Objects .................................................................................................. 164
8.2.9. Scale Objects................................................................................................... 164
8.2.10. Lengthen Objects ............................................................................................ 166
8.2.11. Stretch Objects ................................................................................................ 166
8.2.12. Trim or Extend Objects................................................................................... 168
8.2.13. Wrap Processing ............................................................................................. 173
8.2.14. Create Breaks .................................................................................................. 174
8.2.15. Create Chamfers ............................................................................................. 175
8.2.16. Create Fillets ................................................................................................... 178
8.3. Modify Compound Objects .................................................................................... 181
8.3.1. Disassociate Compound Objects .................................................................... 181
8.3.2. Modify Polylines ............................................................................................ 182
8.3.3. Modify Multilines ........................................................................................... 186
8.4. Use Grips to Edit Objects ....................................................................................... 187
8.4.1. Control Status and Displaying of Grips ......................................................... 188
8.4.2. Grip Edit Mode ............................................................................................... 189
8.4.3. Multi-Grips Edit Mode ................................................................................... 192
8.5. Modifying the properties of entities ....................................................................... 195
8.6. Modify 3D Solids.................................................................................................... 196
8.6.1. Fillet and Chamfer .......................................................................................... 196
8.6.2. Section and Slice............................................................................................. 198
8.6.3. Modify Faces of 3D Solids ............................................................................. 199
8.6.4. Modify Edges of 3D Solids ............................................................................ 204
8.6.5. Imprint, Separate, Shell, Check and Clean 3D Solids .................................... 205
8.7. Use Windows Cut, Copy, and Paste ....................................................................... 207
8.8. Correct Mistakes ..................................................................................................... 208
9. Notes and Labels ......................................................... 210
9.1. Create Text .............................................................................................................. 210
9.1.1. Single-Line Text ............................................................................................. 210
9.1.2. Multiline Text.................................................................................................. 211
9.1.3. Leaders ............................................................................................................ 215
9.1.4. Multileader ...................................................................................................... 216
9.2. Change Text ............................................................................................................ 218
9.3. Work with Text Styles ............................................................................................. 219
9.4. Checking the spelling of text .................................................................................. 224
10. Dimensions and Tolerances ........................................ 227
10.1. Overview of Dimensioning..................................................................................... 227
10.2. Use Dimension Styles ............................................................................................. 228
10.2.1. Overview of Dimension Styles ....................................................................... 228
10.2.2. Control Dimension Elements.......................................................................... 230
10.2.3. Control Dimension Text ................................................................................. 232
10.2.4. Control Dimension Values .............................................................................. 236
10.2.5. Set the Scale for Dimensions .......................................................................... 240
10.3. Create Dimensions .................................................................................................. 240
10.3.1. Create Linear Dimensions .............................................................................. 241
10.3.2. Create Angular Dimensions ............................................................................ 245
10.3.3. Create Radial Dimensions .............................................................................. 247
10.3.4. Create Diameter Dimensions .......................................................................... 248
10.3.5. Create Ordinate Dimensions ........................................................................... 249
10.3.6. Create Quick Dimension ................................................................................ 250
10.3.7. Create Arc Length Dimension ........................................................................ 250
10.4. Modify Existing Dimensions .................................................................................. 251
10.4.1. Modify Dimension Style ................................................................................ 251
10.4.2. Making dimensions oblique............................................................................ 252
10.4.3. Modify Dimension Text .................................................................................. 252
10.4.4. Dimension Jogged .......................................................................................... 254
10.4.5. Dimension Inspection ..................................................................................... 255
10.4.6. Adjust Dimension Space ................................................................................ 256
10.4.7. Dimension Break ............................................................................................ 257
10.5. Add Geometric Tolerances ..................................................................................... 258
10.6. Table ........................................................................................................................ 262
11. Blocks, Attribute and Xrefs ........................................ 267
11.1. Create and Insert Blocks ......................................................................................... 267
11.1.1. Create Blocks .................................................................................................. 267
11.1.2. Create Drawing Files for Use as Blocks ........................................................ 268
11.1.3. Insert Blocks ................................................................................................... 269
11.1.4. Control the Color and Linetype Properties in Blocks .................................... 270
11.1.5. Modify a Block Definition ............................................................................. 271
11.2. Define and Use Block Attributes ............................................................................ 272
11.3. Reference Other Drawing Files (Xrefs) ................................................................. 274
11.3.1. Attach External References ............................................................................ 275
11.3.2. Nest and Overlay External References ........................................................... 277
11.3.3. Update Attached External References ............................................................ 278
11.3.4. Edit External References ................................................................................ 279
11.3.5. Edit External References in Place .................................................................. 284
12. Hatches and Realistic Images .................................... 287
12.1. Hatches .................................................................................................................... 287
12.1.1. Overview of Hatch Patterns and Fills ............................................................. 287
12.1.2. Define Hatch Boundaries................................................................................ 288
12.1.3. Choose And Define Hatch Patterns ................................................................ 292
12.1.4. SOLID ............................................................................................................. 294
12.2. Work with Raster Images ........................................................................................ 295
12.2.1. Attach, Scale, and Detach Raster Images ....................................................... 295
12.2.2. Modify and manage Raster Images ................................................................ 297
13. Layout , Plot and Publish Drawings .......................... 304
13.1. Create Multiple-View Drawing Layouts ................................................................ 304
13.1.1. Overview of Layout ........................................................................................ 304
13.1.2. Viewing drawings in paper space and model space ....................................... 307
13.1.3. Specify Layout Settings .................................................................................. 308
13.1.4. Create and Modify Layout Viewports ............................................................ 312
13.1.5. Create Nonrectangular Layout Viewports ...................................................... 318
13.2. Plot Drawings ......................................................................................................... 319
13.2.1. Overview of Plotting....................................................................................... 320
13.2.2. Plot settings ..................................................................................................... 321
13.2.3. Use Plot Styles ................................................................................................ 325
13.2.4. Plot Files to Other Formats ............................................................................. 331
13.2.5. Batch plot ........................................................................................................ 333
13.3. Publish Drawings .................................................................................................... 333
14. Share Data Between Drawings and Applications ..... 335
14.1. Saving and viewing snapshots ................................................................................ 335
14.2. Link and Embed Data ............................................................................................. 335
14.2.1. Overview of Object Linking and Embedding ................................................ 336
14.2.2. Import OLE Objects ....................................................................................... 337
14.2.3. Export OLE Objects from Drawings .............................................................. 340
14.2.4. Work with Proxy Objects................................................................................ 345
14.3. Package a Set of Files for Internet Transmission ................................................... 346
15. Compile and Work with Customize applications ..... 350
15.1. LISP ........................................................................................................................ 350
15.2. VBA ........................................................................................................................ 352
15.3. SDS ......................................................................................................................... 354
15.4. DCL ......................................................................................................................... 354
16. Glossary ....................................................................... 355

INTRODUCTION AND INSTALLATION
1
1. Introduction and Installation
1.1. ZWCAD Introduction
1.1.1. About ZWCAD and other CAD software
ZWCAD is designed for anyone who wants a fast and efficient CAD program with all the
power and versatility of standard programs such as AutoCAD® by Autodesk®, Inc., or
MicroStation® by Bentley Systems, Inc., at an affordable price. Using today‘s advanced
technology, ZWCAD integrates the Microsoft® Windows® interface with a powerful CAD
engine.
ZWCAD provides unparalleled compatibility with AutoCAD, using most of the same file
formats including those for drawings (.dwg files), commands, linetypes, hatch patterns,
and text styles. You can also use AutoCAD menu files and run Autodesk® AutoLISP®
programs.
ZWCAD is more compatible with the AutoCAD program than any other CAD product,
delivers additional tools with advanced CAD features, and has a seamless Microsoft®
Windows integration. This powerful program provides a superb combination of features for
CAD users like architects, engineers, and designers.
ZWCAD incorporates standard features found in other CAD programs, along with features
and capabilities you won‘t find anywhere else. Its multiple document interface (MDI) lets
you open and work with several drawings at the same time. You can easily copy drawing
entities between drawings.
Using AutoCAD legacy drawings
ZWCAD fully supports AutoCAD legacy drawings. ZWCAD reads and writes DWG files in
their native format without any loss of data, from AutoCAD 2009 back to Version 11,
including AutoCAD LT®. Because ZWCAD uses DWG as its native file format, no
translation is required.
ZWCAD supports three-dimensional wireframes and surfaces. Three dimensional
drawings can be displayed in wireframe, hidden line view, and surface shading.
ZWCAD supports displaying and working with raster images in your drawings. When a
drawing containing proxy entities is loaded into ZWCAD, a message displays indicating
that some entities will not display.
It‘s easy to customize ZWCAD. You can modify menus and toolbars, create custom
menus, dialog boxes, command aliases, and scripts, and add custom programs written in
any of several programming languages, including LISP and SDS™ (Solutions
Development System™, the program‘s Autodesk® ADScompatible language). There is
also Microsoft® Visual Basic for Applications (VBA).
You can run existing LISP applications in ZWCAD with little or no modification. ZWCAD
uses the Appload command so you can easily load LISP programs.
ZWCAD reads files that contain dialog control language (DCL) statements as well, which
CHAPTER 1
2
makes ZWCAD compatible with dialog boxes created for AutoCAD.
Using AutoCAD commands with ZWCAD
Because ZWCAD supports hundreds of AutoCAD commands, you use the commands
you already know. For example, to draw a circle, use the Circle command. To copy a
circle, use the Copy command.
When you press Enter or the spacebar, you activate the command—just like in AutoCAD.
ZWCAD accepts the special characters used by AutoCAD, such as point filters (for
example, .xy), relative coordinates (the @ symbol), and the apostrophe (the ‗ prefix) for
transparent commands. ZWCAD function keys are also similar to those used in
AutoCAD.Because you do not need to learn a new set of commands, you are immediately
productive with ZWCAD.
1.1.2. Comparing ZWCAD drawing with manual drafting
ZWCAD greatly reduces the time and effort it takes to create and revise drawings. Not
only can you produce accurate drawings faster, you can also reuse the information in your
drawings.
These are the primary reasons for making the transition to CAD from traditional, manual
drafting on paper.
As with any tool, however, to use it effectively, you need to be familiar with some of the
special features, functions, and concepts of CAD. If you are familiar with manual drafting,
you‘ll find some conceptual similarities in CAD as well as some differences.
Drawing to scale
In traditional, manual drafting, you usually determine the scale of the drawing before you
even start to draw, because you are working with a sheet of paper of a fixed size. You
may have to reduce or enlarge the entity you are drawing to fit within the confines of the
paper.
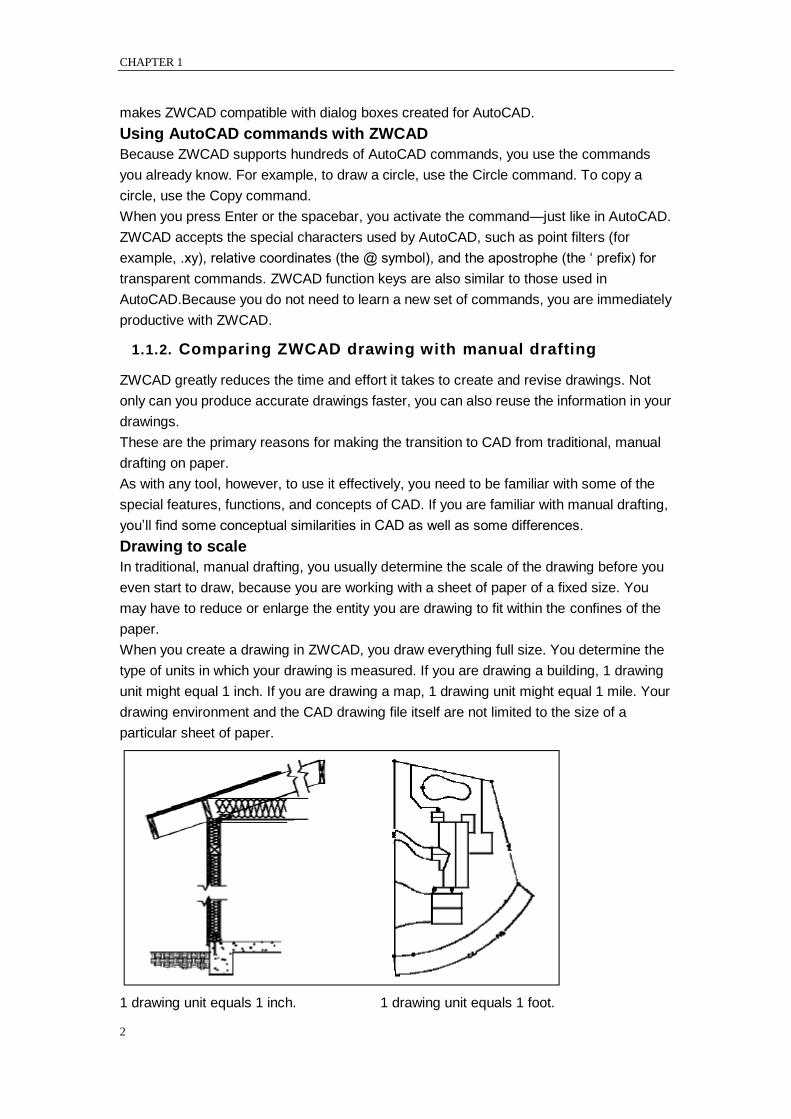
When you create a drawing in ZWCAD, you draw everything full size. You determine the
type of units in which your drawing is measured. If you are drawing a building, 1 drawing
unit might equal 1 inch. If you are drawing a map, 1 drawing unit might equal 1 mile. Your
drawing environment and the CAD drawing file itself are not limited to the size of a
particular sheet of paper.
1 drawing unit equals 1 inch. 1 drawing unit equals 1 foot.
INTRODUCTION AND INSTALLATION
3
As you draw, you can use commands such as Pan and Zoom to work on different part of
the drawing and to magnify the display of the drawing to view small details. These
commands have no effect on the actual size of the entities in your drawing; they affect
only the way the drawing is displayed on your screen. Only when you print or plot your
drawing do you need to set the scale so that the printed drawing fits within a specific paper
size.
Using tools
In manual drafting, you use tools such as pencils, rulers, T squares, templates, erasers,
and so on. When you create a drawing in ZWCAD, you use a mouse instead of a pencil,
and you use the mouse to select other tools-commands you select from a menu or a
toolbar.
You use some tools to create basic entities, such as lines, circles, and arcs, and other
tools to modify existing entities ( for example, to copy or move them or to change
properties such as color and linetype).
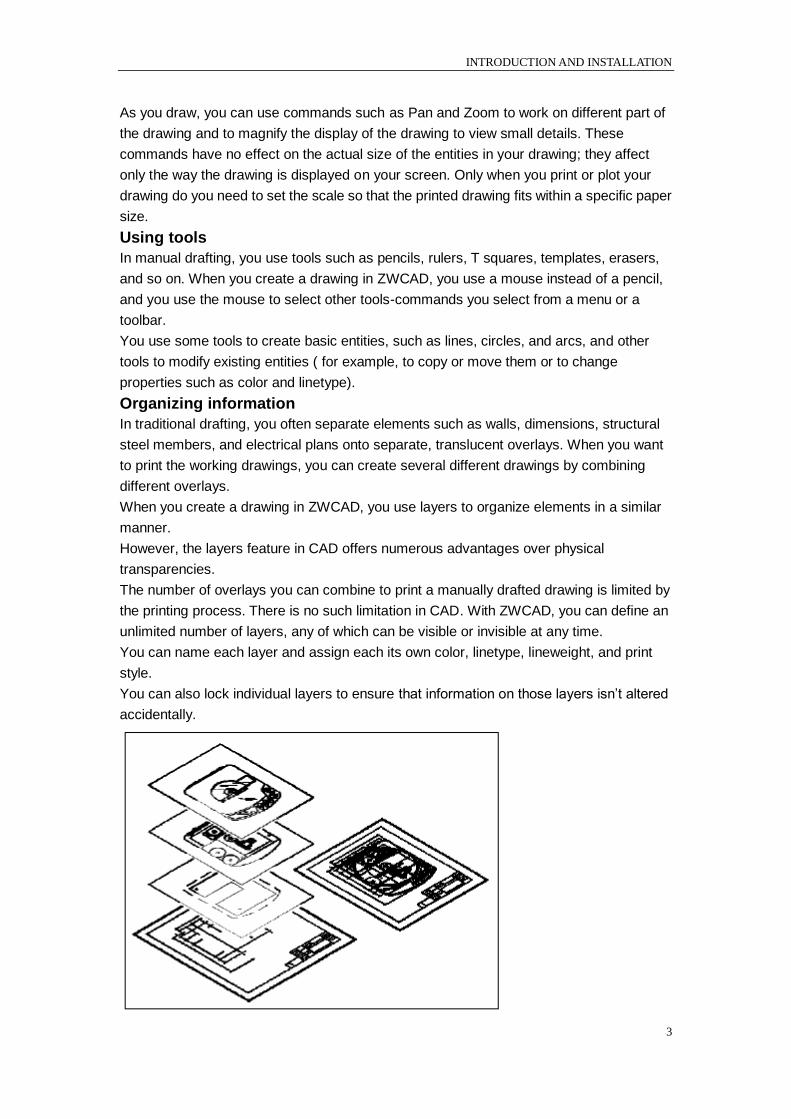
Organizing information
In traditional drafting, you often separate elements such as walls, dimensions, structural
steel members, and electrical plans onto separate, translucent overlays. When you want
to print the working drawings, you can create several different drawings by combining
different overlays.
When you create a drawing in ZWCAD, you use layers to organize elements in a similar
manner.
However, the layers feature in CAD offers numerous advantages over physical
transparencies.
The number of overlays you can combine to print a manually drafted drawing is limited by
the printing process. There is no such limitation in CAD. With ZWCAD, you can define an
unlimited number of layers, any of which can be visible or invisible at any time.
You can name each layer and assign each its own color, linetype, lineweight, and print
style.
You can also lock individual layers to ensure that information on those layers isn‘t altered
accidentally.
CHAPTER 1
4
Use layers to organize drawing information.
Drawing accurately
When you create a manual drawing, ensuring accuracy typically requires a lot of manual
calculations and rechecking. By contrast, ZWCAD offers a number of drawing aids that
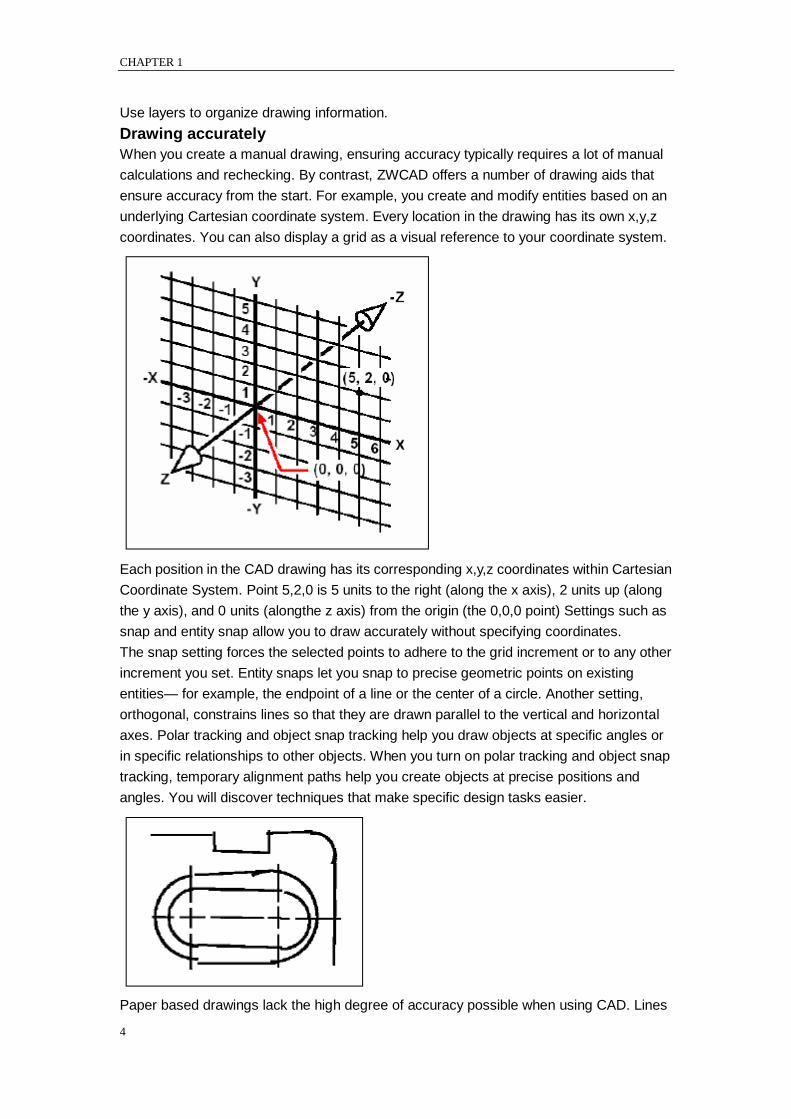
ensure accuracy from the start. For example, you create and modify entities based on an
underlying Cartesian coordinate system. Every location in the drawing has its own x,y,z
coordinates. You can also display a grid as a visual reference to your coordinate system.
Each position in the CAD drawing has its corresponding x,y,z coordinates within Cartesian
Coordinate System. Point 5,2,0 is 5 units to the right (along the x axis), 2 units up (along
the y axis), and 0 units (alongthe z axis) from the origin (the 0,0,0 point) Settings such as
snap and entity snap allow you to draw accurately without specifying coordinates.
The snap setting forces the selected points to adhere to the grid increment or to any other
increment you set. Entity snaps let you snap to precise geometric points on existing
entities— for example, the endpoint of a line or the center of a circle. Another setting,
orthogonal, constrains lines so that they are drawn parallel to the vertical and horizontal
axes. Polar tracking and object snap tracking help you draw objects at specific angles or
in specific relationships to other objects. When you turn on polar tracking and object snap
tracking, temporary alignment paths help you create objects at precise positions and
angles. You will discover techniques that make specific design tasks easier.
Paper based drawings lack the high degree of accuracy possible when using CAD. Lines
INTRODUCTION AND INSTALLATION
5
often overlap or fail to meet adjacent lines.
Snap and entity snap force the cursor to adhere to a specified increment or attach to key
geometric points on existing entities. You can also constrain lines to vertical and
horizontal axes.
Drawing efficiently
In paper based, manual drafting, you often have to redraw the same entity several times
at different scales or from different vantage points. You may also need to redraw the
border and title block on each new sheet.
One of the most powerful features of ZWCAD is that when you create a drawing, you can
reuse individual entities, borders, and title blocks as often as you want. You need draw an
entity only once; the final printed drawing can show the entity at several different scales
and viewpoints.
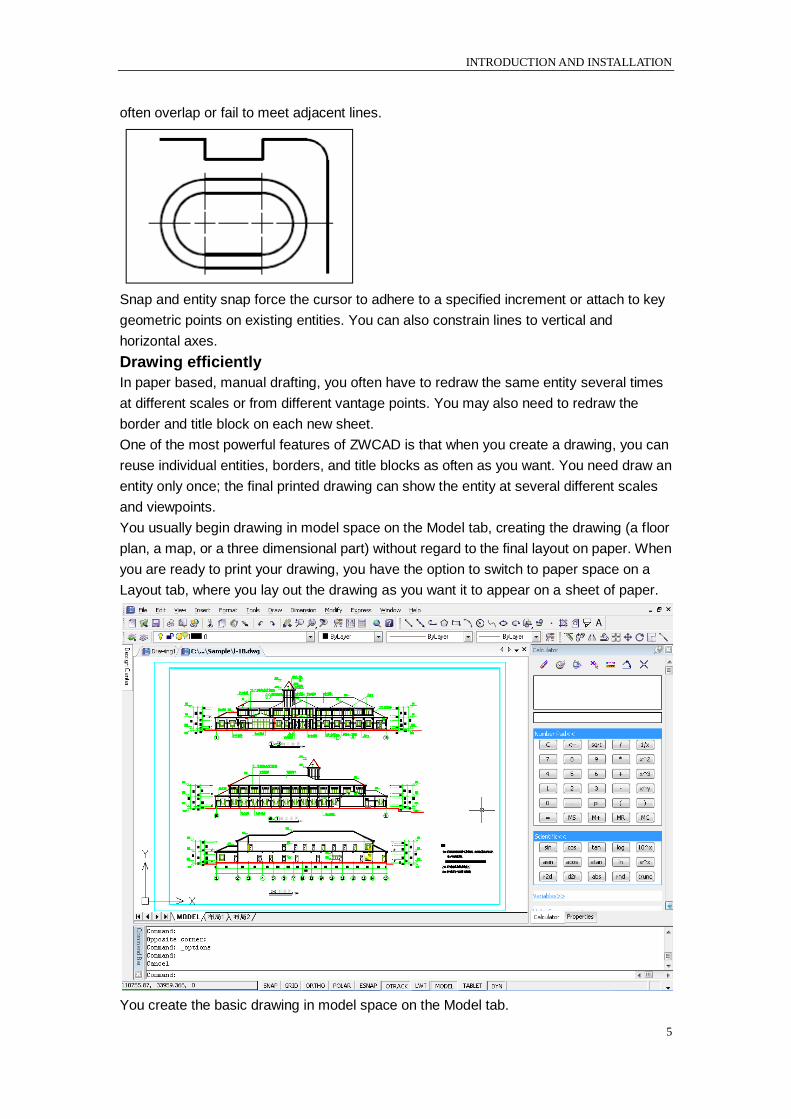
You usually begin drawing in model space on the Model tab, creating the drawing (a floor
plan, a map, or a three dimensional part) without regard to the final layout on paper. When
you are ready to print your drawing, you have the option to switch to paper space on a
Layout tab, where you lay out the drawing as you want it to appear on a sheet of paper.
You create the basic drawing in model space on the Model tab.
CHAPTER 1
6
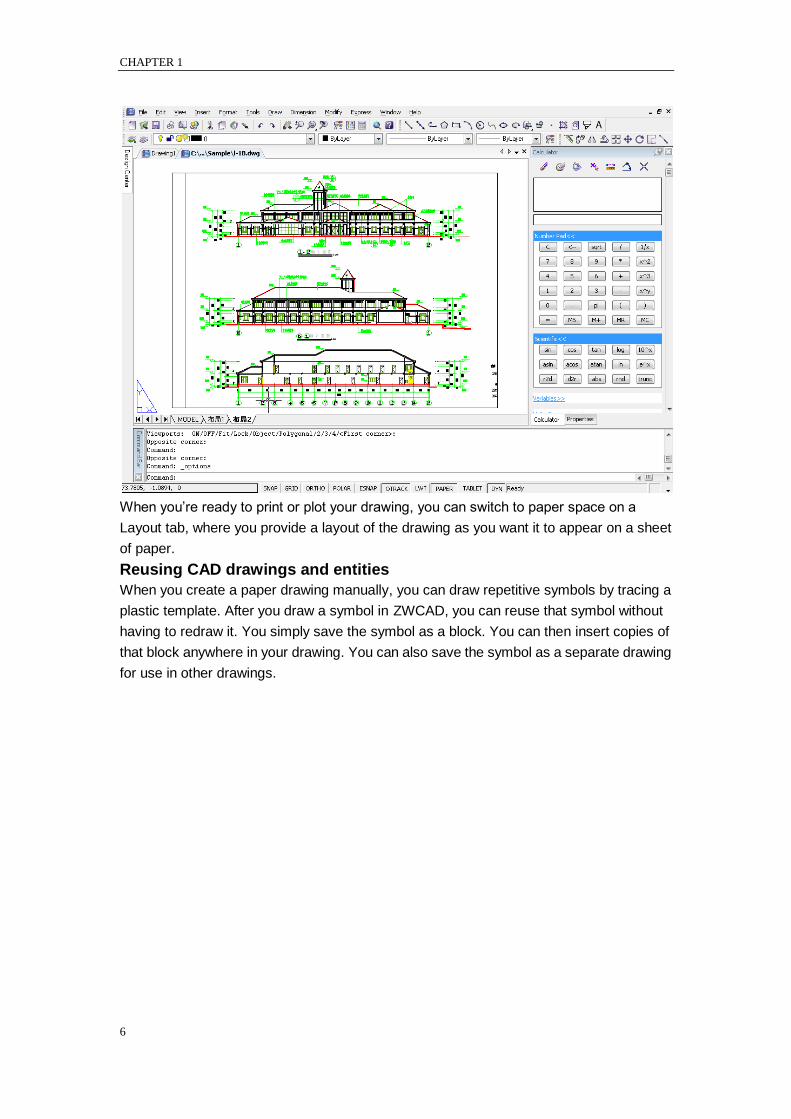
When you‘re ready to print or plot your drawing, you can switch to paper space on a
Layout tab, where you provide a layout of the drawing as you want it to appear on a sheet
of paper.
Reusing CAD drawings and entities
When you create a paper drawing manually, you can draw repetitive symbols by tracing a
plastic template. After you draw a symbol in ZWCAD, you can reuse that symbol without
having to redraw it. You simply save the symbol as a block. You can then insert copies of
that block anywhere in your drawing. You can also save the symbol as a separate drawing
for use in other drawings.

INTRODUCTION AND INSTALLATION
7
You can draw a symbol one time, save it as a block, and then insert multiple copies of that
symbol anywhere in your drawing.
In addition, you can reuse entire drawings and insert individual drawings into other
drawings.
You can also use an external reference, which acts as a pointer to another drawing rather
than a copy of the entire drawing. Using an external reference has an added advantage:
when you update the externally referenced drawing, each drawing that references it can
be automatically updated.
Making changes
To make changes to a paper drawing, you erase and then redraw. With ZWCAD, you use
commands to modify entities in the drawing. You can move, rotate, stretch, or change the
scale of entities. When you want to remove an entity, you can delete it with a single click
of the mouse. If you make a mistake while creating or modifying your drawing, you can
easily reverse your actions.
CHAPTER 1
8
You can easily change an entity using commands such as move, rotate, stretch, and scale
instead of redrawing the entity.
1.1.3. Working with other data and programs
Traditional paper drawings serve only as a means of communicating information between
the person who created the drawing and the person viewing the drawing. The drawings
contain no more information than what is visually imparted by the creator and seen by the
viewer.
ZWCAD offers rich possibilities for analyzing drawings and attaching additional data to
them.
For instance, although it may be impractical to count entities in a complex paper drawing,
this task is simple in CAD. ZWCAD can calculate the number of entities in a drawing and
compute area and distance.
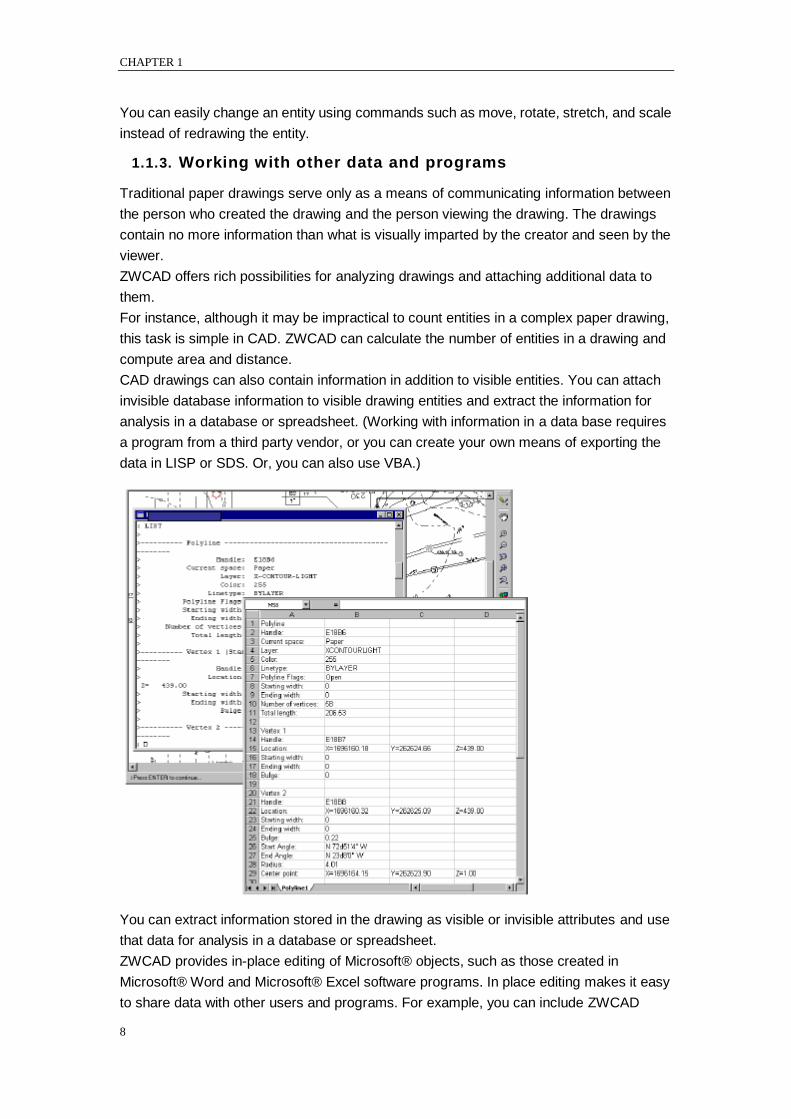
CAD drawings can also contain information in addition to visible entities. You can attach
invisible database information to visible drawing entities and extract the information for
analysis in a database or spreadsheet. (Working with information in a data base requires
a program from a third party vendor, or you can create your own means of exporting the
data in LISP or SDS. Or, you can also use VBA.)
You can extract information stored in the drawing as visible or invisible attributes and use
that data for analysis in a database or spreadsheet.
ZWCAD provides in-place editing of Microsoft® objects, such as those created in
Microsoft® Word and Microsoft® Excel software programs. In place editing makes it easy
to share data with other users and programs. For example, you can include ZWCAD
INTRODUCTION AND INSTALLATION
9
drawings in files created using Microsoft® Word, and you can insert files created using
Microsoft® Word into your ZWCAD drawings.
1.1.4. Using advanced CAD features
In addition to being compatible with AutoCAD, ZWCAD goes several steps further by
providing you with innovative features to increase your productivity.
Editing multiple documents simultaneously
With ZWCAD, you can open and edit multiple drawings simultaneously. You can also
copy and paste elements among opened drawings.
Editing multiple entities
ZWCAD allows you to change most of the properties of all selected entities using a single,
tabbed dialog box.
Using the Customize dialog box
ZWCAD has a single, tabbed dialog box for changing toolbars, menus, keyboard
shortcuts, and command aliases. The simple, point and click action lets you easily create
new menu items and keyboard shortcuts—no programming or manual text editing
required.
Performing unlimited undo and redo
ZWCAD increases your power undo and redo of editing actions.
1.1.5. Getting more information
In addition to the ZWCAD documentation, much of the assistance you need as you use
ZWCAD is specific to the commands you work with on the screen. To obtain immediate
information as you work, use these additional sources of information:
Status bar
To find out more detailed information about a tool when you pause the cursor over it, look
on the status bar at the bottom of the screen.
Online help
ZWCAD online help is available on the screen when you press F1, choose a command
from the Help menu, or click the question mark in a dialog box.
1.2. Installation
This section helps you get started using ZWCAD software by explaining how to install it
and providing basic information about how to use it.
NOTE This guide assumes that you have used other Windows based programs and are
familiar with Windows terminology and techniques.
1.2.1. System requirements
You need the following software and hardware to install and run ZWCAD:
Operating system
Microsoft Windows 2003;Microsoft Windows XP
Microsoft Windows Vista;Microsoft Windows 7
Processor
Pentium III 800 Mhz or advanced
CHAPTER 1
10
RAM
512 MB (recommended)
Video
1024 x 768 VGA with True Color (minimum)
Hard disk
700 MB
Pointing device
Mouse, trackball or other device
DVD-ROM
Any speed (for installation only)
1.2.2. Installing ZWCAD
A setup program guides you through the ZWCAD installation process. The program
transfers files to a folder that it creates on your hard disk. The program also creates a
menu item on the Start menu.
To install ZWCAD from a compact disc
1. Insert the ZWCAD compact disc into your CD ROM drive.
2. Double click the installation file of your desired software on the CD page.
3. Follow the instructions of the installation prompts, choose from Standard Edition and
Professional Edition to determine which one to install.
NOTE If you did not receive an ZWCAD compact disc, for example, if you downloaded the
program from the Internet, follow the instructions that came with the program.
THE USER INTERFACE
11
2. The User Interface
You can work with the ZWCAD window and its elements in a variety of ways. For example,
you can display and rearrange the toolbars, display the command bar, and enable the
status bar.
The toolbars and command bar can also be floated anywhere on the screen or docked to
the edges of the main ZWCAD window. You can customize the menu bar at the top of the
window.
You can customize the toolbars, changing the appearance and arrangement of tools and
adding your own commands and macros.
Your drawings are displayed in the drawing window.
The user coordinate system (UCS) icon indicates the orientation of the drawing in two
dimensional space (default setting).
Click a tab to switch between the drawing of your model and a printed layout.
You can type commands in the command bar. To reposition the command bar, drag it to
another location on your screen.
You can move and dock the toolbars to any location on your screen.
Specialty editor. You can modify the value you wanted in each column.
The status bar displays information such as the current cursor coordinates, and mode
settings.
2.1. MENUS and Shortcut Menus
2.1.1. MENUS
You can use any of the option on the Menus from the menu bar at the top of the ZWCAD
drawing area. Choose one of the following methods to use a menu:
On the menu bar, click a menu name to display a list of options. To select a menu
option, either click the option you want or use the DOWN ARROW to move down the
list, and then press ENTER.
Press ALT and press the key for the underlined letter in the menu name; then, press
the underlined letter in the option name. For example, to open a new drawing, press
ALT and press F to open the File menu; then, press N for New.
You can create a new menu with the path you specified (for example, a customized menu)
in the Options dialog box, Files tab.
2.1.2. Shortcut Menus
Shortcut menus provide quick access to specific commands. A shortcut menu displays
when you right click an object, toolbar, status bar, the Model tab name, or a Layout tab
name. The selections presented in the shortcut menu depend on what you clicked.
When you right click a toolbar, the program displays a shortcut menu that lets you toggle
the command bar, status bar, and various toolbars on and off. If you select one or more
CHAPTER 2
12
objects and then right click, the program displays a shortcut menu from which you can
choose a command to modify the selected objects.
To quickly access the relevant commands currently performed, you can right click on
different area on the drawing window to display different shortcut menu, with the shortcut
menu you can speed up the access.
If you have entered commands or system variables, right click on the command line to
perform the command or system variable automatically, without displaying the shortcut
menu.
To display a short cut menu from which you can choose an object snap and track, press
and hold down the Shift key, and then right click anywhere within the drawing window.
You can use +CUSTOMIZE command to customize the menus from the Customize dialog
box.
Recent Input
―Recent Input‖ option is used for recording the recent manipulations, from the Recent
Input list on right click menu, you can view the latest manipulations as well as the previous
command options, and also manipulate commands by directly selecting from the recent
input list. System variable INPUTHISTORYMODE is used for controlling its content, value
from 0 to 15. If INPUTHISTORYMODE is set to 0, you cannot see the Recent Input option
on right click menu, thus you can't view the latest input; if you set the
INPUTHISTORYMODE to a value within 0-15, latest input records are displayed orderly.
System variable CMDINPUTHISTORYMAX is used for controlling how many items to be
displayed in the Recent Input menu option. You can set the value from 0 to 20, generally
use the maximum as 20. Any value that is smaller than the maximum determines the
number of items to be displayed on the right click menu.
The contents displayed in the Recent Input menu option differs under various
circumstances. For example, right click on the screen if there is no manipulation currently
used, the latest commands ever manipulated will be displayed by the latest precedence
orders. When right click in the process of a certain command, Recent Input displays items
specific to the current manipulation such as coordinates, angle, length or relevant
keyword. In case that current manipulation is not relative to any of the recent input, Recent
Input option will not displayed on right click menu.
2.2. Toolbars
Toolbars partially contain buttons that start commands. When you move your mouse or
pointing device over a toolbar button, the tooltip displays the name of the button. Buttons
with a small black triangle in the lower-right corner are flyout icons of related commands.
Hold down the left button on your mouse over the small black triangle icon until the flyout
toolbar is displayed.
The Standard toolbar at the top of the drawing area is similar to those found in Microsoft®
Office programs. Which contains commonly used ZWCAD commands such as COPY、
PAN and ZOOM, as well as Microsoft Office standard commands such as New, Open,
and Save.
ZWCAD initially displays several toolbars by default:
THE USER INTERFACE
13
Standard toolbar
Styles toolbar
Layers toolbar
Properties toolbar
Draw toolbar
Modify toolbar
You can display or hide these toolbars and additional ones. Use +CUSTOMIZE command,
you can also create your own toolbars.
You can move the floating command window anywhere on the screen and resize its width
and height with the pointing device.Dock the command window by dragging it until it is
over the top or bottom docking region of the ZWCAD window, but you can‘t change its
size.
Displaying and hiding toolbars
When you start ZWCAD the first time, multiple toolbars are displayed. ZWCAD provides
more than a dozen toolbars, which you can customize by adding and deleting tools. You
can also move and resize toolbars, and you can create new toolbars. You can use a
shortcut menu to display or hide toolbars.
You can also choose whether toolbars are displayed large or small and in color. You can
choose to display or hide ToolTips, which provide descriptions of tools that display when
you pause the cursor over them. Go to View > Toolbars to make these selections.
Toolbars are either docked or floating. A floating toolbar has a title bar and a Close box,
can be located anywhere on the screen, and can be resized. A docked toolbar does not
display a title or Close box, cannot be resized, and is attached along one of the edges of
the drawing window.
To choose which toolbars to display
1 Choose View > Toolbars.
2 In the Select Toolbars dialog box, choose the toolbars you want displayed, and then
click OK.
TIP Right click anywhere on a docked toolbar to display the toolbar shortcut menu, and
then choose Toolbars.
Starting commands using toolbars
To start a command from a toolbar, click a tool and respond to the prompts.
NOTE The available toolbars depend on the experience level that is set. To change the
current experience level, choose Tools > Options, and then click the Open and Save tab.
2.3. The Command Window
The command bar is a dockable window in which you type ZWCAD commands and view
prompts and other program messages. To display the command bar, choose
View >Display>Command Bar. You can move the command bar by dragging it.
When the command bar is floating, you can drag the top or bottom of the window to
change the number of lines of text it displays. You can dock the command bar at the top or
bottom of the drawing.
2.3.1. Enter Commands or System variables
CHAPTER 2
14
Type a command or system variable by using the keyboard. System variables are such
parameters that are available for controlling how certain commands work.
Enter Commands on the Command Line
Type the full command name on the command line and press ENTER or SPACEBAR, or
right-click your pointing device to start the command.
Some commands also have abbreviated names. Abbreviated command names are called
command aliases. To define your own command aliases, you can customize from Aliases
tab on the Customize dialog through performing CUSTOMIZE command.
Specify Command Options
Once you have entered commands on the command line, ZWCAD displays either a set of
options or a dialog box. To choose a different option, enter the one of the options in the
brackets, either uppercase or lowercase letters is OK.
Execute Commands
To execute commands, press SPACEBAR or ENTER, or right-click your pointing device
when the command names has been entered or responseded to prompts.
Repeat and Cancel Commands
If you want to repeat a command that you have just used, press ENTER or SPACEBAR.
To cancel a command in progress, press ESC.
To repeat the command you just used
Do one of the following:
Press the spacebar.
Press Enter.
Click the right mouse button in the drawing.
Nesting a command
If you are working in the command bar, you can use another command from within a
command, called nesting. To use a command inside an active command, type an
apostrophe before you type the command, such as ‘circle, ‘line, or ‘pyramid. You can nest
commands indefinitely in ZWCAD. Many menu and toolbar macros work this way by
default; for example, select color, reference grid, zoom, and snap. When you have
finished with the nested command, the original command resumes.
For example, you turn on the object snap while you are drawing a circle, thus you can
setup Object snap mode before continuing drawing.
Command: circle
2Point/3Point/Ttr(tan tan radius)/Arc/Multiple/<Center of circle>: 'osnap
( Setup object snap mode as Center in Draft Settings dialog, and then close the dialog to
go on performing CIRCLE command )
2Point/3Point/Ttr(tan tan radius)/Arc/Multiple/<Center of circle>:
Enter System Variables on the Command Line
System variables are available for controlling how certain commands work. For example,
GRIDMODE is used to control the status ON or OFF for ―SNAP‖,‖GRID‖or‖ORTHO‖mode,
Sometimes you use a system variable in order to change a setting. System variable can
be used to display the current status as well.
THE USER INTERFACE
15
While using another command; you can examine or change a system variable's setting
transparently, however, new values may not take effect until the interrupted command
ends.
2.3.2. Edit Within the Command Window
Navigate and Edit Within the Command Window
The standard keys below are provided for navigating and editting text in the command
window to correct or repeat commands.
UP, DOWN, LEFT ARROW and RIGHT ARROW
INS, DEL
PAGE UP, PAGE DOWN
HOME, END
BACKSPACE
Use UP ARROW, DOWN ARROW and ENTER, you can repeat any command used in the
current session by cycling through the commands in the command window.
By default, pressing CTRL+C copies highlighted text to the Clipboard. Pressing CTRL+V
pastes text from the Clipboard to the text window or the command window.
If you right-click on the command window or text window, ZWCAD displays a shortcut
menu from which you can copy selected text or the entire command history, paste text,
and access the Options dialog box of the Command window.
In general, a command line with two or three lines of previous prompts is given to several
commands, called the command history, which is sufficient for viewing and editing. To see
more than one line of command history, you can scroll through the history or resize the
command window by dragging its border upwards, or you can press F2 to use the text
window.
The text window is a window similar to the command window in which you can enter
commands and view prompts and messages. With a complete command history for the
current ZWCAD session displayed, the text window can be used to view lengthy output of
commands such as LIST, which displays detailed information about objects you select.
To copy all the text in the text window to the Clipboard, use the COPYHIST command.
Dock and Resize the Command Window
By default, the command window is docked. The docked command window is the same
width as the ZWCAD window.
You can resize the window vertically by dragging the splitter bar, which is located on the
top edge of the window when it is docked on the bottom and at the bottom edge of the
window when it is docked at the top.
Undock the command window by dragging it away from the docking region. When you
undock the window, the floating window is the size it was before you undocked it. You can
move the floating command window anywhere on the screen and resize its width and
height with the pointing device.
Dock the command window by dragging it until it is over the top or bottom docking region
of the ZWCAD window.
Modifying a command
CHAPTER 2
16
If you are working in the command bar, there are special ways that you can modify a
command as you work. You can modify the active command using any of the following
options:
Object snaps — Type an object snap command, such as nearest or midpoint, to
enable a one time object snap for a single selection. You can also use a one time
object snap to override a running object snap.
Extension snaps — Type int after selecting a command, such as Line or Circle, to
enable a one-time snap to the logical location where two objects would intersect if
they were of infinite length. Type app to enable a similar one time snap if the
extensions would not intersect in three dimensional space but would intersect in the
current view.
Using the Prompt History window
The Prompt History window displays a history of the commands and prompts issued since
you started the current session of ZWCAD. By default, the program tracks up to 256
command lines.
There is no limit to the number of command lines you can track, but program performance
may be degraded if you choose to track an excessively high number of lines.
To display or close the Prompt History window
Press F2.
To view entries in the Prompt History window
Do one of the following:
Use the scroll bars.
Use the Up and Down arrows to display previously used commands.
To copy or paste text in the Prompt History window
1 If you want to copy text from the text window, do one of the following to get the text field
that you want:
Highlight text using your mouse.
Press Ctrl + Shift + arrow keys to highlight text.
2 Right-click and choose whether to copy or paste.
TIP You can also copy the entire command history by choosing Copy History.
2.3.3. Switch between Dialog Boxes and the Command line
Some functions are both provided similarly though the command line and from a dialog
box. In many cases, you can enter a hyphen in front of the command to suppress the
dialog box and display prompts on the command line instead.
For example, entering linetype on the command line displays the linetype Manager.
Entering -linetype on the command line displays the equivalent command line options.
There may be tiny differences between the options in the dialog box and those available
on the command line.
The system variables below affect the display of dialog boxes as well:
ATTDIA controls whether INSERT uses a dialog box for attribute value entry.
EXPERT controls whether certain warning dialog boxes are displayed.
FILEDIA controls the display of dialog boxes used with commands that read and
write files. For example, if FILEDIA is set to 1, OPEN displays the Open Drawing
THE USER INTERFACE
17
As dialog box. If FILEDIA is set to 0, OPEN displays prompts on the command
line. Even when you set FILEDIA to 0, you can get a file dialog box displayed
through entering a tilde (~) at the first prompt.
2.4. Dynamic input
"Dynamic input" box is a floating window which appears near the cross cursor in the
implementation of any drawing command, it provides a convenient method for users to
input command prompt dynamically instead of using command window. When the DYN
mode is turned on, a floating window will appear near the cross cursor displaying
command line prompt and changing along with the cursor moves. "Dynamic input" box
displays the identical contents as the command line shows synchronously whereas
unavailable if DYN mode is off.
"Dynamic input" box facilitates users to draw pictures freely and efficiently, which is
comparatively more intuitionist than using command window to display prompts when
executing a drawing command.
"Dynamic input" box can not replace command window, you can press F12 to hide
command window to increase drawing area, but it is sometimes necessary when
implementing certain commands.
Status of Dynamic input
Clicks on the ―DYN‖ button on status bar to control its status. When "Dynamic input" mode
is turned on, the command line prompt will be displayed in the "Dynamic input" box
synchronously; while the "Dynamic input" mode is turned off, the toolbar box displays
current polar coordinate of cross cursor.
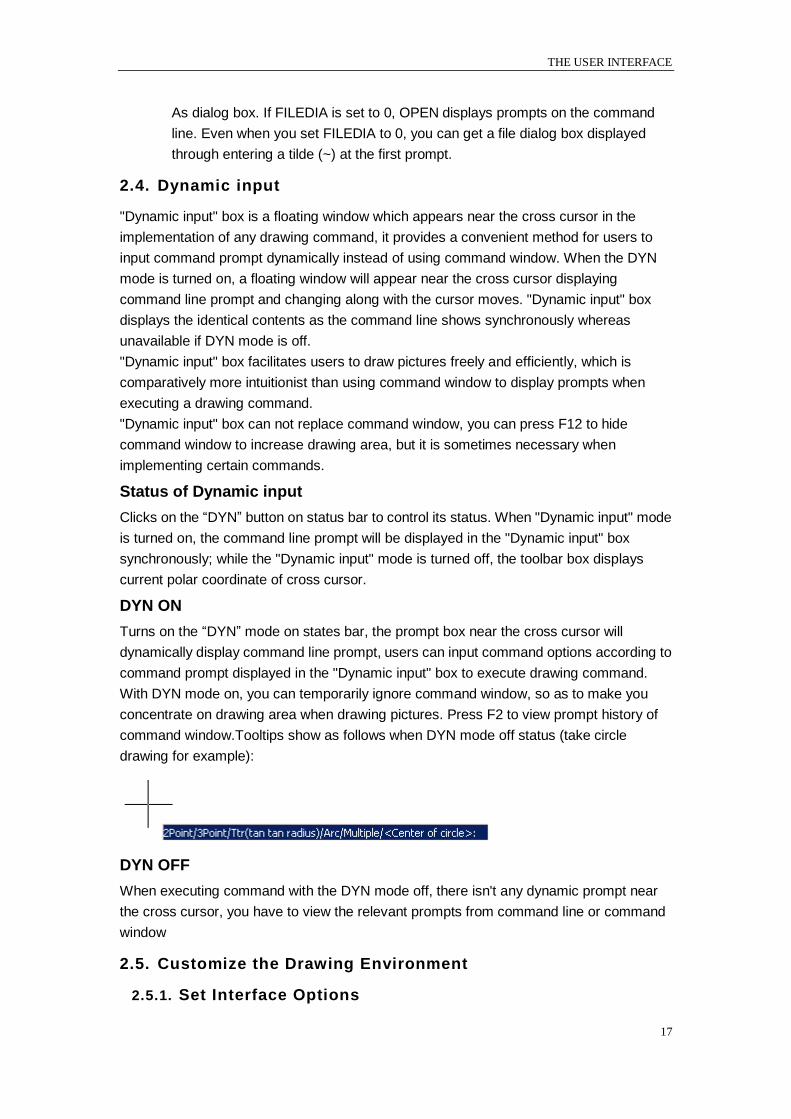
DYN ON
Turns on the ―DYN‖ mode on states bar, the prompt box near the cross cursor will
dynamically display command line prompt, users can input command options according to
command prompt displayed in the "Dynamic input" box to execute drawing command.
With DYN mode on, you can temporarily ignore command window, so as to make you
concentrate on drawing area when drawing pictures. Press F2 to view prompt history of
command window.Tooltips show as follows when DYN mode off status (take circle
drawing for example):
DYN OFF
When executing command with the DYN mode off, there isn't any dynamic prompt near
the cross cursor, you have to view the relevant prompts from command line or command
window
2.5. Customize the Drawing Environment
2.5.1. Set Interface Options
CHAPTER 2
18
In the Options dialog box, you can change many of the settings that affect the ZWCAD
interface and drawing environment.
Settings of modifying interface:
Automatic Save (Open and Save tab). Saves your drawing at specified time
intervals. To use this option, in the Options dialog box, Open and Save tab, select
Automatic Save and enter the interval in minutes.
Color (Display tab). Specifies the background colors used in the layout and Model
tabs and the color used for prompts and crosshairs.
Font (Display tab). Changes the fonts used in the ZWCAD window and in the text
window. This setting does not affect the text in your drawings.
Search Path (Files tab). Sets the search path ZWCAD uses to find drawing
support files such as text fonts, drawings, linetypes, and hatch patterns.
Interface color( ―Skins and Themes‖tab). Sets ZWCAD window skins and display
themes.
Controlling size and position of each toolbar or window:
After starting ZWCAD, you can fix or adjust position and size of each toolbar or window by
dragging. Software interface includes column, order window, "Properties" option board,
"Quick Calculator" window, "Design Center" window, and so on.
Controlling position of toolbar
Toolbars can be floating or fixed. The floating toolbar locates in arbitrary location of the
drawing area of ZWCAD window, can be dragged to its new location, adjust its size or
fixed. Fixed toolbar attaches to any of the edges in drawing area, once the toolbar is fixed,
its size can‘t be adjusted. You can remove the fixed toolbar by dragging it to a new fixing
position.
Controlling size and position of other windows
When dragging command window, "Properties" option board, "Quick Calculator" window,
buoys displayed in corners and center position of drawing area, if not select buoys but
dragging the selected window to arbitrary position of drawing area, the window will be on
floating state, users can adjust size of the window based on the actual needs. If Click on
the one of the buoys in the process of dragging, the location of the window will be fixed to
the top, bottom and left side or right side of a fixed region of ZWCAD window, at this time,
the size of window can be adjusted in only one direction.
Locks the position of toolbars and docked windows
For aligned toolbars and docked, floating windows, you can lock their position. Locked
toolbars or windows can still be opened or closed and items can be added and deleted,
but can not be moved. If need to unlock temporarily, you can press down CTRL.
Displaying commands on a shortcut menu
Shortcut menus provide quick access to specific commands. A shortcut menu displays
when you right click an object, toolbar, status bar, the Model tab name, or a Layout tab
name. The selections presented in the shortcut menu depend on what you clicked.
When you right click a toolbar, the program displays a shortcut menu that lets you toggle
the command bar, status bar, and various toolbars on and off. If you select one or more
THE USER INTERFACE
19
objects and then right click, the program displays a shortcut menu from which you can
choose a command to modify the selected objects. To display a short cut menu from
which you can choose an object snap, press and hold down the Shift key, and then right
click anywhere within the drawing window.
Using the command bar
The command bar is a dockable window in which you type ZWCAD commands and view
prompts and other program messages. To display the command bar, choose
View >Display> Command Bar. You can move the command bar by way of dragging.
When the command bar is floating, you can drag the top or bottom of the window to
change the number of lines of text it displays. You can dock the command bar at the top or
bottom of the drawing.
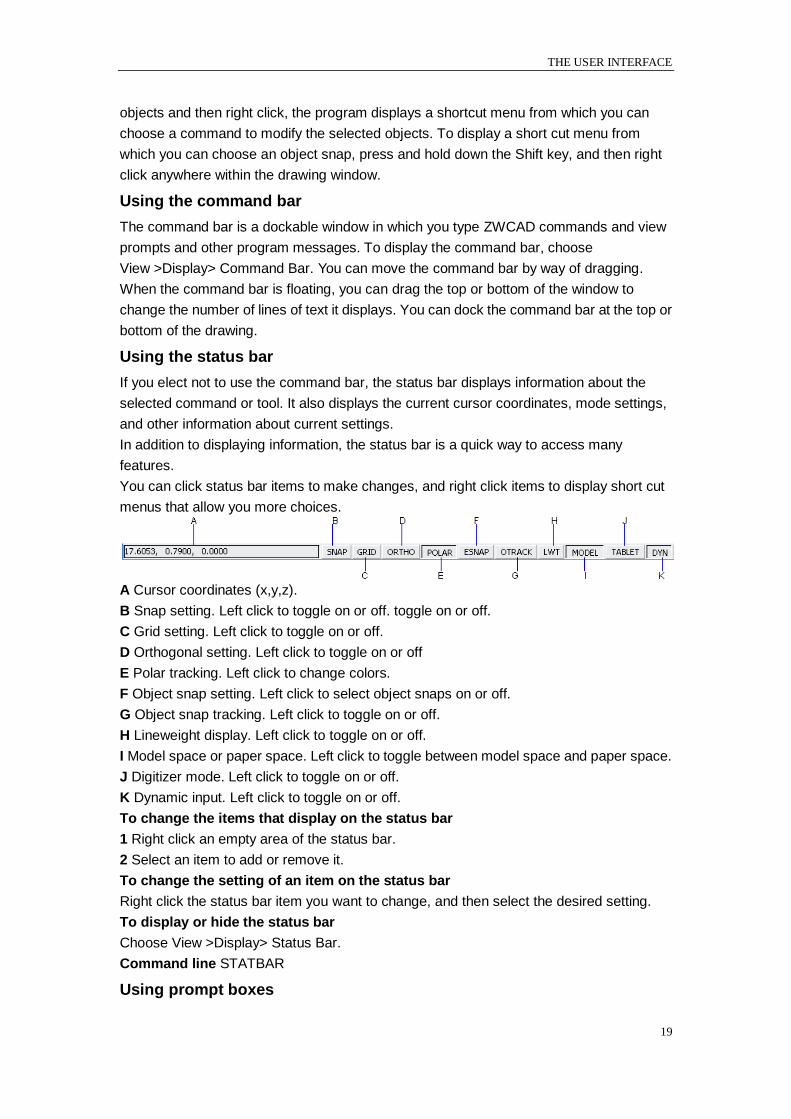
Using the status bar
If you elect not to use the command bar, the status bar displays information about the
selected command or tool. It also displays the current cursor coordinates, mode settings,
and other information about current settings.
In addition to displaying information, the status bar is a quick way to access many
features.
You can click status bar items to make changes, and right click items to display short cut
menus that allow you more choices.
A Cursor coordinates (x,y,z).
B Snap setting. Left click to toggle on or off. toggle on or off.
C Grid setting. Left click to toggle on or off.
D Orthogonal setting. Left click to toggle on or off
E Polar tracking. Left click to change colors.
F Object snap setting. Left click to select object snaps on or off.
G Object snap tracking. Left click to toggle on or off.
H Lineweight display. Left click to toggle on or off.
I Model space or paper space. Left click to toggle between model space and paper space.
J Digitizer mode. Left click to toggle on or off.
K Dynamic input. Left click to toggle on or off.
To change the items that display on the status bar
1 Right click an empty area of the status bar.
2 Select an item to add or remove it.
To change the setting of an item on the status bar
Right click the status bar item you want to change, and then select the desired setting.
To display or hide the status bar
Choose View >Display> Status Bar.
Command line STATBAR
Using prompt boxes
CHAPTER 2
20
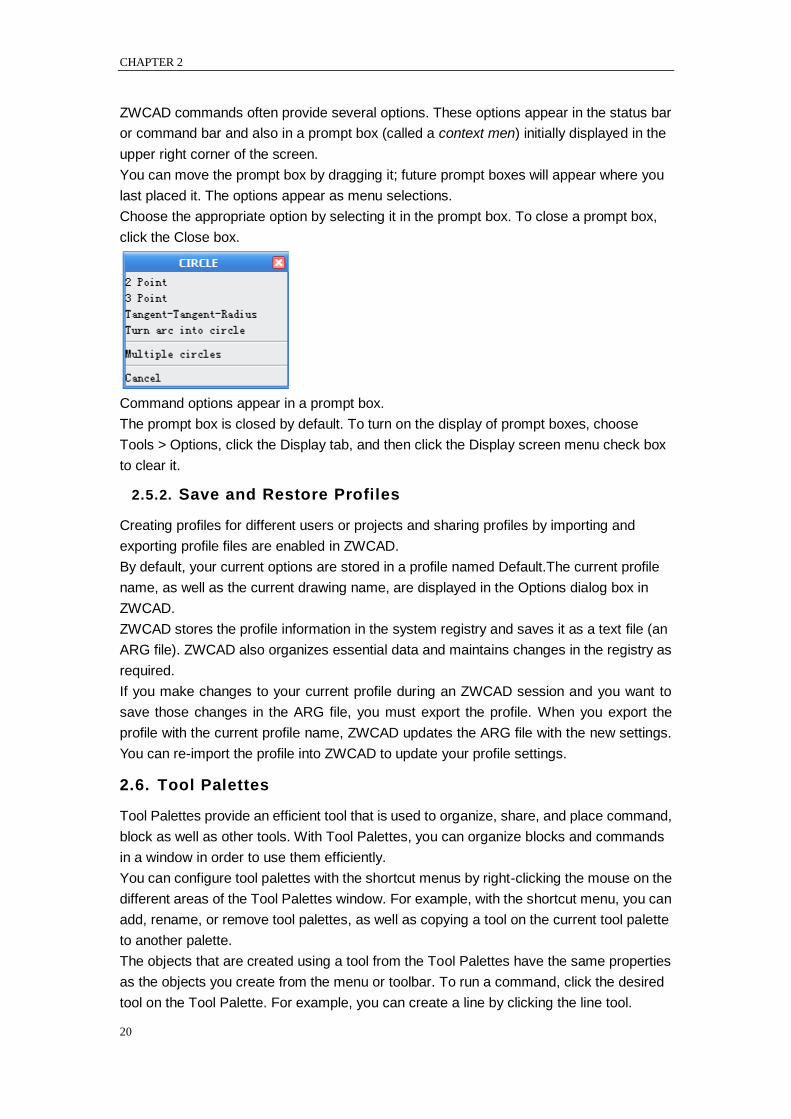
ZWCAD commands often provide several options. These options appear in the status bar
or command bar and also in a prompt box (called a context men) initially displayed in the
upper right corner of the screen.
You can move the prompt box by dragging it; future prompt boxes will appear where you
last placed it. The options appear as menu selections.
Choose the appropriate option by selecting it in the prompt box. To close a prompt box,
click the Close box.
Command options appear in a prompt box.
The prompt box is closed by default. To turn on the display of prompt boxes, choose
Tools > Options, click the Display tab, and then click the Display screen menu check box
to clear it.
2.5.2. Save and Restore Profiles
Creating profiles for different users or projects and sharing profiles by importing and
exporting profile files are enabled in ZWCAD.
By default, your current options are stored in a profile named Default.The current profile
name, as well as the current drawing name, are displayed in the Options dialog box in
ZWCAD.
ZWCAD stores the profile information in the system registry and saves it as a text file (an
ARG file). ZWCAD also organizes essential data and maintains changes in the registry as
required.
If you make changes to your current profile during an ZWCAD session and you want to
save those changes in the ARG file, you must export the profile. When you export the
profile with the current profile name, ZWCAD updates the ARG file with the new settings.
You can re-import the profile into ZWCAD to update your profile settings.
2.6. Tool Palettes
Tool Palettes provide an efficient tool that is used to organize, share, and place command,
block as well as other tools. With Tool Palettes, you can organize blocks and commands
in a window in order to use them efficiently.
You can configure tool palettes with the shortcut menus by right-clicking the mouse on the
different areas of the Tool Palettes window. For example, with the shortcut menu, you can
add, rename, or remove tool palettes, as well as copying a tool on the current tool palette
to another palette.
The objects that are created using a tool from the Tool Palettes have the same properties
as the objects you create from the menu or toolbar. To run a command, click the desired
tool on the Tool Palette. For example, you can create a line by clicking the line tool.
THE USER INTERFACE
21
When you click an arrow next to a tool, all other tools that have the similar properties are
displayed. The objects that are created using a tool on a tool flyout have the same
properties as the objects you created from the original tool.
You can create a block tool by dragging a block out of an exterior file to the current tool
palette performed from the Design Center. The items to be added to a tool palette are
called Tool. By clicking the block tool, you can insert the block into your current drawing.
ZWCAD supports using existing entities as tools via adding the entity to the tool palettes.
You can firstly select the entity to be used as tool from the drawing area, select Copy from
right click menu, and then right click on anyone of the palettes or current palette, select
Paste option, thus a tool is created. Currently supported entities are arc, defined attributes,
circle, ellipse, line, 2D and 3D polyline, mline, mtext, point, 3Dmesh, ray, region, 2Dsolid,
spline curve, text, tolerance, trace, construction line wipeout and so on.
Once you have added geometric entities (circle, line, polyline .etc) to a tool palette by way
of copy and paste, a new tool list with flyout will be automatically generated on the
palettes. For example, a triangle will be displayed on the new geometric entity icon, click
this triangle to flyout tool list containing lines, construction line, polyline and circle .etc.
The changes made to the Tool Palettes are saved as a configuration file automatically,
which are still available when you launch ZWCAD again.
CHAPTER 3
22
3. Create and Save a Drawing
3.1. Create a new drawing
When the system variables FILEDIA and STARTUP are set to 1, typing NEW opens
Startup dialog box, from which, you can use Default Setting, Template or Wizard to create
a new drawing.
When the FILEDIA and STARTUP are set to 1 and 0 separately, typing NEW opens Open
Template dialog box, from which you can select the desired one or use the default
template by clicking arrowhead button next to Open button.
Typing QNEW creates a new drawing with a default template. No dialog box is displayed
with this command.
You can change the search path of template files from the FILE tab in the Options dialog
box.
3.1.1. Start a Drawing from Scratch
You can select either imperial or metric units for the new drawing if you choose Start from
Scratch. The setting you select determines default values which is used for many system
variables controlling text, dimensions, grid, snap, and the default linetype and hatch
pattern file.
Imperial. A new drawing with the imperial measurement system. The drawing
uses internal default values, and the default boundary is 12 × 9 inches.
Metric. A new drawing with the metric measurement system. The drawing uses
internal default values, and the default boundary is 429 × 297 millimeters.
When you start ZWCAD, there are three options for choosing to draw. You can start from
scratch using default settings, you can start from a template file with a preset environment,
or you can use a wizard to step you through the process, in each case, you can choose
the conventions and defaults you want to use.
Start a Drawing from Scratch
You can start from scratch to create a new drawing quickly by using settings from a
default drawing template file.
To start a drawing from scratch with the Startup dialog box.
1 On the File menu, click New.
2 In the Startup dialog box, click Start from Scratch.
3 Under Default Settings, click either Imperial or Metric.
Standard toolbar
Command line NEW
3.1.2. Use a Setup Wizard

CREATE AND SAVE A DRAWING
23
From the Startup dialog box, you can select ―Use a Wizard‖ tab to create a new drawing
by the wizard. There are two wizard options illuminated as follows:
Advanced Setup Wizard
From this option, you can set units of measurement, precision of displayed units, and grid
limits. Also specify angle settings such as units of measurement style, precision, direction,
and orientation based on template ZWCADiso.dwt.
Quick Setup Wizard
From this option, you can specify units of measurement, precision of displayed units, and
grid limits based on template ZWCADiso.dwt.
To begin a new drawing using a wizard
1 On the File menu, click New.
2 In the Startup dialog box, click Use a Wizard.
3 Click Quick Setup or Advanced Setup.
4 Complete the wizard pages using the Next and Back buttons to move forward and
backward.
5 On the last page, click Finish.
Standard toolbar
Command line NEW
3.1.3. Use a Template File to Start a Drawing
Drawing template files contain standard settings and have a .dwt file extension.
There are two methods provided for creating a new drawing when the system variable
FILEDIA is set to 1.
When the STARTUP is set to 1, typing NEW opens Startup dialog box, from which,
you can select the desired template to create a new drawing.
When the STARTUP is set to 1, typing NEW opens Open Template dialog box, from
which, you can select the desired template to create a new drawing.
The changes made to a new drawing based on an existing template file do not affect the
template file.
Create a Drawing Template File
When you need to create several drawings with the default settings, you can save time by
creating a template file designed to create the same drawing files so that you does not
need to specify default settings each time you start. Conventions and settings commonly
stored in template files include:
Unit type and precision
Title blocks, borders, and logos
Layer names
Snap, Grid, and Ortho settings
Grid limits
Dimension styles
Text styles
Linetypes
CHAPTER 3
24
Recover the default drawing template file
If you have changed the settings in the template file ZWCAD.dwt or ZWCADiso.dwt, you
can reset them by creating a new drawing with no template and then saving the drawing
as a drawing template file in order to replace ZWCAD.dwt or ZWCADiso.dwt.
When the STARTUP is set to 0, you can also create a new drawing with the original
defaults by clicking the arrowhead next to Open button to select one of the No Template
options from the Open Template dialog box.
To start a drawing by selecting a template file
1 On the File menu, click New.
2 In the Select Template dialog box, select a template from the list and click Open.
ZWCAD opens the drawing as drawing1.dwg. The default drawing name changes to
reflect the number of new drawings that have been opened. For example, if you open
another drawing from a template, the default drawing name is drawing2.dwg. If you want
to start a new drawing with no template file, click the arrow next to the Open button and
then click one of the ―no template‖ options from the list.
Standard toolbar
Command line NEW
3.2. Open an Existing Drawing
You can open drawing (.dwg) files, Drawing Exchange Format (.dxf) files, Design Web
Format™ (.dwf) files, and drawing template (.dwt) files.
You can also open and check drawings that you suspect are damaged.
To open an existing drawing
1 Choose File > Open.
2 In Files of Type, choose the type of file you want to open.
3 Choose the folder containing the desired file.
4 Do one of the following:
Choose the drawing you want to open, and then click Open.
Double click the drawing you want to open.
If the drawing requires a password, enter the password, click OK to verify the
password, and then click Open again.
Standard toolbar
Command line OPEN
TIP You can also open drawings while browsing files on your computer using programs
that came with your operating system, such as Windows File Explorer or My Computer.
Just double click the file to get it open in ZWCAD. Easily find the drawing you want by
viewing thumbnail images of the drawing files as you browse them.
TIP To quickly open a drawing file that you recently used, choose File > <file name>. The
File menu tracks the latest four drawings by default.
3.2.1. Find and open a Drawing File
CREATE AND SAVE A DRAWING
25
You can search for a drawing using name, location, and date filters or properties such as
keywords that you added to the drawing.
Open drawing
Uses Open on the File menu or Quick Access toolbar to open Select File dialog box, from
which you can select the desired file.
You can also open a drawing by dragging a drawing into anywhere outside the drawing
area. However, if you drag a drawing into the drawing area of an open drawing, the new
drawing is inserted into the open drawing as a block reference instead of opening it.
You can also double-click drawing to launch ZWCAD program to open it. If ZWCAD is
running, the drawing opens in the current session.
Change the default drawing folder
Each time you launch ZWCAD, the path you specified to open a latest drawing is
displayed in each standard file selection dialog box. You can also specify a default path to
ZWCAD by changing default drawing folder.
Find a drawing file
Clicking Tools button from the Open Drawing dialog box displays Search dialog box, from
which, you can search drawing through name, location and date filters.
You can preview the selected drawing in the Open Drawing dialog box. When the system
variable RASTERPREVIEW is on, a preview image with BMP format is generated and
saved with the drawing.
Set the search path
The Files tab of Options dialog box is used by ZWCAD to search drawing support files.
The support files includes text fonts, drawings, linetypes and hatch patterns.
The system variable MYDOCUMENTSPREFIX is designed to store the location of My
Documents folder for the current user.
You can also specify the location of temporary files on the Files tab of the Option dialog
box. Temporary files are created on the specified path and then deleted when you exit
ZWCAD program. The default temporary folder is specified to the location that Microsoft
Windows uses.
You should specify another location for temporary files when you run ZWCAD in a
write-protected director for example, if you work on a network or open files on a CD). The
director must not be write-protected and can provide enough disk space for the temporary
files.
Add identifying information to drawings
You can find the specified drawings more easily by adding keywords or other information
to them in the Drawing Properties dialog box opened from the File menu. The drawing
properties such as title, author, subject, keyword or other important information can help
identify drawings more easily. You can also assign hyperlink addresses, director paths
and multiple custom properties to your drawings.
The Drawing Properties dialog box contains the following drawing information:
General. It contains the drawing type, location, size and other information. These
information are stored by the operation system and can be read-only. You can change
these values only through Windows Explorer.
CHAPTER 3
26
Summary. This tap contains the drawing properties such as author, title and subject.
Statistics. The drawing size, created date and latest modified date and other
information are displayed in this tap.
Custom. Specifies the custom file properties.
3.2.2. Work with Multiple Open Drawings
You can open multiple drawings at one time. There are several methods for switching a
drawing to another.
Acting the drawing by clicking it
Uses shortcut keys of CTRL+6 or CTRL+TAB. This option is not available while
ZWCAD is running other command.
You can change the display styles to Cascade, Title Vertically or Title Horizontally
from the Window menu. You can also use Arrange Icons to align icons if there are
several minimum drawings.
You can quickly reference other drawings to copy and paste between drawings. You can
also use Match command to copy properties from objects in one drawing to objects in
another drawing. Object snaps, the Copy with Basepoint ( COPYBASE ) command, and
the Paste to Original Coordinates ( PASTEORIG) command is used to ensure accurate
placement, especially when copying objects from one drawing to another.
3.2.3. Recover a Damaged File
You can recover some or all of data by reverting to a backup file or using commands to
find and correct errors if a drawing file is damaged. A drawing file may be damaged by a
hardware failure, power outage and system crash. You can minimize loss by saving files
frequently.
ZWCAD can recover a slightly damaged drawing file while opening it.
If a drawing is damaged, you can use RECOVER command to check and attempt to open
it. Then uses AUDIT command to find and correct errors.
Though ZWCAD can recover a damaged drawing file, it is not sure that the recovery
drawing is the same exactly as the original one. You had better create a backup file if the
drawing is important. On the Open and Save tap of Options dialog box, you can specify
the backup file are created when you save drawings and set the proper interval time for
saving. Then a backup copy file with a .bak extension is created when you save the
named drawing once again. After that, a backup file is always updated while you
executing the command SAVE or SAVEAS.
If ZWCAD exits unexpectedly, it attempts to rename the current backup file in order to
avoid covering the original one.
You can recover a drawing file by saving a bak file to a dwg file.
Files can become damaged for many reasons. For example, if you are working on a
drawing during a power outage, a system crash, or a hardware failure, your drawing file
may become damaged. ZWCAD allows you to open and check damaged files to attempt
file recovery.
Recovering a file attempts to open one of the following file types:
Standard drawing files with a .dwg extension.
CREATE AND SAVE A DRAWING
27
Drawing Exchange Format files with a .dxf file extension.
Design Web Format files with a .dwf file extension.
Drawing templates with a .dwt file extension.
You can also audit any open file to check it for errors. You specify whether you want
ZWCAD to fix any errors that are found automatically. ZWCAD fixes as many errors as
possible and any errors that cannot be fixed are reported as ―Ignored‖ in the Prompt
History window.
To open a damaged file
1 Choose File > Drawing Utilities>Recover.
2 In Files of Type, choose the type of file you want to recover.
3 Choose the directory containing the damaged file.
4 Choose the damaged file you want to recover.
5 Click Open.
Command line RECOVER
To check errors for a drawing file
1. With the drawing open that you want to check, choose File > Drawing Utilities > Audit.
2. Input Y or N to determine whether to recover the errors that are automatically found by
ZWCAD, and then press Enter.
Command line AUDIT
Drawing Recovery
Once terminated by hardware problems, power failure or software problems, the
application is capable of backup the opened drawing file. At the next startup, the program
starts ―Drawing Recovery‖ manager in which all of the auto-backup drawing files that have
been closed accidentally will be displayed. You can open the file of your demand by
double clicking at the Backup File list on the ―Drawing Recovery‖, if there is any damage
to the file, system attempts to recover the drawing in process of backup.
When program or system stopped by accident, the drawing files need to recover are
sorted into the following types:
Recovered drawing file saved when program fails.( DWG )
Auto saved file, so called ―auto-save‖ file (SV$)
Backup file (BAK)
Source drawing file ( DWG )
3.3. Save a Drawing
You save drawing files for later use just as you do with other Microsoft Windows
applications. You can also set up automatic saving and backup files and save only
selected objects.
The file extension for drawing files is .dwg, and unless you change the default file format
in which drawings are saved, drawings are saved in the latest drawing-file format.
After you have saved your drawing for the first time, you can save it with a new name. In
addition to drawing (.dwg) files, you can also save a drawing in a Drawing Exchange
Format (.dxf) file or a drawing template (.dwt) file.
If you created your drawing using a template, saving the drawing does not alter the
CHAPTER 3
28
original template.
To save a drawing:
Choose File > Save.
Command line SAVE
TIP When you save a drawing the first time, the program displays the Save Drawing As
dialog box so that you can choose a directory and type a name for the drawing.
Save Your Drawing Automatically
You can specify to save drawing files automatically in order to minimize the lost data once
a problem occurs.
If you start the automatic save option, your drawing is saved at specified time intervals. By
default, system assigned the name filename.sv$ for temporarily saved files, filename here
refers to current drawing name.
The temporary files are removed automatically when a drawing closes normally. However,
these files are not deleted if there is a program failure or power failure. You can recover
the drawing by reverting to a previous version of your drawing from the automatically
saved file. In order to do that, you have to rename the file using a .dwg extension.
Use Backup Files
ZWCAD creates a backup file with the current drawing name and a .bak extension to save
the previous version of the current drawing when launching ―backup automatically‖ option.
You can revert to the previous version of your drawing anytime using a .dwg extension in
place of the .sv$ extension.
Save Part of a Drawing File
You can use BLOCK command or WBLOCK command to create a new drawing from part
of an existing drawing. You can select entities or a block definition in your current drawing
and save them in a new drawing file. The description also can be saved in the new
drawing.
Save to a Different Type of Drawing File
Choose the format from Files of Type in the Save Drawing As dialog box, you can save a
drawing to an earlier version of the drawing format (DWG) or drawing interchange format
(DXF), or save a drawing as a template file.
You can save a drawing with a new name and in any of the following file formats:
Standard drawing files with a .dwg extension. You can choose a .dwg file format that
is compatible with various versions of AutoCAD.
Drawing Exchange Format files with a .dxf file extension. You can choose a .dxf file
format that is compatible with various versions of AutoCAD.
Drawing templates with a .dwt file extension. Drawing templates allow you to easily
create new drawings that reuse your drawing settings and entities.
To save a drawing with a new name or file format
1 Choose File > Save As.
2 In the Save Drawing As dialog box, under Save As Type, choose the file format.
3 Specify the name of the file you want to create.
4 Click Save.
CREATE AND SAVE A DRAWING
29
Command line SAVEAS
TIP You can also export drawing files to various file formats.
Reduce the Time Required to Save a Drawing File
In order to reduce the time of saving a drawing file, you can specify the incremental save
percentage on the Open and Save tap of Options dialog box or from the ISAVEPERCENT
system variable.
The incremental save updates only the portions of the saved drawing file you changed.
Drawing files will contain a percentage of potentially wasted space when you use
incremental saves. This percentage increases after each incremental save until it reaches
the specified maximum value, and then a full save is perform.
When the ISAVEPERCENT system variable is set to 0, all saves are full saves. This
option required more time to save a drawing file but can reduce the size of drawing files. It
is recommend you perform a full save before transmitting or archiving a drawing.
3.4. Error Report
An error report module will intercept any unhandled exception generated by ZWCAD,
build a complete debug report, and optionally send a crash report.
Sending error report may help assess the stability of ZWCAD software while working in
user environment, and improve the quality of our product. When errors are encountered in
the procedure of some programs, a dialog box pops up for the user to record the cause of
the error and send error report automatically created by the software to the assigned
email address so as to help us diagnose the cause of the error and improve our software.
Once the software encounters exceptional shutdown, a folder named BugReport will be
automatically generated under the catalog C:\Documents and Settings\User
Account\Application Data\CrashReport, in which all of the compressed packages
generated for the exceptional situations are contained, with *.TXT,*.DMP as well as
error drawing files included in each package. Here TXT and DMP files share the same
name with the compressed package automatically generated.
Describe Error Contents
When errors occur in the program, a dialog box prompts ―ZWCAD.EXE has encountered a
problem and needs to close, we are sorry for the inconveniences‖ for the user to input
descriptions of the problem in the text window showing "Describe what you were doing
when the error occurred", whereas it is an optional requirement.
View Contents of Error Report Files
Generally, the software generates three error reporting files, individually named as *.TXT,
*.DMP and the crashed drawing file itself. In this error report dialog box, you can see the
contents of error reports by clicking on ―Click here‖ links following the prompts ―To see
what this report contains‖. You can optionally select a file in the ―Error Report Contents‖
dialog box, or double click a file to view its contents.
Send Error Report
Clicks on ―Send Error Report‖ button on the Error Reporting dialog box, then you can send
the information of assigned error reports to [email protected] as well as its

CHAPTER 4
30
problem descriptions.
If the network isn't connecting, a prompt box pops up telling you that ―The error report
wasn't sent, please send the file to [email protected]‖. From this prompt box,
you can see the name of error report file together its saving path.
Don't send
Additionally, user can choose not to send error report.
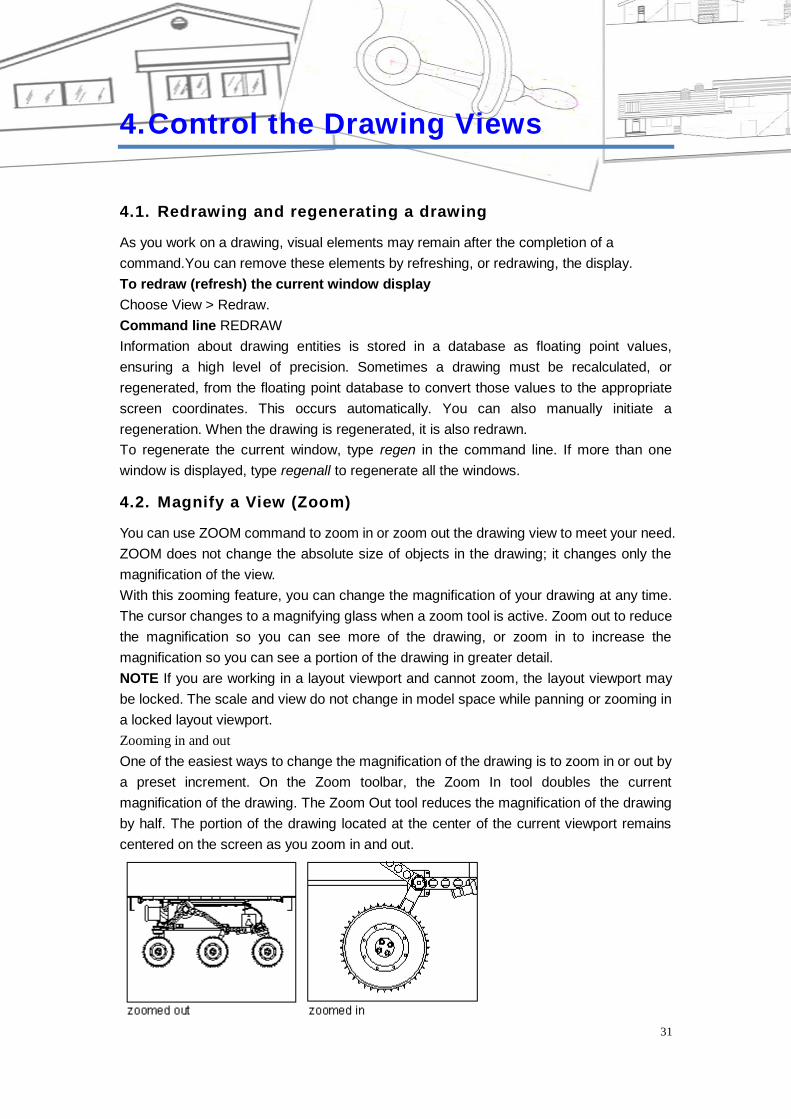
CONTROL THE DRAWING VIEW
31
4. Control the Drawing Views
4.1. Redrawing and regenerating a drawing
As you work on a drawing, visual elements may remain after the completion of a
command.You can remove these elements by refreshing, or redrawing, the display.
To redraw (refresh) the current window display
Choose View > Redraw.
Command line REDRAW
Information about drawing entities is stored in a database as floating point values,
ensuring a high level of precision. Sometimes a drawing must be recalculated, or
regenerated, from the floating point database to convert those values to the appropriate
screen coordinates. This occurs automatically. You can also manually initiate a
regeneration. When the drawing is regenerated, it is also redrawn.
To regenerate the current window, type regen in the command line. If more than one
window is displayed, type regenall to regenerate all the windows.
4.2. Magnify a View (Zoom)
You can use ZOOM command to zoom in or zoom out the drawing view to meet your need.
ZOOM does not change the absolute size of objects in the drawing; it changes only the
magnification of the view.
With this zooming feature, you can change the magnification of your drawing at any time.
The cursor changes to a magnifying glass when a zoom tool is active. Zoom out to reduce
the magnification so you can see more of the drawing, or zoom in to increase the
magnification so you can see a portion of the drawing in greater detail.
NOTE If you are working in a layout viewport and cannot zoom, the layout viewport may
be locked. The scale and view do not change in model space while panning or zooming in
a locked layout viewport.
Zooming in and out
One of the easiest ways to change the magnification of the drawing is to zoom in or out by
a preset increment. On the Zoom toolbar, the Zoom In tool doubles the current
magnification of the drawing. The Zoom Out tool reduces the magnification of the drawing
by half. The portion of the drawing located at the center of the current viewport remains
centered on the screen as you zoom in and out.
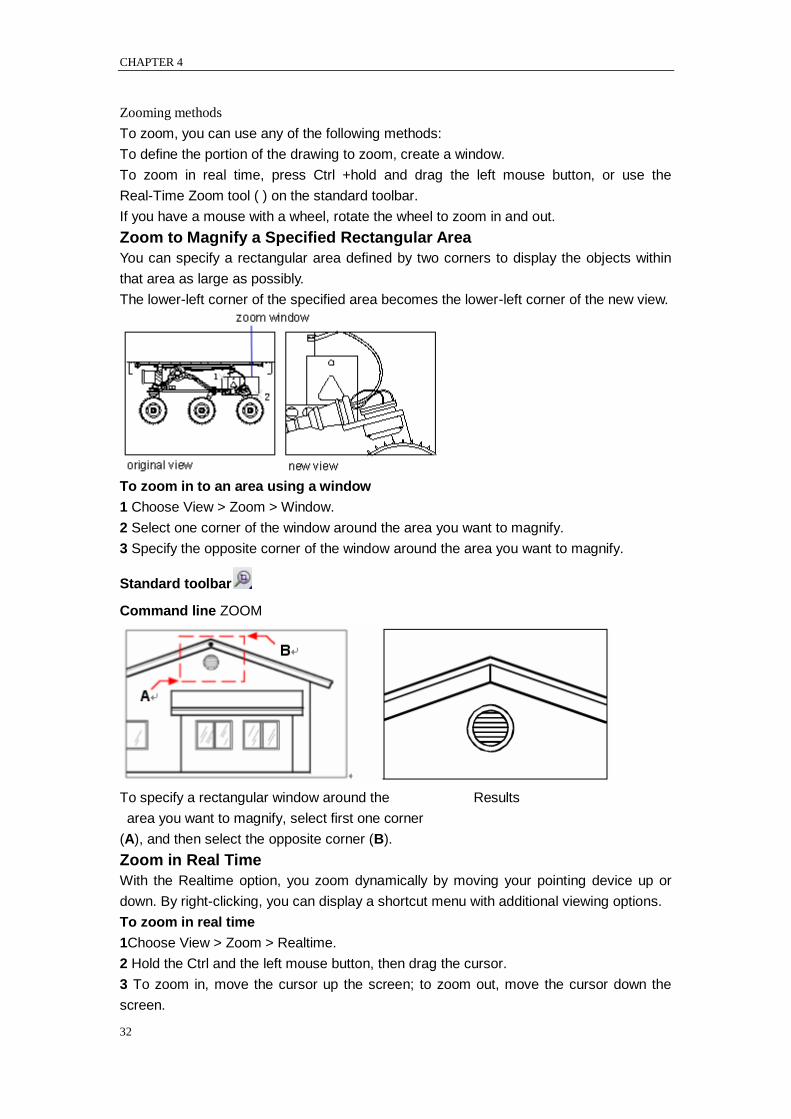
CHAPTER 4
32
Zooming methods
To zoom, you can use any of the following methods:
To define the portion of the drawing to zoom, create a window.
To zoom in real time, press Ctrl +hold and drag the left mouse button, or use the
Real-Time Zoom tool ( ) on the standard toolbar.
If you have a mouse with a wheel, rotate the wheel to zoom in and out.
Zoom to Magnify a Specified Rectangular Area
You can specify a rectangular area defined by two corners to display the objects within
that area as large as possibly.
The lower-left corner of the specified area becomes the lower-left corner of the new view.
To zoom in to an area using a window
1 Choose View > Zoom > Window.
2 Select one corner of the window around the area you want to magnify.
3 Specify the opposite corner of the window around the area you want to magnify.
Standard toolbar
Command line ZOOM
To specify a rectangular window around the Results
area you want to magnify, select first one corner
(A), and then select the opposite corner (B).
Zoom in Real Time
With the Realtime option, you zoom dynamically by moving your pointing device up or
down. By right-clicking, you can display a shortcut menu with additional viewing options.
To zoom in real time
1Choose View > Zoom > Realtime.
2 Hold the Ctrl and the left mouse button, then drag the cursor.
3 To zoom in, move the cursor up the screen; to zoom out, move the cursor down the
screen.
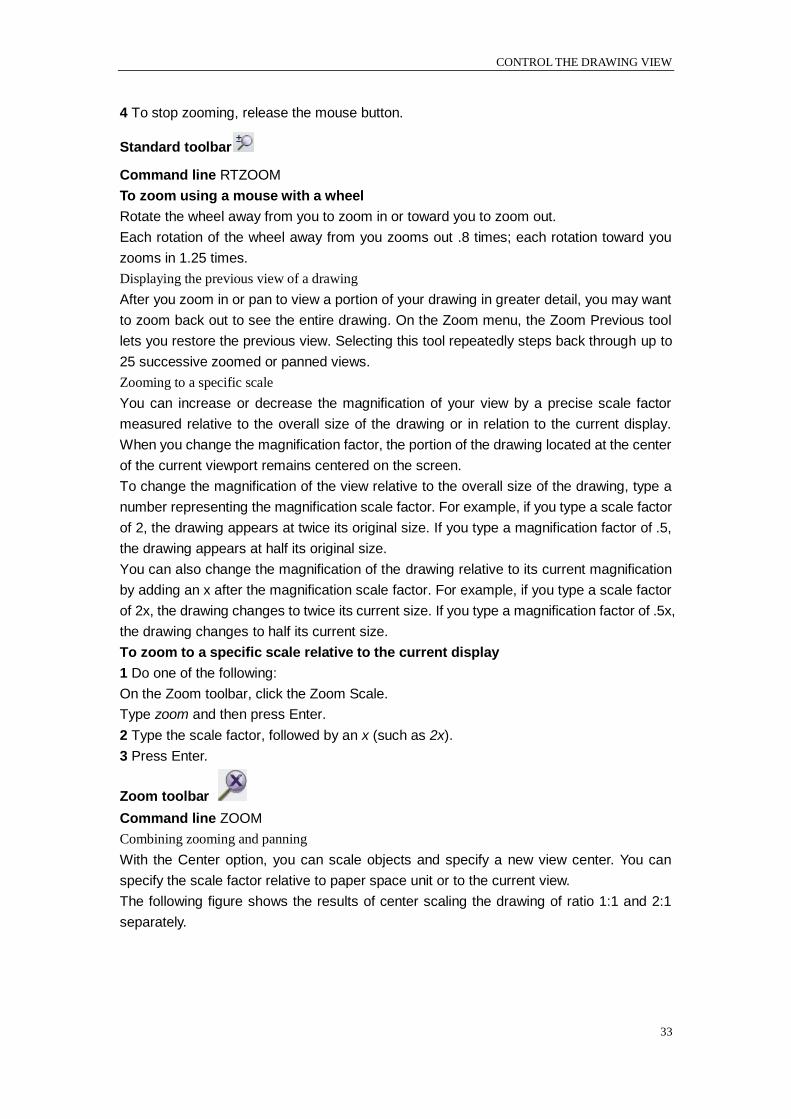
CONTROL THE DRAWING VIEW
33
4 To stop zooming, release the mouse button.
Standard toolbar
Command line RTZOOM
To zoom using a mouse with a wheel
Rotate the wheel away from you to zoom in or toward you to zoom out.
Each rotation of the wheel away from you zooms out .8 times; each rotation toward you
zooms in 1.25 times.
Displaying the previous view of a drawing
After you zoom in or pan to view a portion of your drawing in greater detail, you may want
to zoom back out to see the entire drawing. On the Zoom menu, the Zoom Previous tool
lets you restore the previous view. Selecting this tool repeatedly steps back through up to
25 successive zoomed or panned views.
Zooming to a specific scale
You can increase or decrease the magnification of your view by a precise scale factor
measured relative to the overall size of the drawing or in relation to the current display.
When you change the magnification factor, the portion of the drawing located at the center
of the current viewport remains centered on the screen.
To change the magnification of the view relative to the overall size of the drawing, type a
number representing the magnification scale factor. For example, if you type a scale factor
of 2, the drawing appears at twice its original size. If you type a magnification factor of .5,
the drawing appears at half its original size.
You can also change the magnification of the drawing relative to its current magnification
by adding an x after the magnification scale factor. For example, if you type a scale factor
of 2x, the drawing changes to twice its current size. If you type a magnification factor of .5x,
the drawing changes to half its current size.
To zoom to a specific scale relative to the current display
1 Do one of the following:
On the Zoom toolbar, click the Zoom Scale.
Type zoom and then press Enter.
2 Type the scale factor, followed by an x (such as 2x).
3 Press Enter.
Zoom toolbar
Command line ZOOM
Combining zooming and panning
With the Center option, you can scale objects and specify a new view center. You can
specify the scale factor relative to paper space unit or to the current view.
The following figure shows the results of center scaling the drawing of ratio 1:1 and 2:1
separately.
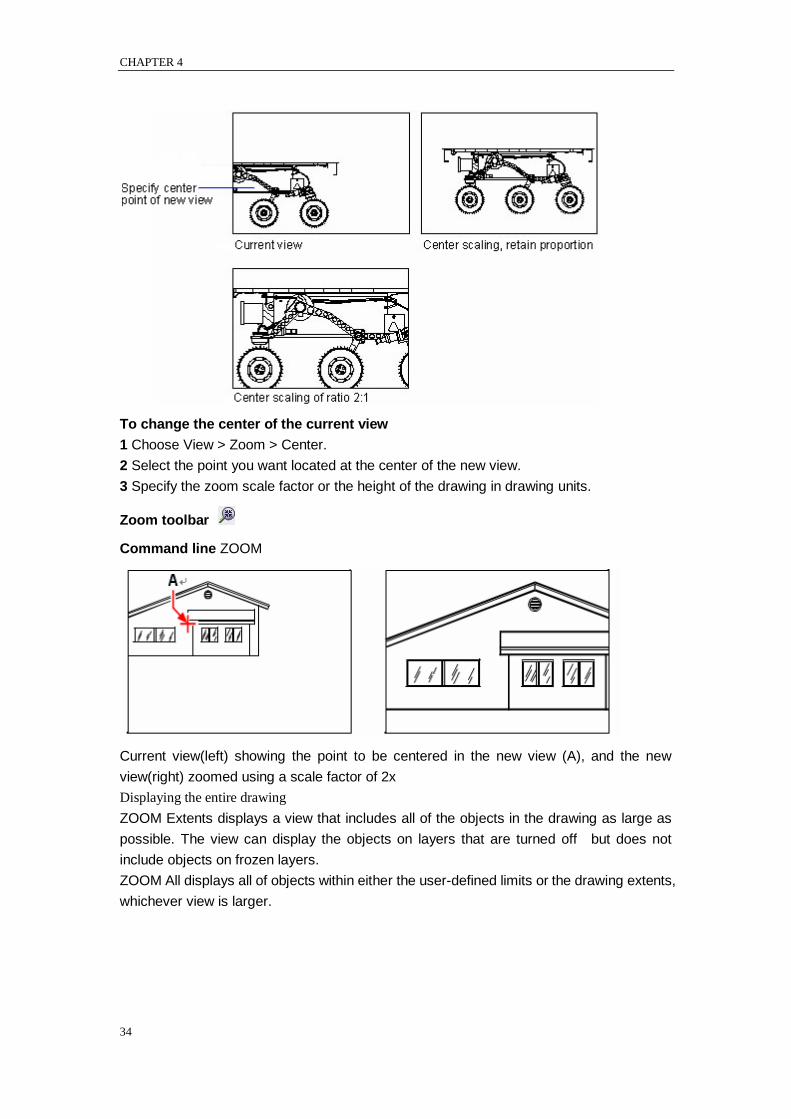
CHAPTER 4
34
To change the center of the current view
1 Choose View > Zoom > Center.
2 Select the point you want located at the center of the new view.
3 Specify the zoom scale factor or the height of the drawing in drawing units.
Zoom toolbar
Command line ZOOM
Current view(left) showing the point to be centered in the new view (A), and the new
view(right) zoomed using a scale factor of 2x
Displaying the entire drawing
ZOOM Extents displays a view that includes all of the objects in the drawing as large as
possible. The view can display the objects on layers that are turned off but does not
include objects on frozen layers.
ZOOM All displays all of objects within either the user-defined limits or the drawing extents,
whichever view is larger.
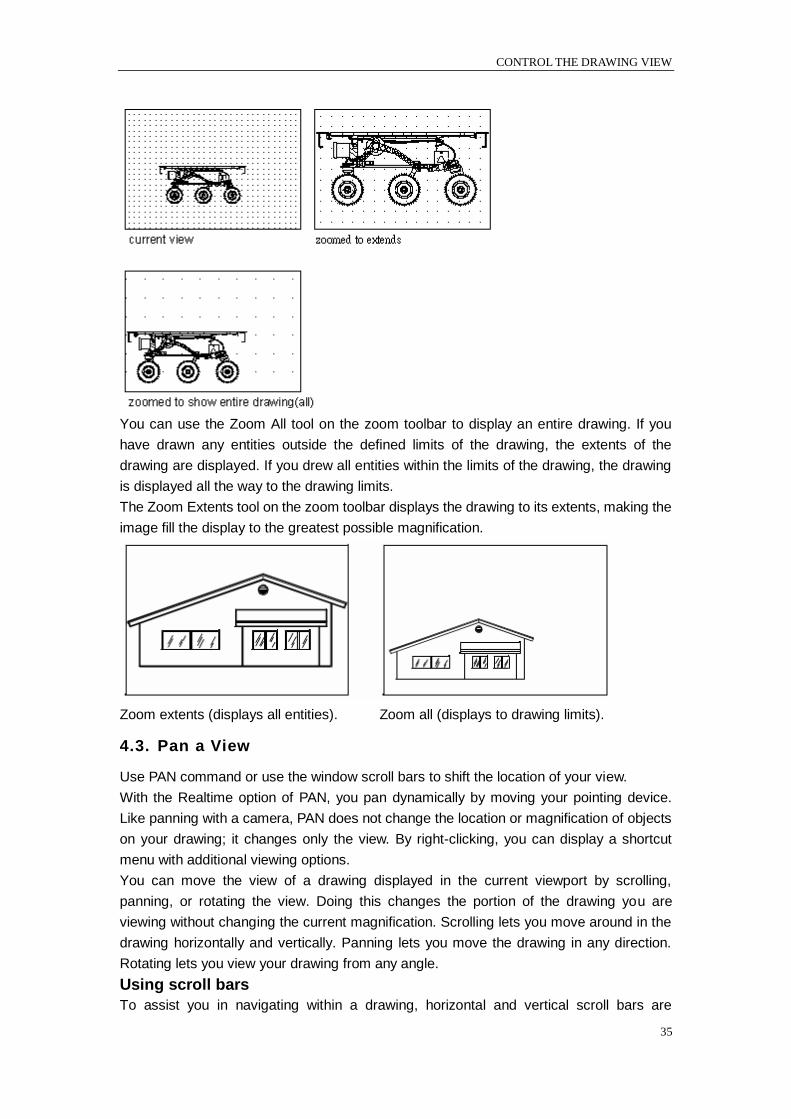
CONTROL THE DRAWING VIEW
35
You can use the Zoom All tool on the zoom toolbar to display an entire drawing. If you
have drawn any entities outside the defined limits of the drawing, the extents of the
drawing are displayed. If you drew all entities within the limits of the drawing, the drawing
is displayed all the way to the drawing limits.
The Zoom Extents tool on the zoom toolbar displays the drawing to its extents, making the
image fill the display to the greatest possible magnification.
Zoom extents (displays all entities). Zoom all (displays to drawing limits).
4.3. Pan a View
Use PAN command or use the window scroll bars to shift the location of your view.
With the Realtime option of PAN, you pan dynamically by moving your pointing device.
Like panning with a camera, PAN does not change the location or magnification of objects
on your drawing; it changes only the view. By right-clicking, you can display a shortcut
menu with additional viewing options.
You can move the view of a drawing displayed in the current viewport by scrolling,
panning, or rotating the view. Doing this changes the portion of the drawing you are
viewing without changing the current magnification. Scrolling lets you move around in the
drawing horizontally and vertically. Panning lets you move the drawing in any direction.
Rotating lets you view your drawing from any angle.
Using scroll bars
To assist you in navigating within a drawing, horizontal and vertical scroll bars are
CHAPTER 4
36
available in each drawing window. The size of the scroll box in relation to the scroll bar
indicates the current level of drawing magnification. The position of the scroll box in
relation to the scroll bar indicates the location of the center of the drawing in relation to the
extents of the drawing (the smallest rectangle containing all the entities in the drawing).
To turn scroll bars on or off
Do one of the following:
Choose View >Display > Scroll Bars.
Choose Tools > Options > Display tab, and select Display Scroll Bars in drawing window.
Command line SCROLLBAR
Using the Pan command
You can move the drawing in any direction using the pan command. Panning shifts or
slides the view of the drawing horizontally, vertically, or diagonally. The magnification of
the drawing remains the same, as does its orientation in space. The only change is the
portion of the drawing displayed.
To pan, you can use any of the following methods:
For precise panning, specify two points defining the magnitude and direction of the pan.
The first point, or base point, indicates the starting point of the pan. The second point
indicates the amount of pan displacement relative to the first point.
To pan in real time, press Ctrl + Hold and drag right mouse button, or use the Pan
Realtime tool on the standard toolbar.
If you have a mouse with a wheel, press and hold the wheel, and then move the mouse.
To pan in real time
1 Choose View > Zoom > Realtime.
2 Move the cursor in the direction you want to pan.
3 To stop panning, press Enter or right click the mouse to choose edit.
Standard toolbar
Command line PAN
TIP Hold down the right mouse button while simultaneously pressing and holding Ctrl to
pan in real time.
To pan using a mouse with a wheel
Press and hold the wheel, and then move the mouse in the direction you want to pan.
(The MBUTTONPAN system variable controls this feature.)
Use Aerial View Window to Pan and Zoom Drawings
With the Aerial view function, it's allowed to display the entire drawing using a window
opened in current drawing, the current drawing is displayed as a wide frame mark, you
can quickly change the views in current viewport via this window.
Aerial view window is quite useful when displaying a large drawing within a small window,
and perform pan and zoom operations quickly.
In the process of drawing, you can directly pan and zoom the view in the aerial view
window if the window is open, without affecting you while doing other operations. You can
also specify new views for current drawing while panning and zooming within aerial view
window. Meanwhile, you don't have to input relevant command or choose from menu
options in ZWCAD platform.
CONTROL THE DRAWING VIEW
37
4.4. Use Aerial View window to pan and zoom drawings
A wide rectangular frame will be displayed in Aerial View window, which is used for
displaying view boundaries of current viewport, also called view frame. Through panning
and zooming the view frame, you can increase or decrease the size of views in drawing
area, and change the views as well.
Click on the Aerial view window to pan and zoom the drawing, press ENTER directly or
right click to finish the operation.
To Zoom a view in Aerial View window
Enter DSVIEWER in command line and then press ENTER.
Double click on the view frame in Aerial View window, until an arrows display in the view.
Drag to the right to zoom out the view, while drag to the left to zoom in.
Right-click or press ENTER directly to end the manipulation.
Command line: DSVIEWER
To pan a view in Aerial View window
Enter DSVIEWER in command line and then press ENTER.
Click on the Aerial View window, a X mark appears in the wide outline frame.
Drag the view frame arbitrary by way of moving the mouse.
Right click or press ENTER to finish the pan manipulation.
Command line: DSVIEWER
Change the view displayed in Aerial View window
Aerial View window provides three buttons on the toolbar for changing the scaling
proportion of images inside the Aerial View window.
Click on Zoom In button, to magnifies the drawing in the Aerial View window to double
size of the current viewport, centered on the current view box.
Click on Zoom Out button to decreases the drawing to half of its original size centered on
the current view box.
Click on Global button to mark current view with a wide frame and display the entire
drawing.
Zooming the views within the Aerial View will not affect the scaling factor of the images
within the drawing area.
Aerial View window with multiple viewports
If multiple viewports are contained in current drawing, only the views of current drawing
are displayed in Aerial View window.
You can select Auto viewport option from the right-click menu on the Aerial View window,
and then the views in Aerial View window changes while you toggle among multiple
viewports. The same circumstance happens if you select ―Dynamic Update‖ option.
However when you draw or modify some complex drawings, it's recommended to deselect
dynamic update function, in view of improve the capability of program. In case of the
dynamic update is turned off, you can activate the latest view by clicking at the aerial view
window when you want it displayed in aerial view window.
4.5. Display Multiple Views in Model Space
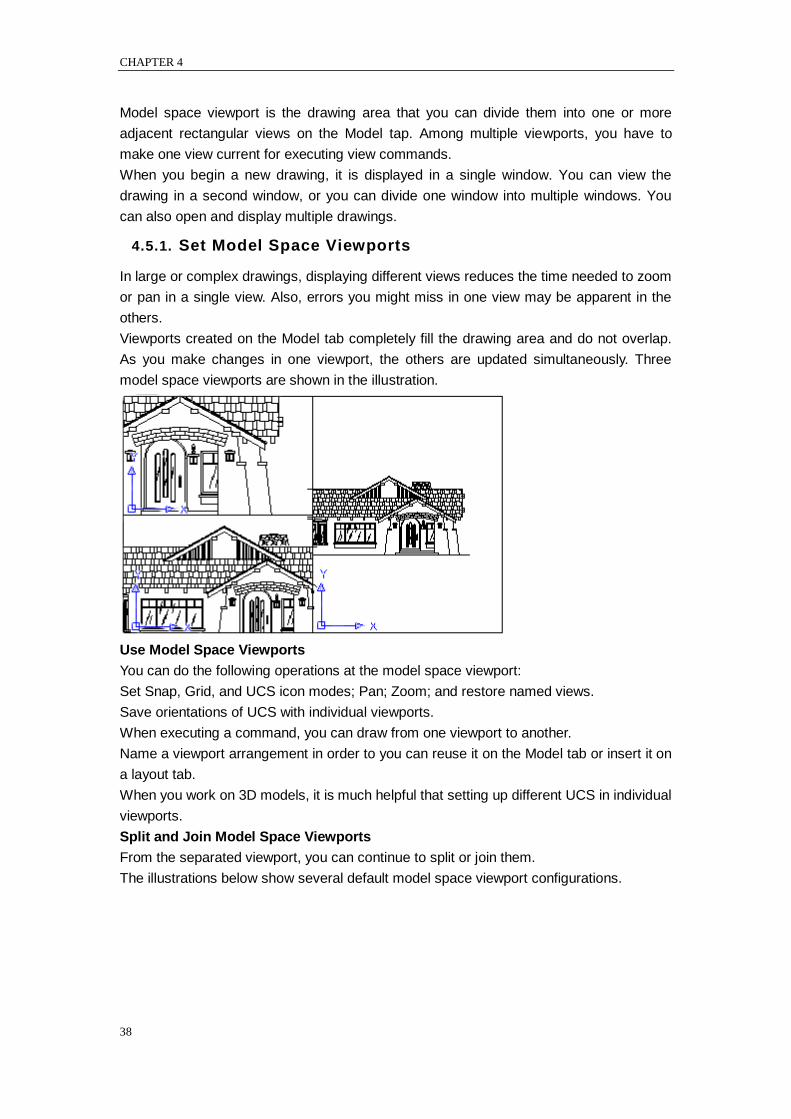
CHAPTER 4
38
Model space viewport is the drawing area that you can divide them into one or more
adjacent rectangular views on the Model tap. Among multiple viewports, you have to
make one view current for executing view commands.
When you begin a new drawing, it is displayed in a single window. You can view the
drawing in a second window, or you can divide one window into multiple windows. You
can also open and display multiple drawings.
4.5.1. Set Model Space Viewports
In large or complex drawings, displaying different views reduces the time needed to zoom
or pan in a single view. Also, errors you might miss in one view may be apparent in the
others.
Viewports created on the Model tab completely fill the drawing area and do not overlap.
As you make changes in one viewport, the others are updated simultaneously. Three
model space viewports are shown in the illustration.
Use Model Space Viewports
You can do the following operations at the model space viewport:
Set Snap, Grid, and UCS icon modes; Pan; Zoom; and restore named views.
Save orientations of UCS with individual viewports.
When executing a command, you can draw from one viewport to another.
Name a viewport arrangement in order to you can reuse it on the Model tab or insert it on
a layout tab.
When you work on 3D models, it is much helpful that setting up different UCS in individual
viewports.
Split and Join Model Space Viewports
From the separated viewport, you can continue to split or join them.
The illustrations below show several default model space viewport configurations.
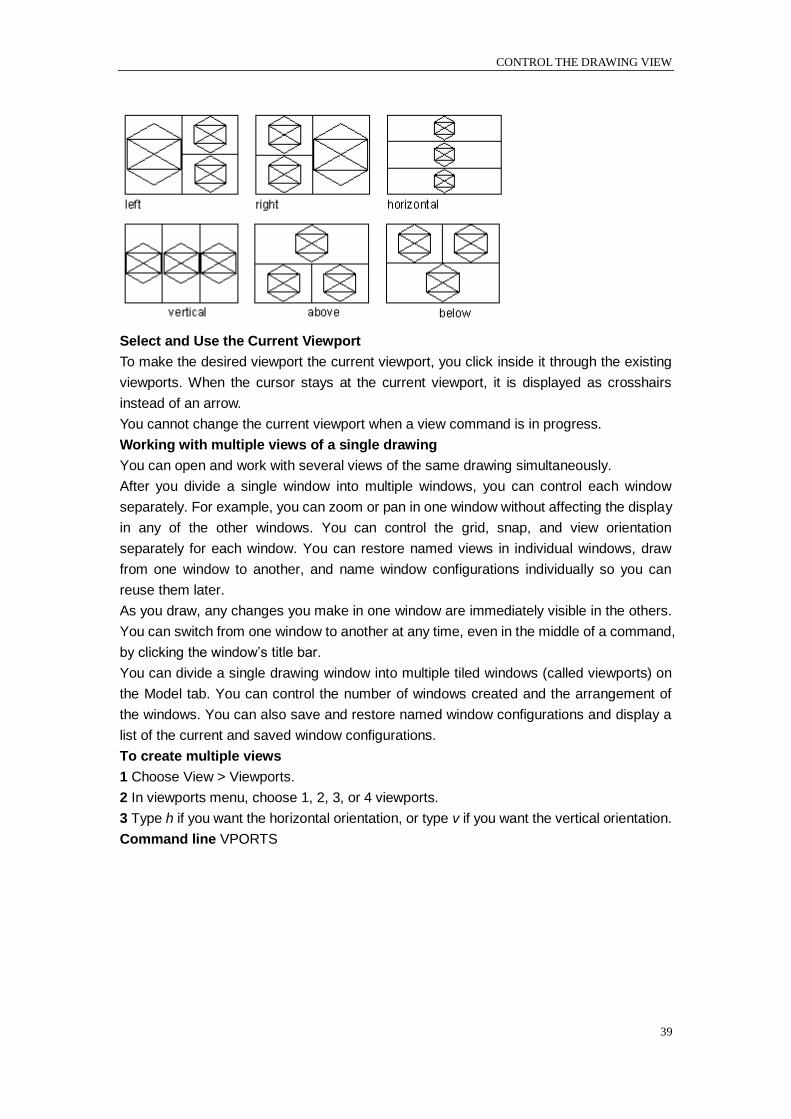
CONTROL THE DRAWING VIEW
39
Select and Use the Current Viewport
To make the desired viewport the current viewport, you click inside it through the existing
viewports. When the cursor stays at the current viewport, it is displayed as crosshairs
instead of an arrow.
You cannot change the current viewport when a view command is in progress.
Working with multiple views of a single drawing
You can open and work with several views of the same drawing simultaneously.
After you divide a single window into multiple windows, you can control each window
separately. For example, you can zoom or pan in one window without affecting the display
in any of the other windows. You can control the grid, snap, and view orientation
separately for each window. You can restore named views in individual windows, draw
from one window to another, and name window configurations individually so you can
reuse them later.
As you draw, any changes you make in one window are immediately visible in the others.
You can switch from one window to another at any time, even in the middle of a command,
by clicking the window‘s title bar.
You can divide a single drawing window into multiple tiled windows (called viewports) on
the Model tab. You can control the number of windows created and the arrangement of
the windows. You can also save and restore named window configurations and display a
list of the current and saved window configurations.
To create multiple views
1 Choose View > Viewports.
2 In viewports menu, choose 1, 2, 3, or 4 viewports.
3 Type h if you want the horizontal orientation, or type v if you want the vertical orientation.
Command line VPORTS
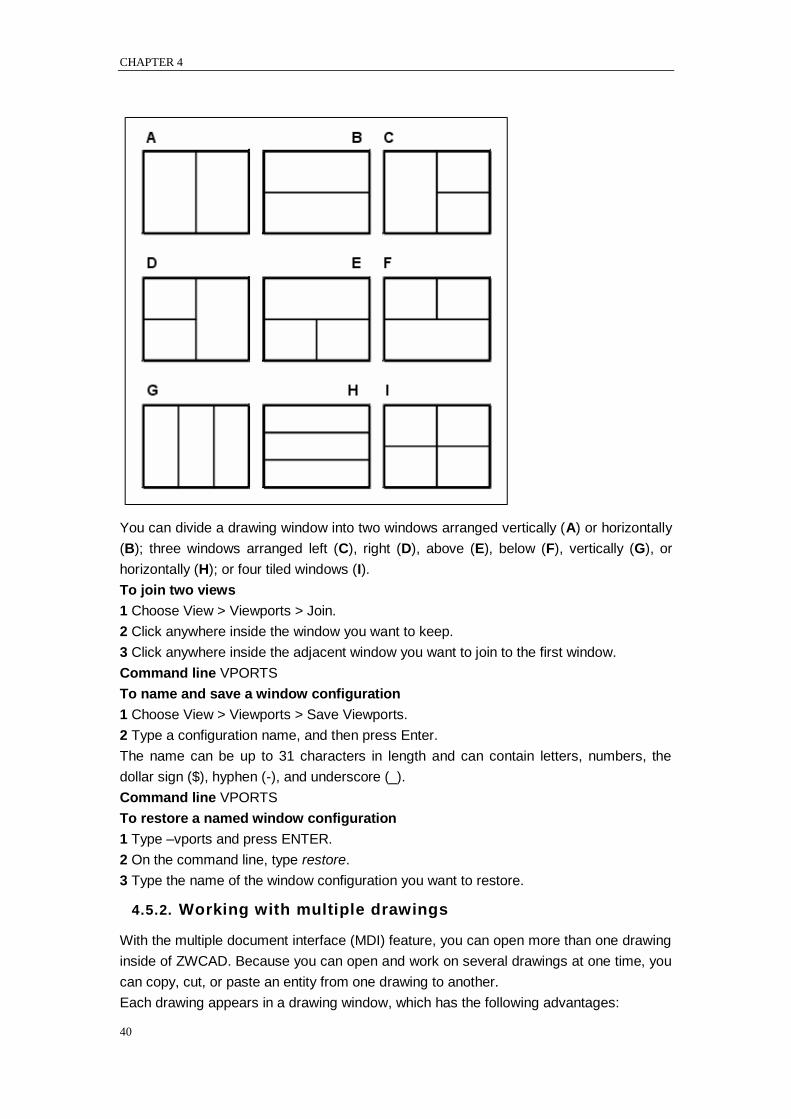
CHAPTER 4
40
You can divide a drawing window into two windows arranged vertically (A) or horizontally
(B); three windows arranged left (C), right (D), above (E), below (F), vertically (G), or
horizontally (H); or four tiled windows (I).
To join two views
1 Choose View > Viewports > Join.
2 Click anywhere inside the window you want to keep.
3 Click anywhere inside the adjacent window you want to join to the first window.
Command line VPORTS
To name and save a window configuration
1 Choose View > Viewports > Save Viewports.
2 Type a configuration name, and then press Enter.
The name can be up to 31 characters in length and can contain letters, numbers, the
dollar sign ($), hyphen (-), and underscore (_).
Command line VPORTS
To restore a named window configuration
1 Type –vports and press ENTER.
2 On the command line, type restore.
3 Type the name of the window configuration you want to restore.
4.5.2. Working with multiple drawings
With the multiple document interface (MDI) feature, you can open more than one drawing
inside of ZWCAD. Because you can open and work on several drawings at one time, you
can copy, cut, or paste an entity from one drawing to another.
Each drawing appears in a drawing window, which has the following advantages:
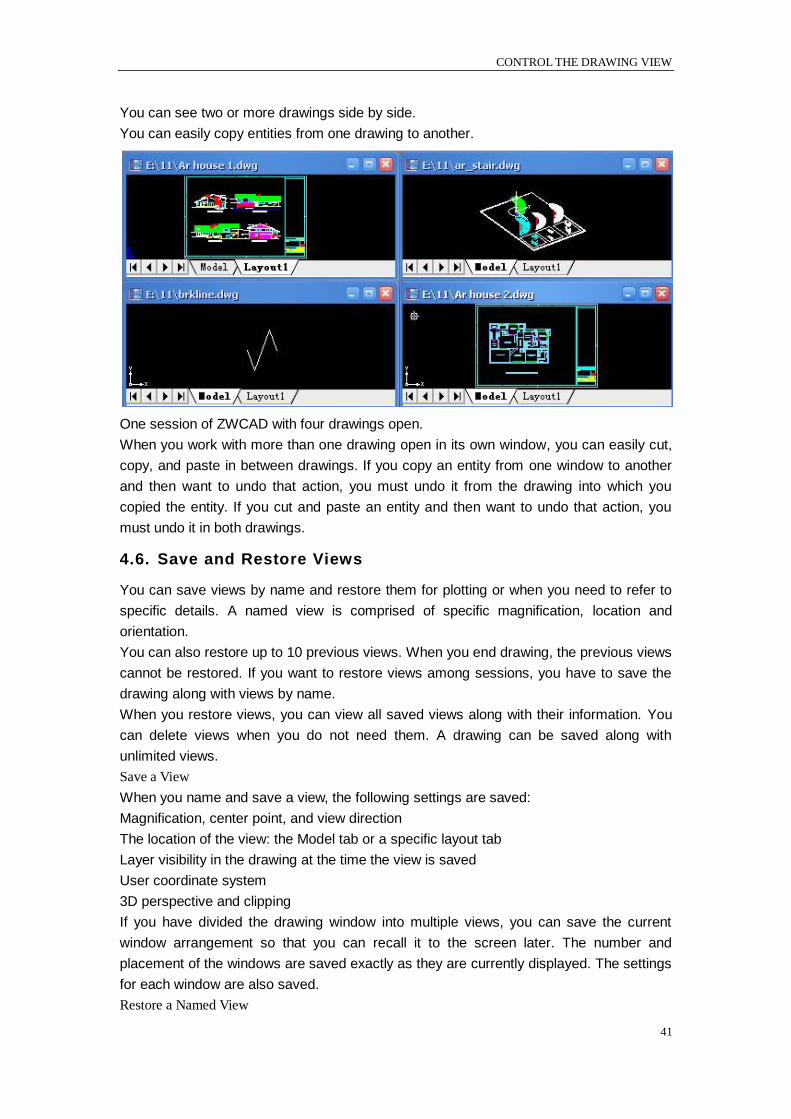
CONTROL THE DRAWING VIEW
41
You can see two or more drawings side by side.
You can easily copy entities from one drawing to another.
One session of ZWCAD with four drawings open.
When you work with more than one drawing open in its own window, you can easily cut,
copy, and paste in between drawings. If you copy an entity from one window to another
and then want to undo that action, you must undo it from the drawing into which you
copied the entity. If you cut and paste an entity and then want to undo that action, you
must undo it in both drawings.
4.6. Save and Restore Views
You can save views by name and restore them for plotting or when you need to refer to
specific details. A named view is comprised of specific magnification, location and
orientation.
You can also restore up to 10 previous views. When you end drawing, the previous views
cannot be restored. If you want to restore views among sessions, you have to save the
drawing along with views by name.
When you restore views, you can view all saved views along with their information. You
can delete views when you do not need them. A drawing can be saved along with
unlimited views.
Save a View
When you name and save a view, the following settings are saved:
Magnification, center point, and view direction
The location of the view: the Model tab or a specific layout tab
Layer visibility in the drawing at the time the view is saved
User coordinate system
3D perspective and clipping
If you have divided the drawing window into multiple views, you can save the current
window arrangement so that you can recall it to the screen later. The number and
placement of the windows are saved exactly as they are currently displayed. The settings
for each window are also saved.
Restore a Named View
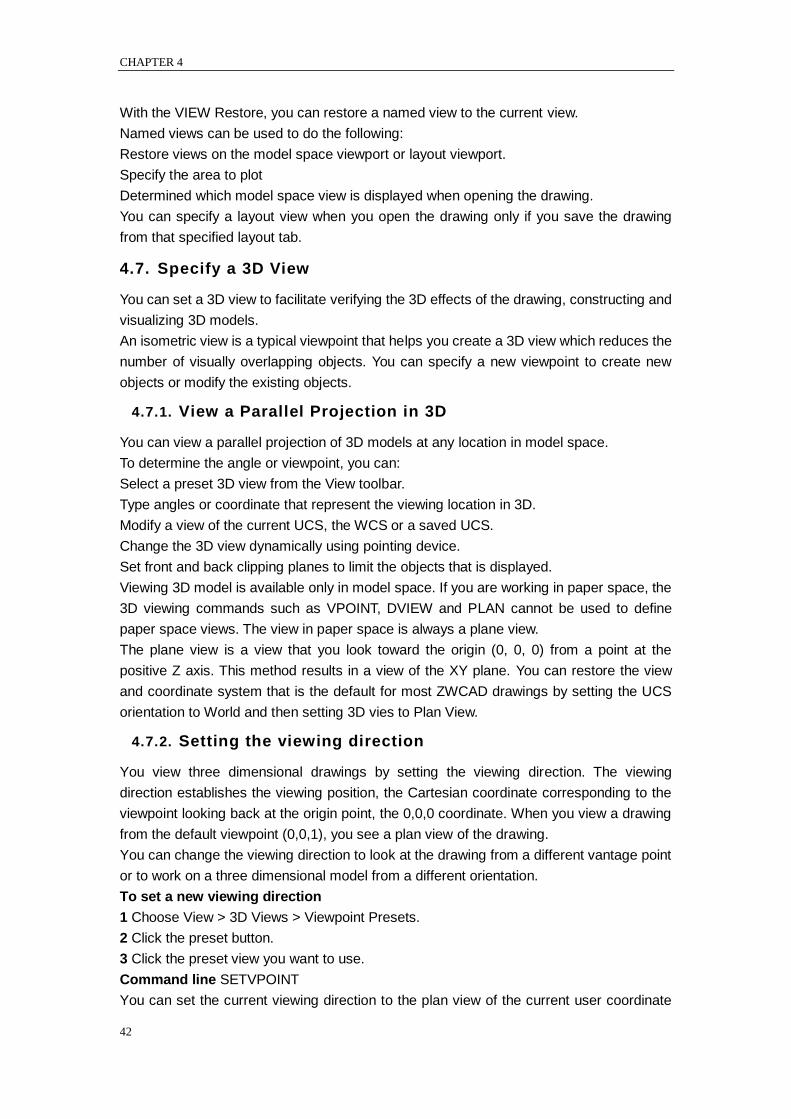
CHAPTER 4
42
With the VIEW Restore, you can restore a named view to the current view.
Named views can be used to do the following:
Restore views on the model space viewport or layout viewport.
Specify the area to plot
Determined which model space view is displayed when opening the drawing.
You can specify a layout view when you open the drawing only if you save the drawing
from that specified layout tab.
4.7. Specify a 3D View
You can set a 3D view to facilitate verifying the 3D effects of the drawing, constructing and
visualizing 3D models.
An isometric view is a typical viewpoint that helps you create a 3D view which reduces the
number of visually overlapping objects. You can specify a new viewpoint to create new
objects or modify the existing objects.
4.7.1. View a Parallel Projection in 3D
You can view a parallel projection of 3D models at any location in model space.
To determine the angle or viewpoint, you can:
Select a preset 3D view from the View toolbar.
Type angles or coordinate that represent the viewing location in 3D.
Modify a view of the current UCS, the WCS or a saved UCS.
Change the 3D view dynamically using pointing device.
Set front and back clipping planes to limit the objects that is displayed.
Viewing 3D model is available only in model space. If you are working in paper space, the
3D viewing commands such as VPOINT, DVIEW and PLAN cannot be used to define
paper space views. The view in paper space is always a plane view.
The plane view is a view that you look toward the origin (0, 0, 0) from a point at the
positive Z axis. This method results in a view of the XY plane. You can restore the view
and coordinate system that is the default for most ZWCAD drawings by setting the UCS
orientation to World and then setting 3D vies to Plan View.
4.7.2. Setting the viewing direction
You view three dimensional drawings by setting the viewing direction. The viewing
direction establishes the viewing position, the Cartesian coordinate corresponding to the
viewpoint looking back at the origin point, the 0,0,0 coordinate. When you view a drawing
from the default viewpoint (0,0,1), you see a plan view of the drawing.
You can change the viewing direction to look at the drawing from a different vantage point
or to work on a three dimensional model from a different orientation.
To set a new viewing direction
1 Choose View > 3D Views > Viewpoint Presets.
2 Click the preset button.
3 Click the preset view you want to use.
Command line SETVPOINT
You can set the current viewing direction to the plan view of the current user coordinate
CONTROL THE DRAWING VIEW
43
system (UCS), a previously saved UCS, or the World Coordinate System (WCS).
To dynamically set a view direction
1 Choose View- 3D Views – Viewpoint Presets.
2 Click the appropriate tools to dynamically change the viewpoint.
3 To complete the command, click OK.
Command line DDVPOINT
You can dynamically rotate the viewpoint within the xy plane and relative to the xy plane,
and you can pan and zoom the drawing. As you change the viewpoint settings, the
drawing display automatically updates.
To display a plan view of the current drawing
1 Choose View > 3D Views > Plan View.
2 It concludes three plan views: Current UCS, World, UCS.
Choose one what you want.
Command line PLAN
4.7.3. Isometric
Choose Preset 3D Views
You can define perspective views of a model to create realistic effects.
Select predefined standard orthographic and isometric views by name or description.
These views represent commonly used options: Top, Bottom, Front, Left, Right, and Back.
In addition, you can set views from isometric options: SW (southwest) Isometric, SE
(southeast) Isometric, NE (northeast) Isometric, and NW (northwest) Isometric.
To understand how the isometric views work, imagine you are looking down at the top of a
box. If you move toward the lower-left corner of the box, you are viewing the box from the
SW Isometric View. If you move toward the upper-left corner of the box, you are viewing it
from NW Isometric View.
Draw 2D Isometric Views
With Isometric Snap, you can create 2D objects that appear to be 3D solids.
By setting Isometric Snap on the Draft Settings dialog box and turning on Snap and Grid,
you can easily align objects along one of three isometric planes. However, although the
isometric drawing looks like 3D, it is actually a 2D representation. Therefore, you cannot
extract distance and areas, display objects from different viewports, or delete hidden lines
automatically.
Set Isometric Grid and Snap
By aligning along three major axes, isometric drawing simulates a 3D drawing from
specified viewpoint.
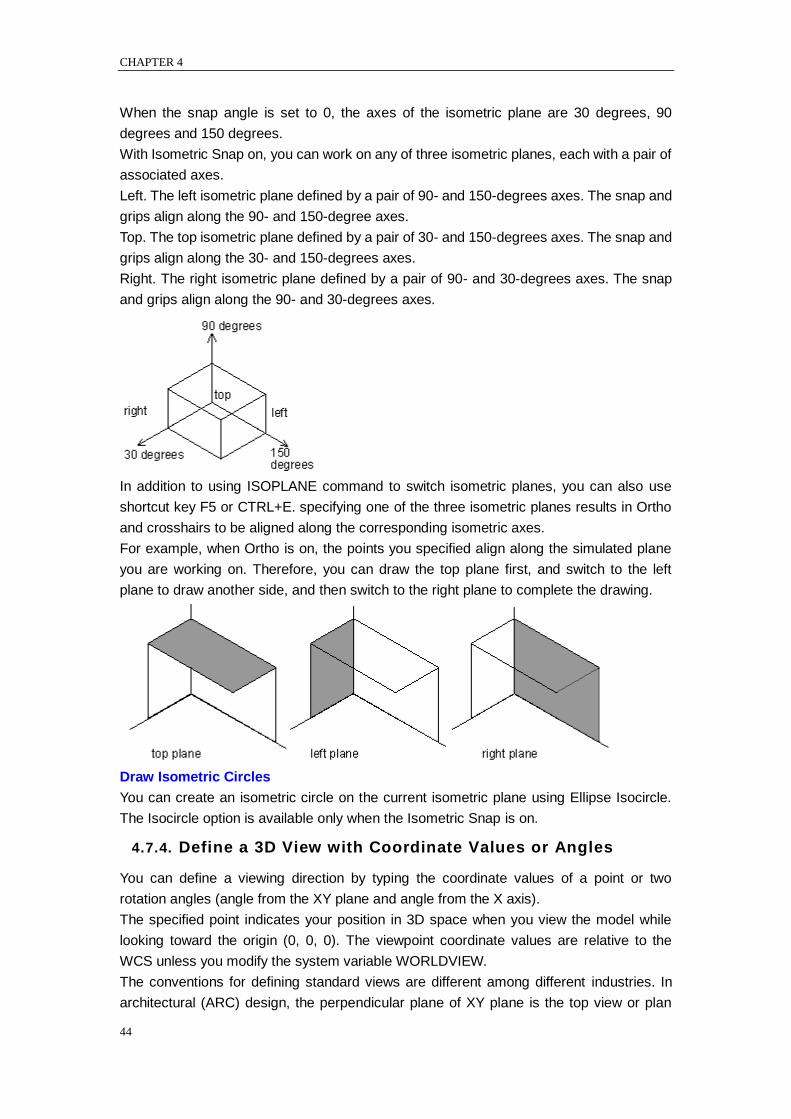
CHAPTER 4
44
When the snap angle is set to 0, the axes of the isometric plane are 30 degrees, 90
degrees and 150 degrees.
With Isometric Snap on, you can work on any of three isometric planes, each with a pair of
associated axes.
Left. The left isometric plane defined by a pair of 90- and 150-degrees axes. The snap and
grips align along the 90- and 150-degree axes.
Top. The top isometric plane defined by a pair of 30- and 150-degrees axes. The snap and
grips align along the 30- and 150-degrees axes.
Right. The right isometric plane defined by a pair of 90- and 30-degrees axes. The snap
and grips align along the 90- and 30-degrees axes.
In addition to using ISOPLANE command to switch isometric planes, you can also use
shortcut key F5 or CTRL+E. specifying one of the three isometric planes results in Ortho
and crosshairs to be aligned along the corresponding isometric axes.
For example, when Ortho is on, the points you specified align along the simulated plane
you are working on. Therefore, you can draw the top plane first, and switch to the left
plane to draw another side, and then switch to the right plane to complete the drawing.
Draw Isometric Circles
You can create an isometric circle on the current isometric plane using Ellipse Isocircle.
The Isocircle option is available only when the Isometric Snap is on.
4.7.4. Define a 3D View with Coordinate Values or Angles
You can define a viewing direction by typing the coordinate values of a point or two
rotation angles (angle from the XY plane and angle from the X axis).
The specified point indicates your position in 3D space when you view the model while
looking toward the origin (0, 0, 0). The viewpoint coordinate values are relative to the
WCS unless you modify the system variable WORLDVIEW.
The conventions for defining standard views are different among different industries. In
architectural (ARC) design, the perpendicular plane of XY plane is the top view or plan
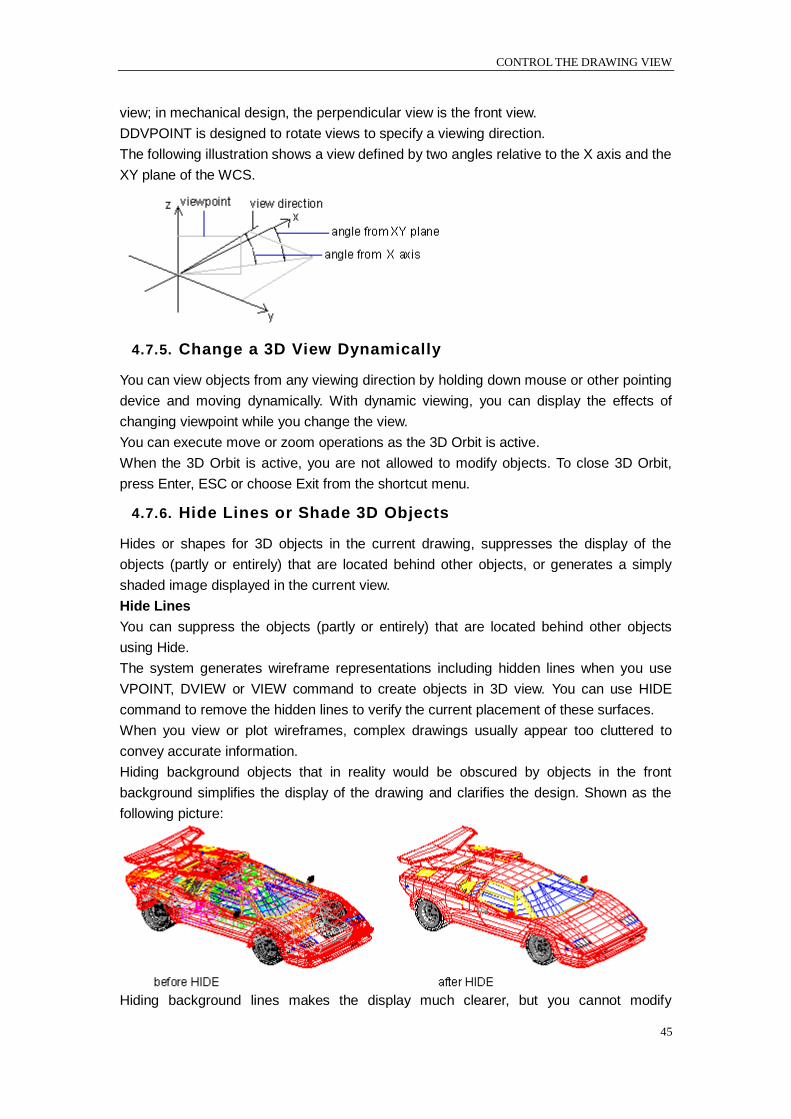
CONTROL THE DRAWING VIEW
45
view; in mechanical design, the perpendicular view is the front view.
DDVPOINT is designed to rotate views to specify a viewing direction.
The following illustration shows a view defined by two angles relative to the X axis and the
XY plane of the WCS.
4.7.5. Change a 3D View Dynamically
You can view objects from any viewing direction by holding down mouse or other pointing
device and moving dynamically. With dynamic viewing, you can display the effects of
changing viewpoint while you change the view.
You can execute move or zoom operations as the 3D Orbit is active.
When the 3D Orbit is active, you are not allowed to modify objects. To close 3D Orbit,
press Enter, ESC or choose Exit from the shortcut menu.
4.7.6. Hide Lines or Shade 3D Objects
Hides or shapes for 3D objects in the current drawing, suppresses the display of the
objects (partly or entirely) that are located behind other objects, or generates a simply
shaded image displayed in the current view.
Hide Lines
You can suppress the objects (partly or entirely) that are located behind other objects
using Hide.
The system generates wireframe representations including hidden lines when you use
VPOINT, DVIEW or VIEW command to create objects in 3D view. You can use HIDE
command to remove the hidden lines to verify the current placement of these surfaces.
When you view or plot wireframes, complex drawings usually appear too cluttered to
convey accurate information.
Hiding background objects that in reality would be obscured by objects in the front
background simplifies the display of the drawing and clarifies the design. Shown as the
following picture:
Hiding background lines makes the display much clearer, but you cannot modify
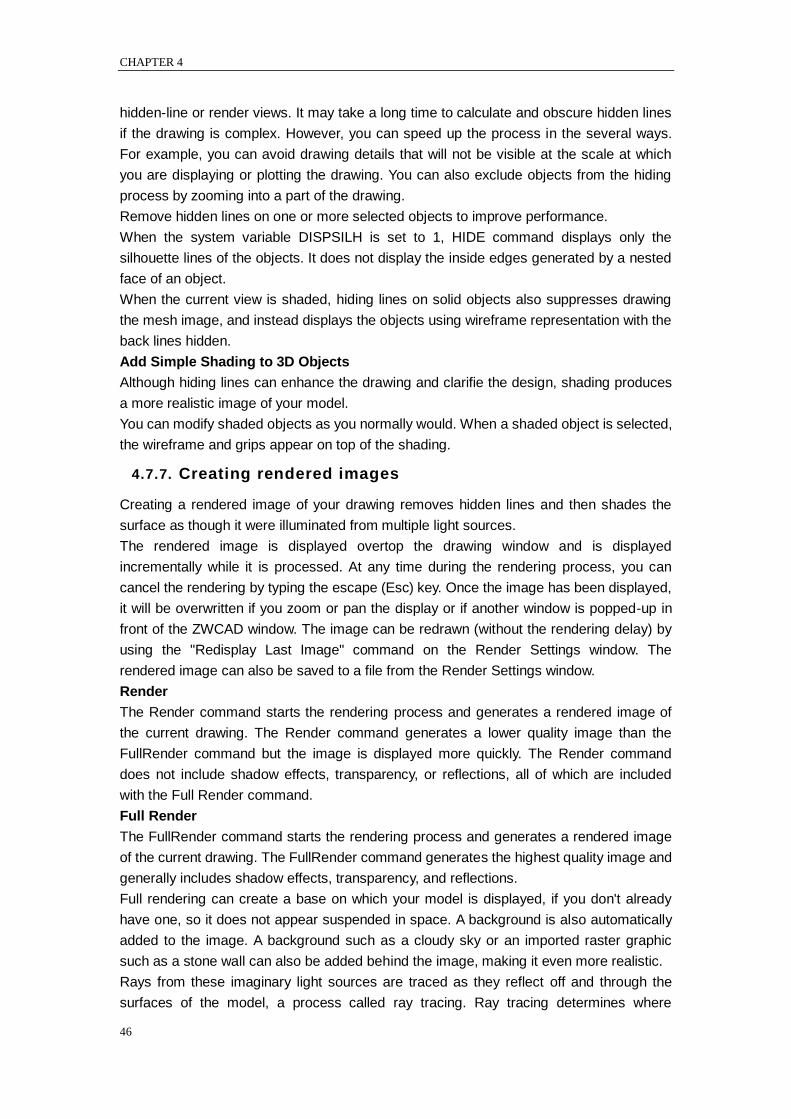
CHAPTER 4
46
hidden-line or render views. It may take a long time to calculate and obscure hidden lines
if the drawing is complex. However, you can speed up the process in the several ways.
For example, you can avoid drawing details that will not be visible at the scale at which
you are displaying or plotting the drawing. You can also exclude objects from the hiding
process by zooming into a part of the drawing.
Remove hidden lines on one or more selected objects to improve performance.
When the system variable DISPSILH is set to 1, HIDE command displays only the
silhouette lines of the objects. It does not display the inside edges generated by a nested
face of an object.
When the current view is shaded, hiding lines on solid objects also suppresses drawing
the mesh image, and instead displays the objects using wireframe representation with the
back lines hidden.
Add Simple Shading to 3D Objects
Although hiding lines can enhance the drawing and clarifie the design, shading produces
a more realistic image of your model.
You can modify shaded objects as you normally would. When a shaded object is selected,
the wireframe and grips appear on top of the shading.
4.7.7. Creating rendered images
Creating a rendered image of your drawing removes hidden lines and then shades the
surface as though it were illuminated from multiple light sources.
The rendered image is displayed overtop the drawing window and is displayed
incrementally while it is processed. At any time during the rendering process, you can
cancel the rendering by typing the escape (Esc) key. Once the image has been displayed,
it will be overwritten if you zoom or pan the display or if another window is popped-up in
front of the ZWCAD window. The image can be redrawn (without the rendering delay) by
using the "Redisplay Last Image" command on the Render Settings window. The
rendered image can also be saved to a file from the Render Settings window.
Render
The Render command starts the rendering process and generates a rendered image of
the current drawing. The Render command generates a lower quality image than the
FullRender command but the image is displayed more quickly. The Render command
does not include shadow effects, transparency, or reflections, all of which are included
with the Full Render command.
Full Render
The FullRender command starts the rendering process and generates a rendered image
of the current drawing. The FullRender command generates the highest quality image and
generally includes shadow effects, transparency, and reflections.
Full rendering can create a base on which your model is displayed, if you don't already
have one, so it does not appear suspended in space. A background is also automatically
added to the image. A background such as a cloudy sky or an imported raster graphic
such as a stone wall can also be added behind the image, making it even more realistic.
Rays from these imaginary light sources are traced as they reflect off and through the
surfaces of the model, a process called ray tracing. Ray tracing determines where
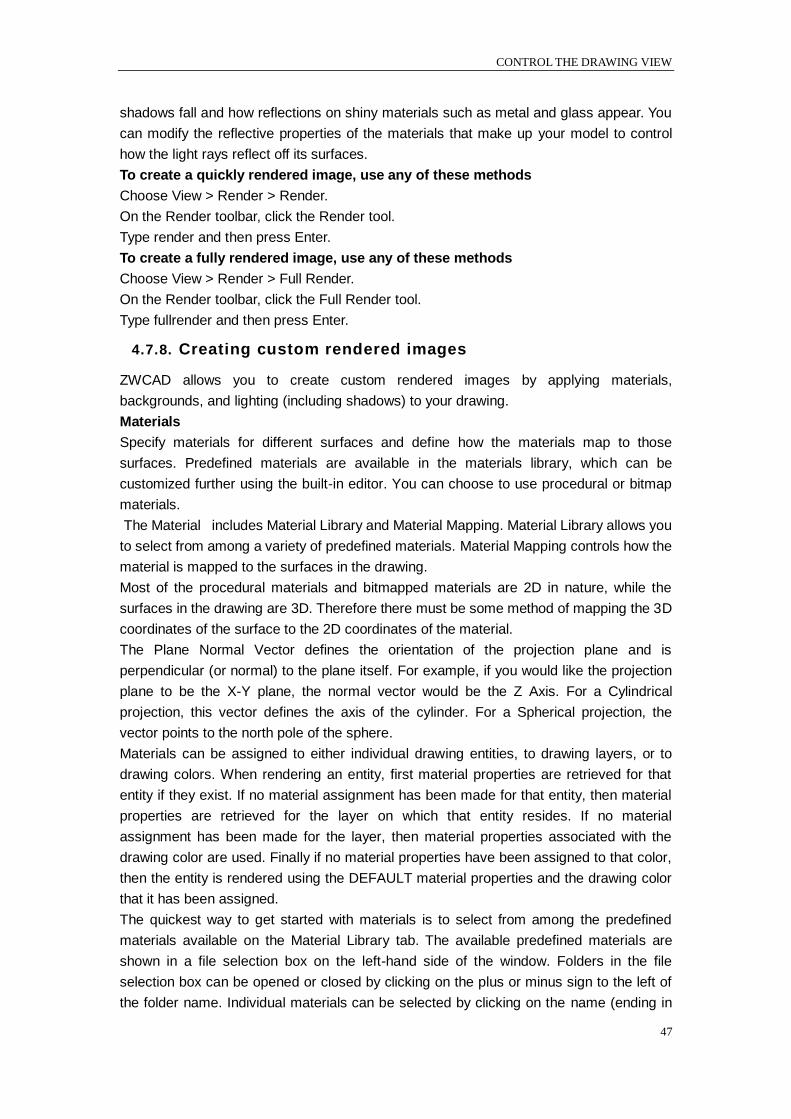
CONTROL THE DRAWING VIEW
47
shadows fall and how reflections on shiny materials such as metal and glass appear. You
can modify the reflective properties of the materials that make up your model to control
how the light rays reflect off its surfaces.
To create a quickly rendered image, use any of these methods
Choose View > Render > Render.
On the Render toolbar, click the Render tool.
Type render and then press Enter.
To create a fully rendered image, use any of these methods
Choose View > Render > Full Render.
On the Render toolbar, click the Full Render tool.
Type fullrender and then press Enter.
4.7.8. Creating custom rendered images
ZWCAD allows you to create custom rendered images by applying materials,
backgrounds, and lighting (including shadows) to your drawing.
Materials
Specify materials for different surfaces and define how the materials map to those
surfaces. Predefined materials are available in the materials library, which can be
customized further using the built-in editor. You can choose to use procedural or bitmap
materials.
The Material includes Material Library and Material Mapping. Material Library allows you
to select from among a variety of predefined materials. Material Mapping controls how the
material is mapped to the surfaces in the drawing.
Most of the procedural materials and bitmapped materials are 2D in nature, while the
surfaces in the drawing are 3D. Therefore there must be some method of mapping the 3D
coordinates of the surface to the 2D coordinates of the material.
The Plane Normal Vector defines the orientation of the projection plane and is
perpendicular (or normal) to the plane itself. For example, if you would like the projection
plane to be the X-Y plane, the normal vector would be the Z Axis. For a Cylindrical
projection, this vector defines the axis of the cylinder. For a Spherical projection, the
vector points to the north pole of the sphere.
Materials can be assigned to either individual drawing entities, to drawing layers, or to
drawing colors. When rendering an entity, first material properties are retrieved for that
entity if they exist. If no material assignment has been made for that entity, then material
properties are retrieved for the layer on which that entity resides. If no material
assignment has been made for the layer, then material properties associated with the
drawing color are used. Finally if no material properties have been assigned to that color,
then the entity is rendered using the DEFAULT material properties and the drawing color
that it has been assigned.
The quickest way to get started with materials is to select from among the predefined
materials available on the Material Library tab. The available predefined materials are
shown in a file selection box on the left-hand side of the window. Folders in the file
selection box can be opened or closed by clicking on the plus or minus sign to the left of
the folder name. Individual materials can be selected by clicking on the name (ending in
CHAPTER 4
48
".tex"). Once you click on the material name, a preview image will be shown in the
right-hand-side area, and the properties for that material will be loaded. You can then click
on the "OK" button to accept the properties, or you can click on the Material Mapping tab
to adjust the way the material is mapped to the surface.
Backgrounds
Specify the background or backdrop for a rendered image. Several predefined
backgrounds are available. By default, no background is used and it appears black. The
background is an infinite, planar surface and reflects off of any reflective surfaces in your
model. The background is not affected by lighting however, so no shadows or highlights
are seen on the background.
You can select or edit a variety of predefined materials from the materials library for the
background. You also can specify how the material is mapped to the surface in the
Materials Mapping dialog box.
Lighting
Specify the placement of lights, light color, and light intensity to determine how your
drawing or scene is lit, including shadows and reflections in the scene. Lights can be
placed either outside the field of view or inside to illuminate different areas of the scene.
Three types of lights are available to use in your drawing, Ambient light, Point lights, and
Distant lights.
Ambient light: An Ambient light illuminates the entire scene evenly (depending on the
Ambient component of the Material finish). It does not cast shadows or change with
viewing angle.
Point light: A Point light represents light emitting from a single point in the drawing.
Shadows will be cast by surfaces in the drawing and you will see highlights where the light
reflects off of the surfaces. Point lights can also have a size or diameter to them so that
they cast soft shadows.
Distant light: A Distant light represents a light from a large distance away from the
surfaces in the drawing (e.g. the sun). All of the light rays are essentially parallel to each
other so the shadows cast by the light have sharp edges.
To apply materials, backgrounds, and lighting
Choose View > Render, and then choose Materials, Background, or Light.
On the Render toolbar, click the Materials tool , Background , or Lights tool.
Type materials, backgrounds, or lighting and then press Enter.
4.7.9. Printing a rendered image
You cannot print a rendered image directly to a printer. Instead, you must first save the
drawing to a different format — either a bitmap (.bmp), JPEG (.jpg), TIFF (.tif), TrueVision
TGA (.tga), or Portable Network Graphic (.png). After you save a rendered image, you can
print it from another graphics program.
Once you have generated a rendered image that you would like to save, you can use the
"Save Last Image" button in the Render Settings dialog box to save the image to a file.
Images can be saved in BMP, JPEG, TIFF, TGA, or PNG format. The saved image will be
in 24 bit, full-color format at the same resolution as rendered on the screen. You also save
the render image by click the Render in the Render to File tap from the Render Settings d

CONTROL THE DRAWING VIEW
49
ialog box. The Render to File tab will allow you to produce a rendered image directly to a
file on disk rather than to the ZWCAD screen.
To save a rendered image of your drawing
Create a rendered image of the drawing.
1 Do one of the following:
Choose View > Render > Preferences.
On the Render toolbar, click the Render Preferences tool.
2 On the Rendering tab, click Save Last Image.
3 Enter a file name and path.
4 In Save As Type, choose the file format.
5 Click Save.
CHAPTER 5
50
5. Precision Tools and the Properties
of drawing
5.1. Specify Units, Angles and Scale
Specify the units of measurement you want to use, their format, and other conventions.
Determine Units of Measurement
When you start drawing, you specify the units of measurement, their formats as well as
the number of decimal fraction.
Set the Units Format
You can set the display format of the unit. These formats include scientific, decimal,
engineering, architectural and fractional notation. To enter architectural feet and inches
format, you can indicate feet using the prime symbol (‗), for example, 72‘3. You do not
need to specify inches by entering quotation marks (―).
You can set the unit type and precision in the Quick Setup wizard, the Advanced Setup
wizard, or the Units Control dialog box. These settings control how your coordinate, offset,
and distance entries are interpreted, and how coordinates and distances are displayed.
The input format of three-dimension coordinates is the same as the input format of the
two-dimension coordinates: scientific, decimal, engineering, architectural and fractional
notation.
The unit format for creating and listing objects, measuring distance and displaying
coordinate locations is different from the dimension units setting used in creating
dimension values.
With ZWCAD, you typically draw at full size (1:1 scale), and then set a scale factor when
you print or plot your drawing. Before you begin drawing, however, you need to determine
the relationship between drawing units and real world units.
For example, you can decide whether one linear drawing unit represents an inch, a foot, a
meter, or a mile. In addition, you can specify the way the program measures angles. For
both linear and angular units, you can also set the degree of display precision, such as the
number of decimal places or smallest denominator used when displaying fractions. The
precision settings affect only the display of distances, angles, and coordinates. ZWCAD
always stores distances, angles, and coordinates using floating point accuracy.
Open drawing units dialog
Choose Format > Units.
Command line UNITS
Convert Drawing Units
When you create a new drawing in one system of measurement (imperial or metric) and
then change to the other system, use SCALE to scale the model geometry by the
appropriate conversion factor to obtain correct distances and dimensions. The conversion
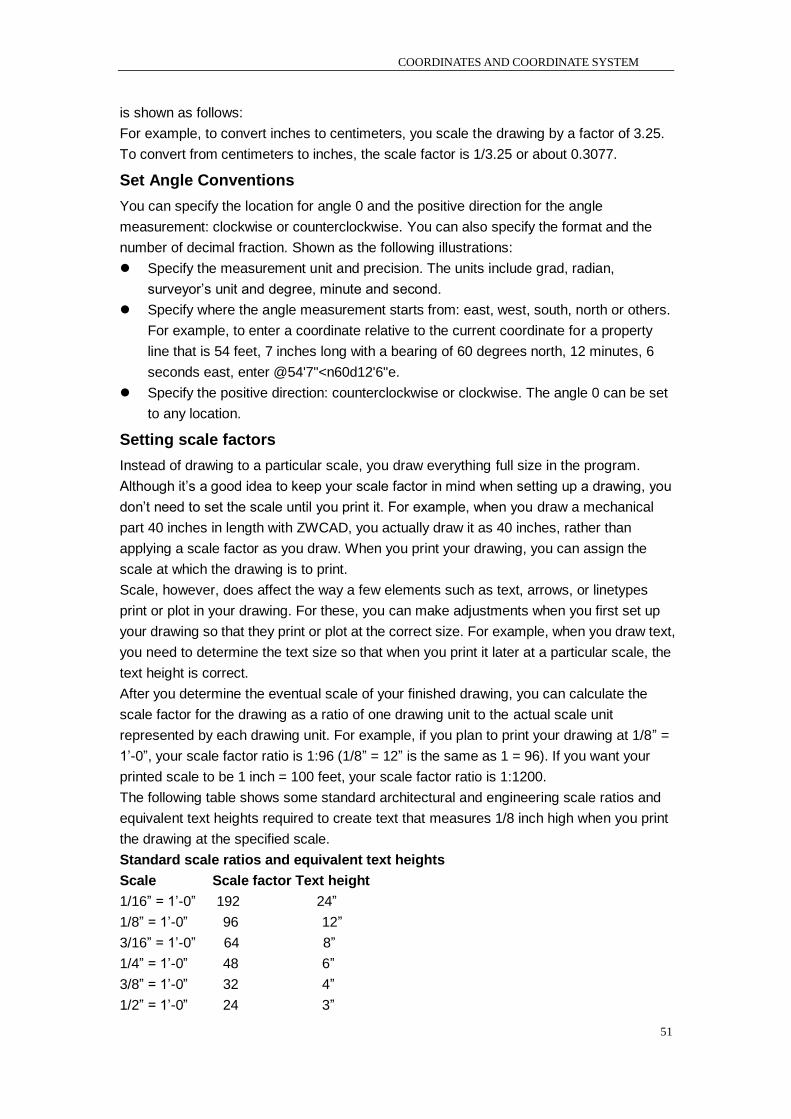
COORDINATES AND COORDINATE SYSTEM
51
is shown as follows:
For example, to convert inches to centimeters, you scale the drawing by a factor of 3.25.
To convert from centimeters to inches, the scale factor is 1/3.25 or about 0.3077.
Set Angle Conventions
You can specify the location for angle 0 and the positive direction for the angle
measurement: clockwise or counterclockwise. You can also specify the format and the
number of decimal fraction. Shown as the following illustrations:
Specify the measurement unit and precision. The units include grad, radian,
surveyor‘s unit and degree, minute and second.
Specify where the angle measurement starts from: east, west, south, north or others.
For example, to enter a coordinate relative to the current coordinate for a property
line that is 54 feet, 7 inches long with a bearing of 60 degrees north, 12 minutes, 6
seconds east, enter @54'7"<n60d12'6"e.
Specify the positive direction: counterclockwise or clockwise. The angle 0 can be set
to any location.
Setting scale factors
Instead of drawing to a particular scale, you draw everything full size in the program.
Although it‘s a good idea to keep your scale factor in mind when setting up a drawing, you
don‘t need to set the scale until you print it. For example, when you draw a mechanical
part 40 inches in length with ZWCAD, you actually draw it as 40 inches, rather than
applying a scale factor as you draw. When you print your drawing, you can assign the
scale at which the drawing is to print.
Scale, however, does affect the way a few elements such as text, arrows, or linetypes
print or plot in your drawing. For these, you can make adjustments when you first set up
your drawing so that they print or plot at the correct size. For example, when you draw text,
you need to determine the text size so that when you print it later at a particular scale, the
text height is correct.
After you determine the eventual scale of your finished drawing, you can calculate the
scale factor for the drawing as a ratio of one drawing unit to the actual scale unit
represented by each drawing unit. For example, if you plan to print your drawing at 1/8‖ =
1‘-0‖, your scale factor ratio is 1:96 (1/8‖ = 12‖ is the same as 1 = 96). If you want your
printed scale to be 1 inch = 100 feet, your scale factor ratio is 1:1200.
The following table shows some standard architectural and engineering scale ratios and
equivalent text heights required to create text that measures 1/8 inch high when you print
the drawing at the specified scale.
Standard scale ratios and equivalent text heights
Scale Scale factor Text height
1/16‖ = 1‘-0‖ 192 24‖
1/8‖ = 1‘-0‖ 96 12‖
3/16‖ = 1‘-0‖ 64 8‖
1/4‖ = 1‘-0‖ 48 6‖
3/8‖ = 1‘-0‖ 32 4‖
1/2‖ = 1‘-0‖ 24 3‖
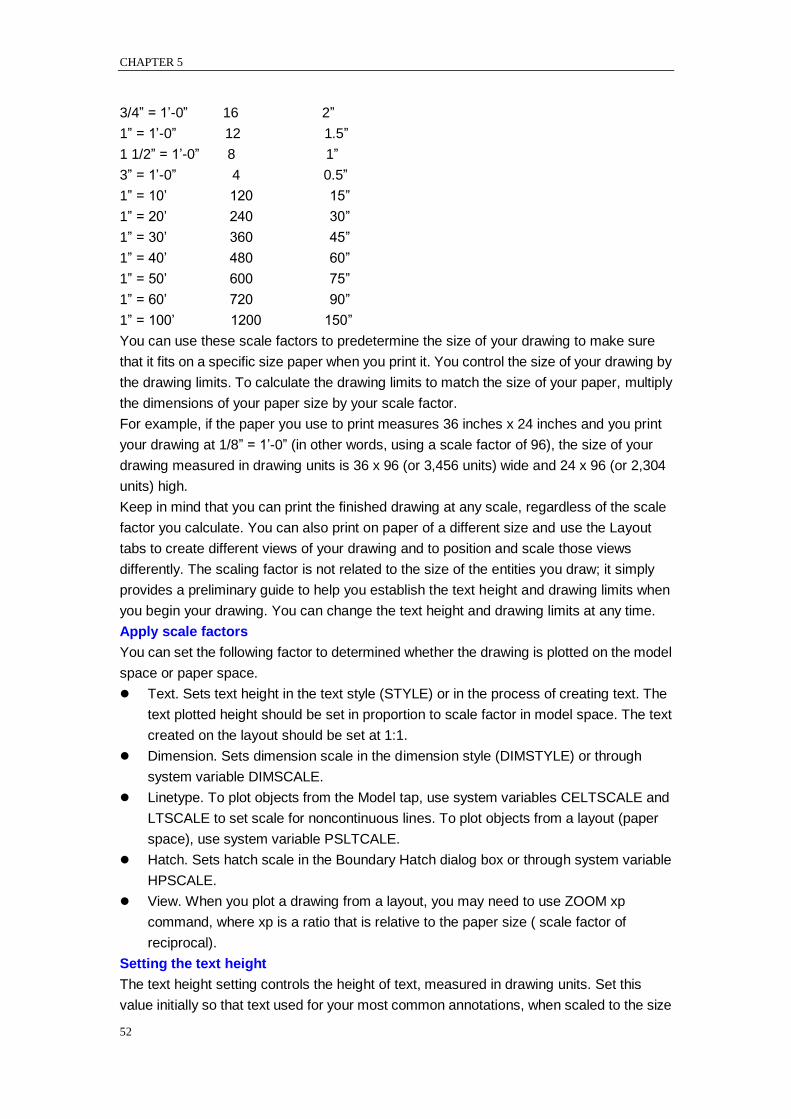
CHAPTER 5
52
3/4‖ = 1‘-0‖ 16 2‖
1‖ = 1‘-0‖ 12 1.5‖
1 1/2‖ = 1‘-0‖ 8 1‖
3‖ = 1‘-0‖ 4 0.5‖
1‖ = 10‘ 120 15‖
1‖ = 20‘ 240 30‖
1‖ = 30‘ 360 45‖
1‖ = 40‘ 480 60‖
1‖ = 50‘ 600 75‖
1‖ = 60‘ 720 90‖
1‖ = 100‘ 1200 150‖
You can use these scale factors to predetermine the size of your drawing to make sure
that it fits on a specific size paper when you print it. You control the size of your drawing by
the drawing limits. To calculate the drawing limits to match the size of your paper, multiply
the dimensions of your paper size by your scale factor.
For example, if the paper you use to print measures 36 inches x 24 inches and you print
your drawing at 1/8‖ = 1‘-0‖ (in other words, using a scale factor of 96), the size of your
drawing measured in drawing units is 36 x 96 (or 3,456 units) wide and 24 x 96 (or 2,304
units) high.
Keep in mind that you can print the finished drawing at any scale, regardless of the scale
factor you calculate. You can also print on paper of a different size and use the Layout
tabs to create different views of your drawing and to position and scale those views
differently. The scaling factor is not related to the size of the entities you draw; it simply
provides a preliminary guide to help you establish the text height and drawing limits when
you begin your drawing. You can change the text height and drawing limits at any time.
Apply scale factors
You can set the following factor to determined whether the drawing is plotted on the model
space or paper space.
Text. Sets text height in the text style (STYLE) or in the process of creating text. The
text plotted height should be set in proportion to scale factor in model space. The text
created on the layout should be set at 1:1.
Dimension. Sets dimension scale in the dimension style (DIMSTYLE) or through
system variable DIMSCALE.
Linetype. To plot objects from the Model tap, use system variables CELTSCALE and
LTSCALE to set scale for noncontinuous lines. To plot objects from a layout (paper
space), use system variable PSLTCALE.
Hatch. Sets hatch scale in the Boundary Hatch dialog box or through system variable
HPSCALE.
View. When you plot a drawing from a layout, you may need to use ZOOM xp
command, where xp is a ratio that is relative to the paper size ( scale factor of
reciprocal).
Setting the text height
The text height setting controls the height of text, measured in drawing units. Set this
value initially so that text used for your most common annotations, when scaled to the size
COORDINATES AND COORDINATE SYSTEM
53
at which you will print a drawing, measures 1/8-inch high on the printed drawing.
For example, if you plan to print your drawing at 1/8‖ = 1‘-0‖ and you want your text to be
1/8-inch high in the final drawing, create that text 1 foot high (in your realworld drawing
units) so that when you print it, it appears 1/8-inch high on the paper.
You must create text 4 feet high that you want to print 1/2-inch high.
To set the text height
1 Choose Format > Text Style.
2 Type a value in the Text Height text under Text Measurements.
3 Press OK to save the current settings.
NOTE The default text height applies only if the current text style height is 0.0. Otherwise,
the text height for the current style takes precedence.
5.2. Drawing Limits
You can specify the drawing limits that form an invisible boundary around your drawing.
You can use the drawing limits to make sure that you do not create a drawing larger than
can fit on a specific sheet of paper when printed at a specific scale.
For example, if you plan to print your drawing at 1/8‖ = 1‘-0‖ (in other words, using a scale
factor of 96) on a sheet of paper measuring 36 inches x 24 inches, you can set drawing
limits to 3,264 units wide (that is, 34 x 96) and 2,112 units high (22 x 96), which allows a
1-inch margin around the edges of the printed image.
To set the drawing limits
1 Choose Fomat > Drawing Limits.
2 Specify the x-coordinate and y-coordinate of the upper right drawing limit and the lower
left drawing limit.You can also click Select to specify the drawing limits by selecting points
in the drawing.
Command line LIMITS
5.3. Grid and Grid Snap
The grid is a rectangular pattern comprised of dots that extends over the area you specify
as the grid limits. Displaying grids and using grids snap improve the performance of
regenerating.
Using the grid is like placing a sheet of coordinate paper under a drawing. The grid is not
plotted. If you scale drawing, you may need to adjust grid spacing to be more appropriate
for the new magnification.
When you turn Snap mode on, the cursor adheres or snaps to the invisible grids.
Therefore, you can specify precise points with the arrow keys or mouse or other pointing
device.
Grid and snap settings are effective tools to use in your drawing to ensure accuracy.
Although many users find it convenient to match grid points to snap settings, they are
independent of each other and should not be confused. Grid points are for visual
reference only; they do not affect your drawing and they do not print. Snap points are, by
themselves, not visible; however, when set, they constrain the creation of new entities.
In addition, the cursor can be restricted to move orthogonally only or guides can display
on the screen automatically at specified polar angle increments.
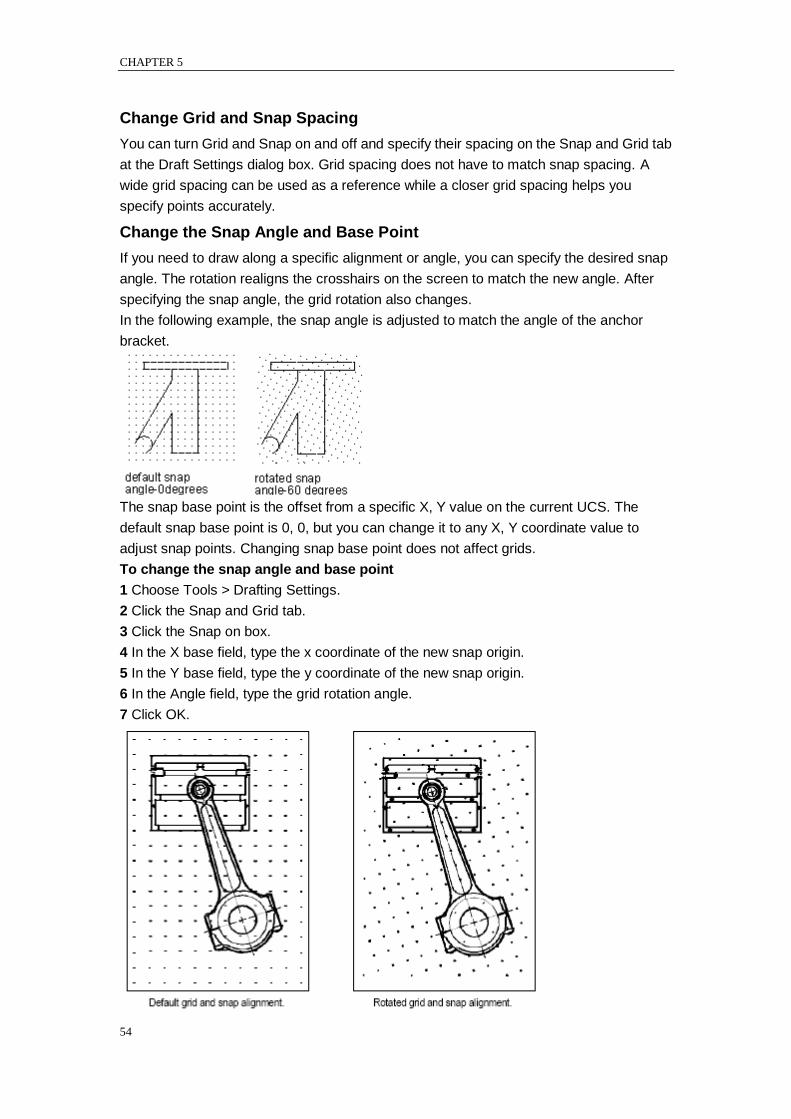
CHAPTER 5
54
Change Grid and Snap Spacing
You can turn Grid and Snap on and off and specify their spacing on the Snap and Grid tab
at the Draft Settings dialog box. Grid spacing does not have to match snap spacing. A
wide grid spacing can be used as a reference while a closer grid spacing helps you
specify points accurately.
Change the Snap Angle and Base Point
If you need to draw along a specific alignment or angle, you can specify the desired snap
angle. The rotation realigns the crosshairs on the screen to match the new angle. After
specifying the snap angle, the grid rotation also changes.
In the following example, the snap angle is adjusted to match the angle of the anchor
bracket.
The snap base point is the offset from a specific X, Y value on the current UCS. The
default snap base point is 0, 0, but you can change it to any X, Y coordinate value to
adjust snap points. Changing snap base point does not affect grids.
To change the snap angle and base point
1 Choose Tools > Drafting Settings.
2 Click the Snap and Grid tab.
3 Click the Snap on box.
4 In the X base field, type the x coordinate of the new snap origin.
5 In the Y base field, type the y coordinate of the new snap origin.
6 In the Angle field, type the grid rotation angle.
7 Click OK.
COORDINATES AND COORDINATE SYSTEM
55
Setting a reference grid
A reference grid displays as a pattern of regularly spaced dots. You can turn the display
on and off, and you can specify how far apart the dots are spaced.
The reference grid extends only to the limits of the drawing, helping you to visualize the
boundary of your drawing and to align entities and visualize distances between entities.
You can turn the grid on and off as needed. You can also change the spacing of the grid
at any time.
To turn the grid on and set the grid spacing
1 Choose Tools > Drafting Settings.
2 Click the Snap and Grid tab.
3 Click the Grid on box.
4 Under Grid tab, input value in the Grid X Spacing field and Grid Y Spacing field
separately.
5 Click OK.
Status bar right-click on the Snap tab on Status bar, choose settings
TIP To toggle the grid display on and off at any time, click on the GRID button on the
status bar, or press F7.
Setting snap spacing
Another way to ensure drawing accuracy is to turn on and set snap spacing. When snap is
turned on, the program restricts the selection points to predetermined snap intervals.
Although it is often helpful for snapping by means of matching the snap spacing with grid
spacing, the setting is not required.
To turn snap settings on and set snap spacing
1 Choose Tools > Drafting Settings.
2 Click the Snap and Grid tab.
3 Click the Snap on box.
4 Under Snap, in the Snap X Spacing field, choose the horizontal Snap spacing.
5 Under Snap, in the Snap Y Spacing field, choose the vertical Snap spacing.
6 Click OK.
Status bar right-click on the Snap tab on Status bar, choose settings
TIP To toggle snap settings on and off at any time, click on the SNAP button on the status
bar, or press F9.
In addition to setting the snap spacing, you can change the snap and grid orientation. You
can also rotate the alignment of the grid or set it to create isometric drawings.
Using isometric snap
You can use the Isometric Snap option to create two dimensional isometric drawings. With
the isometric option, you are simply drawing a simulated three dimensional view on a
twodimensional plane, much the same as you might draw on a piece of paper. Do not
confuse isometric drawings with three dimensional drawings. You create three
dimensional drawings in three dimensional space.
The isometric option always uses three preset planes, which are denoted as left, right,
and top.
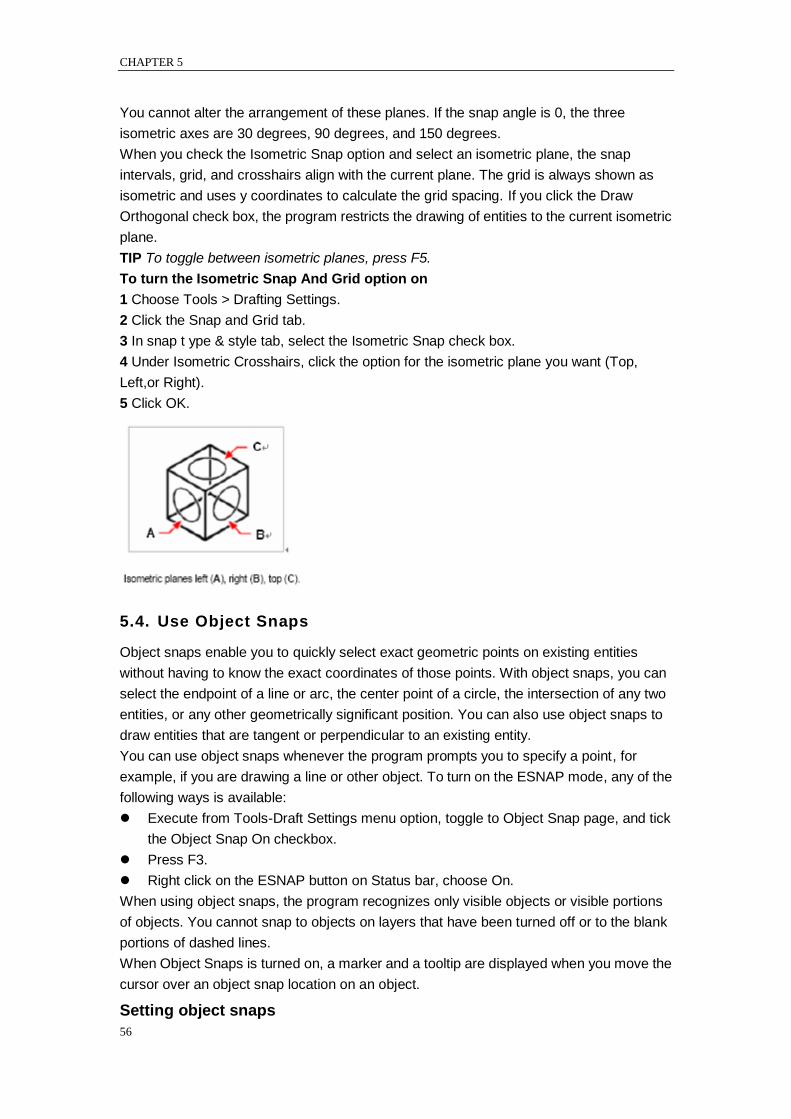
CHAPTER 5
56
You cannot alter the arrangement of these planes. If the snap angle is 0, the three
isometric axes are 30 degrees, 90 degrees, and 150 degrees.
When you check the Isometric Snap option and select an isometric plane, the snap
intervals, grid, and crosshairs align with the current plane. The grid is always shown as
isometric and uses y coordinates to calculate the grid spacing. If you click the Draw
Orthogonal check box, the program restricts the drawing of entities to the current isometric
plane.
TIP To toggle between isometric planes, press F5.
To turn the Isometric Snap And Grid option on
1 Choose Tools > Drafting Settings.
2 Click the Snap and Grid tab.
3 In snap t ype & style tab, select the Isometric Snap check box.
4 Under Isometric Crosshairs, click the option for the isometric plane you want (Top,
Left,or Right).
5 Click OK.
5.4. Use Object Snaps
Object snaps enable you to quickly select exact geometric points on existing entities
without having to know the exact coordinates of those points. With object snaps, you can
select the endpoint of a line or arc, the center point of a circle, the intersection of any two
entities, or any other geometrically significant position. You can also use object snaps to
draw entities that are tangent or perpendicular to an existing entity.
You can use object snaps whenever the program prompts you to specify a point, for
example, if you are drawing a line or other object. To turn on the ESNAP mode, any of the
following ways is available:
Execute from Tools-Draft Settings menu option, toggle to Object Snap page, and tick
the Object Snap On checkbox.
Press F3.
Right click on the ESNAP button on Status bar, choose On.
When using object snaps, the program recognizes only visible objects or visible portions
of objects. You cannot snap to objects on layers that have been turned off or to the blank
portions of dashed lines.
When Object Snaps is turned on, a marker and a tooltip are displayed when you move the
cursor over an object snap location on an object.
Setting object snaps

COORDINATES AND COORDINATE SYSTEM
57
You can set object snaps using any of the following methods:
Choose Tools>Draft Settings > Object Snap, then click one of the object snap tools.
On the Entity Snaps toolbar, click one of the object snap tools.
On the command line, type an object snap command.
On the status bar, right click ESNAP, choose settings.
Press and hold down the Shift key while right clicking anywhere within the drawing
window to display the object snap shortcut menu, and then choose the object snap
you want to set.
Object Snap settings
If you need to use one or more object snaps repeatedly, you can turn on running object
snaps on the Grid and Snap tab of Draft Settings dialog box. The object snap mode keeps
on unless you turn it off. For example, you can use an object snap to draw a line to the
center of a circle.
If several object snaps on, the system chooses automatically the most suitable object
snap. If there are two possible object snaps at the selection area, the system choose the
one that is closer to the center of target box.
If you turn several object snaps on, you need to check which one is in effect when you
specify a point. If several object snaps are eligible at a given location, press the TAB key
to cycle through the possibilities before you specify the point.
Object Snap Restrictions
With the object snap on, you can snap objects only visible on the screen, including objects
on locked layers, layout viewport boundaries, and polyline segments. You cannot snap to
objects that are not visible, including objects that are not displayed, objects on turned-off
or frozen layers, or the blank portions of dashed lines.
The object snap in available only when you are prompted to specify a point. There isn‘t
any information about object snap displayed if you try to use an object snap at the
Command prompt.
AutoSnap Tools
The automatic snap tool is a visual aid tool for snapping that help you see and use object
snaps more efficiently. When any object snap is on, the system displays a marker and a
tooltip when you move your cursor on over a snap point. AutoSnap turns on automatically
when an object snap is on. By default, AutoSnap mark, tooltip and magnet are on. You
can change the settings of AutoSnap on the Options dialog box.
AutoSnap consists of the following snap tools:
Marker. The object snap location is displayed when the cursor moves over or near an
object. Marker shape is determined by the snap it is marking.
Tooltip. Indicates which part of the object you are snapping to in a flag at the cursor
location.
Magnet. Attracts and locks the cursor onto the nearest detected snap points.
Provides a visual that is similar to snapping to a grid.
Aperture box. Surrounds the crosshairs and defines an area within which, when you
move the cursor, system evaluates objects for object snaps. You can determine the
CHAPTER 5
58
aperture box is displayed or not, and the aperture box size can be changed too.
To change the size of the object snap target box
1 Choose Tools>Options > Drafting.
2 Under Aperture Size, slide to adjust the desired size.
3 Click OK.
5.5. Use Polar Tracking and Object Snap Tracking
Auto tracking includes polar tracking and object snap tracking. You can turn them on and
off by repressing POLAR and OTRACK button on the Status Bar.
When the polar tracking mode is on, the cursor moves along the specified angle. When
the object snap tracking is on, the cursor moves along an alignment path based on the
snap point.
Polar Tracking
When polar tracking is turned on, guides display on the screen automatically at the polar
angle increment that you specify. For example, if you draw a line with polar tracking turned
on with angle increment set as 65 degrees , the rubber-banding line displays at 65 degree
increments.
Polar tracking and orthogonal locking cannot be used at the same time — turning one
option on turns the other option off.
To enable polar tracking and specify the polar angle increment
1 Do one of the following:
Choose Tools > Drafting Setting.
On the Object Snap toolbar, click the Object Snap Settings tool.
Type settings and then press Enter.
2 Click the Polar Tracking tab.
3 Select Polar Tracking On.
4 Do one of the following to specify the polar angle increments:
In Increment, select an angle.
Mark the Additional Angles check box and click New to define a custom angle
increment.
5 Click OK.
TIP To toggle polar tracking on and off at any time, click the POLAR button on the status
bar or press F10.
To draw objects using polar tracking
1 Turn on polar tracking and start a drawing command, such as ARC, CIRCLE, or LINE.
You can also use polar tracking with editing commands, such as COPY and MOVE.
2 As you move your cursor to specify points, notice the dotted polar tracking line that
appears at the tracking angles you specified. Points you specify while the line is displayed
conform to the polar tracking angle.
Specify Polar Angles
You can set a polar increment angle to polar tracking. The default angle includes 90, 45,
30, 22.5, 18, 15, 10 and 5 degrees. You can also type a desired angle at the textbox. The
value is stored in the system variable POLARANG. The orientation of angle 0 and the
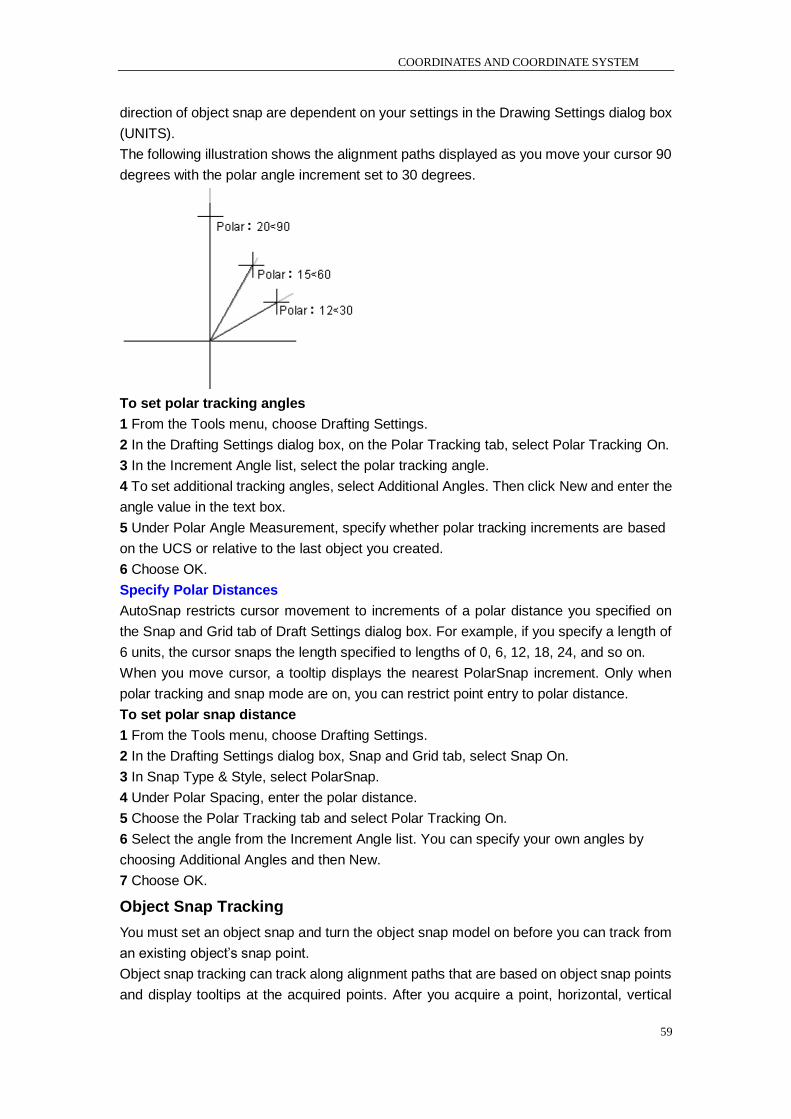
COORDINATES AND COORDINATE SYSTEM
59
direction of object snap are dependent on your settings in the Drawing Settings dialog box
(UNITS).
The following illustration shows the alignment paths displayed as you move your cursor 90
degrees with the polar angle increment set to 30 degrees.
To set polar tracking angles
1 From the Tools menu, choose Drafting Settings.
2 In the Drafting Settings dialog box, on the Polar Tracking tab, select Polar Tracking On.
3 In the Increment Angle list, select the polar tracking angle.
4 To set additional tracking angles, select Additional Angles. Then click New and enter the
angle value in the text box.
5 Under Polar Angle Measurement, specify whether polar tracking increments are based
on the UCS or relative to the last object you created.
6 Choose OK.
Specify Polar Distances
AutoSnap restricts cursor movement to increments of a polar distance you specified on
the Snap and Grid tab of Draft Settings dialog box. For example, if you specify a length of
6 units, the cursor snaps the length specified to lengths of 0, 6, 12, 18, 24, and so on.
When you move cursor, a tooltip displays the nearest PolarSnap increment. Only when
polar tracking and snap mode are on, you can restrict point entry to polar distance.
To set polar snap distance
1 From the Tools menu, choose Drafting Settings.
2 In the Drafting Settings dialog box, Snap and Grid tab, select Snap On.
3 In Snap Type & Style, select PolarSnap.
4 Under Polar Spacing, enter the polar distance.
5 Choose the Polar Tracking tab and select Polar Tracking On.
6 Select the angle from the Increment Angle list. You can specify your own angles by
choosing Additional Angles and then New.
7 Choose OK.
Object Snap Tracking
You must set an object snap and turn the object snap model on before you can track from
an existing object‘s snap point.
Object snap tracking can track along alignment paths that are based on object snap points
and display tooltips at the acquired points. After you acquire a point, horizontal, vertical
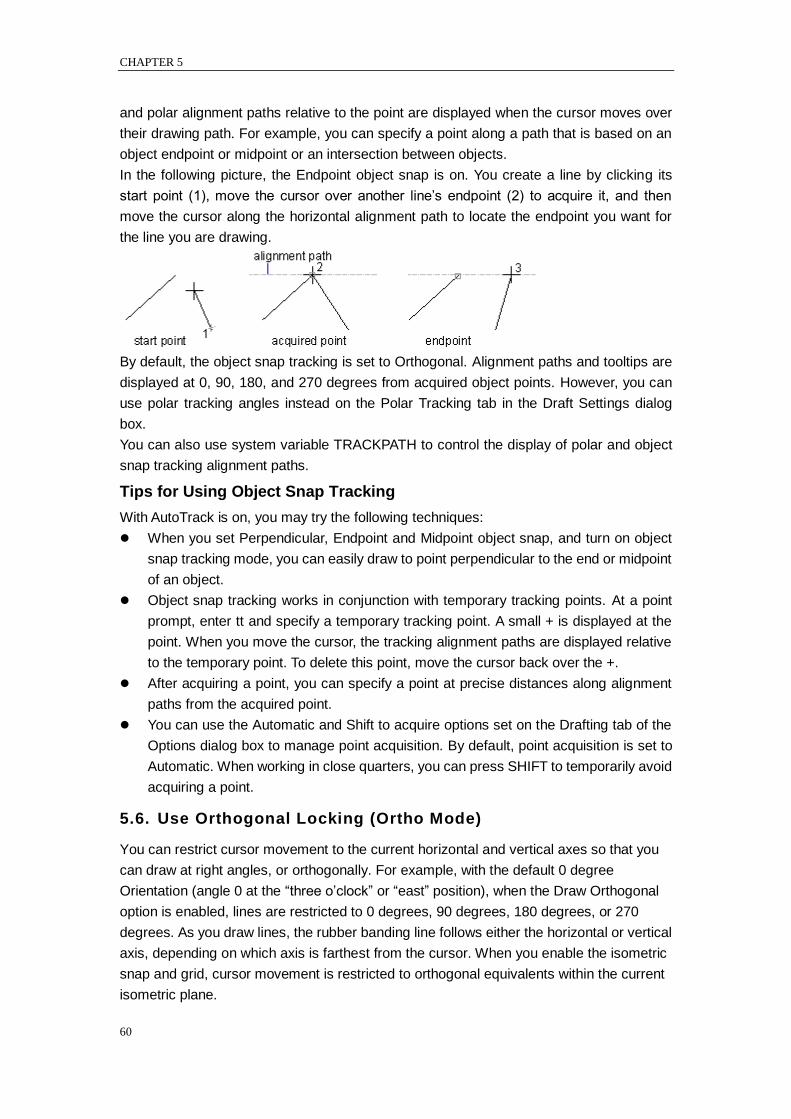
CHAPTER 5
60
and polar alignment paths relative to the point are displayed when the cursor moves over
their drawing path. For example, you can specify a point along a path that is based on an
object endpoint or midpoint or an intersection between objects.
In the following picture, the Endpoint object snap is on. You create a line by clicking its
start point (1), move the cursor over another line‘s endpoint (2) to acquire it, and then
move the cursor along the horizontal alignment path to locate the endpoint you want for
the line you are drawing.
By default, the object snap tracking is set to Orthogonal. Alignment paths and tooltips are
displayed at 0, 90, 180, and 270 degrees from acquired object points. However, you can
use polar tracking angles instead on the Polar Tracking tab in the Draft Settings dialog
box.
You can also use system variable TRACKPATH to control the display of polar and object
snap tracking alignment paths.
Tips for Using Object Snap Tracking
With AutoTrack is on, you may try the following techniques:
When you set Perpendicular, Endpoint and Midpoint object snap, and turn on object
snap tracking mode, you can easily draw to point perpendicular to the end or midpoint
of an object.
Object snap tracking works in conjunction with temporary tracking points. At a point
prompt, enter tt and specify a temporary tracking point. A small + is displayed at the
point. When you move the cursor, the tracking alignment paths are displayed relative
to the temporary point. To delete this point, move the cursor back over the +.
After acquiring a point, you can specify a point at precise distances along alignment
paths from the acquired point.
You can use the Automatic and Shift to acquire options set on the Drafting tab of the
Options dialog box to manage point acquisition. By default, point acquisition is set to
Automatic. When working in close quarters, you can press SHIFT to temporarily avoid
acquiring a point.
5.6. Use Orthogonal Locking (Ortho Mode)
You can restrict cursor movement to the current horizontal and vertical axes so that you
can draw at right angles, or orthogonally. For example, with the default 0 degree
Orientation (angle 0 at the ―three o‘clock‖ or ―east‖ position), when the Draw Orthogonal
option is enabled, lines are restricted to 0 degrees, 90 degrees, 180 degrees, or 270
degrees. As you draw lines, the rubber banding line follows either the horizontal or vertical
axis, depending on which axis is farthest from the cursor. When you enable the isometric
snap and grid, cursor movement is restricted to orthogonal equivalents within the current
isometric plane.
COORDINATES AND COORDINATE SYSTEM
61
Ortho mode and polar tracking cannot be on at the same time. Turning on Ortho turns off
polar tracking.
To enable orthogonal drawing
Press F8
Status bar click
5.7. Work with Linetypes
ZWCAD provides simple and complex linetypes:
A simple linetype consists of a repeating pattern of dots, dashes, or blank spaces.
A complex linetype contains embedded shape and text objects along with dots,
dashes, and spaces.
You can use different linetypes to represent specific kinds of information. For example, if
you are drawing a site plan, you can draw roads using a continuous linetype, a fence
using a linetype of dashes with square posts, or a gas line using a complex linetype
showing the text ―GAS‖.
By default, every drawing has at least three linetypes: CONTINUOUS, BYLAYER, and
BYBLOCK. You cannot rename or delete these linetypes. Your drawing may also contain
an unlimited number of additional linetypes. You can load more linetypes into the program
from a linetype library file.
5.7.1. Load and use Linetypes
A linetype is a repeating pattern of dashes, dots, and blank spaces displayed in a line or a
curve.
Loads linetype from a drawing to be reused when needed.
Work with Linetypes
You can assign linetypes to objects by layer, or by specifying the linetype explicitly.
Besides choosing linetype, you can specify its scale to control the size of dashes and
spaces, and create your own custom linetypes.
Note: You should not confuse these linetypes with the hardware linetypes provided by
some plotters. Both linetypes of dashes produce the similar effects. However, if you use
both linetypes at the same time, the results can be unpredictable.
Load Linetypes
ZWCAD includes the linetype definition files zwcad.lin and zwcadiso.lin. Zwcad.lin is used
in the imperial system; and zwcadiso.ini is used in the metric system. If you select
zwcadiso.ini, you can use ISO pen-width option when you plot.
If you want to know what linetypes are already available, you can display a list of linetypes
that are loaded in the drawing or stored in an LIN (linetype definition) file. Both linetype
definition files contain several complex linetypes.
You can remove unreferenced linetype information with PURGE or by deleting the
linetype from the Linetype Manager. BYBLOCK, BYLAYER, and CONTINUOUS linetypes
cannot be removed.
5.7.2. Change the Linetype of an Object
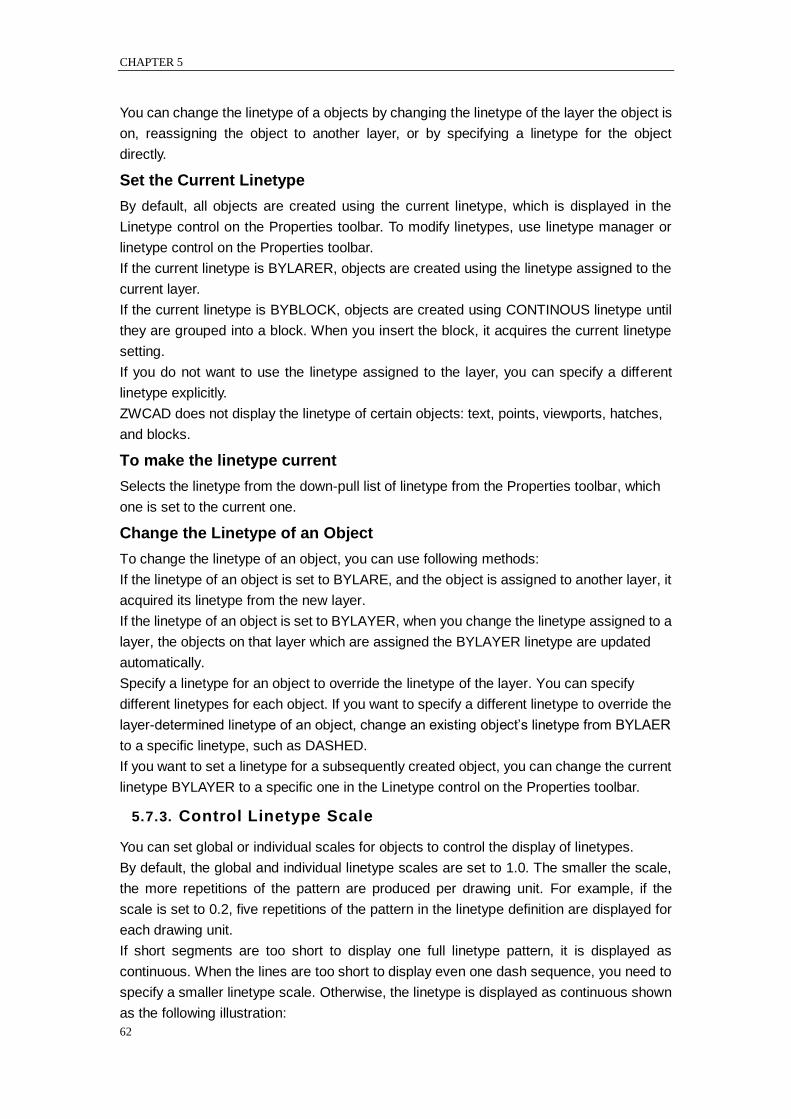
CHAPTER 5
62
You can change the linetype of a objects by changing the linetype of the layer the object is
on, reassigning the object to another layer, or by specifying a linetype for the object
directly.
Set the Current Linetype
By default, all objects are created using the current linetype, which is displayed in the
Linetype control on the Properties toolbar. To modify linetypes, use linetype manager or
linetype control on the Properties toolbar.
If the current linetype is BYLARER, objects are created using the linetype assigned to the
current layer.
If the current linetype is BYBLOCK, objects are created using CONTINOUS linetype until
they are grouped into a block. When you insert the block, it acquires the current linetype
setting.
If you do not want to use the linetype assigned to the layer, you can specify a different
linetype explicitly.
ZWCAD does not display the linetype of certain objects: text, points, viewports, hatches,
and blocks.
To make the linetype current
Selects the linetype from the down-pull list of linetype from the Properties toolbar, which
one is set to the current one.
Change the Linetype of an Object
To change the linetype of an object, you can use following methods:
If the linetype of an object is set to BYLARE, and the object is assigned to another layer, it
acquired its linetype from the new layer.
If the linetype of an object is set to BYLAYER, when you change the linetype assigned to a
layer, the objects on that layer which are assigned the BYLAYER linetype are updated
automatically.
Specify a linetype for an object to override the linetype of the layer. You can specify
different linetypes for each object. If you want to specify a different linetype to override the
layer-determined linetype of an object, change an existing object‘s linetype from BYLAER
to a specific linetype, such as DASHED.
If you want to set a linetype for a subsequently created object, you can change the current
linetype BYLAYER to a specific one in the Linetype control on the Properties toolbar.
5.7.3. Control Linetype Scale
You can set global or individual scales for objects to control the display of linetypes.
By default, the global and individual linetype scales are set to 1.0. The smaller the scale,
the more repetitions of the pattern are produced per drawing unit. For example, if the
scale is set to 0.2, five repetitions of the pattern in the linetype definition are displayed for
each drawing unit.
If short segments are too short to display one full linetype pattern, it is displayed as
continuous. When the lines are too short to display even one dash sequence, you need to
specify a smaller linetype scale. Otherwise, the linetype is displayed as continuous shown
as the following illustration:
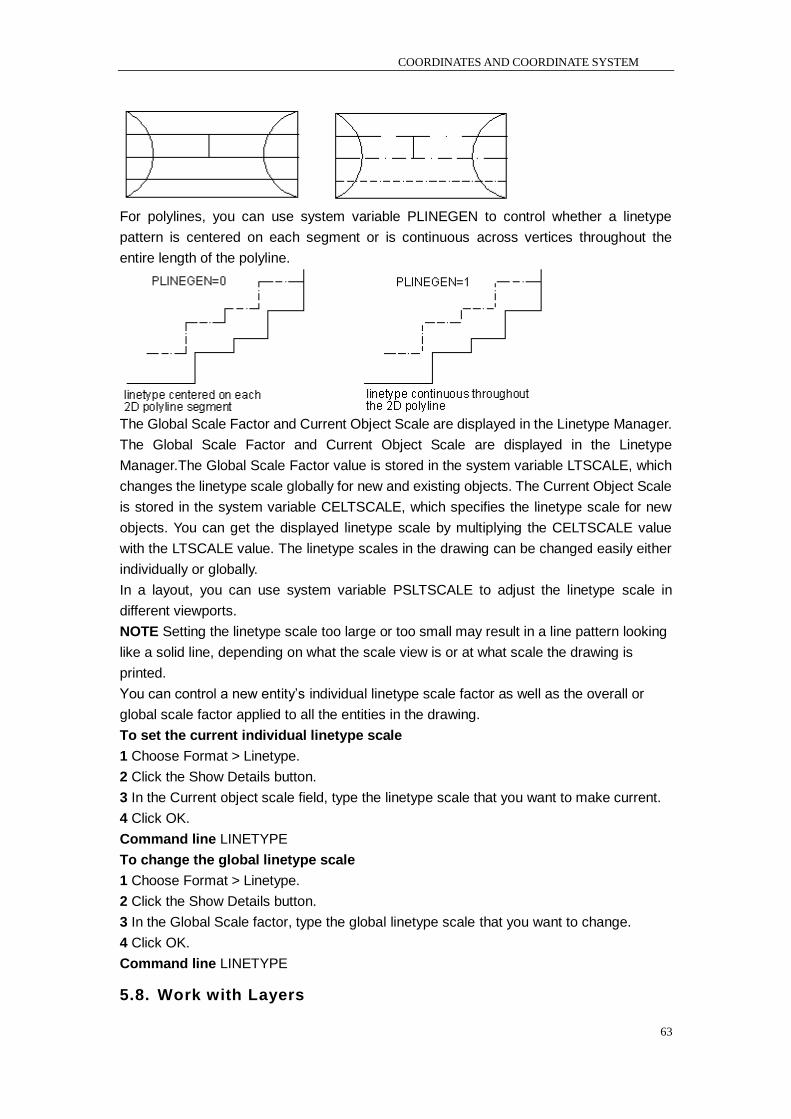
COORDINATES AND COORDINATE SYSTEM
63
For polylines, you can use system variable PLINEGEN to control whether a linetype
pattern is centered on each segment or is continuous across vertices throughout the
entire length of the polyline.
The Global Scale Factor and Current Object Scale are displayed in the Linetype Manager.
The Global Scale Factor and Current Object Scale are displayed in the Linetype
Manager.The Global Scale Factor value is stored in the system variable LTSCALE, which
changes the linetype scale globally for new and existing objects. The Current Object Scale
is stored in the system variable CELTSCALE, which specifies the linetype scale for new
objects. You can get the displayed linetype scale by multiplying the CELTSCALE value
with the LTSCALE value. The linetype scales in the drawing can be changed easily either
individually or globally.
In a layout, you can use system variable PSLTSCALE to adjust the linetype scale in
different viewports.
NOTE Setting the linetype scale too large or too small may result in a line pattern looking
like a solid line, depending on what the scale view is or at what scale the drawing is
printed.
You can control a new entity‘s individual linetype scale factor as well as the overall or
global scale factor applied to all the entities in the drawing.
To set the current individual linetype scale
1 Choose Format > Linetype.
2 Click the Show Details button.
3 In the Current object scale field, type the linetype scale that you want to make current.
4 Click OK.
Command line LINETYPE
To change the global linetype scale
1 Choose Format > Linetype.
2 Click the Show Details button.
3 In the Global Scale factor, type the global linetype scale that you want to change.
4 Click OK.
Command line LINETYPE
5.8. Work with Layers
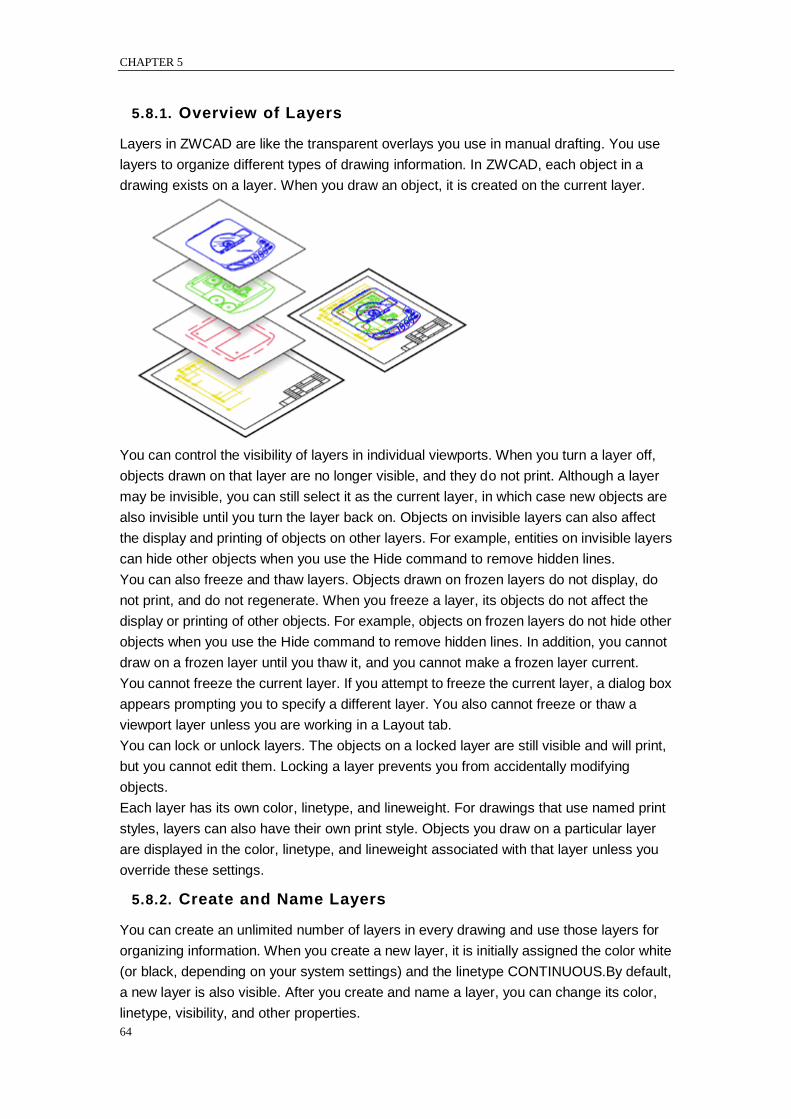
CHAPTER 5
64
5.8.1. Overview of Layers
Layers in ZWCAD are like the transparent overlays you use in manual drafting. You use
layers to organize different types of drawing information. In ZWCAD, each object in a
drawing exists on a layer. When you draw an object, it is created on the current layer.
You can control the visibility of layers in individual viewports. When you turn a layer off,
objects drawn on that layer are no longer visible, and they do not print. Although a layer
may be invisible, you can still select it as the current layer, in which case new objects are
also invisible until you turn the layer back on. Objects on invisible layers can also affect
the display and printing of objects on other layers. For example, entities on invisible layers
can hide other objects when you use the Hide command to remove hidden lines.
You can also freeze and thaw layers. Objects drawn on frozen layers do not display, do
not print, and do not regenerate. When you freeze a layer, its objects do not affect the
display or printing of other objects. For example, objects on frozen layers do not hide other
objects when you use the Hide command to remove hidden lines. In addition, you cannot
draw on a frozen layer until you thaw it, and you cannot make a frozen layer current.
You cannot freeze the current layer. If you attempt to freeze the current layer, a dialog box
appears prompting you to specify a different layer. You also cannot freeze or thaw a
viewport layer unless you are working in a Layout tab.
You can lock or unlock layers. The objects on a locked layer are still visible and will print,
but you cannot edit them. Locking a layer prevents you from accidentally modifying
objects.
Each layer has its own color, linetype, and lineweight. For drawings that use named print
styles, layers can also have their own print style. Objects you draw on a particular layer
are displayed in the color, linetype, and lineweight associated with that layer unless you
override these settings.
5.8.2. Create and Name Layers
You can create an unlimited number of layers in every drawing and use those layers for
organizing information. When you create a new layer, it is initially assigned the color white
(or black, depending on your system settings) and the linetype CONTINUOUS.By default,
a new layer is also visible. After you create and name a layer, you can change its color,
linetype, visibility, and other properties.
COORDINATES AND COORDINATE SYSTEM
65
Layers can have alphanumeric names up to 255 characters long.
In many cases, the layer names you choose are dictated by corporate, industry, or client
standards.
The Layer Properties Manager sorts layers alphabetically by name.
To create a new layer
1 Choose Format > Layer.
2 Clicks New button .
3 Type a name for the new layer.
4 Clicks OK button.
Properties toolbar
Command line LAYER
To change a layer name in the current drawing
1 Choose Format > Layer.
2 From the Layer Properties Manager dialog box, clicks the name of layer you want to
change.
3 Types a new name and clicks OK button.
Properties toolbar
Command line LAYER
NOTE You cannot rename the 0 layer.
Setting the current layer
When you start a drawing, objects are created in the current layer. By default, the layer 0
is set to the current layer, but you can also create a new one and make it current. Either
frozen or xref-dependent layer cannot be set to the current layer. Any subsequent objects
you create are associated with the current layer and use its color and linetype.
To make a layer current
1 Choose Format > Layer.
2 Selects the layer and clicks the Current button to make the layer current.
3 Clicks OK button.
Properties toolbar
Command line LAYER
Remove Layers
You can remove unused layers from your drawing with PURGE or by deleting the layer
from the Layer Properties Manager.
5.8.3. Change Layer Settings and Layer Properties
Everything in a drawing is associated with a layer, in the course of creating a drawing, you
can modify what you draw by renaming layer name, modifying the properties of a layer
(color and linetype), or placing objects from one layer to another.
CHAPTER 5
66
If you create an object on a wrong layer, you can reassign it to another layer. Unless the
linetype, color or other properties of the object has been specified explicitly, the object
acquires the properties of the new layer.
You can change layer properties in the layer control on the Layers toolbar or in the Layer
Properties Manager. Click the icons to change settings. However, layer names and colors
can be changed only in the Layer Properties Manager.
Controlling layer visibility
A layer can be visible or invisible. Objects on invisible layers are not displayed and do not
print. By controlling layer visibility, you can turn off unnecessary information, such as
construction lines or notes. By changing layer visibility, you can put the same drawing to
multiple uses.
For example, if you are drawing a floor plan, you can draw the layout of light fixtures on
one layer and the location of plumbing lines on another. By selectively turning layers on
and off, you can print the electrical engineering drawings and the plumbing drawings from
the same drawing file. For even more convenience, you can control the visibility of layers
within individual viewports, so that layers that display in one viewport are invisible in other
viewports in the same drawing.
When you turn a layer off, objects drawn on that layer are no longer visible. When you turn
the layer back on, the objects on that layer are redisplayed.
To turn layers on or off
1 Choose Format > Layer.
2 Clicks icon under ―On‖ tab in the layer list.
3 Clicks OK button.
Properties toolbar
Command line LAYER
Freeze or thaw layers
You can also freeze layers to improve the performance of operations such as zooming
and panning or producing hidden lines or shaded images. When a layer is frozen, objects
drawn on that layer are no longer visible.
To freeze or thaw layers
1 Choose Format > Layer.
2 Clicks icon under ―Freeze in all VP‖ tab in the layer list.
3 Clicks OK button.
Properties toolbar
Command line LAYER
Locking and unlocking layers
Locking a layer makes it easy to refer to information contained on the layer, but prevents
you from accidentally modifying its objects. When a layer is locked (but visible and
thawed), its objects remain visible, but you cannot edit them. If you lock the current layer,
you can still add new objects to it. You can also change the linetype and color associated
COORDINATES AND COORDINATE SYSTEM
67
with a locked layer.
Unlocking a layer restores full editing capabilities.
To lock or unlock layers
1 Choose Format > Layer.
2 Clicks icon under ―Lock‖ tab in the layer list.
3 Clicks OK button.
Properties toolbar
Command line LAYER
Controlling layer printing
Controlling layer printing is another way you can specify which objects print in your
drawing.
By controlling layer printing, you can turn off unnecessary information during printing. For
example, if you are drawing a floor plan, you can draw the layout of light fixtures on one
layer and the location of plumbing lines on another. By selectively turning layers on and off
when you print, you can print the electrical engineering drawings and the plumbing
drawings from the same drawing file. By changing layer printing, you can put the same
drawing to multiple uses.
When you turn off printing for a layer, objects drawn on that layer are still visible, but they
do not print. If you turn off a layer‘s visibility, objects drawn on that layer do not display or
print.
Controlling layer printing can be especially helpful if you want layer visibility on, but do not
want to print objects on that layer.
To turn layer printing on or off
1 Choose Format > Layer.
2 Clicks icon under ―Plot‖ tab in the layer list.
3 Clicks OK button.
Properties toolbar
Command line LAYER
Setting the layer color
Each layer in a drawing is assigned a color. ZWCAD uses the BYLAYER color as the
default color setting for object creation so that new objects are drawn in the color of the
layer on which they are inserted.
To change the layer color
1 Choose Format > Layer.
2 Clicks icon under ―Color‖ tab in the layer list to open Select Color dialog box, from which,
you can specify the desired color.
In the Select Color dialog box, select a color on one of the following tabs:
Index Color — Click BYBLOCK, BYLAYER, or one of the 255 index colors. You can
also type the color number in the Index box.
True Color — Click a basic color, click a color in the color palette, enter the Hue,
Saturation, and Luminance (HSL) values, or enter the Red, Green, Blue (RGB)
CHAPTER 5
68
values. There are more than 16 million true colors from which you can choose.
Color Books — Select a color book from the list, then click a color. You can select
Show Only Color Book Colors Used in Drawing to limit the selection to only those
color book colors that are used in the current drawing.
3 Clicks OK button.
Properties toolbar
Command line LAYER
NOTE You can also assign a specific color to an object, which overrides the layer’s color
setting. When you create a new object, use the Format > Color command to change the
current color. For an existing object, select the object, right click for the shortcut menu,
and choose Properties. You can then change the object’s color in the Properties dialog
box.
Setting a layer’s linetype
Each layer uses a default linetype (a repeating pattern of dashes, dots, or blank spaces).
Linetype determines the appearance of objects both on the screen and when printed.
It‘s a good idea to assign the BYLAYER linetype to any objects that you draw on that
layer.
ZWCAD uses the BYLAYER linetype as the default linetype setting for Object Creation.
NOTE Only those linetypes already set in the drawing can be assigned to layers.
To change the linetype assigned to one or more layers
1 Choose Format > Layer.
2 Clicks the Linetype name in the layer list to open Linetype dialog box, from which, you
can specify the desired Linetype.
3 Clicks OK button.
Properties toolbar
Command line LAYER
NOTE You can also assign a specific linetype to an object, which overrides the layer’s
linetype setting. When you create a new object, use the Format > Linetype command to
change the current linetype. For an existing object, select the object, right click for the
shortcut menu, and choose Properties. You can then modify the object’s linetype in the
Properties dialog box.
Setting a layer’s lineweight
Each layer uses a default lineweight. Lineweights determine the thickness of objects both
on the screen and when printed.
All new layers are assigned the DEFAULT lineweight, which is .25 millimeters or .01
inches.
If you want a different lineweight assigned to a layer, you can easily change it using Layer
Properties Manager. For example, you may want different lineweights on each layer of
your drawing to show separate elements, such as walls, dimensions, structural steel, and
electrical plans. Changing the lineweight assigned to a layer changes the lineweight of all
objects drawn on that layer with the BYLAYER lineweight.
COORDINATES AND COORDINATE SYSTEM
69
When you create new objects, it‘s a good idea to assign the BYLAYER lineweight to any
objects that you draw on that layer, unless you want to override the layer lineweight.
ZWCAD uses the BYLAYER lineweight as the default lineweight setting when you create
objects.
To change the lineweight assigned to one or more layers
1 Choose Format > Layer.
2 Clicks the Lineweight name in the layer list to open Lineweight dialog box, from which,
you can specify the desired Lineweight.
3 Clicks OK button.
Properties toolbar
Command line LAYER
NOTE You can also assign a specific lineweight to an object, which overrides the layer’s
lineweight setting. When you create a new object, use the Format > Lineweight to change
the current lineweight. For an existing object, select the object, right click for the shortcut
menu, and choose Properties. You can then modify the object’s lineweight in the
Properties tab.
Setting a layer’s print style
If your drawing uses named print style tables, you can specify a print style for each layer.
Named print style tables contain print styles that you set up to control what objects look
like when they print, without actually changing the objects in the drawing.
If your drawing uses color-dependent print style tables, you cannot specify a print style for
a layer. These types of print style tables automatically determine printing requirements by
the color assigned to a layer or an object.
In drawings that use named print style tables, the default print style is Normal for all new
layers. If desired, you can assign a print style using Layer Properties Manager. Changing
the print style assigned to a layer changes the print style of all objects drawn on that layer
with the BYLAYER print style.
When you create new objects, it‘s a good idea to assign the BYLAYER print style to any
objects that you draw on that layer, unless you want to override the layer print style.
ZWCAD uses the BYLAYER print style as the default print style setting when you create
objects.
To change the print style assigned to one or more layers (only in a drawing that
uses named print style tables)
1 Choose Format > Layer.
2 Clicks the name of Plot Style in the layer list to open Plot Style Table dialog box, from
which, you can specify the desired plot style.
3 Clicks OK button.
Properties toolbar
Command line LAYER
5.8.4. Filter and Sort the List of Layers
Limits the display of layer name listed in the Layer Properties Manager and sorts them by
CHAPTER 5
70
name or by properties, such as color and visibility.
You can use a layer filter limits the display of layer names in the Layer Properties
Manager.
The following properties can be included in the filter definition:
Whether layers are set to be plotted
Layer names, colors, linetypes, lineweights, and plot styles
Whether layers are locked or unlocked
Whether layers are turned on or off
Whether layers are frozen or thawed in the current viewport or all viewports
When setting filter conditions, you can also use wild-card characters to filter names by
name. For example, typing nare* displays layer name preceded with nare,just click Add
button if the filter name has been specified.
You can also use invert filter to display layer names that do not be included filter definition.
For example, if all the site plan information of a drawing is contained in multiple layers,
which include the word lite as part of the layer name, you should first define the filter by
way of specifying filter name and inputting *lite* in layer name option, and then click Invert
Filter option to display all the information excluded from the site plan information.
Name Layer Filters lists default filters and other saved filters created in the current
drawing. The three default filters are shown as follows:
Show all layers.
Show all used layers.
Show all Xref_dependent layers.
The new created filters are displayed in the Name Layer Filters at the Layer Properties
Manager. These filters are saved with the drawing.
Sort Layers
From the Layer Properties Manager, you can click column heading to sort layers by their
properties in that column. The properties include layer name, visibility, color, lineweight,
plotted style and linetype. And layer names can be sorted in descending or ascending
alphabetical order.
5.8.5. Save and Restore Layer Settings
You can save the current layer settings in a drawing and restore them later.
Save Layer Settings
Layer settings include:
Layer states, such as on, frozen, locked, plot and freeze automatically in a new
viewport.
Layer properties, such as color, linetype, lineweight and plot style.
You can save layer settings alternatively. For example, you can choose to save only
Frozen/Thawed settings of the layers in a drawing, ignoring all other settings. When you
restore the layer states, all settings remain as they are currently set except whether each
layer is frozen or thawed.
You can export named layer states to an LAS file for use in other drawings using the Layer
States Manager. The layer states of xref cannot be exported.
COORDINATES AND COORDINATE SYSTEM
71
Restore Layer Settings
You can not only restore the saved settings, but also edit, rename or delete named
settings. Using Layer States Manager, you can import named layer states that were
previously export to LAS files.
Whatever layer states come from the drawing or LAS files, only saved settings can be
restored and the unspecific layer settings remains the original settings.
5.9. Work with Colors
An entity‘s color determines how it is displayed and, if you are using a color printer, how it
prints. Entities are created in the current color specified for the drawing.
Layers can also control the color of entities. When you open a new drawing, entities are
created in the color BYLAYER, which adopts the color of the current layer. Initially, layer 0
is both the only layer and the current layer. Its default color is white, so your entities
appear as white.
For entities and layers in ZWCAD, there are three different types of colors:
Index colors
True colors
Color books colors
You can choose colors by selecting them from the Select Color dialog box. In the
command bar or in some dialog boxes, you specify a color either by name or by number.
All objects are created with the current color, which is assigned in the Color input box on
the Properties tab. With the Color control or the Select Color dialog box, you can also set
the current color.
Objects are created with the color assigned to the current layer If the current color is set to
BYLAYER. If the current color is not expected to be the color assigned to the current layer,
you can specify another color instead.
If the current color is set to BYBLOCK, objects are created using color 7 (white or black)
until these objects are grouped into a block. Once the block is inserted into a drawing, it
uses current color settings instead.
5.9.1. Using index colors
There are 255 standard index colors and two additional color properties that are often
referred to as colors (BYLAYER and BYBLOCK). You can use seven of the 255 standard
index colors by name: red, yellow, green, cyan, blue, magenta, and white. (Numbers eight
and nine are not named.) Each index color has a unique number from 1 to 255. The two
additional color properties are BYLAYER and BYBLOCK. These color properties cause an
entity to adopt the color either of the layer or of the block in which it is a member.
BYLAYER is color number 256, and BYBLOCK is color number 0. In all commands for
which you would use a color, you can indicate BYLAYER and BYBLOCK as well as by
numbers 256 and 0, respectively.
To select an index color
1 Click Select Color in the desired dialog box, such as Layers, Properties, or Multiline Text.
The Color dialog box opens.
2 Click the Index Color tab.
CHAPTER 5
72
3 Click the color of your choice, or type the color number in the Current box.
4 Click OK.
5.9.2. Using true colors
There are more than 16 million true colors from which you can choose. True colors are
defined using 24 bit color.
Even with so many colors available, you can quickly choose a color from the display of
basic colors or by clicking the color palette. Alternatively, if you know the values used to
define the desired color, you can enter the Hue, Saturation, and Luminance (HSL) values,
or you can enter the Red, Green, Blue (RGB) values.
To select a true color
1 Click Select Color in the desired dialog box, such as Layers, Properties, or Multiline Text.
The Color dialog box opens.
2 Click the True Color tab.
3 Select one of the following two color models:
HSL color model
RGB color model
4 Specify the desired color.
5 Click OK button.
5.9.3. Using color books
ZWCAD uses color books to store collections of colors. For example, you can store a
unique color scheme for a client in a color book and then use colors only from that color
book for the client‘s drawings.
You may have a color book given to you by a client, developed by a third party, or you can
create your own. Each color book has an .acb extension and is saved in Extensible
Markup Language (XML) format. By default, color books are stored in the Support folder
under ZWCAD installation directory.
To create a color book
1 Start an XML editor program.
2 Create a new XML file using the format below as a guide.
<colorBook>
<bookName>Color book sample</bookName>
<colorPage>
<pageColor><RGB8><red>0</red><green>0</green><blue>0</blue></RGB8>
</pageColor>
<colorEntry>
<colorName>Orange</colorName>
<RGB8><red>255</red><green>128</green><blue>0</blue></RGB8>
</colorEntry>
<colorEntry>
<colorName>Light Green</colorName>
<RGB8><red>128</red><green>192</green><blue>128</blue></RGB8>
</colorEntry>
COORDINATES AND COORDINATE SYSTEM
73
<colorEntry>
<colorName>Gray</colorName>
<RGB8><red>128</red><green>128</green><blue>128</blue></RGB8>
</colorEntry>
</colorPage>
</colorBook>
NOTE Your color book can contain an unlimited number of colors using the <colorEntry>
and </colorEntry> tags.
3 Save the color book in XML format and with an .acb extension.
To load a color book
1 Save the color book in the folder where ZWCAD searches for color books. By default,
this is the same folder where you installed ZWCAD.
To select a color book color
1 Click Select Color in the desired dialog box, such as Layers, Properties, or Multiline Text.
The Color dialog box opens.
2 Click the Color Books tab.
3 Select a color book from the list.
4 Click the desired color.
5 Click OK.
5.10. Control Lineweights
5.10.1. Overview of Lineweights
Lineweights help differentiate the purpose of one line from another. Lineweights
determine how thick or thin entities appear both on the screen and when printed.
By default, each drawing has three main lineweights : DEFAULT, BYLAYER, BYBLOCK,
and many additional lineweights in millimeters (or you can use inches).
When you create an entity, it is created using the current lineweight. By default, the
current lineweight for a new entity is BYLAYER. This means that the entity lineweight is
determined by the current layer. When you assign BYLAYER, changing a layer‘s
lineweight changes the lineweight of all the entities assigned that layer (if they were
created using the lineweight BYLAYER).
You can also select a specific lineweight (or DEFAULT) as the current lineweight, which
overrides the layer‘s lineweight setting. Entities are then created using that lineweight (or
the DEFAULT lineweight), and changing the layer lineweight has no effect on them.
As a third option, you can use the lineweight BYBLOCK property, in which case new
entities are drawn using the DEFAULT lineweight until you group them into a block.
The entities then inherit the block‘s lineweight setting when you insert the block into a
drawing.
If you choose a lineweight that is less than .025 millimeter, it displays as one pixel when
you create your drawing. When you print your drawing, it prints at the thinnest lineweight
that is available for your printer.
You cannot assign lineweights to planes, points, TrueType fonts, or raster images.
5.10.2. Display Lineweights
CHAPTER 5
74
Display lineweights in both of model space and layer space. Lineweights are displayed
differently in paper space layout than model space. Lineweights are useful for graphical
representations of different objects and information.
Display Lineweights in Model Space
In model space, a 0-value lineweight is displayed as a pixel, and other lineweights are
display with a pixel width proportional to their real-unit value.
In model space, lineweight display does not change with the zoom factor. A lineweight
value that is represented by a width of several pixels is always displayed using the same
number of pixels. Unless you use LWEIGHT command to open Lineweight Settings dialog
box and change the display scale, the lineweight display scale keeps unchanged. In
addition, the lineweight display scale does not affect the lineweight plotting value.
Lineweight that are represented more than one pixels increase regeneration time. Turning
off the display of lineweight optimizes performance of the program.
In model space, press LWT button on the status toolbar to turn lineweight display on and
off.
Display Lineweights in Layouts
In paper space (layout tab), lineweights are displayed in exact plotting width.
In plot preview and paper space, lineweights are displayed in real-world units, and
lineweight changes with the scale factor. From the Plotting Scale tab of Plot dialog box,
you can control the lineweight plotting and scaling in a drawing.
In paper space, press LWT button on the status toolbar to turn lineweight display on and
off. This change does not affect the lineweight plotting.
5.10.3. Change the Lineweight of an Object
You can change the current lineweight of an object by reassigning the object to another
layer, by changing the lineweight of the layer the object is on, or by specifying a lineweight
for the object explicitly.
Set the Current Lineweight
All objects are created in a drawing using the current lineweight. You can change the
lineweight in the Lineweight control on the Properties toolbar, or in the Lineweight Settings
dialog box.
If the current lineweight is set to BYLAYER, objects are created in a drawing using the
lineweight assigned to the current layer.
If the current lineweight is set to BYBLOCK, objects are created using the default
lineweight, until the objects are grouped into a block. When the block is inserted into a
drawing, it acquires the current lineweight setting.
To specify a lineweight for the current layer that is different from the current lineweight,
open the Layer Properties Manager and give a specific value.
By default, the lineweight of an object is set to BYLAER, and the lineweight of a layer is
set to DEFAULT. Lineweight that is assigned to objects is displayed as a solid fill drawn in
the object‘s assigned color.
To set the current lineweight
1 Choose Format > Lineweight.
COORDINATES AND COORDINATE SYSTEM
75
2 In the Lineweight list, choose the lineweight that you want to make current.
3 Click OK.
Command line LINEWEIGHT
TIP On the status bar, click the LWT button to toggle the display of lineweights on and off.
NOTE To see lineweights in your drawing, you may need to turn on lineweights.
Change the Lineweight of an Object
There are three choices for changing the lineweight of an object:
If the lineweight of an object is set to BYLAYER, and you reassign the object to a
different layer, the object acquires its lineweight from the new layer.
If the lineweight of an object is set to BYLAYER, you can change the lineweight of the
layer the object is on, and all objects assigned to BYLAYER on that layer are updated
automatically.
Specify a lineweight for an object to override the layer‘s lineweight. If you want to
specify a lineweight to override the layer-determined lineweight of an object, change
an existing object's lineweight from BYLAYER to a specific lineweight.
In order to create subsequent objects using a new lineweight, you have to change the
lineweight setting on the Properties toolbar from BYLAER to the specific one.
5.11. Control the Display of Overlapped Objects
Control how overlapped objects and some other objects are displayed and plotted.
Polylines, Hatches, Gradient Fills, Lineweights, and Text
You can simplify the display of certain kinds of objects, such as wide polylines, donuts,
solid-filled polygons (2D solids), hatches, gradient fills and text, to improve the display
performance and speed up of creating test plots.
Turning Fill on and off
You can reduce the time it takes to display or print a drawing by turning off the display of
solid fill. When Fill is turned off, all filled entities, such as wide polylines and planes,
display and print as outlines. When you turn Fill on or off, you must redraw the drawing
before the change is displayed.
To turn Fill on or off
1 Choose Tools > Options.
2 Click the Display tab.
3 Under Display performance, select or clear the Apply solid fill check box.
4 Choose View > Redraw.
Command line FILL

CHAPTER 5
76
Use Quick Text
If a drawing contains a lot of text using complex fonts, only a rectangular frame defining
the text is displayed or plotted when you turn on Quick Text mode.
Text entities require a considerable amount of time to display and print. You can reduce
the time it takes to display or print a drawing by enabling Quick Text. For example, if
you‘re doing a preliminary check print of a drawing, you may want to turn Quick Text on to
speed up printing. When Quick Text is enabled, text entities are replaced by rectangular
boxes that indicate the outline of the area occupied by the text. When you turn Quick Text
on or off, you must regenerate the drawing before the change is displayed.
To turn Quick Text on and off
1 Choose Tools > Options.
2 Click the Display tab.
3 Under Display performance, select or clear the Show text boundary frame only check
box.
4 Click OK.
5 To regenerate your drawing, do one of the following:
Choose View > Regen.
Type regen and then press Enter.
Command line QTEXT
Controlling the display of lineweights
You can reduce the time it takes to display a drawing by turning off the display of
lineweights.
When you turn off lineweights, all entities display as outlines.You can also specify a
lineweight scale. Specify a smaller scale to display thinner lines; specify a larger scale to
COORDINATES AND COORDINATE SYSTEM
77
display thicker lines. For example, a scale factor of 0.5 would display a .80 millimeter
lineweight as .40 millimeter; a scale factor of 2 would increase the same lineweight to
display at 1.6 millimeters. This can help you differentiate various lineweights that display
in a drawing. Adjusting the lineweight display scale affects how the lineweights appear on
your screen, not how they appear when printed.
NOTE Setting the lineweight scale too high may result in slower system performance.
You can also adjust the units for measuring lineweights, and the default lineweight.
To control the display of lineweights
1 Choose Format > Lineweight.
2 In Units for Listing, choose Millimeters or Inches.
3 In Default, select the lineweight assigned to layers and entities that use the Default
lineweight.
4 In Adjust Display Scale, move the slider to the scale you want. By default, the slider
begins at 1.00.
5 Click OK.
Command line LINEWEIGHT
TIP On the status bar ,left-click the word LWT to turn the display of lineweights on or off.
Update the Display
New objects automatically apply the current settings to displays of solid fill and text.
Except for lineweights, you must use the REGEN command to update the display of
existing objects.
Control How Overlapping Objects Are Displayed
By default, newly created objects are in front of existing objects; all objects are displayed
in the order they are created. To change the draw order, use DRAWORDER command.
Note changing draw order is available only within the same space.
5.12. Extract or Calculate Geometric Information from Objects
Information about objects in your drawing are allowed to inquire by means of performing
inquiry and calculation commands, you can also make useful calculations, such as area
and circumference calculation.
5.12.1. Calculating areas
You can calculate the area and perimeter of a polygon based on a series of points you
specify or enclose with a circle or closed polyline. You can also determine the area of
several combined objects and add or subtract the area of one or more objects from a total
combined area.
Calculating areas defined by points
You can find the area and perimeter of any closed region by specifying a series of points.
The program calculates the area and perimeter of the space that is enclosed by an
imaginary polygon consisting of straight line segments connecting each point.
To calculate the area defined by points you specify
1 Choose Tools > Inquiry > Area.
2 Specify the first point.
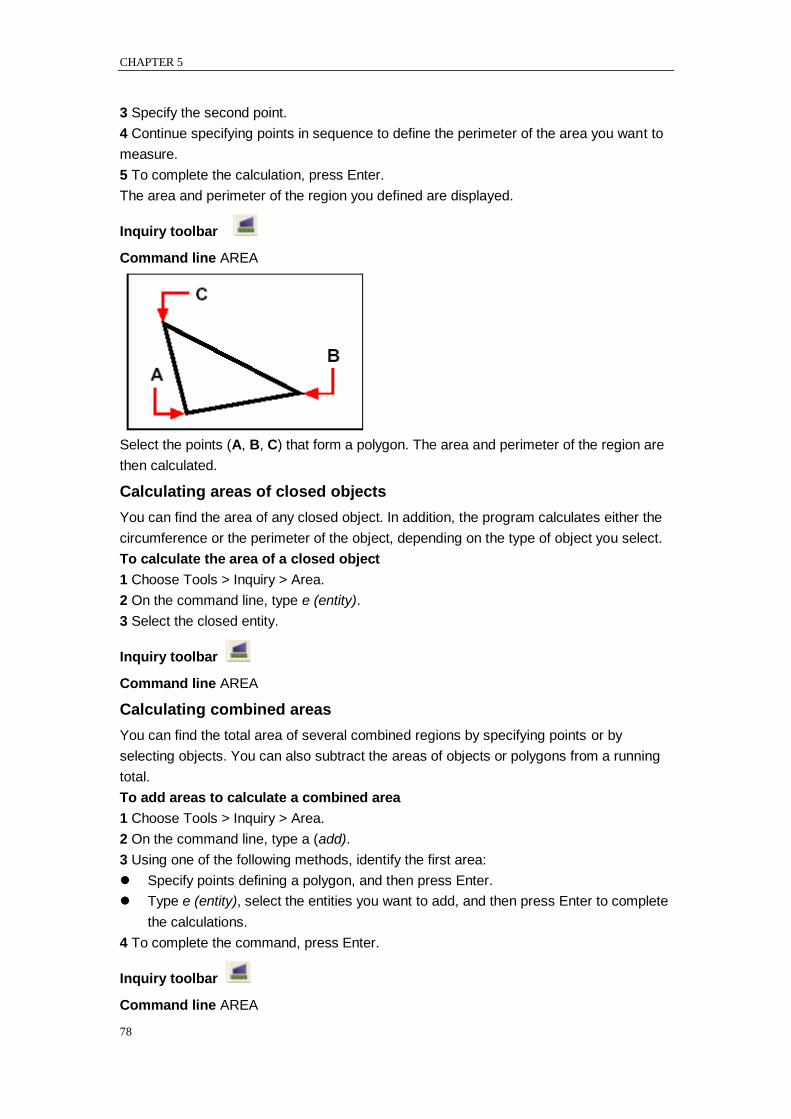
CHAPTER 5
78
3 Specify the second point.
4 Continue specifying points in sequence to define the perimeter of the area you want to
measure.
5 To complete the calculation, press Enter.
The area and perimeter of the region you defined are displayed.
Inquiry toolbar
Command line AREA
Select the points (A, B, C) that form a polygon. The area and perimeter of the region are
then calculated.
Calculating areas of closed objects
You can find the area of any closed object. In addition, the program calculates either the
circumference or the perimeter of the object, depending on the type of object you select.
To calculate the area of a closed object
1 Choose Tools > Inquiry > Area.
2 On the command line, type e (entity).
3 Select the closed entity.
Inquiry toolbar
Command line AREA
Calculating combined areas
You can find the total area of several combined regions by specifying points or by
selecting objects. You can also subtract the areas of objects or polygons from a running
total.
To add areas to calculate a combined area
1 Choose Tools > Inquiry > Area.
2 On the command line, type a (add).
3 Using one of the following methods, identify the first area:
Specify points defining a polygon, and then press Enter.
Type e (entity), select the entities you want to add, and then press Enter to complete
the calculations.
4 To complete the command, press Enter.
Inquiry toolbar
Command line AREA
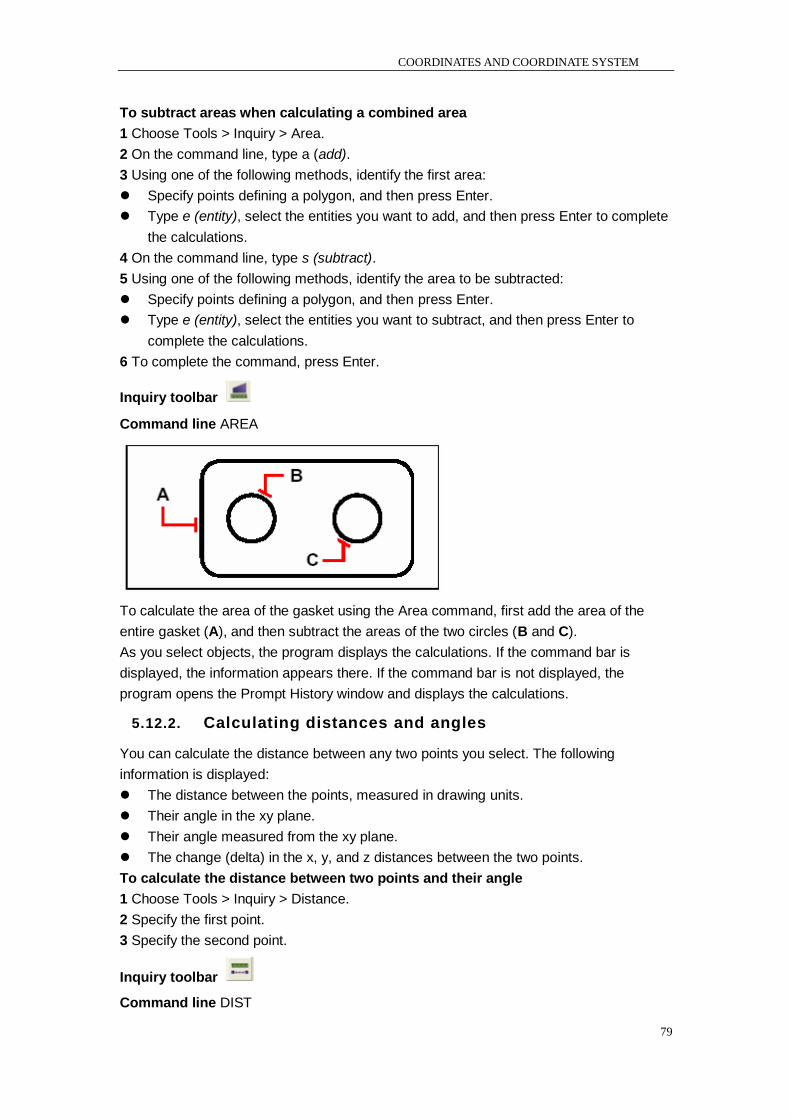
COORDINATES AND COORDINATE SYSTEM
79
To subtract areas when calculating a combined area
1 Choose Tools > Inquiry > Area.
2 On the command line, type a (add).
3 Using one of the following methods, identify the first area:
Specify points defining a polygon, and then press Enter.
Type e (entity), select the entities you want to add, and then press Enter to complete
the calculations.
4 On the command line, type s (subtract).
5 Using one of the following methods, identify the area to be subtracted:
Specify points defining a polygon, and then press Enter.
Type e (entity), select the entities you want to subtract, and then press Enter to
complete the calculations.
6 To complete the command, press Enter.
Inquiry toolbar
Command line AREA
To calculate the area of the gasket using the Area command, first add the area of the
entire gasket (A), and then subtract the areas of the two circles (B and C).
As you select objects, the program displays the calculations. If the command bar is
displayed, the information appears there. If the command bar is not displayed, the
program opens the Prompt History window and displays the calculations.
5.12.2. Calculating distances and angles
You can calculate the distance between any two points you select. The following
information is displayed:
The distance between the points, measured in drawing units.
Their angle in the xy plane.
Their angle measured from the xy plane.
The change (delta) in the x, y, and z distances between the two points.
To calculate the distance between two points and their angle
1 Choose Tools > Inquiry > Distance.
2 Specify the first point.
3 Specify the second point.
Inquiry toolbar
Command line DIST
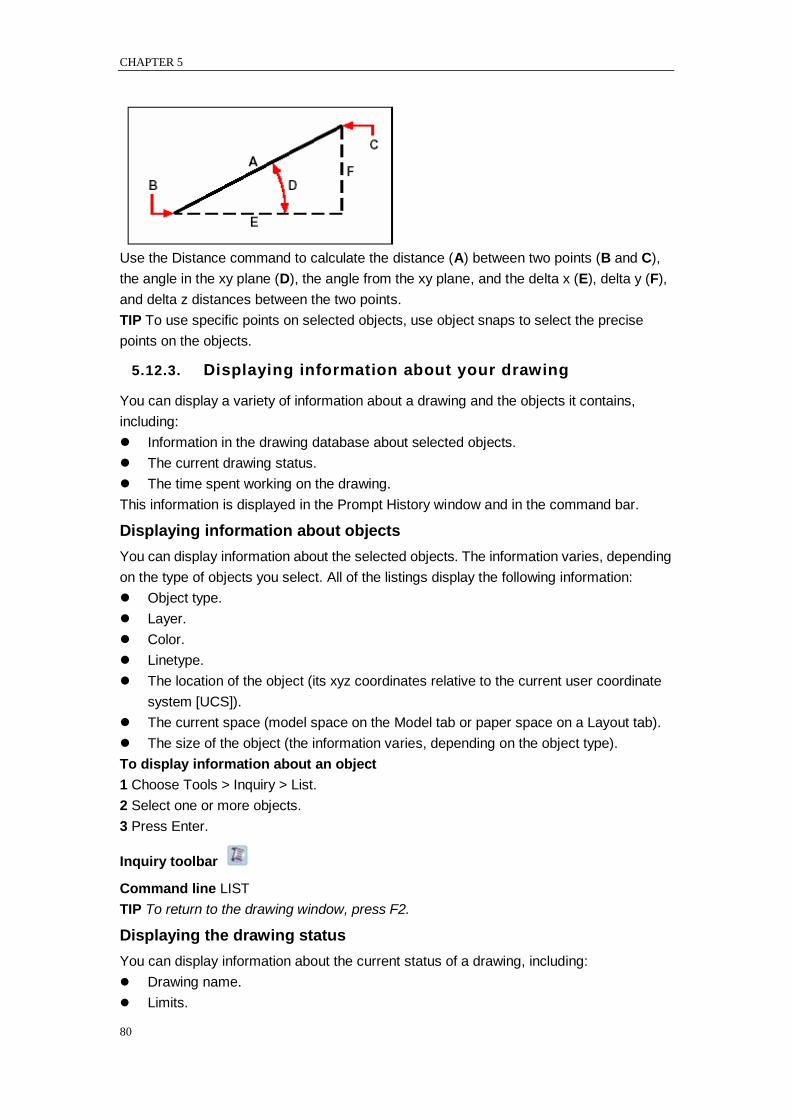
CHAPTER 5
80
Use the Distance command to calculate the distance (A) between two points (B and C),
the angle in the xy plane (D), the angle from the xy plane, and the delta x (E), delta y (F),
and delta z distances between the two points.
TIP To use specific points on selected objects, use object snaps to select the precise
points on the objects.
5.12.3. Displaying information about your drawing
You can display a variety of information about a drawing and the objects it contains,
including:
Information in the drawing database about selected objects.
The current drawing status.
The time spent working on the drawing.
This information is displayed in the Prompt History window and in the command bar.
Displaying information about objects
You can display information about the selected objects. The information varies, depending
on the type of objects you select. All of the listings display the following information:
Object type.
Layer.
Color.
Linetype.
The location of the object (its xyz coordinates relative to the current user coordinate
system [UCS]).
The current space (model space on the Model tab or paper space on a Layout tab).
The size of the object (the information varies, depending on the object type).
To display information about an object
1 Choose Tools > Inquiry > List.
2 Select one or more objects.
3 Press Enter.
Inquiry toolbar
Command line LIST
TIP To return to the drawing window, press F2.
Displaying the drawing status
You can display information about the current status of a drawing, including:
Drawing name.
Limits.
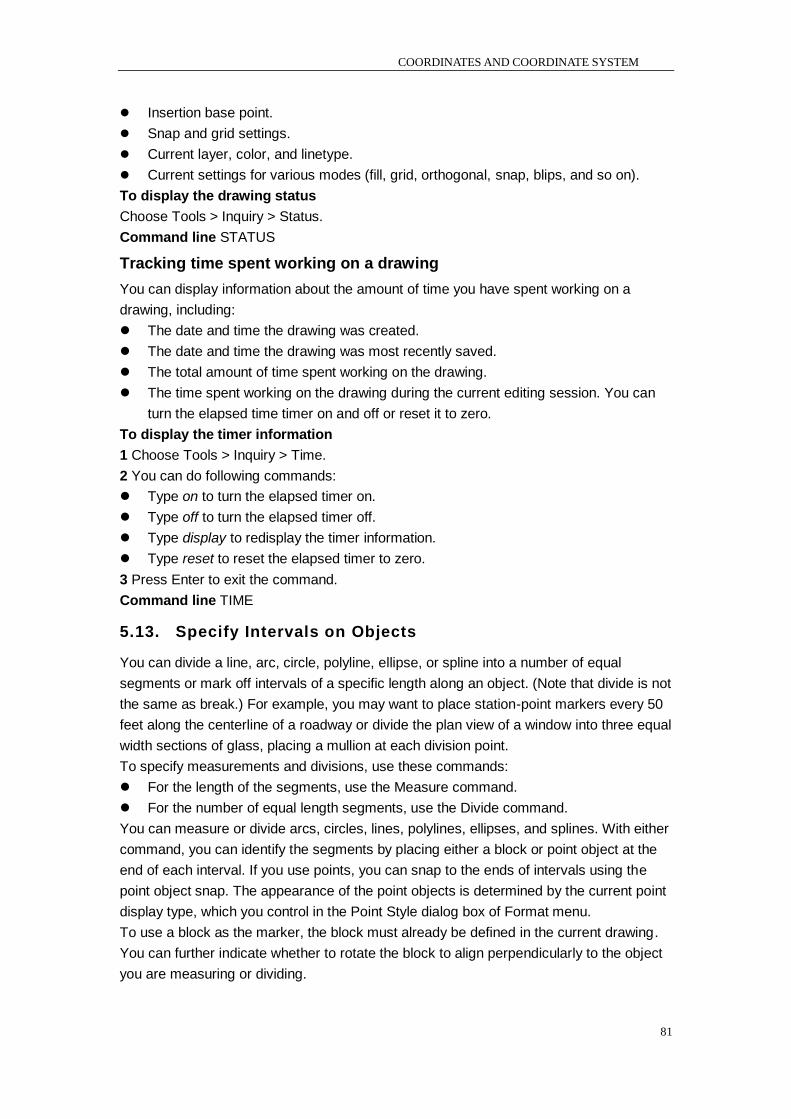
COORDINATES AND COORDINATE SYSTEM
81
Insertion base point.
Snap and grid settings.
Current layer, color, and linetype.
Current settings for various modes (fill, grid, orthogonal, snap, blips, and so on).
To display the drawing status
Choose Tools > Inquiry > Status.
Command line STATUS
Tracking time spent working on a drawing
You can display information about the amount of time you have spent working on a
drawing, including:
The date and time the drawing was created.
The date and time the drawing was most recently saved.
The total amount of time spent working on the drawing.
The time spent working on the drawing during the current editing session. You can
turn the elapsed time timer on and off or reset it to zero.
To display the timer information
1 Choose Tools > Inquiry > Time.
2 You can do following commands:
Type on to turn the elapsed timer on.
Type off to turn the elapsed timer off.
Type display to redisplay the timer information.
Type reset to reset the elapsed timer to zero.
3 Press Enter to exit the command.
Command line TIME
5.13. Specify Intervals on Objects
You can divide a line, arc, circle, polyline, ellipse, or spline into a number of equal
segments or mark off intervals of a specific length along an object. (Note that divide is not
the same as break.) For example, you may want to place station-point markers every 50
feet along the centerline of a roadway or divide the plan view of a window into three equal
width sections of glass, placing a mullion at each division point.
To specify measurements and divisions, use these commands:
For the length of the segments, use the Measure command.
For the number of equal length segments, use the Divide command.
You can measure or divide arcs, circles, lines, polylines, ellipses, and splines. With either
command, you can identify the segments by placing either a block or point object at the
end of each interval. If you use points, you can snap to the ends of intervals using the
point object snap. The appearance of the point objects is determined by the current point
display type, which you control in the Point Style dialog box of Format menu.
To use a block as the marker, the block must already be defined in the current drawing.
You can further indicate whether to rotate the block to align perpendicularly to the object
you are measuring or dividing.
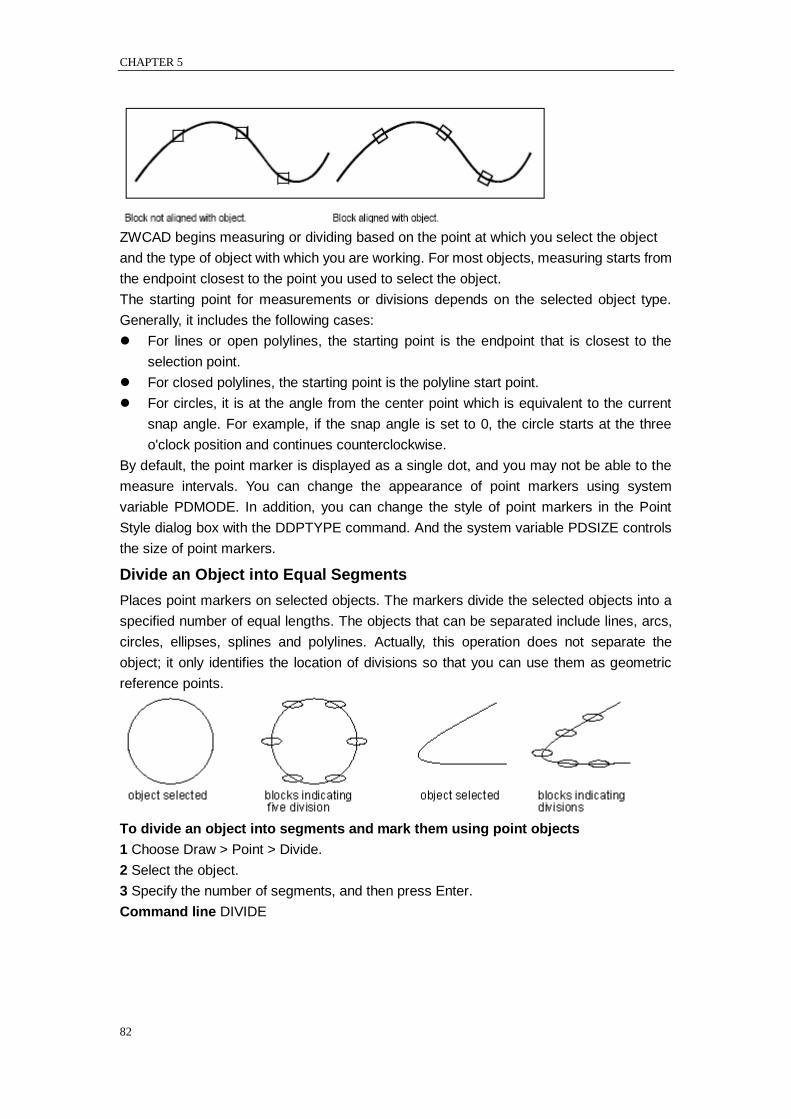
CHAPTER 5
82
ZWCAD begins measuring or dividing based on the point at which you select the object
and the type of object with which you are working. For most objects, measuring starts from
the endpoint closest to the point you used to select the object.
The starting point for measurements or divisions depends on the selected object type.
Generally, it includes the following cases:
For lines or open polylines, the starting point is the endpoint that is closest to the
selection point.
For closed polylines, the starting point is the polyline start point.
For circles, it is at the angle from the center point which is equivalent to the current
snap angle. For example, if the snap angle is set to 0, the circle starts at the three
o'clock position and continues counterclockwise.
By default, the point marker is displayed as a single dot, and you may not be able to the
measure intervals. You can change the appearance of point markers using system
variable PDMODE. In addition, you can change the style of point markers in the Point
Style dialog box with the DDPTYPE command. And the system variable PDSIZE controls
the size of point markers.
Divide an Object into Equal Segments
Places point markers on selected objects. The markers divide the selected objects into a
specified number of equal lengths. The objects that can be separated include lines, arcs,
circles, ellipses, splines and polylines. Actually, this operation does not separate the
object; it only identifies the location of divisions so that you can use them as geometric
reference points.
To divide an object into segments and mark them using point objects
1 Choose Draw > Point > Divide.
2 Select the object.
3 Specify the number of segments, and then press Enter.
Command line DIVIDE
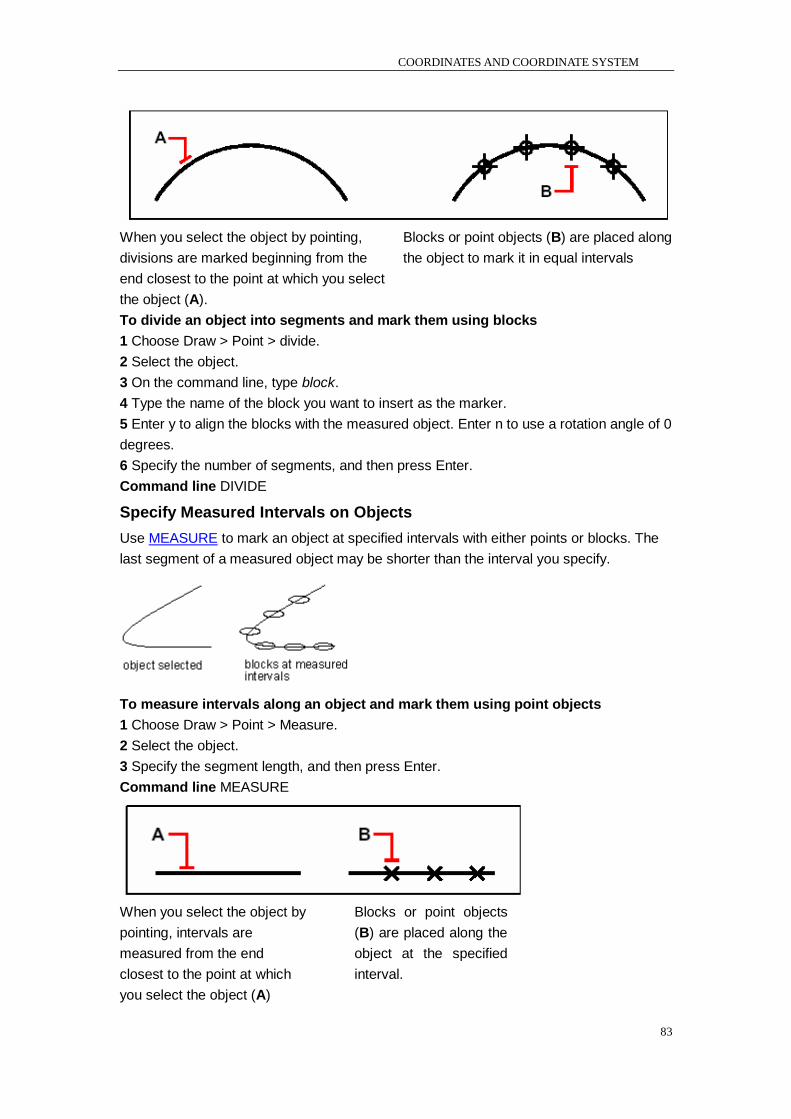
COORDINATES AND COORDINATE SYSTEM
83
When you select the object by pointing,
divisions are marked beginning from the
end closest to the point at which you select
the object (A).
Blocks or point objects (B) are placed along
the object to mark it in equal intervals
To divide an object into segments and mark them using blocks
1 Choose Draw > Point > divide.
2 Select the object.
3 On the command line, type block.
4 Type the name of the block you want to insert as the marker.
5 Enter y to align the blocks with the measured object. Enter n to use a rotation angle of 0
degrees.
6 Specify the number of segments, and then press Enter.
Command line DIVIDE
Specify Measured Intervals on Objects
Use MEASURE to mark an object at specified intervals with either points or blocks. The
last segment of a measured object may be shorter than the interval you specify.
To measure intervals along an object and mark them using point objects
1 Choose Draw > Point > Measure.
2 Select the object.
3 Specify the segment length, and then press Enter.
Command line MEASURE
When you select the object by
pointing, intervals are
measured from the end
closest to the point at which
you select the object (A)
Blocks or point objects
(B) are placed along the
object at the specified
interval.
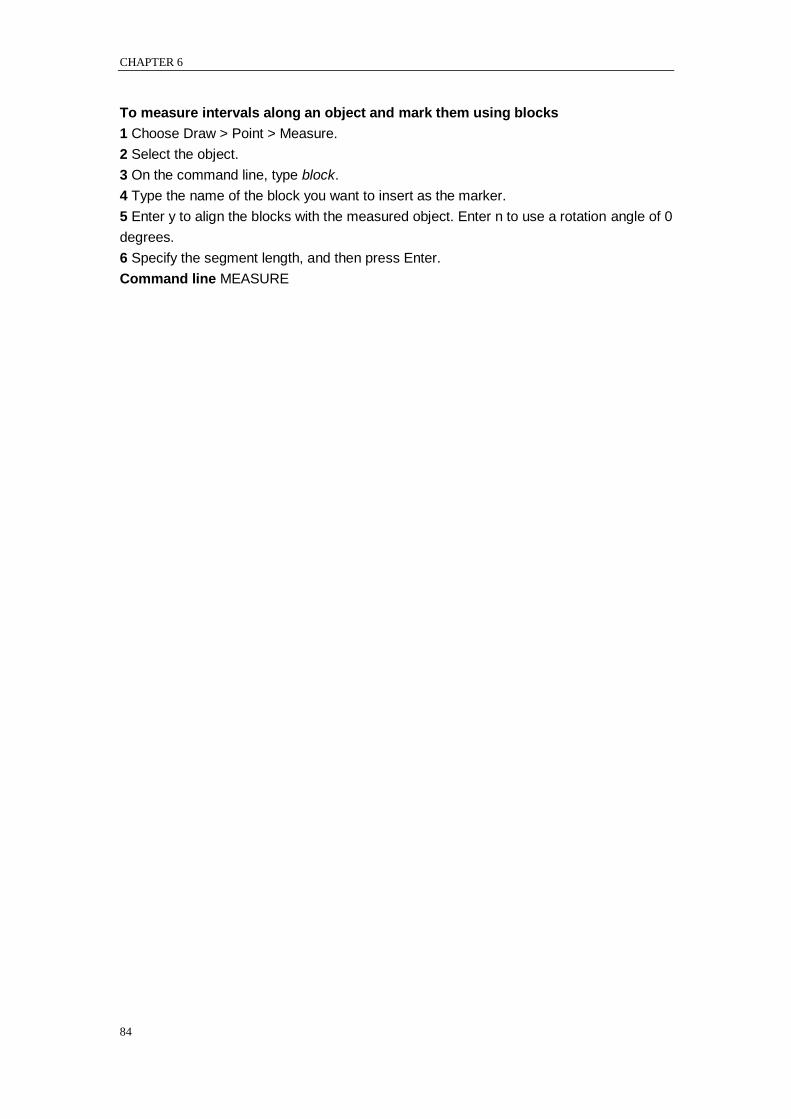
CHAPTER 6
84
To measure intervals along an object and mark them using blocks
1 Choose Draw > Point > Measure.
2 Select the object.
3 On the command line, type block.
4 Type the name of the block you want to insert as the marker.
5 Enter y to align the blocks with the measured object. Enter n to use a rotation angle of 0
degrees.
6 Specify the segment length, and then press Enter.
Command line MEASURE
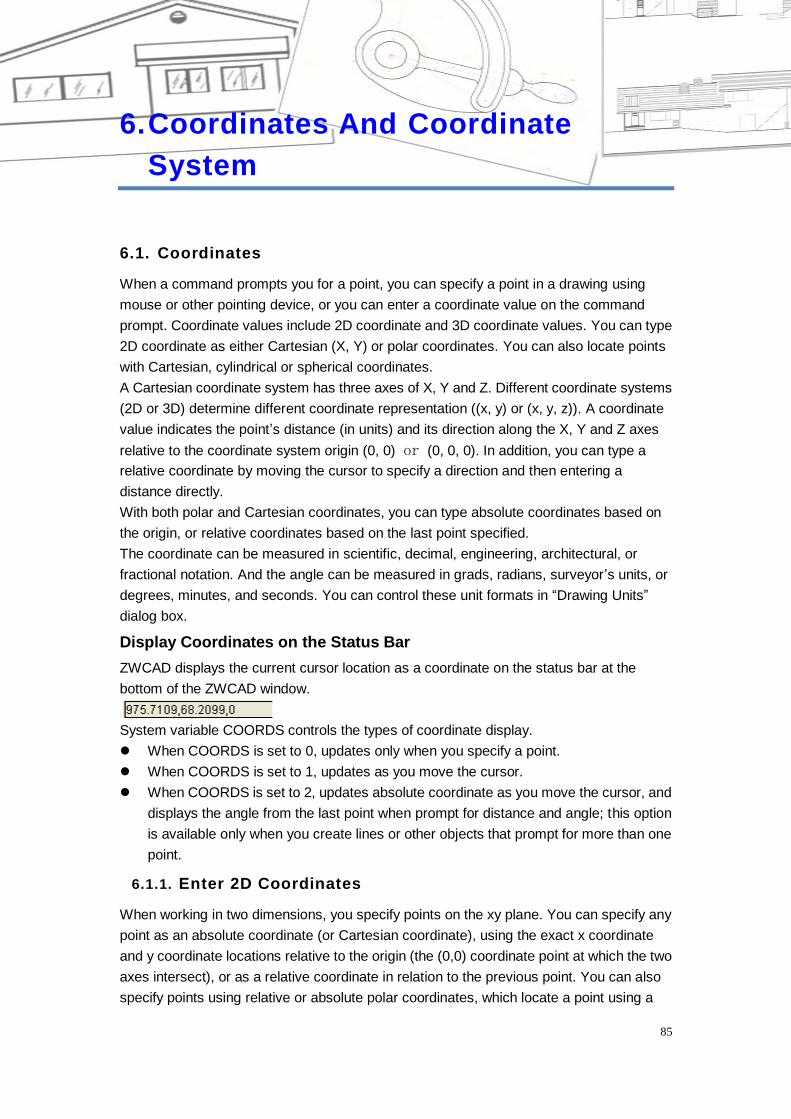
COORDINATES AND COORDINATE SYSTEM
85
6. Coordinates And Coordinate
System
6.1. Coordinates
When a command prompts you for a point, you can specify a point in a drawing using
mouse or other pointing device, or you can enter a coordinate value on the command
prompt. Coordinate values include 2D coordinate and 3D coordinate values. You can type
2D coordinate as either Cartesian (X, Y) or polar coordinates. You can also locate points
with Cartesian, cylindrical or spherical coordinates.
A Cartesian coordinate system has three axes of X, Y and Z. Different coordinate systems
(2D or 3D) determine different coordinate representation ((x, y) or (x, y, z)). A coordinate
value indicates the point‘s distance (in units) and its direction along the X, Y and Z axes
relative to the coordinate system origin (0, 0) or (0, 0, 0). In addition, you can type a
relative coordinate by moving the cursor to specify a direction and then entering a
distance directly.
With both polar and Cartesian coordinates, you can type absolute coordinates based on
the origin, or relative coordinates based on the last point specified.
The coordinate can be measured in scientific, decimal, engineering, architectural, or
fractional notation. And the angle can be measured in grads, radians, surveyor‘s units, or
degrees, minutes, and seconds. You can control these unit formats in ―Drawing Units‖
dialog box.
Display Coordinates on the Status Bar
ZWCAD displays the current cursor location as a coordinate on the status bar at the
bottom of the ZWCAD window.
System variable COORDS controls the types of coordinate display.
When COORDS is set to 0, updates only when you specify a point.
When COORDS is set to 1, updates as you move the cursor.
When COORDS is set to 2, updates absolute coordinate as you move the cursor, and
displays the angle from the last point when prompt for distance and angle; this option
is available only when you create lines or other objects that prompt for more than one
point.
6.1.1. Enter 2D Coordinates
When working in two dimensions, you specify points on the xy plane. You can specify any
point as an absolute coordinate (or Cartesian coordinate), using the exact x coordinate
and y coordinate locations relative to the origin (the (0,0) coordinate point at which the two
axes intersect), or as a relative coordinate in relation to the previous point. You can also
specify points using relative or absolute polar coordinates, which locate a point using a
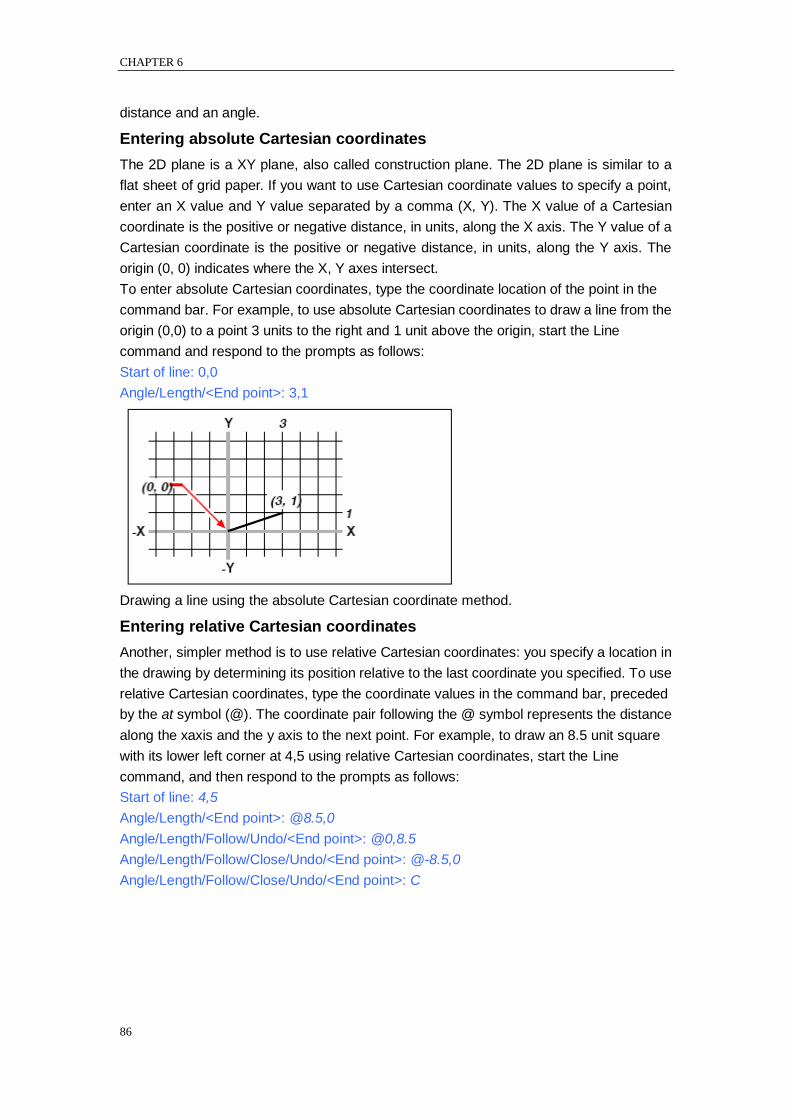
CHAPTER 6
86
distance and an angle.
Entering absolute Cartesian coordinates
The 2D plane is a XY plane, also called construction plane. The 2D plane is similar to a
flat sheet of grid paper. If you want to use Cartesian coordinate values to specify a point,
enter an X value and Y value separated by a comma (X, Y). The X value of a Cartesian
coordinate is the positive or negative distance, in units, along the X axis. The Y value of a
Cartesian coordinate is the positive or negative distance, in units, along the Y axis. The
origin (0, 0) indicates where the X, Y axes intersect.
To enter absolute Cartesian coordinates, type the coordinate location of the point in the
command bar. For example, to use absolute Cartesian coordinates to draw a line from the
origin (0,0) to a point 3 units to the right and 1 unit above the origin, start the Line
command and respond to the prompts as follows:
Start of line: 0,0
Angle/Length/<End point>: 3,1
Drawing a line using the absolute Cartesian coordinate method.
Entering relative Cartesian coordinates
Another, simpler method is to use relative Cartesian coordinates: you specify a location in
the drawing by determining its position relative to the last coordinate you specified. To use
relative Cartesian coordinates, type the coordinate values in the command bar, preceded
by the at symbol (@). The coordinate pair following the @ symbol represents the distance
along the xaxis and the y axis to the next point. For example, to draw an 8.5 unit square
with its lower left corner at 4,5 using relative Cartesian coordinates, start the Line
command, and then respond to the prompts as follows:
Start of line: 4,5
Angle/Length/<End point>: @8.5,0
Angle/Length/Follow/Undo/<End point>: @0,8.5
Angle/Length/Follow/Close/Undo/<End point>: @-8.5,0
Angle/Length/Follow/Close/Undo/<End point>: C
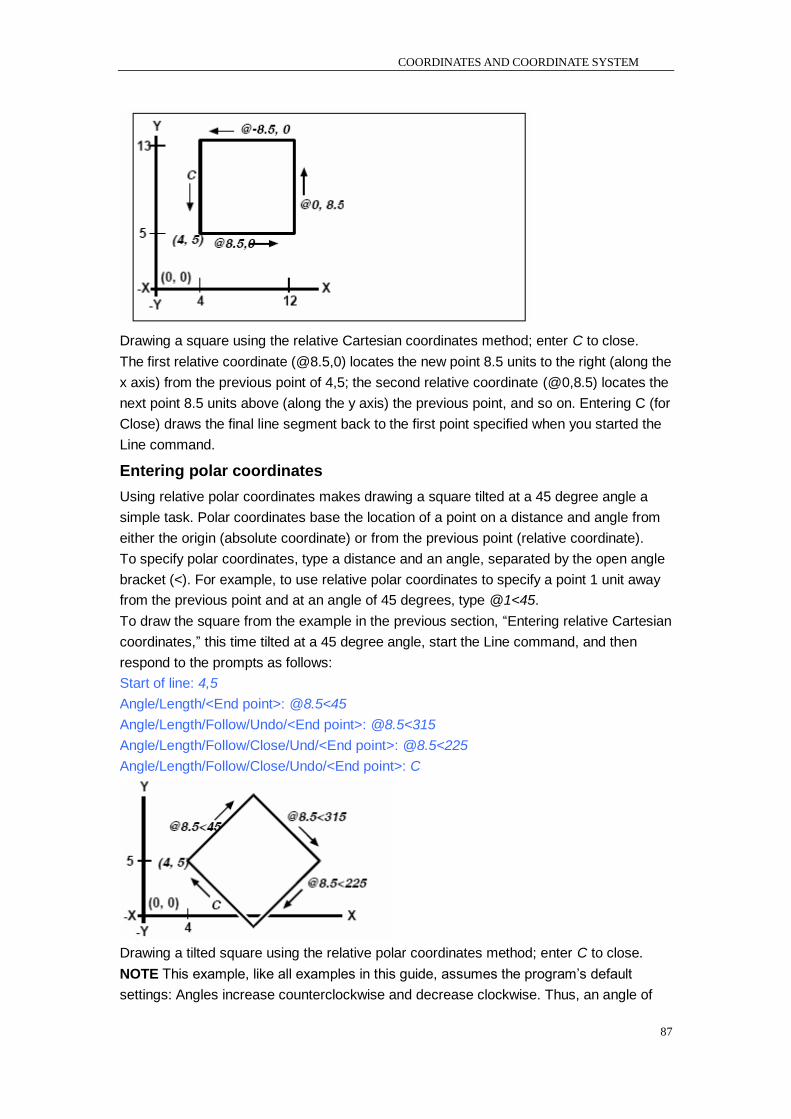
COORDINATES AND COORDINATE SYSTEM
87
Drawing a square using the relative Cartesian coordinates method; enter C to close.
The first relative coordinate (@8.5,0) locates the new point 8.5 units to the right (along the
x axis) from the previous point of 4,5; the second relative coordinate (@0,8.5) locates the
next point 8.5 units above (along the y axis) the previous point, and so on. Entering C (for
Close) draws the final line segment back to the first point specified when you started the
Line command.
Entering polar coordinates
Using relative polar coordinates makes drawing a square tilted at a 45 degree angle a
simple task. Polar coordinates base the location of a point on a distance and angle from
either the origin (absolute coordinate) or from the previous point (relative coordinate).
To specify polar coordinates, type a distance and an angle, separated by the open angle
bracket (<). For example, to use relative polar coordinates to specify a point 1 unit away
from the previous point and at an angle of 45 degrees, type @1<45.
To draw the square from the example in the previous section, ―Entering relative Cartesian
coordinates,‖ this time tilted at a 45 degree angle, start the Line command, and then
respond to the prompts as follows:
Start of line: 4,5
Angle/Length/<End point>: @8.5<45
Angle/Length/Follow/Undo/<End point>: @8.5<315
Angle/Length/Follow/Close/Und/<End point>: @8.5<225
Angle/Length/Follow/Close/Undo/<End point>: C
Drawing a tilted square using the relative polar coordinates method; enter C to close.
NOTE This example, like all examples in this guide, assumes the program‘s default
settings: Angles increase counterclockwise and decrease clockwise. Thus, an angle of
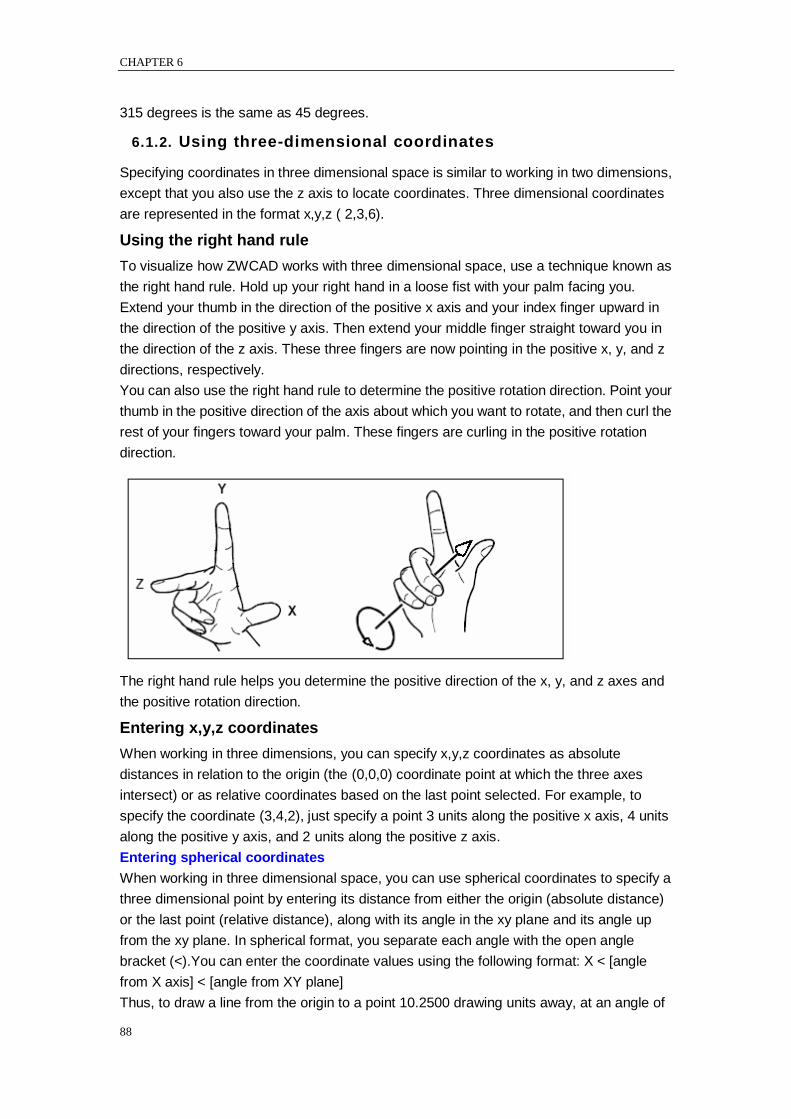
CHAPTER 6
88
315 degrees is the same as 45 degrees.
6.1.2. Using three-dimensional coordinates
Specifying coordinates in three dimensional space is similar to working in two dimensions,
except that you also use the z axis to locate coordinates. Three dimensional coordinates
are represented in the format x,y,z ( 2,3,6).
Using the right hand rule
To visualize how ZWCAD works with three dimensional space, use a technique known as
the right hand rule. Hold up your right hand in a loose fist with your palm facing you.
Extend your thumb in the direction of the positive x axis and your index finger upward in
the direction of the positive y axis. Then extend your middle finger straight toward you in
the direction of the z axis. These three fingers are now pointing in the positive x, y, and z
directions, respectively.
You can also use the right hand rule to determine the positive rotation direction. Point your
thumb in the positive direction of the axis about which you want to rotate, and then curl the
rest of your fingers toward your palm. These fingers are curling in the positive rotation
direction.
The right hand rule helps you determine the positive direction of the x, y, and z axes and
the positive rotation direction.
Entering x,y,z coordinates
When working in three dimensions, you can specify x,y,z coordinates as absolute
distances in relation to the origin (the (0,0,0) coordinate point at which the three axes
intersect) or as relative coordinates based on the last point selected. For example, to
specify the coordinate (3,4,2), just specify a point 3 units along the positive x axis, 4 units
along the positive y axis, and 2 units along the positive z axis.
Entering spherical coordinates
When working in three dimensional space, you can use spherical coordinates to specify a
three dimensional point by entering its distance from either the origin (absolute distance)
or the last point (relative distance), along with its angle in the xy plane and its angle up
from the xy plane. In spherical format, you separate each angle with the open angle
bracket (<).You can enter the coordinate values using the following format: X < [angle
from X axis] < [angle from XY plane]
Thus, to draw a line from the origin to a point 10.2500 drawing units away, at an angle of
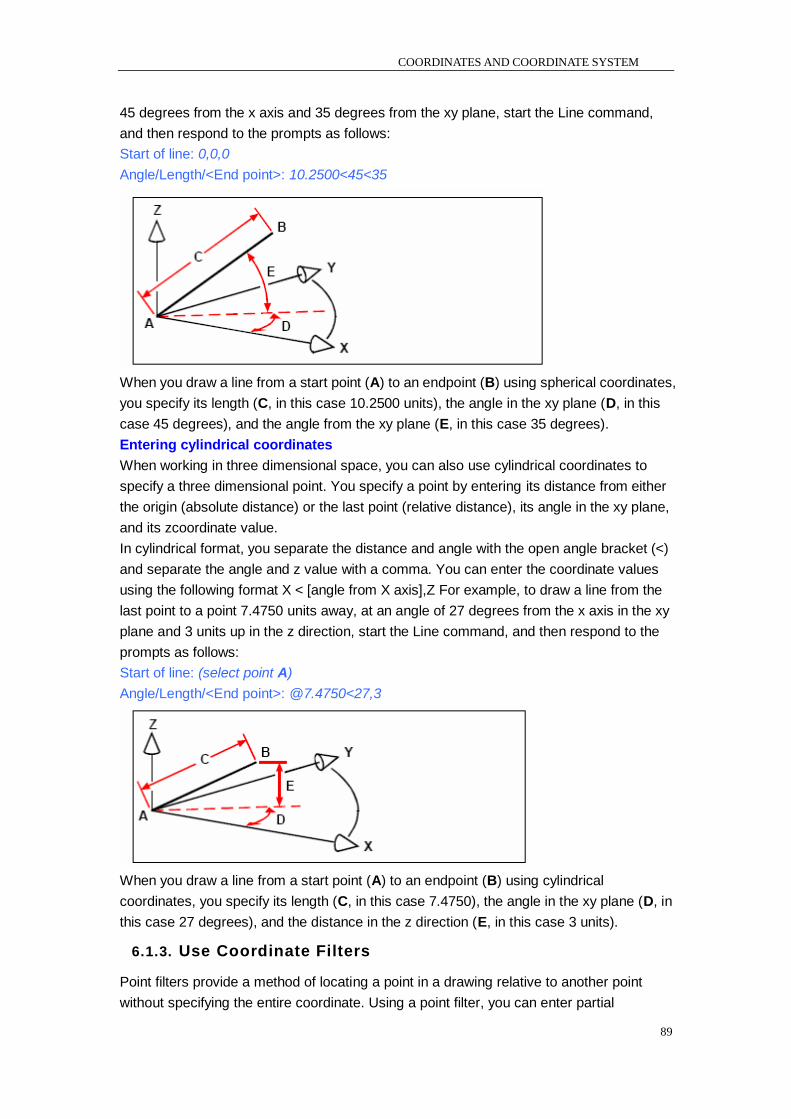
COORDINATES AND COORDINATE SYSTEM
89
45 degrees from the x axis and 35 degrees from the xy plane, start the Line command,
and then respond to the prompts as follows:
Start of line: 0,0,0
Angle/Length/<End point>: 10.2500<45<35
When you draw a line from a start point (A) to an endpoint (B) using spherical coordinates,
you specify its length (C, in this case 10.2500 units), the angle in the xy plane (D, in this
case 45 degrees), and the angle from the xy plane (E, in this case 35 degrees).
Entering cylindrical coordinates
When working in three dimensional space, you can also use cylindrical coordinates to
specify a three dimensional point. You specify a point by entering its distance from either
the origin (absolute distance) or the last point (relative distance), its angle in the xy plane,
and its zcoordinate value.
In cylindrical format, you separate the distance and angle with the open angle bracket (<)
and separate the angle and z value with a comma. You can enter the coordinate values
using the following format X < [angle from X axis],Z For example, to draw a line from the
last point to a point 7.4750 units away, at an angle of 27 degrees from the x axis in the xy
plane and 3 units up in the z direction, start the Line command, and then respond to the
prompts as follows:
Start of line: (select point A)
Angle/Length/<End point>: @7.4750<27,3
When you draw a line from a start point (A) to an endpoint (B) using cylindrical
coordinates, you specify its length (C, in this case 7.4750), the angle in the xy plane (D, in
this case 27 degrees), and the distance in the z direction (E, in this case 3 units).
6.1.3. Use Coordinate Filters
Point filters provide a method of locating a point in a drawing relative to another point
without specifying the entire coordinate. Using a point filter, you can enter partial

CHAPTER 6
90
coordinates, and then the program prompts you for the remaining coordinate information.
To use xyz point filters, respond to the prompt for a coordinate with a filter in the following
form:
.coordinate
where coordinate is one or more of the letters x, y, and z. The program then prompts you
for the filtered coordinate(s). For example, if you type .xy, the program prompts you to
select a point whose xy coordinate you want, and then prompts you for the z coordinate.
The filters .x, .y, .z, .xy, .xz, and .yz are all valid filters.
Using point filters in two dimensions
You can use point filters when you work in two dimensions to locate points in relation to
existing entities. For example, to draw a circle centered in a rectangle, start the Circle
command, and then respond to the prompts as follows:
2Point/3Point/Ttr(tan tan radius)/Arc/Multiple/<Center of circle>: .y
Select Y of: mid
of: (select the left side of the rectangle)
Still need XZ of: mid
of: (select top of the rectangle)
Diameter/<Radius>: (specify radius of circle)
You can use point filters to center the circle by separately selecting the midpoints of two
sides of the rectangle (A and B) and then specifying its radius.
Using point filters in three dimensions
You can use point filters when you work in three dimensional space to locate points in two
dimensions and then specify the z coordinate as the elevation above the xy plane. For
example, to begin drawing a line from a point with a z coordinate 3 units above the center
of a circle, insert the circle, and then start the Line command and respond to the prompts
as follows:
ENTER to use last point/Follow/<Start of line>: .xy
Select XY of: cen
of: (select a point on the circle)
Still need Z of: 3 (locates the starting point 3 units above the center of the circle)
Length of line: (specify the length of the line)
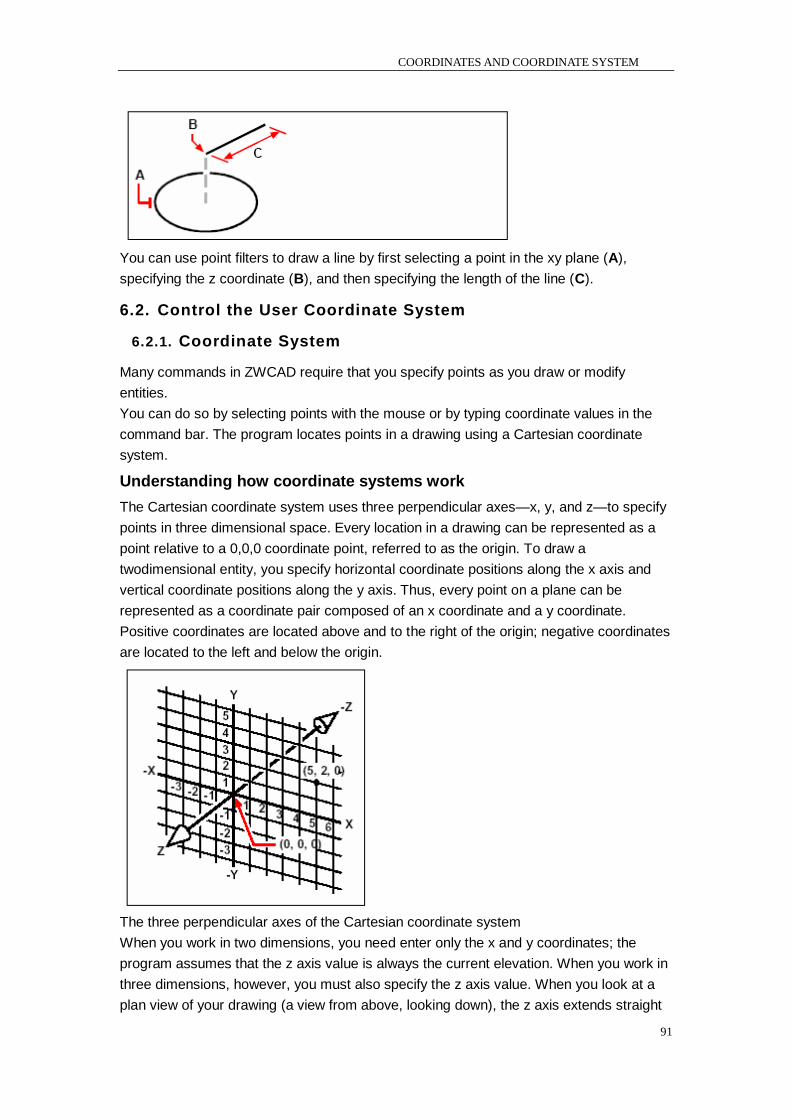
COORDINATES AND COORDINATE SYSTEM
91
You can use point filters to draw a line by first selecting a point in the xy plane (A),
specifying the z coordinate (B), and then specifying the length of the line (C).
6.2. Control the User Coordinate System
6.2.1. Coordinate System
Many commands in ZWCAD require that you specify points as you draw or modify
entities.
You can do so by selecting points with the mouse or by typing coordinate values in the
command bar. The program locates points in a drawing using a Cartesian coordinate
system.
Understanding how coordinate systems work
The Cartesian coordinate system uses three perpendicular axes—x, y, and z—to specify
points in three dimensional space. Every location in a drawing can be represented as a
point relative to a 0,0,0 coordinate point, referred to as the origin. To draw a
twodimensional entity, you specify horizontal coordinate positions along the x axis and
vertical coordinate positions along the y axis. Thus, every point on a plane can be
represented as a coordinate pair composed of an x coordinate and a y coordinate.
Positive coordinates are located above and to the right of the origin; negative coordinates
are located to the left and below the origin.
The three perpendicular axes of the Cartesian coordinate system
When you work in two dimensions, you need enter only the x and y coordinates; the
program assumes that the z axis value is always the current elevation. When you work in
three dimensions, however, you must also specify the z axis value. When you look at a
plan view of your drawing (a view from above, looking down), the z axis extends straight
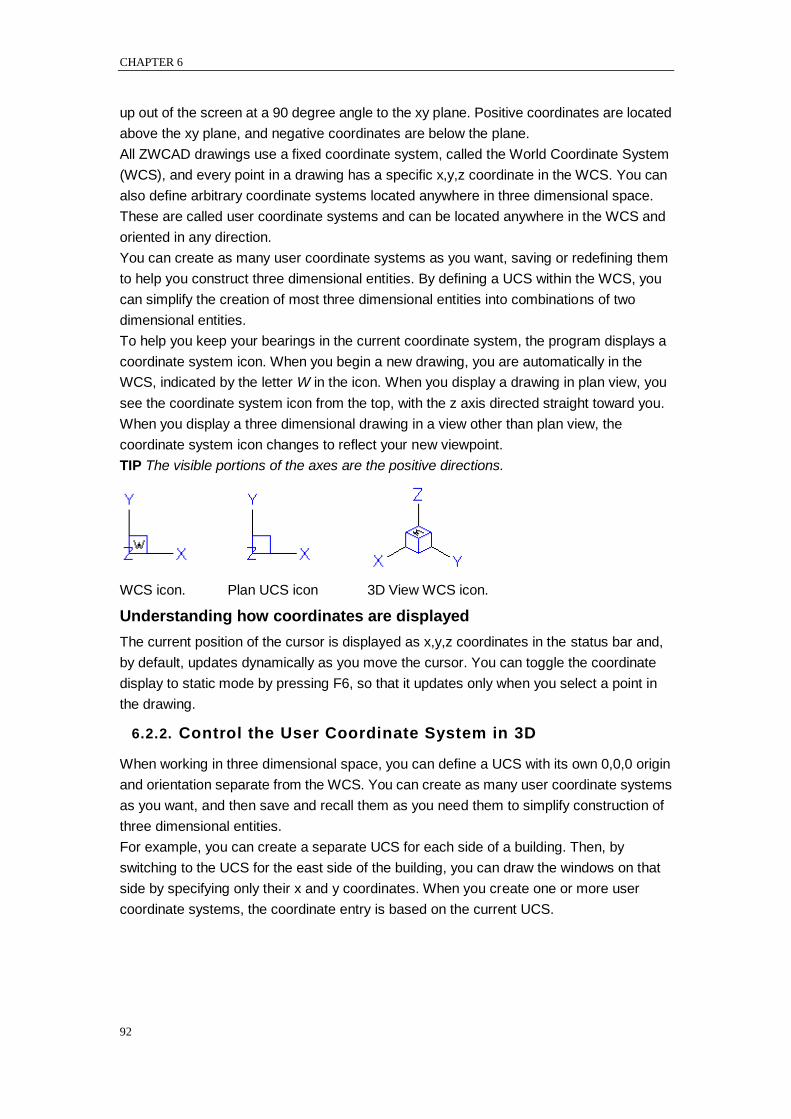
CHAPTER 6
92
up out of the screen at a 90 degree angle to the xy plane. Positive coordinates are located
above the xy plane, and negative coordinates are below the plane.
All ZWCAD drawings use a fixed coordinate system, called the World Coordinate System
(WCS), and every point in a drawing has a specific x,y,z coordinate in the WCS. You can
also define arbitrary coordinate systems located anywhere in three dimensional space.
These are called user coordinate systems and can be located anywhere in the WCS and
oriented in any direction.
You can create as many user coordinate systems as you want, saving or redefining them
to help you construct three dimensional entities. By defining a UCS within the WCS, you
can simplify the creation of most three dimensional entities into combinations of two
dimensional entities.
To help you keep your bearings in the current coordinate system, the program displays a
coordinate system icon. When you begin a new drawing, you are automatically in the
WCS, indicated by the letter W in the icon. When you display a drawing in plan view, you
see the coordinate system icon from the top, with the z axis directed straight toward you.
When you display a three dimensional drawing in a view other than plan view, the
coordinate system icon changes to reflect your new viewpoint.
TIP The visible portions of the axes are the positive directions.
WCS icon. Plan UCS icon 3D View WCS icon.
Understanding how coordinates are displayed
The current position of the cursor is displayed as x,y,z coordinates in the status bar and,
by default, updates dynamically as you move the cursor. You can toggle the coordinate
display to static mode by pressing F6, so that it updates only when you select a point in
the drawing.
6.2.2. Control the User Coordinate System in 3D
When working in three dimensional space, you can define a UCS with its own 0,0,0 origin
and orientation separate from the WCS. You can create as many user coordinate systems
as you want, and then save and recall them as you need them to simplify construction of
three dimensional entities.
For example, you can create a separate UCS for each side of a building. Then, by
switching to the UCS for the east side of the building, you can draw the windows on that
side by specifying only their x and y coordinates. When you create one or more user
coordinate systems, the coordinate entry is based on the current UCS.
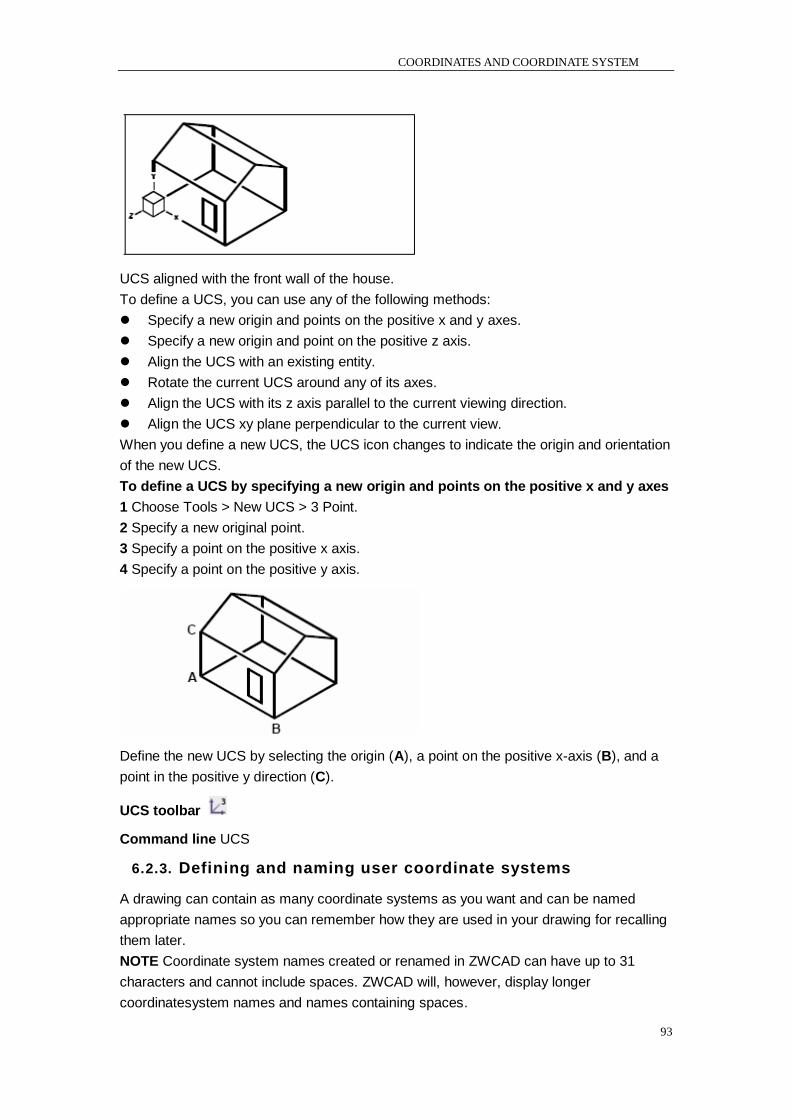
COORDINATES AND COORDINATE SYSTEM
93
UCS aligned with the front wall of the house.
To define a UCS, you can use any of the following methods:
Specify a new origin and points on the positive x and y axes.
Specify a new origin and point on the positive z axis.
Align the UCS with an existing entity.
Rotate the current UCS around any of its axes.
Align the UCS with its z axis parallel to the current viewing direction.
Align the UCS xy plane perpendicular to the current view.
When you define a new UCS, the UCS icon changes to indicate the origin and orientation
of the new UCS.
To define a UCS by specifying a new origin and points on the positive x and y axes
1 Choose Tools > New UCS > 3 Point.
2 Specify a new original point.
3 Specify a point on the positive x axis.
4 Specify a point on the positive y axis.
Define the new UCS by selecting the origin (A), a point on the positive x-axis (B), and a
point in the positive y direction (C).
UCS toolbar
Command line UCS
6.2.3. Defining and naming user coordinate systems
A drawing can contain as many coordinate systems as you want and can be named
appropriate names so you can remember how they are used in your drawing for recalling
them later.
NOTE Coordinate system names created or renamed in ZWCAD can have up to 31
characters and cannot include spaces. ZWCAD will, however, display longer
coordinatesystem names and names containing spaces.
CHAPTER 6
94
Define new user coordinate systems
1 Choose Tools > NEW UCS.
2 Choose which type for creating UCS.
3 Create UCS depending on the prompts.
UCS toolbar
Command line UCS
To change a user coordinate system name in the current drawing
1 Choose Tools > Named UCS.
2 Right-click the desired UCS name and select Rename.
3 Type a new name
4 Click OK button.
UCS toolbar
Command line DDUCS
6.2.4. Setting the current user coordinate system
When you draw new objects, they are created in relation to the current coordinate system.
Set the current UCS
1 Choose Tools > Named UCS.
2 Select the desired UCS and press Set Current button.
3 Click OK button.
UCS toolbar
Command line DDUCS
6.2.5. Use UCS Presets
ZWCAD lets you select a preset UCS. The six planes defined by looking along the x,y,z
axes align the UCS with the top, left, front, bottom, right, or back, based on either the
WCS or the current UCS in effect when you select the tool. You can also select the
previous UCS, align the UCS to the current view, or select the WCS.
When you select a UCS, the cursor orientation and UCS icon change to reflect the new
UCS.
The display does not change, however, unless you select the Change View To Plan View
Of The Selected UCS check box.
After you align the UCS to a preset UCS, you can use ―Named UCS‖ from the Tools menu
to save the current UCS.
To select a preset UCS
1 Choose Tools > Named UCS.
2 Choose Orthographic UCS tab and select the desired UCS, then click Set Current
button.
3 Click OK button.
UCS toolbar
Command line DDUCS
6.2.6. Control the User Coordinate System
COORDINATES AND COORDINATE SYSTEM
95
You can use the user coordinate system for convenient coordinate entry and to establish
drawing planes.
Control the User Coordinate System (UCS) in 2D
In ZWCAD, there are two coordinate systems: world coordinate system (WCS) and user
coordinate system (UCS). WCS is a fixed coordinate system, where the X axis is
horizontal and the Y axis is vertical. The origin (0, 0) is the intersection of the X and Y axes
in the lower-left corner of the drawing. You can define a UCS based on a WCS. UCS can
be moved, which helps you modify particular sections of your drawing easily. At the same
time, you can rotate UCS to specify points in 3D or rotated views. When you rotate UCS,
Snap, Grid, and Ortho modes all rotate in line with the new UCS.
Actually, you enter coordinate value in the current UCS. There are several methods for
relocating UCS, shown as follows:
Move the UCS by defining a new origin.
Align the UCS with an existing object or with the current viewing direction.
Rotate the current UCS around any of its axes.
Restore a saved UCS.
You can name a defined UCS and then restore it when needed. The UCS Previous option
can reverse up to last 10 coordinate systems in the current session. You can delete a
named UCS whenever you do not need it. A UCS can also be restored to coincide with the
WCS.
Use World and User Coordinate Systems in 3D
It is helpful for creating 3D model by controlling the UCS.
Use World and User Coordinate Systems
In 3D space, there is both a fixed WCS and a movable UCS.
When you work in 3D, the movable UCS can help you enter coordinate, establish drawing
planes, and set views easily. Neither moving nor rotating UCS changes your viewport.
The only changes are the orientation and tilt of the coordinate system.
When you work in 3D, you can simplify the creation of 3D objects by relocating the UCS.
To relocate the UCS, change the location of the origin point and the orientation of the XY
plane and the Z axis. In 3D space, you can locate and orient a UCS anywhere.
Only one UCS can be made the current coordinate system at any given time, and all
coordinate input and display is relative to the current UCS. If you open multiple viewports,
the current UCS applies to all of them. If the system variable UCSVP is on, you can save a
UCS along with a viewport, and automatically restoring the UCS each time when you
make the viewport current.
To draw in 3D space, you need to specify X, Y, and Z coordinate value in either the WCS
or UCS. The following figure displays the X, Y, and Z axes of the WCS.
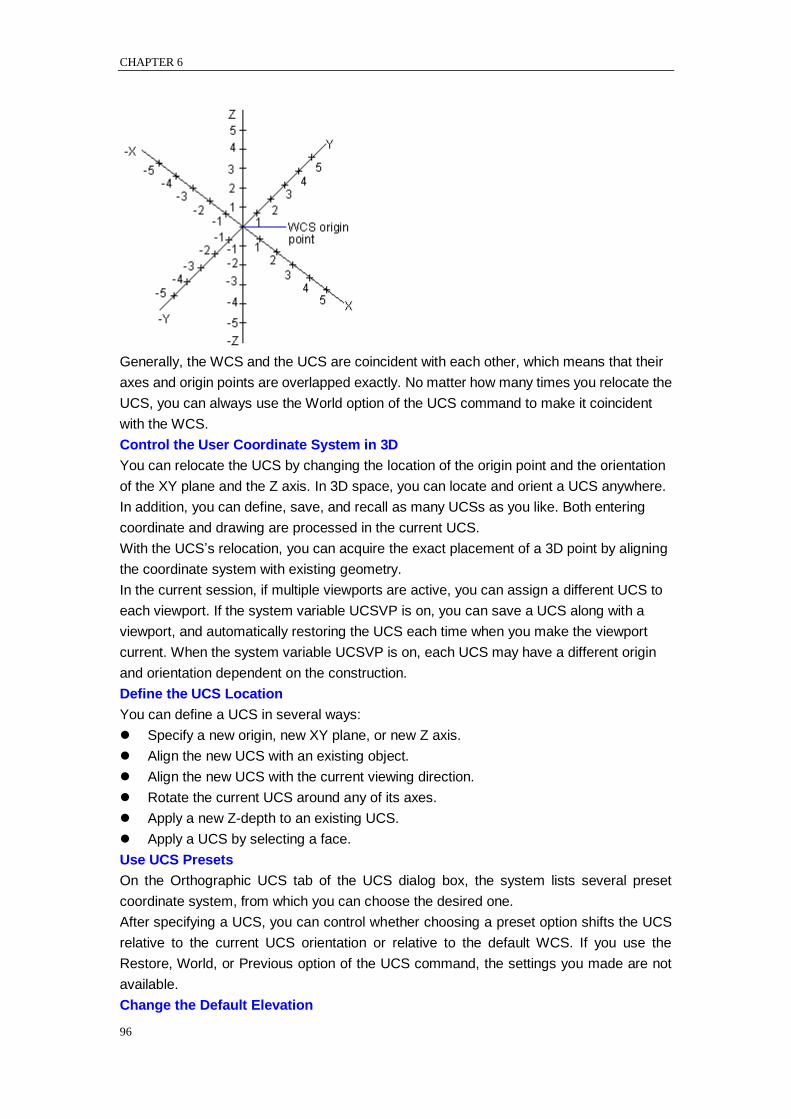
CHAPTER 6
96
Generally, the WCS and the UCS are coincident with each other, which means that their
axes and origin points are overlapped exactly. No matter how many times you relocate the
UCS, you can always use the World option of the UCS command to make it coincident
with the WCS.
Control the User Coordinate System in 3D
You can relocate the UCS by changing the location of the origin point and the orientation
of the XY plane and the Z axis. In 3D space, you can locate and orient a UCS anywhere.
In addition, you can define, save, and recall as many UCSs as you like. Both entering
coordinate and drawing are processed in the current UCS.
With the UCS‘s relocation, you can acquire the exact placement of a 3D point by aligning
the coordinate system with existing geometry.
In the current session, if multiple viewports are active, you can assign a different UCS to
each viewport. If the system variable UCSVP is on, you can save a UCS along with a
viewport, and automatically restoring the UCS each time when you make the viewport
current. When the system variable UCSVP is on, each UCS may have a different origin
and orientation dependent on the construction.
Define the UCS Location
You can define a UCS in several ways:
Specify a new origin, new XY plane, or new Z axis.
Align the new UCS with an existing object.
Align the new UCS with the current viewing direction.
Rotate the current UCS around any of its axes.
Apply a new Z-depth to an existing UCS.
Apply a UCS by selecting a face.
Use UCS Presets
On the Orthographic UCS tab of the UCS dialog box, the system lists several preset
coordinate system, from which you can choose the desired one.
After specifying a UCS, you can control whether choosing a preset option shifts the UCS
relative to the current UCS orientation or relative to the default WCS. If you use the
Restore, World, or Previous option of the UCS command, the settings you made are not
available.
Change the Default Elevation

COORDINATES AND COORDINATE SYSTEM
97
The ELEV command is used to specify an elevation and thickness of extrusion for a new
object. You can define a drawing plane of the current UCS by establishing the current
elevation, which can be applied to individual viewports in conjunction with the system
variable UCSVP. Whether a UCS is saved or restored in each viewport are determined by
this variable. When UCSVP is set to 1, the different UCS settings are saved in individual
viewports, and the elevation settings are saved along with each viewport both in model
space and in paper space layouts.
Generally, the elevation is set to 0, and you can control the XY plane of the current UCS
using UCS command.
Change the UCS in Paper Space
Just as you define a new UCS in model space, you can also define a new UCS in paper
space; however, the UCSs in paper space are only available for 2D manipulation.
Although you can enter 3D coordinates in paper space, 3D viewing commands are not
available, such as DVIEW, PLAN, and VPOINT.
The system can store the last 10 coordinate systems that were created in model space
and the last 10 in paper space, and you can restore to the desired one using the Previous
option of the UCS command.
Save and Restore UCS Locations by Name
You can save named UCS locations, each having a different origin and orientation, for
various construction requirements. You can relocate, save, and recall as many UCS
orientations as you require.
Assign User Coordinate System Orientations to Viewports
You can create multiple viewports to display different views of your model. For example,
you can specify top, front, right side, and isometric views for viewports. You can also
define a different UCS for each view to facilitate modifying objects in different views.
When you make a viewport current, you can use the same UCS you used the last time
that the viewport was current.
The system variable UCSVP controls the UCS in each viewport. When UCSVP is on in a
viewport, the system saves the viewport with the UCS last used in that viewport and
restores the UCS as the viewport is made current again. When UCSVP is set to 0 in a
viewport, its UCS is coincident with the UCS in the current viewport.
For example, you can set up three viewports: a top view, front view, and isometric view. If
UCSVP is set to 0 in the isometric viewport, the Top UCS can be applied to both the top
viewport and the isometric viewport. When the top viewport is made current, the isometric
viewport‘s UCS reflects the UCS top viewport. Likewise, if you make the front viewport
current, the isometric viewport's UCS is switched to match that of the front viewport.
The following figure indicates the instance illustrated above. In which the drawing 1
reflects isometric viewport of top-left or top viewports in current UCS.
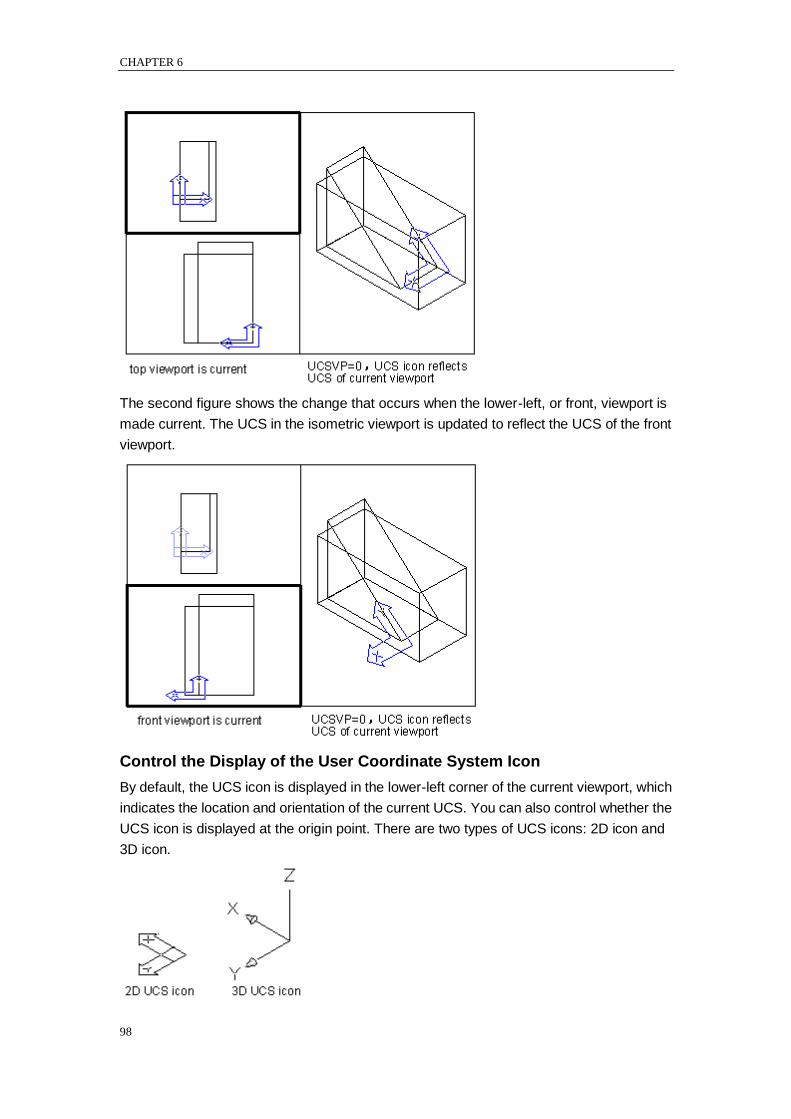
CHAPTER 6
98
The second figure shows the change that occurs when the lower-left, or front, viewport is
made current. The UCS in the isometric viewport is updated to reflect the UCS of the front
viewport.
Control the Display of the User Coordinate System Icon
By default, the UCS icon is displayed in the lower-left corner of the current viewport, which
indicates the location and orientation of the current UCS. You can also control whether the
UCS icon is displayed at the origin point. There are two types of UCS icons: 2D icon and
3D icon.
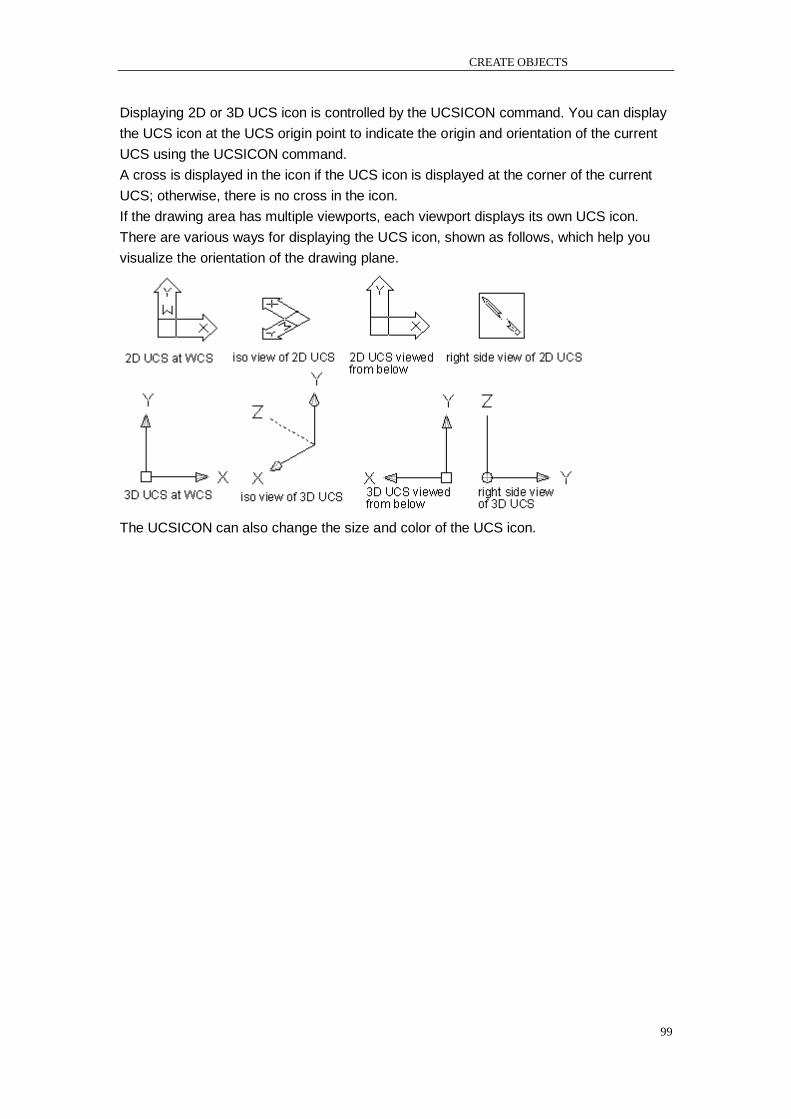
CREATE OBJECTS
99
Displaying 2D or 3D UCS icon is controlled by the UCSICON command. You can display
the UCS icon at the UCS origin point to indicate the origin and orientation of the current
UCS using the UCSICON command.
A cross is displayed in the icon if the UCS icon is displayed at the corner of the current
UCS; otherwise, there is no cross in the icon.
If the drawing area has multiple viewports, each viewport displays its own UCS icon.
There are various ways for displaying the UCS icon, shown as follows, which help you
visualize the orientation of the drawing plane.
The UCSICON can also change the size and color of the UCS icon.
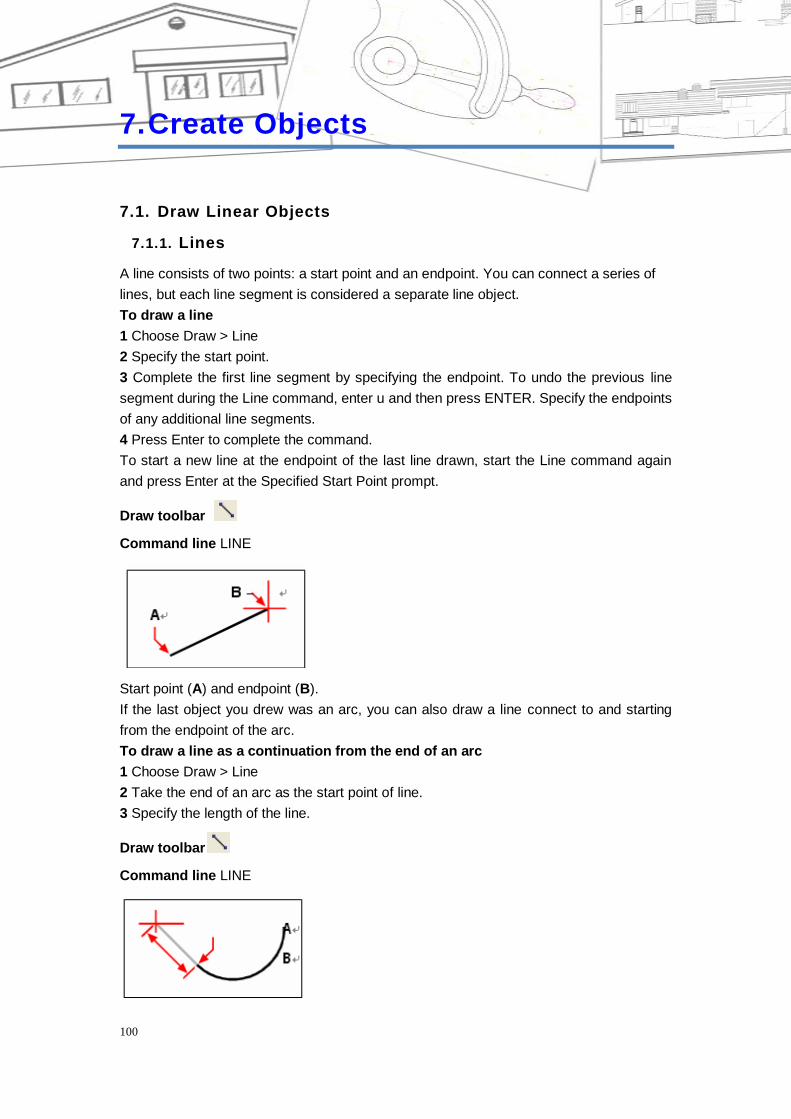
CHAPTER 7
100
7. Create Objects
7.1. Draw Linear Objects
7.1.1. Lines
A line consists of two points: a start point and an endpoint. You can connect a series of
lines, but each line segment is considered a separate line object.
To draw a line
1 Choose Draw > Line
2 Specify the start point.
3 Complete the first line segment by specifying the endpoint. To undo the previous line
segment during the Line command, enter u and then press ENTER. Specify the endpoints
of any additional line segments.
4 Press Enter to complete the command.
To start a new line at the endpoint of the last line drawn, start the Line command again
and press Enter at the Specified Start Point prompt.
Draw toolbar
Command line LINE
Start point (A) and endpoint (B).
If the last object you drew was an arc, you can also draw a line connect to and starting
from the endpoint of the arc.
To draw a line as a continuation from the end of an arc
1 Choose Draw > Line
2 Take the end of an arc as the start point of line.
3 Specify the length of the line.
Draw toolbar
Command line LINE
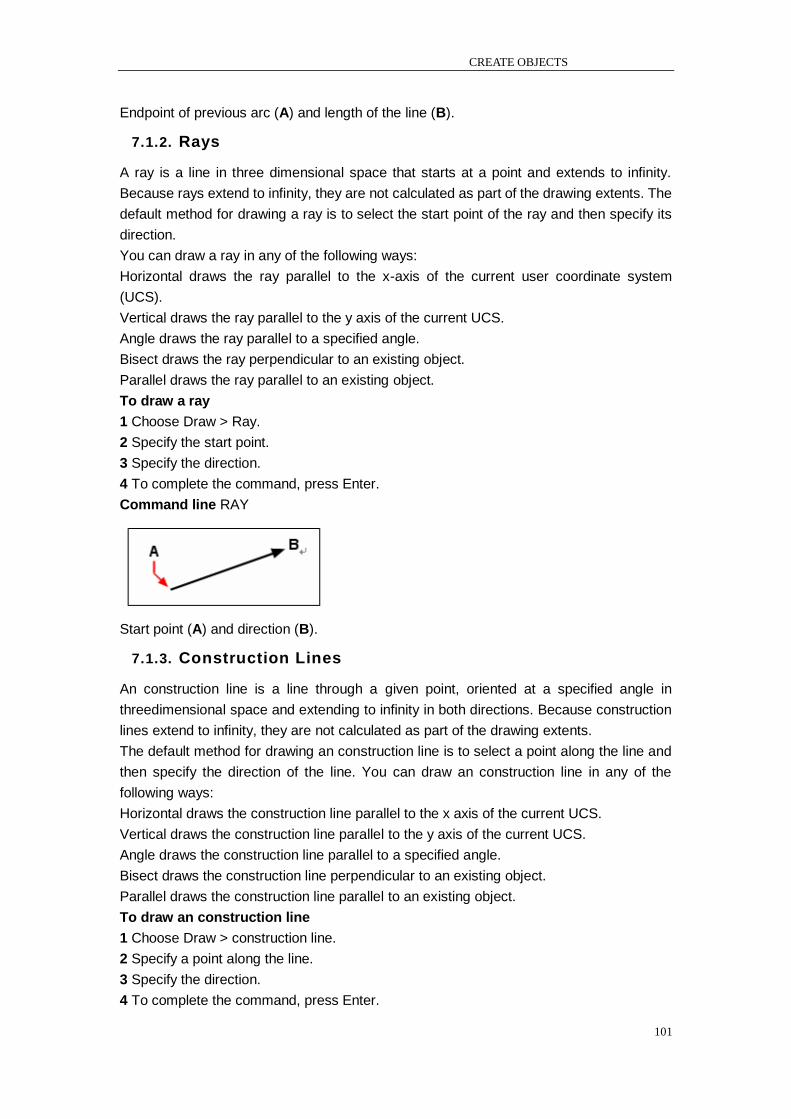
CREATE OBJECTS
101
Endpoint of previous arc (A) and length of the line (B).
7.1.2. Rays
A ray is a line in three dimensional space that starts at a point and extends to infinity.
Because rays extend to infinity, they are not calculated as part of the drawing extents. The
default method for drawing a ray is to select the start point of the ray and then specify its
direction.
You can draw a ray in any of the following ways:
Horizontal draws the ray parallel to the x-axis of the current user coordinate system
(UCS).
Vertical draws the ray parallel to the y axis of the current UCS.
Angle draws the ray parallel to a specified angle.
Bisect draws the ray perpendicular to an existing object.
Parallel draws the ray parallel to an existing object.
To draw a ray
1 Choose Draw > Ray.
2 Specify the start point.
3 Specify the direction.
4 To complete the command, press Enter.
Command line RAY
Start point (A) and direction (B).
7.1.3. Construction Lines
An construction line is a line through a given point, oriented at a specified angle in
threedimensional space and extending to infinity in both directions. Because construction
lines extend to infinity, they are not calculated as part of the drawing extents.
The default method for drawing an construction line is to select a point along the line and
then specify the direction of the line. You can draw an construction line in any of the
following ways:
Horizontal draws the construction line parallel to the x axis of the current UCS.
Vertical draws the construction line parallel to the y axis of the current UCS.
Angle draws the construction line parallel to a specified angle.
Bisect draws the construction line perpendicular to an existing object.
Parallel draws the construction line parallel to an existing object.
To draw an construction line
1 Choose Draw > construction line.
2 Specify a point along the line.
3 Specify the direction.
4 To complete the command, press Enter.
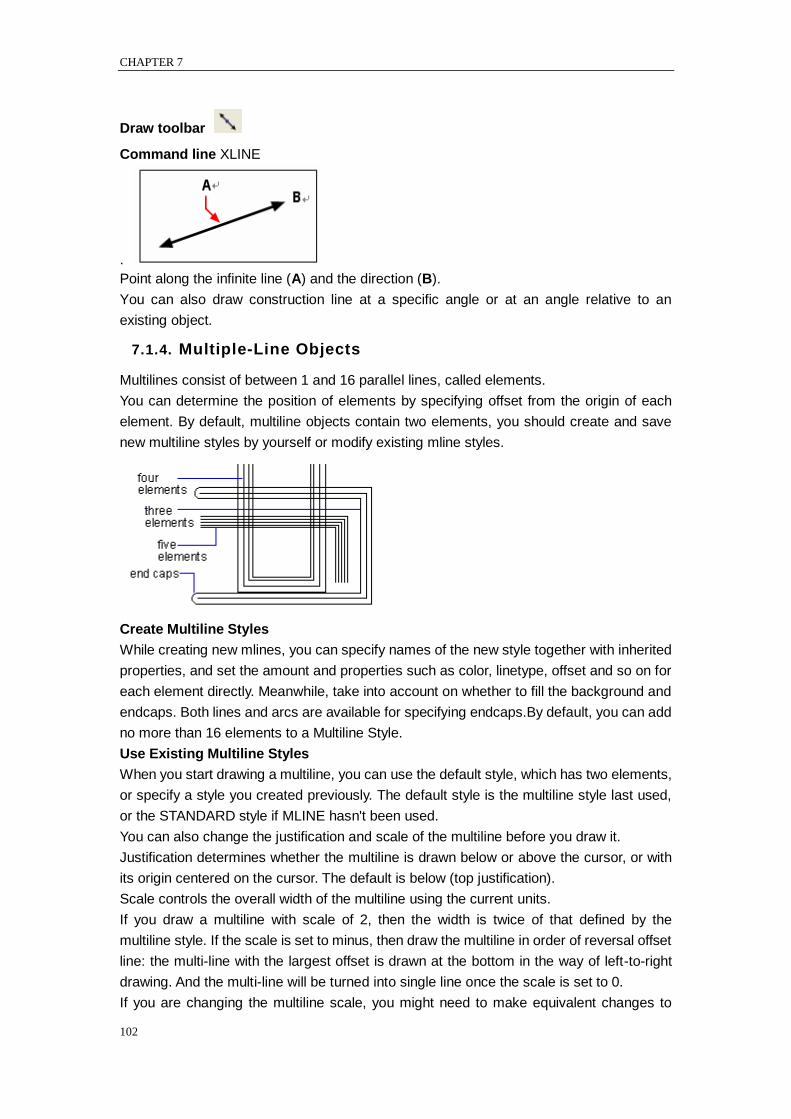
CHAPTER 7
102
Draw toolbar
Command line XLINE
.
Point along the infinite line (A) and the direction (B).
You can also draw construction line at a specific angle or at an angle relative to an
existing object.
7.1.4. Multiple-Line Objects
Multilines consist of between 1 and 16 parallel lines, called elements.
You can determine the position of elements by specifying offset from the origin of each
element. By default, multiline objects contain two elements, you should create and save
new multiline styles by yourself or modify existing mline styles.
Create Multiline Styles
While creating new mlines, you can specify names of the new style together with inherited
properties, and set the amount and properties such as color, linetype, offset and so on for
each element directly. Meanwhile, take into account on whether to fill the background and
endcaps. Both lines and arcs are available for specifying endcaps.By default, you can add
no more than 16 elements to a Multiline Style.
Use Existing Multiline Styles
When you start drawing a multiline, you can use the default style, which has two elements,
or specify a style you created previously. The default style is the multiline style last used,
or the STANDARD style if MLINE hasn't been used.
You can also change the justification and scale of the multiline before you draw it.
Justification determines whether the multiline is drawn below or above the cursor, or with
its origin centered on the cursor. The default is below (top justification).
Scale controls the overall width of the multiline using the current units.
If you draw a multiline with scale of 2, then the width is twice of that defined by the
multiline style. If the scale is set to minus, then draw the multiline in order of reversal offset
line: the multi-line with the largest offset is drawn at the bottom in the way of left-to-right
drawing. And the multi-line will be turned into single line once the scale is set to 0.
If you are changing the multiline scale, you might need to make equivalent changes to
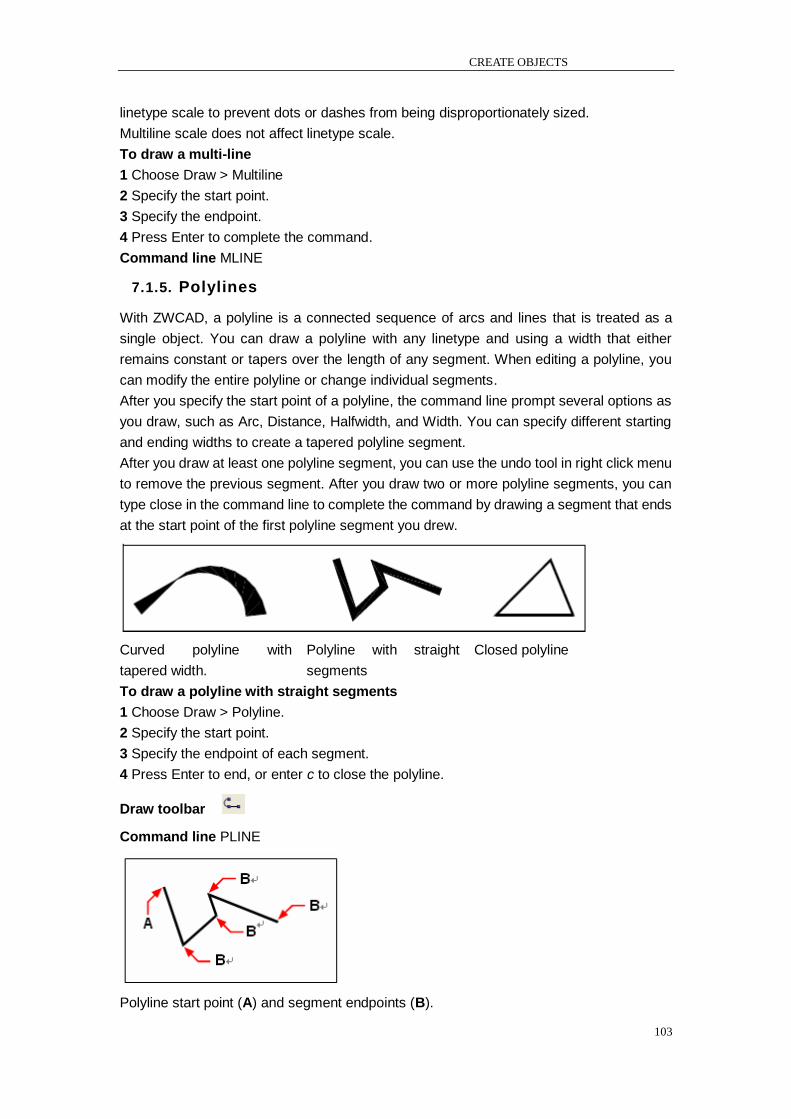
CREATE OBJECTS
103
linetype scale to prevent dots or dashes from being disproportionately sized.
Multiline scale does not affect linetype scale.
To draw a multi-line
1 Choose Draw > Multiline
2 Specify the start point.
3 Specify the endpoint.
4 Press Enter to complete the command.
Command line MLINE
7.1.5. Polylines
With ZWCAD, a polyline is a connected sequence of arcs and lines that is treated as a
single object. You can draw a polyline with any linetype and using a width that either
remains constant or tapers over the length of any segment. When editing a polyline, you
can modify the entire polyline or change individual segments.
After you specify the start point of a polyline, the command line prompt several options as
you draw, such as Arc, Distance, Halfwidth, and Width. You can specify different starting
and ending widths to create a tapered polyline segment.
After you draw at least one polyline segment, you can use the undo tool in right click menu
to remove the previous segment. After you draw two or more polyline segments, you can
type close in the command line to complete the command by drawing a segment that ends
at the start point of the first polyline segment you drew.
Curved polyline with
tapered width.
Polyline with straight
segments
Closed polyline
To draw a polyline with straight segments
1 Choose Draw > Polyline.
2 Specify the start point.
3 Specify the endpoint of each segment.
4 Press Enter to end, or enter c to close the polyline.
Draw toolbar
Command line PLINE
Polyline start point (A) and segment endpoints (B).
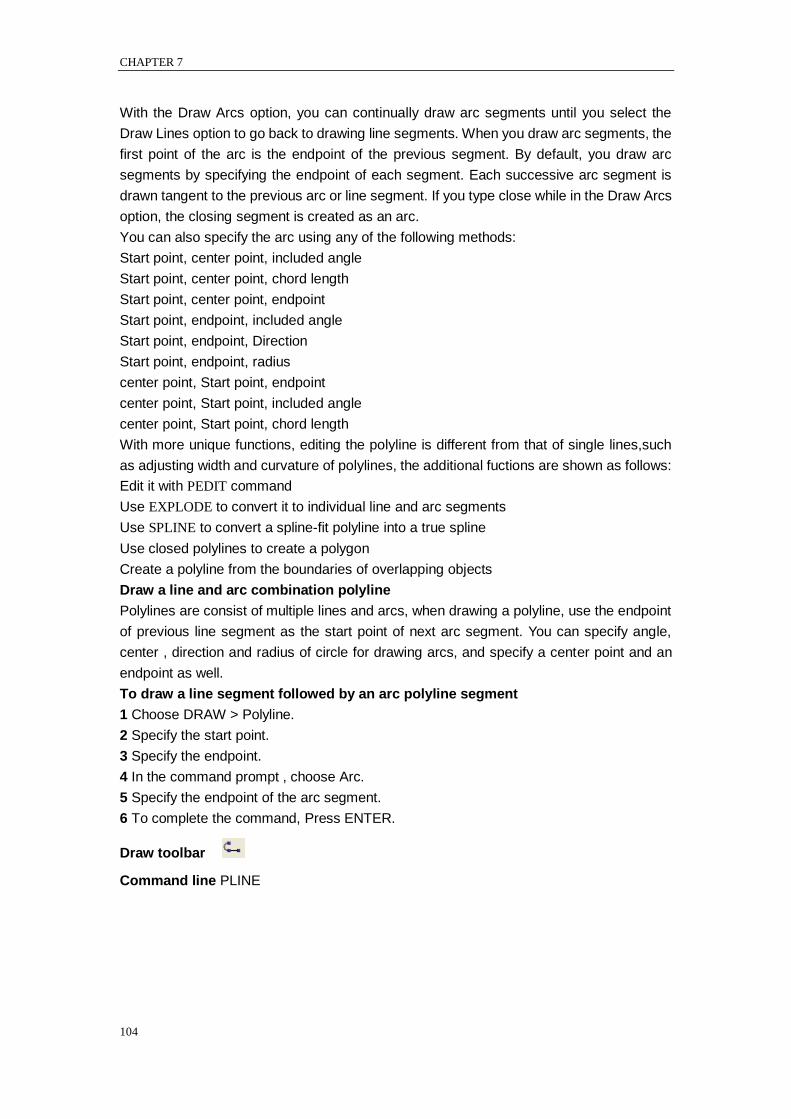
CHAPTER 7
104
With the Draw Arcs option, you can continually draw arc segments until you select the
Draw Lines option to go back to drawing line segments. When you draw arc segments, the
first point of the arc is the endpoint of the previous segment. By default, you draw arc
segments by specifying the endpoint of each segment. Each successive arc segment is
drawn tangent to the previous arc or line segment. If you type close while in the Draw Arcs
option, the closing segment is created as an arc.
You can also specify the arc using any of the following methods:
Start point, center point, included angle
Start point, center point, chord length
Start point, center point, endpoint
Start point, endpoint, included angle
Start point, endpoint, Direction
Start point, endpoint, radius
center point, Start point, endpoint
center point, Start point, included angle
center point, Start point, chord length
With more unique functions, editing the polyline is different from that of single lines,such
as adjusting width and curvature of polylines, the additional fuctions are shown as follows:
Edit it with PEDIT command
Use EXPLODE to convert it to individual line and arc segments
Use SPLINE to convert a spline-fit polyline into a true spline
Use closed polylines to create a polygon
Create a polyline from the boundaries of overlapping objects
Draw a line and arc combination polyline
Polylines are consist of multiple lines and arcs, when drawing a polyline, use the endpoint
of previous line segment as the start point of next arc segment. You can specify angle,
center , direction and radius of circle for drawing arcs, and specify a center point and an
endpoint as well.
To draw a line segment followed by an arc polyline segment
1 Choose DRAW > Polyline.
2 Specify the start point.
3 Specify the endpoint.
4 In the command prompt , choose Arc.
5 Specify the endpoint of the arc segment.
6 To complete the command, Press ENTER.
Draw toolbar
Command line PLINE
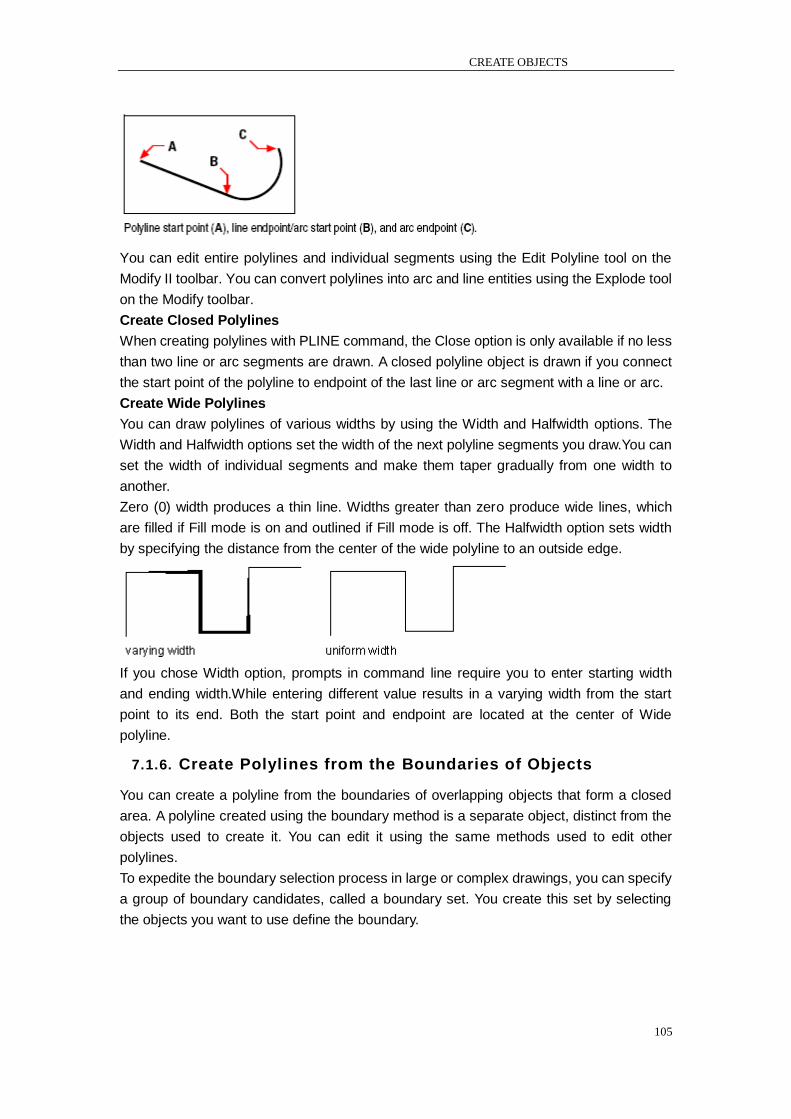
CREATE OBJECTS
105
You can edit entire polylines and individual segments using the Edit Polyline tool on the
Modify II toolbar. You can convert polylines into arc and line entities using the Explode tool
on the Modify toolbar.
Create Closed Polylines
When creating polylines with PLINE command, the Close option is only available if no less
than two line or arc segments are drawn. A closed polyline object is drawn if you connect
the start point of the polyline to endpoint of the last line or arc segment with a line or arc.
Create Wide Polylines
You can draw polylines of various widths by using the Width and Halfwidth options. The
Width and Halfwidth options set the width of the next polyline segments you draw.You can
set the width of individual segments and make them taper gradually from one width to
another.
Zero (0) width produces a thin line. Widths greater than zero produce wide lines, which
are filled if Fill mode is on and outlined if Fill mode is off. The Halfwidth option sets width
by specifying the distance from the center of the wide polyline to an outside edge.
If you chose Width option, prompts in command line require you to enter starting width
and ending width.While entering different value results in a varying width from the start
point to its end. Both the start point and endpoint are located at the center of Wide
polyline.
7.1.6. Create Polylines from the Boundaries of Objects
You can create a polyline from the boundaries of overlapping objects that form a closed
area. A polyline created using the boundary method is a separate object, distinct from the
objects used to create it. You can edit it using the same methods used to edit other
polylines.
To expedite the boundary selection process in large or complex drawings, you can specify
a group of boundary candidates, called a boundary set. You create this set by selecting
the objects you want to use define the boundary.
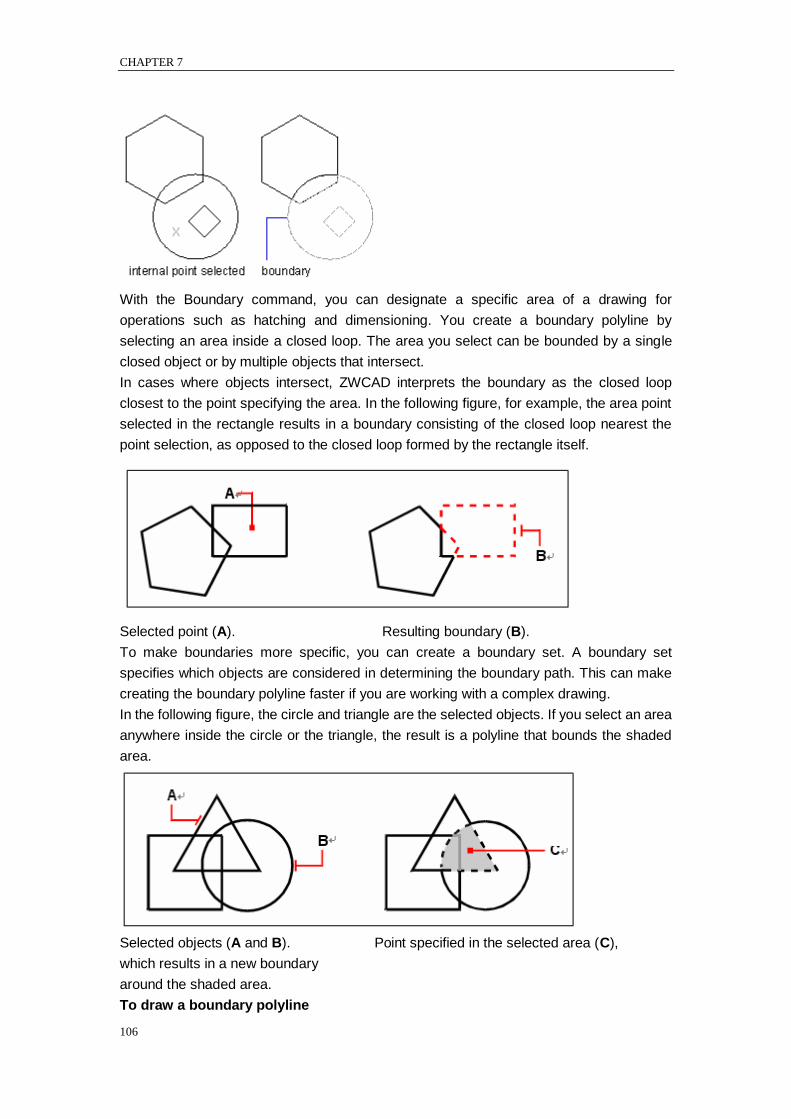
CHAPTER 7
106
With the Boundary command, you can designate a specific area of a drawing for
operations such as hatching and dimensioning. You create a boundary polyline by
selecting an area inside a closed loop. The area you select can be bounded by a single
closed object or by multiple objects that intersect.
In cases where objects intersect, ZWCAD interprets the boundary as the closed loop
closest to the point specifying the area. In the following figure, for example, the area point
selected in the rectangle results in a boundary consisting of the closed loop nearest the
point selection, as opposed to the closed loop formed by the rectangle itself.
Selected point (A). Resulting boundary (B).
To make boundaries more specific, you can create a boundary set. A boundary set
specifies which objects are considered in determining the boundary path. This can make
creating the boundary polyline faster if you are working with a complex drawing.
In the following figure, the circle and triangle are the selected objects. If you select an area
anywhere inside the circle or the triangle, the result is a polyline that bounds the shaded
area.
Selected objects (A and B). Point specified in the selected area (C),
which results in a new boundary
around the shaded area.
To draw a boundary polyline
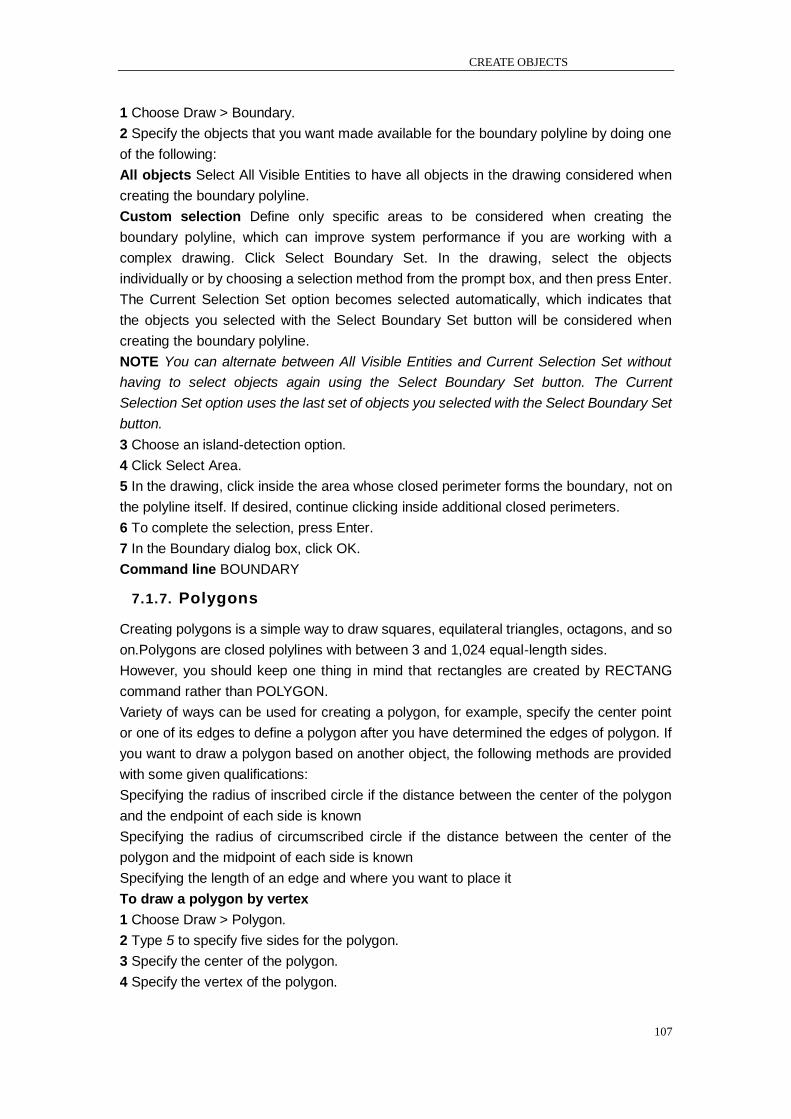
CREATE OBJECTS
107
1 Choose Draw > Boundary.
2 Specify the objects that you want made available for the boundary polyline by doing one
of the following:
All objects Select All Visible Entities to have all objects in the drawing considered when
creating the boundary polyline.
Custom selection Define only specific areas to be considered when creating the
boundary polyline, which can improve system performance if you are working with a
complex drawing. Click Select Boundary Set. In the drawing, select the objects
individually or by choosing a selection method from the prompt box, and then press Enter.
The Current Selection Set option becomes selected automatically, which indicates that
the objects you selected with the Select Boundary Set button will be considered when
creating the boundary polyline.
NOTE You can alternate between All Visible Entities and Current Selection Set without
having to select objects again using the Select Boundary Set button. The Current
Selection Set option uses the last set of objects you selected with the Select Boundary Set
button.
3 Choose an island-detection option.
4 Click Select Area.
5 In the drawing, click inside the area whose closed perimeter forms the boundary, not on
the polyline itself. If desired, continue clicking inside additional closed perimeters.
6 To complete the selection, press Enter.
7 In the Boundary dialog box, click OK.
Command line BOUNDARY
7.1.7. Polygons
Creating polygons is a simple way to draw squares, equilateral triangles, octagons, and so
on.Polygons are closed polylines with between 3 and 1,024 equal-length sides.
However, you should keep one thing in mind that rectangles are created by RECTANG
command rather than POLYGON.
Variety of ways can be used for creating a polygon, for example, specify the center point
or one of its edges to define a polygon after you have determined the edges of polygon. If
you want to draw a polygon based on another object, the following methods are provided
with some given qualifications:
Specifying the radius of inscribed circle if the distance between the center of the polygon
and the endpoint of each side is known
Specifying the radius of circumscribed circle if the distance between the center of the
polygon and the midpoint of each side is known
Specifying the length of an edge and where you want to place it
To draw a polygon by vertex
1 Choose Draw > Polygon.
2 Type 5 to specify five sides for the polygon.
3 Specify the center of the polygon.
4 Specify the vertex of the polygon.
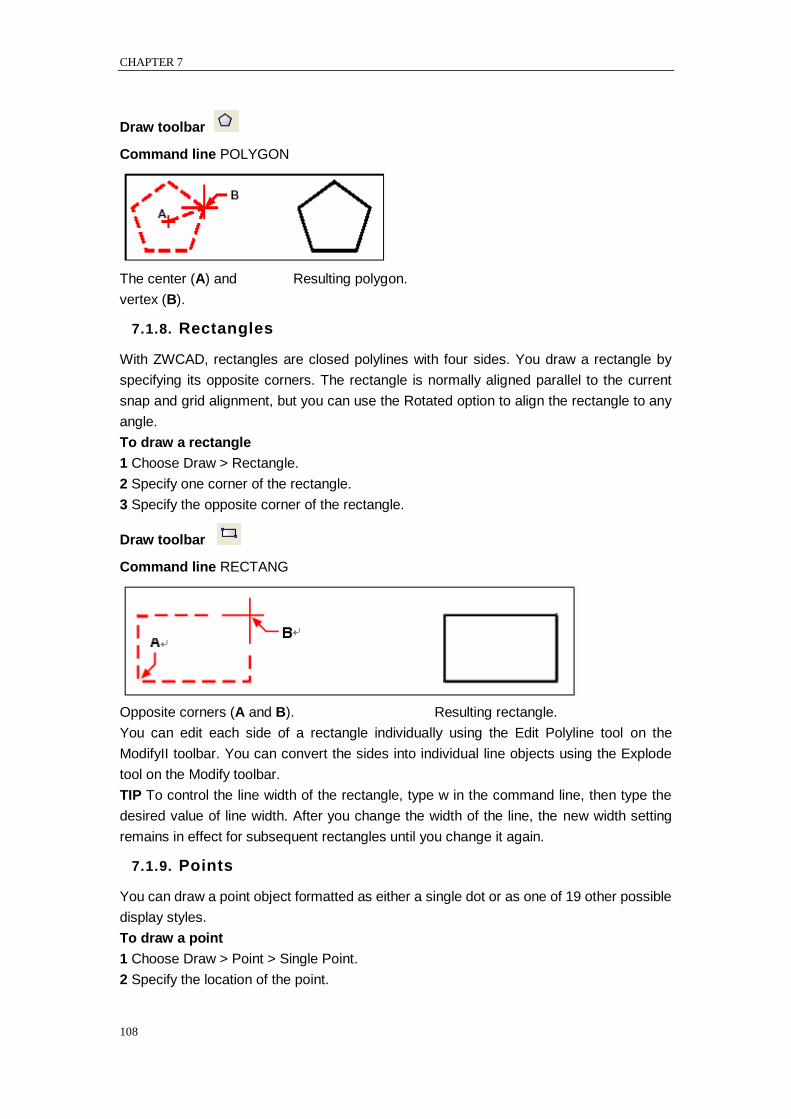
CHAPTER 7
108
Draw toolbar
Command line POLYGON
The center (A) and Resulting polygon.
vertex (B).
7.1.8. Rectangles
With ZWCAD, rectangles are closed polylines with four sides. You draw a rectangle by
specifying its opposite corners. The rectangle is normally aligned parallel to the current
snap and grid alignment, but you can use the Rotated option to align the rectangle to any
angle.
To draw a rectangle
1 Choose Draw > Rectangle.
2 Specify one corner of the rectangle.
3 Specify the opposite corner of the rectangle.
Draw toolbar
Command line RECTANG
Opposite corners (A and B). Resulting rectangle.
You can edit each side of a rectangle individually using the Edit Polyline tool on the
ModifyII toolbar. You can convert the sides into individual line objects using the Explode
tool on the Modify toolbar.
TIP To control the line width of the rectangle, type w in the command line, then type the
desired value of line width. After you change the width of the line, the new width setting
remains in effect for subsequent rectangles until you change it again.
7.1.9. Points
You can draw a point object formatted as either a single dot or as one of 19 other possible
display styles.
To draw a point
1 Choose Draw > Point > Single Point.
2 Specify the location of the point.
CREATE OBJECTS
109
Draw toolbar
Command line POINT
To draw several points
1 Choose Draw > Point > Multiple Point.
2 Specify the location of each point.
Draw toolbar
Command line POINT
Changing the size and appearance of point objects
Changing the size and appearance of point objects affects all point objects already in the
drawing, as well as all points that you subsequently draw. Positive values represent the
absolute size of the point object measured in drawing units. Negative values represent a
percentage relative to the drawing screen, so that points retain their visual size as you use
the Zoom command to change the magnification of the drawing.
To change the size and appearance of point objects
1 Choose Format > Point Style.
2 Under Point Style, select the style you want.
3 Under Point Size, select the point size, or choose one of the options.
4 Click OK.
Command line DDPTYPE
When you regenerate the drawing, all point objects change to reflect the new size and
appearance settings.
7.1.10. Traces
Creating traces using TRACE command.
The endpoints of a trace is on the center line and are always cut square. TRACE
automatically calculates the correct bevels for connection to adjacent segments.
Traces appear solid filled if Fill mode is on. When Fill mode is off, only the outline of a
trace is displayed.
7.1.11. Freehand Sketches
A freehand sketch consists of many straight line segments, created either as individual
line objects or as a polyline. Before you begin creating a freehand sketch, you must set
the length, or increment, of each segment. The smaller the segments, the more accurate
your sketch, but segments that are too small can greatly increase the file size.
After you specify the length of the sketch segments, the crosshairs change to a Pencil
tool.
Your freehand sketch is not added to the drawing until you ―write‖ the sketch into your
drawing. This means that you temporarily save the segment that you‘ve drawn and the
segment length, and you can continue sketching.
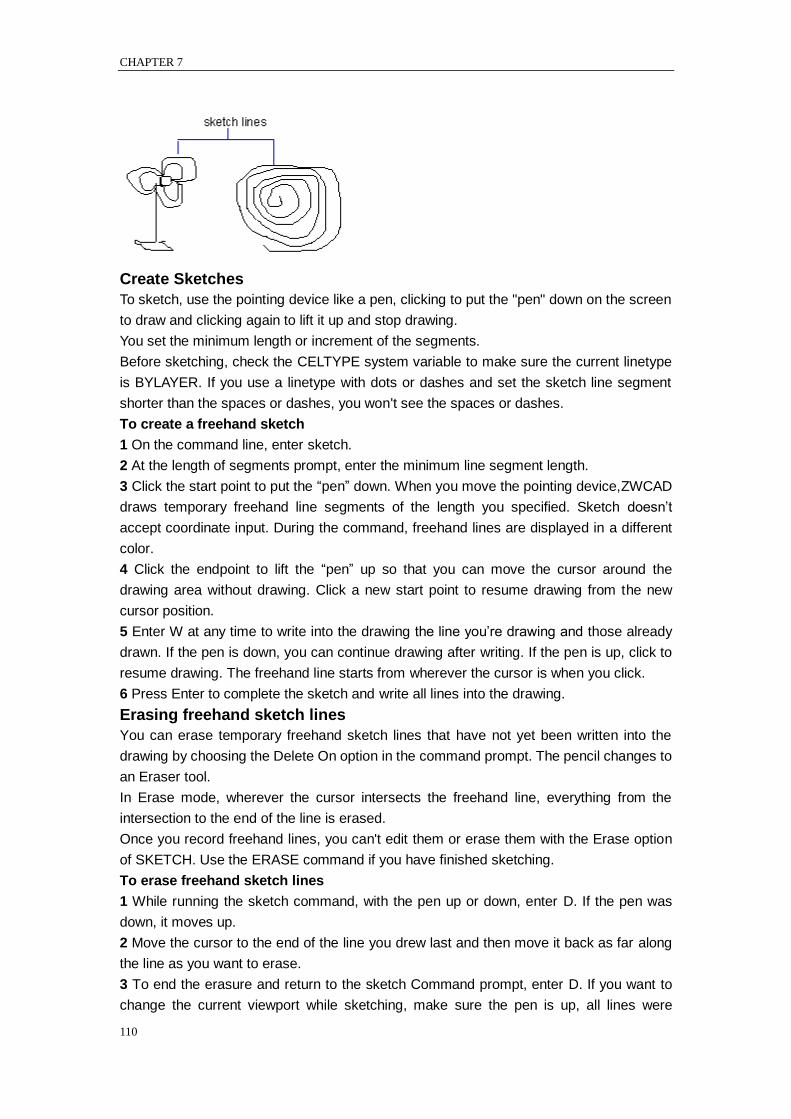
CHAPTER 7
110
Create Sketches
To sketch, use the pointing device like a pen, clicking to put the "pen" down on the screen
to draw and clicking again to lift it up and stop drawing.
You set the minimum length or increment of the segments.
Before sketching, check the CELTYPE system variable to make sure the current linetype
is BYLAYER. If you use a linetype with dots or dashes and set the sketch line segment
shorter than the spaces or dashes, you won't see the spaces or dashes.
To create a freehand sketch
1 On the command line, enter sketch.
2 At the length of segments prompt, enter the minimum line segment length.
3 Click the start point to put the ―pen‖ down. When you move the pointing device,ZWCAD
draws temporary freehand line segments of the length you specified. Sketch doesn‘t
accept coordinate input. During the command, freehand lines are displayed in a different
color.
4 Click the endpoint to lift the ―pen‖ up so that you can move the cursor around the
drawing area without drawing. Click a new start point to resume drawing from the new
cursor position.
5 Enter W at any time to write into the drawing the line you‘re drawing and those already
drawn. If the pen is down, you can continue drawing after writing. If the pen is up, click to
resume drawing. The freehand line starts from wherever the cursor is when you click.
6 Press Enter to complete the sketch and write all lines into the drawing.
Erasing freehand sketch lines
You can erase temporary freehand sketch lines that have not yet been written into the
drawing by choosing the Delete On option in the command prompt. The pencil changes to
an Eraser tool.
In Erase mode, wherever the cursor intersects the freehand line, everything from the
intersection to the end of the line is erased.
Once you record freehand lines, you can't edit them or erase them with the Erase option
of SKETCH. Use the ERASE command if you have finished sketching.
To erase freehand sketch lines
1 While running the sketch command, with the pen up or down, enter D. If the pen was
down, it moves up.
2 Move the cursor to the end of the line you drew last and then move it back as far along
the line as you want to erase.
3 To end the erasure and return to the sketch Command prompt, enter D. If you want to
change the current viewport while sketching, make sure the pen is up, all lines were
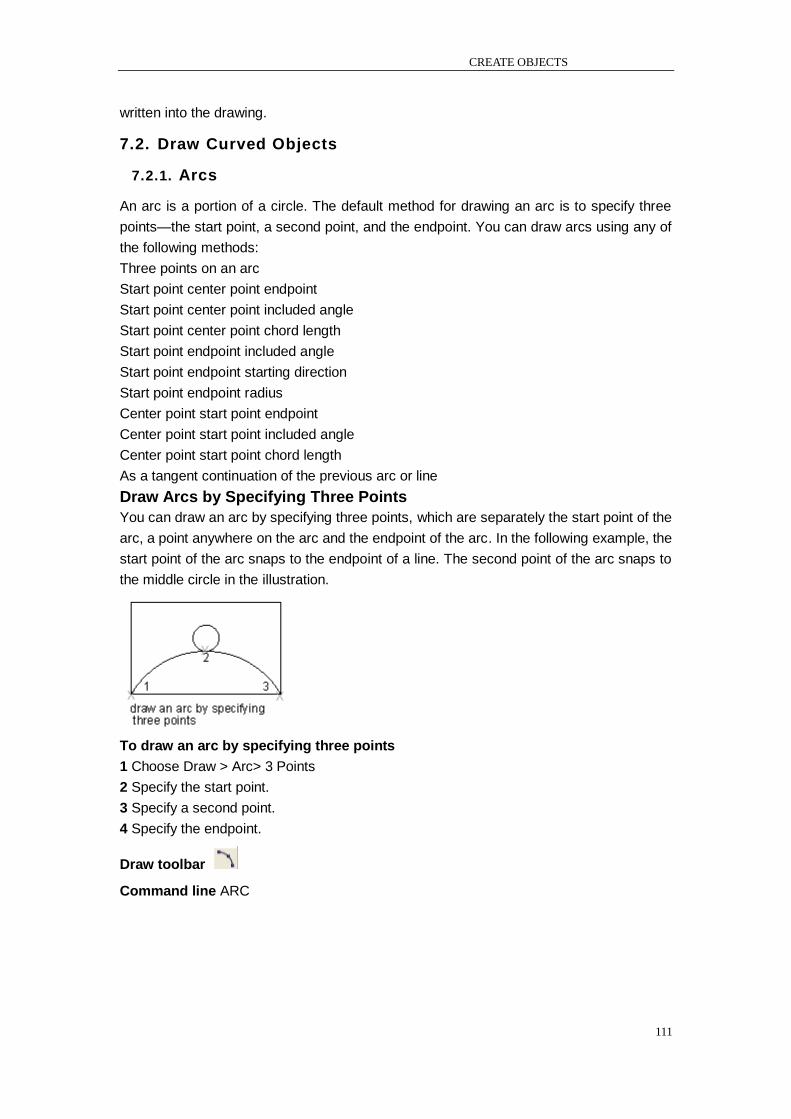
CREATE OBJECTS
111
written into the drawing.
7.2. Draw Curved Objects
7.2.1. Arcs
An arc is a portion of a circle. The default method for drawing an arc is to specify three
points—the start point, a second point, and the endpoint. You can draw arcs using any of
the following methods:
Three points on an arc
Start point center point endpoint
Start point center point included angle
Start point center point chord length
Start point endpoint included angle
Start point endpoint starting direction
Start point endpoint radius
Center point start point endpoint
Center point start point included angle
Center point start point chord length
As a tangent continuation of the previous arc or line
Draw Arcs by Specifying Three Points
You can draw an arc by specifying three points, which are separately the start point of the
arc, a point anywhere on the arc and the endpoint of the arc. In the following example, the
start point of the arc snaps to the endpoint of a line. The second point of the arc snaps to
the middle circle in the illustration.
To draw an arc by specifying three points
1 Choose Draw > Arc> 3 Points
2 Specify the start point.
3 Specify a second point.
4 Specify the endpoint.
Draw toolbar
Command line ARC
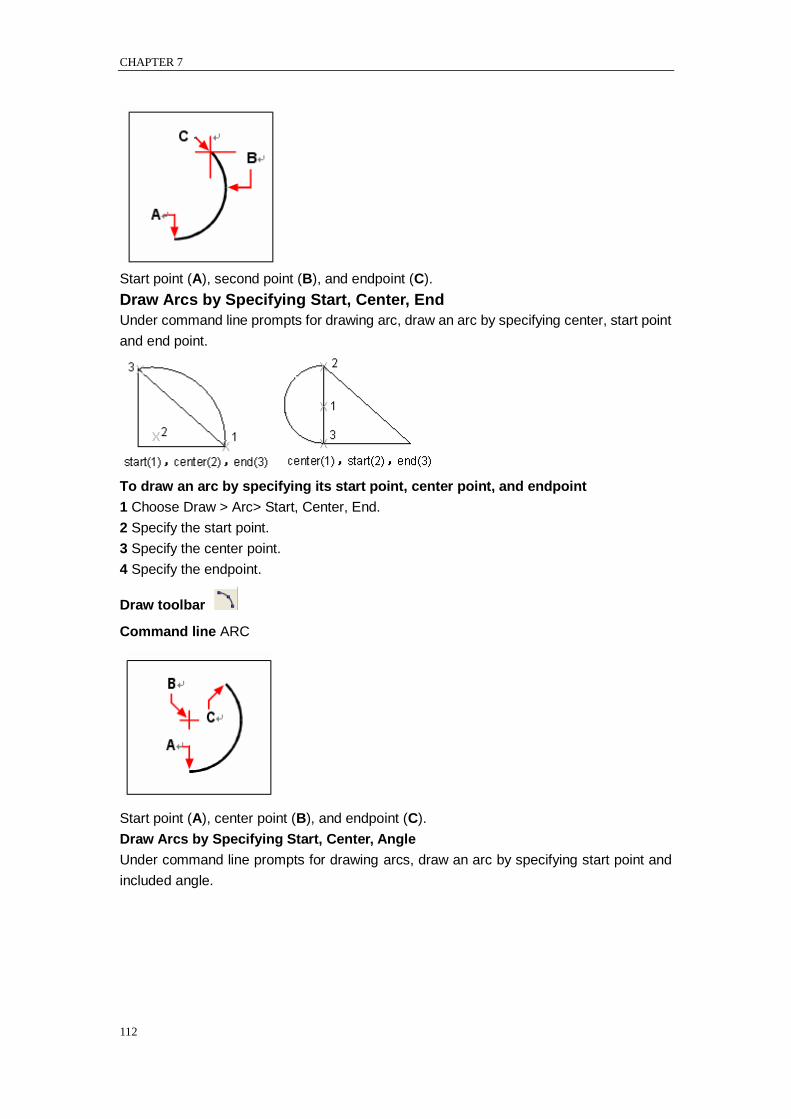
CHAPTER 7
112
Start point (A), second point (B), and endpoint (C).
Draw Arcs by Specifying Start, Center, End
Under command line prompts for drawing arc, draw an arc by specifying center, start point
and end point.
To draw an arc by specifying its start point, center point, and endpoint
1 Choose Draw > Arc> Start, Center, End.
2 Specify the start point.
3 Specify the center point.
4 Specify the endpoint.
Draw toolbar
Command line ARC
Start point (A), center point (B), and endpoint (C).
Draw Arcs by Specifying Start, Center, Angle
Under command line prompts for drawing arcs, draw an arc by specifying start point and
included angle.
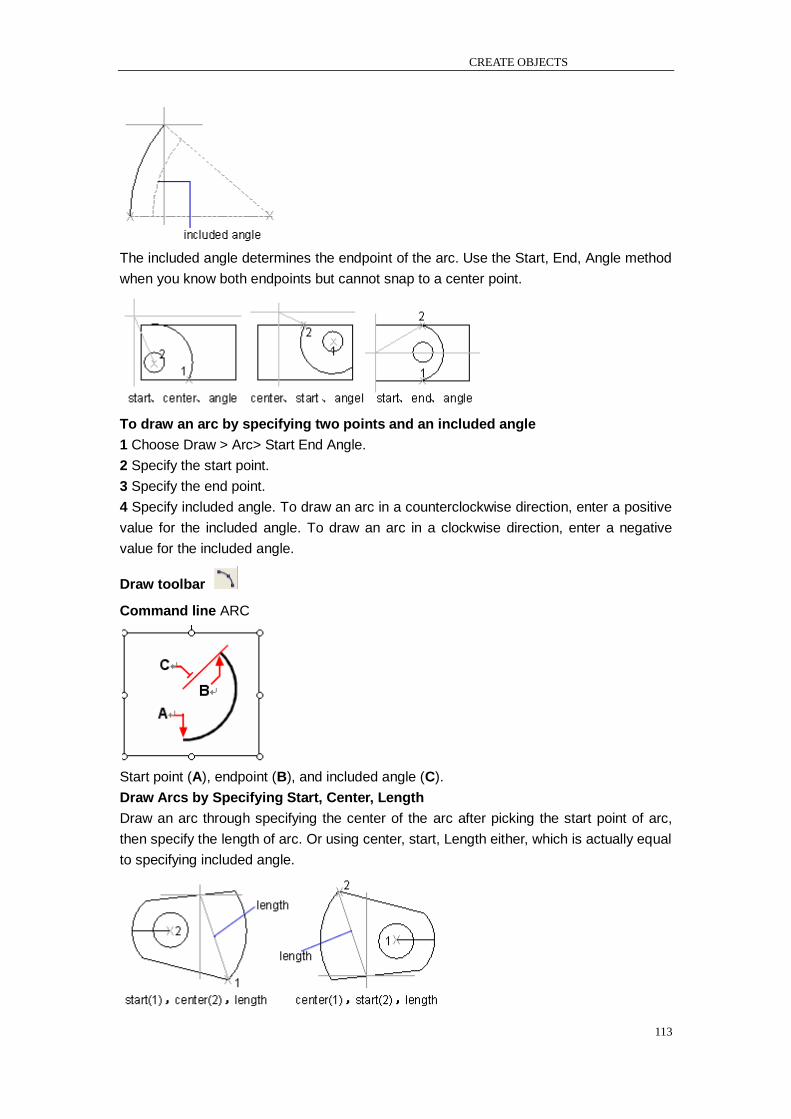
CREATE OBJECTS
113
The included angle determines the endpoint of the arc. Use the Start, End, Angle method
when you know both endpoints but cannot snap to a center point.
To draw an arc by specifying two points and an included angle
1 Choose Draw > Arc> Start End Angle.
2 Specify the start point.
3 Specify the end point.
4 Specify included angle. To draw an arc in a counterclockwise direction, enter a positive
value for the included angle. To draw an arc in a clockwise direction, enter a negative
value for the included angle.
Draw toolbar
Command line ARC
Start point (A), endpoint (B), and included angle (C).
Draw Arcs by Specifying Start, Center, Length
Draw an arc through specifying the center of the arc after picking the start point of arc,
then specify the length of arc. Or using center, start, Length either, which is actually equal
to specifying included angle.
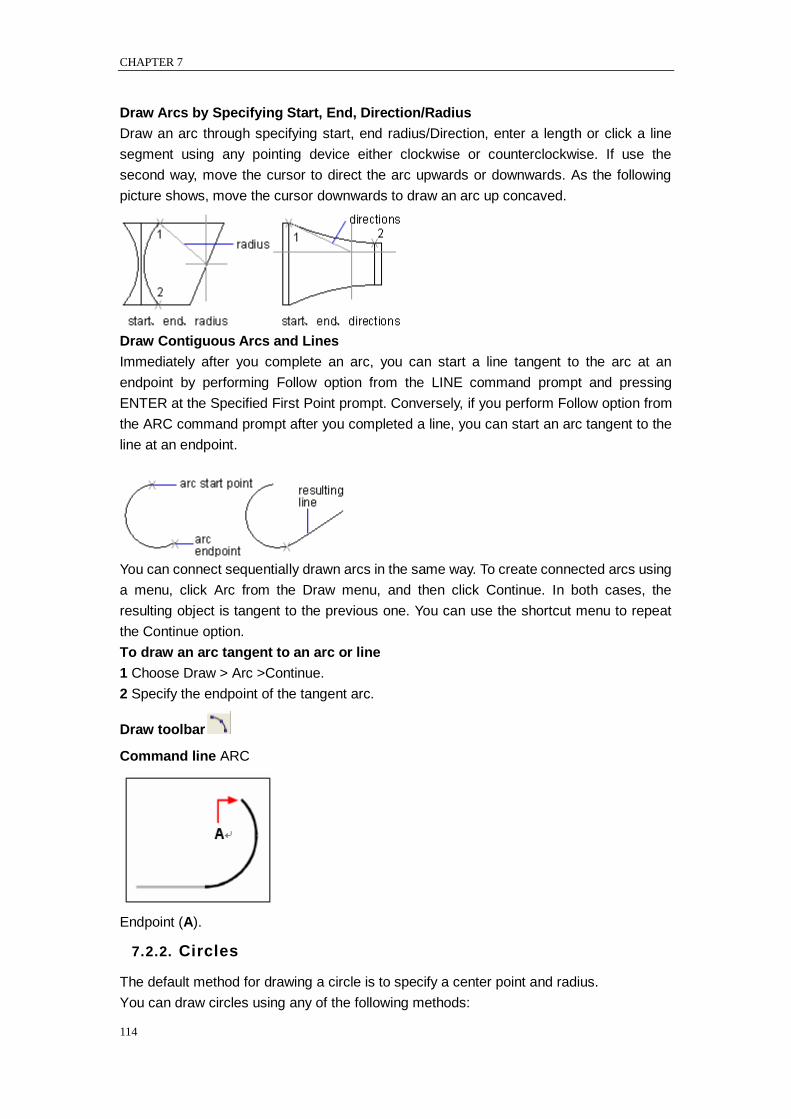
CHAPTER 7
114
Draw Arcs by Specifying Start, End, Direction/Radius
Draw an arc through specifying start, end radius/Direction, enter a length or click a line
segment using any pointing device either clockwise or counterclockwise. If use the
second way, move the cursor to direct the arc upwards or downwards. As the following
picture shows, move the cursor downwards to draw an arc up concaved.
Draw Contiguous Arcs and Lines
Immediately after you complete an arc, you can start a line tangent to the arc at an
endpoint by performing Follow option from the LINE command prompt and pressing
ENTER at the Specified First Point prompt. Conversely, if you perform Follow option from
the ARC command prompt after you completed a line, you can start an arc tangent to the
line at an endpoint.
You can connect sequentially drawn arcs in the same way. To create connected arcs using
a menu, click Arc from the Draw menu, and then click Continue. In both cases, the
resulting object is tangent to the previous one. You can use the shortcut menu to repeat
the Continue option.
To draw an arc tangent to an arc or line
1 Choose Draw > Arc >Continue.
2 Specify the endpoint of the tangent arc.
Draw toolbar
Command line ARC
Endpoint (A).
7.2.2. Circles
The default method for drawing a circle is to specify a center point and radius.
You can draw circles using any of the following methods:
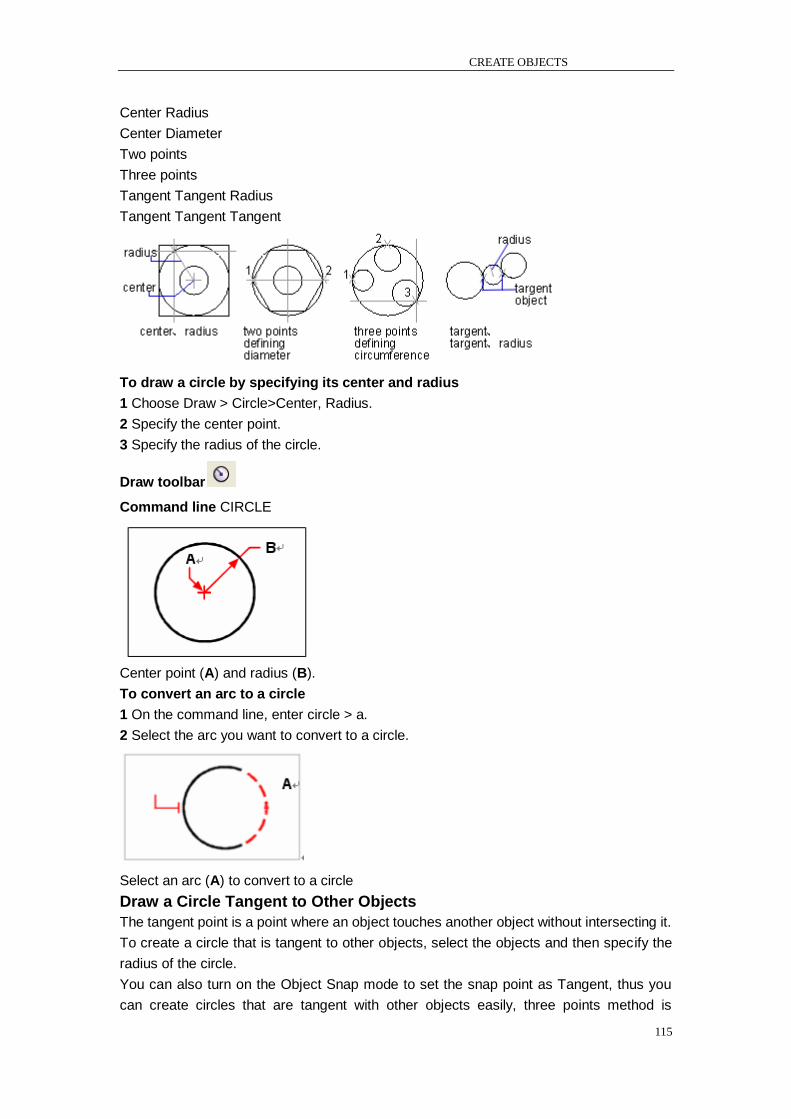
CREATE OBJECTS
115
Center Radius
Center Diameter
Two points
Three points
Tangent Tangent Radius
Tangent Tangent Tangent
To draw a circle by specifying its center and radius
1 Choose Draw > Circle>Center, Radius.
2 Specify the center point.
3 Specify the radius of the circle.
Draw toolbar
Command line CIRCLE
Center point (A) and radius (B).
To convert an arc to a circle
1 On the command line, enter circle > a.
2 Select the arc you want to convert to a circle.
Select an arc (A) to convert to a circle
Draw a Circle Tangent to Other Objects
The tangent point is a point where an object touches another object without intersecting it.
To create a circle that is tangent to other objects, select the objects and then specify the
radius of the circle.
You can also turn on the Object Snap mode to set the snap point as Tangent, thus you
can create circles that are tangent with other objects easily, three points method is

CHAPTER 7
116
available for creating circles with three tangent points.
In the illustrations below, the red circle is the one being drawn, and points 1 and 2 select
the objects to which it is tangent.
To draw a circle tangent to existing objects
1 Choose Draw > Circle>Tan, Tan, Radius.
2 Select the first tangent point on the object to be tangent with the circle.
3 Select the second tangent point on the object to be tangent with the circle.
4 Specify the radius of the circle.
Draw toolbar
Command line CIRCLE
Radius of circle (A) and tangent lines (B) and (C).
7.2.3. Ellipses and Ellipse arcs
Drawing ellipses
The default method for drawing an ellipse is to specify the endpoints of one axis of the
ellipse, and then specify a distance representing half the length of the second axis. The
endpoints of the first axis determine the orientation of the ellipse. The longer axis of the
ellipse is called the major axis, and the shorter one is the minor axis. The order in which
you define the axes does not matter. The program determines the major and minor axes
based on their relative lengths. You can draw ellipses using any of the following methods:
Center
Axis, End
To draw an ellipse by specifying the axis and endpoints
1 Choose Draw > Ellipse >Axis, End.
2 Specify the first endpoint.
3 Specify the second endpoint.
4 Drag the pointing device away from the midpoint, and click to specify a distance for half
the length of the second axis.
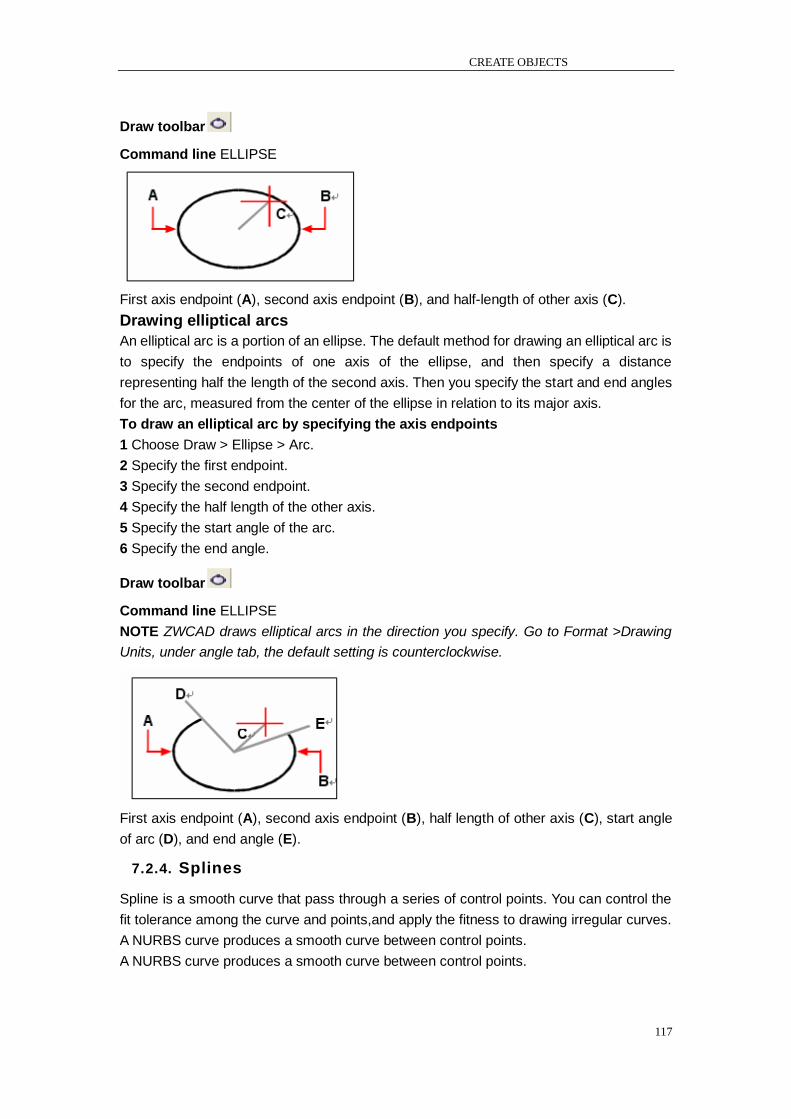
CREATE OBJECTS
117
Draw toolbar
Command line ELLIPSE
First axis endpoint (A), second axis endpoint (B), and half-length of other axis (C).
Drawing elliptical arcs
An elliptical arc is a portion of an ellipse. The default method for drawing an elliptical arc is
to specify the endpoints of one axis of the ellipse, and then specify a distance
representing half the length of the second axis. Then you specify the start and end angles
for the arc, measured from the center of the ellipse in relation to its major axis.
To draw an elliptical arc by specifying the axis endpoints
1 Choose Draw > Ellipse > Arc.
2 Specify the first endpoint.
3 Specify the second endpoint.
4 Specify the half length of the other axis.
5 Specify the start angle of the arc.
6 Specify the end angle.
Draw toolbar
Command line ELLIPSE
NOTE ZWCAD draws elliptical arcs in the direction you specify. Go to Format >Drawing
Units, under angle tab, the default setting is counterclockwise.
First axis endpoint (A), second axis endpoint (B), half length of other axis (C), start angle
of arc (D), and end angle (E).
7.2.4. Splines
Spline is a smooth curve that pass through a series of control points. You can control the
fit tolerance among the curve and points,and apply the fitness to drawing irregular curves.
A NURBS curve produces a smooth curve between control points.
A NURBS curve produces a smooth curve between control points.
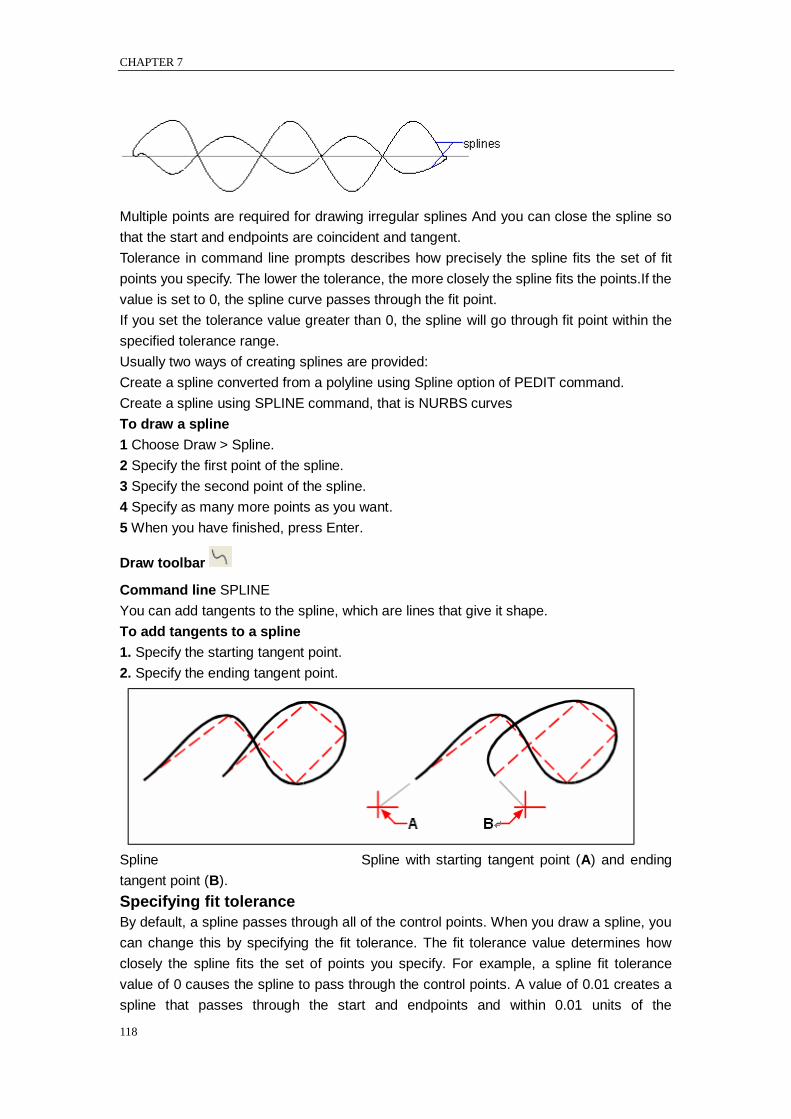
CHAPTER 7
118
Multiple points are required for drawing irregular splines And you can close the spline so
that the start and endpoints are coincident and tangent.
Tolerance in command line prompts describes how precisely the spline fits the set of fit
points you specify. The lower the tolerance, the more closely the spline fits the points.If the
value is set to 0, the spline curve passes through the fit point.
If you set the tolerance value greater than 0, the spline will go through fit point within the
specified tolerance range.
Usually two ways of creating splines are provided:
Create a spline converted from a polyline using Spline option of PEDIT command.
Create a spline using SPLINE command, that is NURBS curves
To draw a spline
1 Choose Draw > Spline.
2 Specify the first point of the spline.
3 Specify the second point of the spline.
4 Specify as many more points as you want.
5 When you have finished, press Enter.
Draw toolbar
Command line SPLINE
You can add tangents to the spline, which are lines that give it shape.
To add tangents to a spline
1. Specify the starting tangent point.
2. Specify the ending tangent point.
Spline Spline with starting tangent point (A) and ending
tangent point (B).
Specifying fit tolerance
By default, a spline passes through all of the control points. When you draw a spline, you
can change this by specifying the fit tolerance. The fit tolerance value determines how
closely the spline fits the set of points you specify. For example, a spline fit tolerance
value of 0 causes the spline to pass through the control points. A value of 0.01 creates a
spline that passes through the start and endpoints and within 0.01 units of the
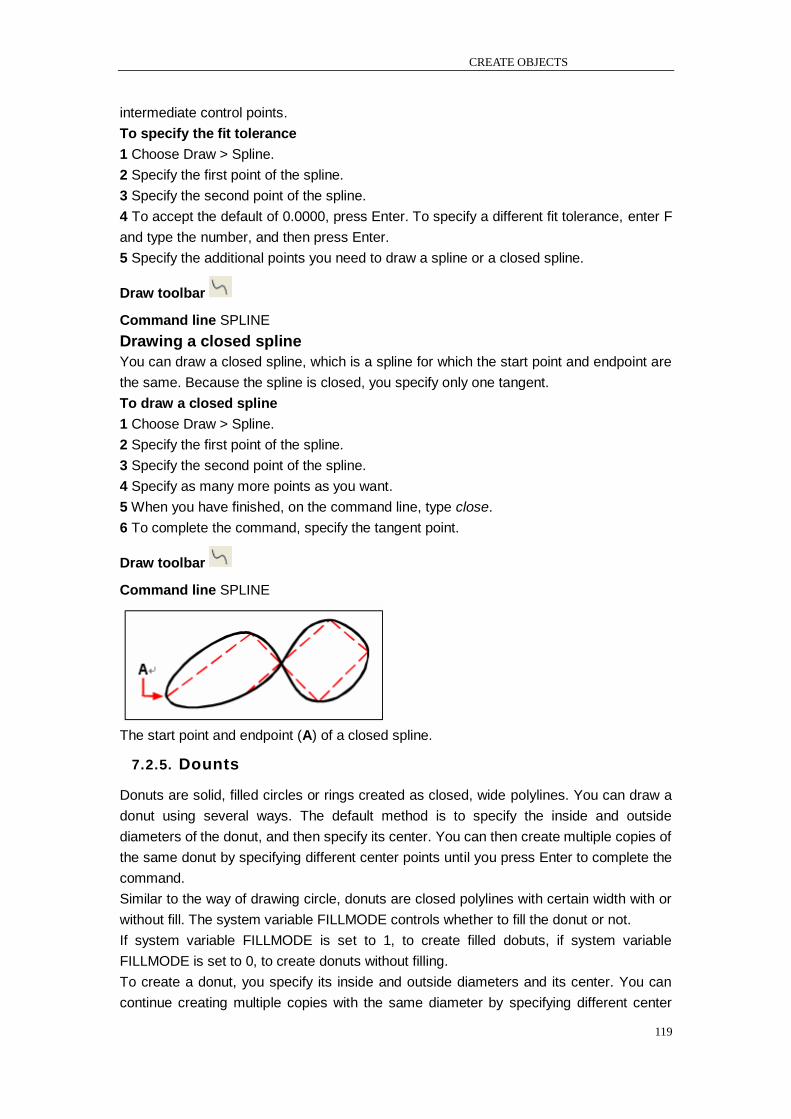
CREATE OBJECTS
119
intermediate control points.
To specify the fit tolerance
1 Choose Draw > Spline.
2 Specify the first point of the spline.
3 Specify the second point of the spline.
4 To accept the default of 0.0000, press Enter. To specify a different fit tolerance, enter F
and type the number, and then press Enter.
5 Specify the additional points you need to draw a spline or a closed spline.
Draw toolbar
Command line SPLINE
Drawing a closed spline
You can draw a closed spline, which is a spline for which the start point and endpoint are
the same. Because the spline is closed, you specify only one tangent.
To draw a closed spline
1 Choose Draw > Spline.
2 Specify the first point of the spline.
3 Specify the second point of the spline.
4 Specify as many more points as you want.
5 When you have finished, on the command line, type close.
6 To complete the command, specify the tangent point.
Draw toolbar
Command line SPLINE
The start point and endpoint (A) of a closed spline.
7.2.5. Dounts
Donuts are solid, filled circles or rings created as closed, wide polylines. You can draw a
donut using several ways. The default method is to specify the inside and outside
diameters of the donut, and then specify its center. You can then create multiple copies of
the same donut by specifying different center points until you press Enter to complete the
command.
Similar to the way of drawing circle, donuts are closed polylines with certain width with or
without fill. The system variable FILLMODE controls whether to fill the donut or not.
If system variable FILLMODE is set to 1, to create filled dobuts, if system variable
FILLMODE is set to 0, to create donuts without filling.
To create a donut, you specify its inside and outside diameters and its center. You can
continue creating multiple copies with the same diameter by specifying different center
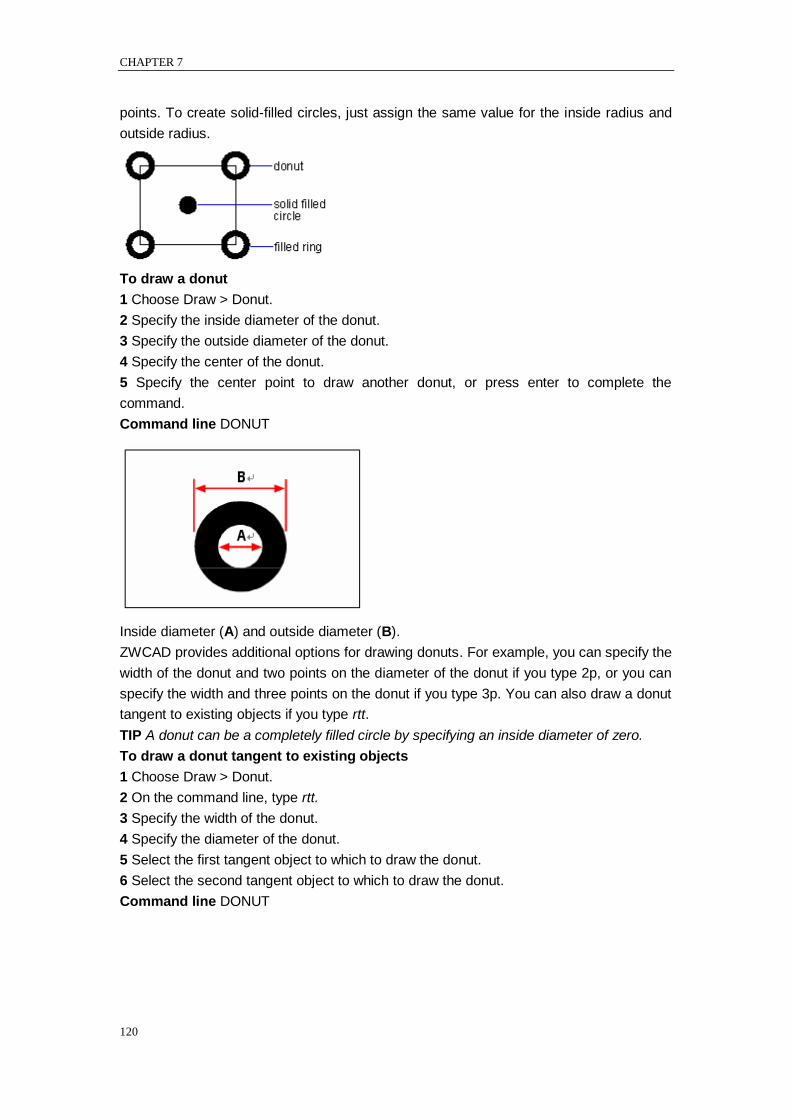
CHAPTER 7
120
points. To create solid-filled circles, just assign the same value for the inside radius and
outside radius.
To draw a donut
1 Choose Draw > Donut.
2 Specify the inside diameter of the donut.
3 Specify the outside diameter of the donut.
4 Specify the center of the donut.
5 Specify the center point to draw another donut, or press enter to complete the
command.
Command line DONUT
Inside diameter (A) and outside diameter (B).
ZWCAD provides additional options for drawing donuts. For example, you can specify the
width of the donut and two points on the diameter of the donut if you type 2p, or you can
specify the width and three points on the donut if you type 3p. You can also draw a donut
tangent to existing objects if you type rtt.
TIP A donut can be a completely filled circle by specifying an inside diameter of zero.
To draw a donut tangent to existing objects
1 Choose Draw > Donut.
2 On the command line, type rtt.
3 Specify the width of the donut.
4 Specify the diameter of the donut.
5 Select the first tangent object to which to draw the donut.
6 Select the second tangent object to which to draw the donut.
Command line DONUT
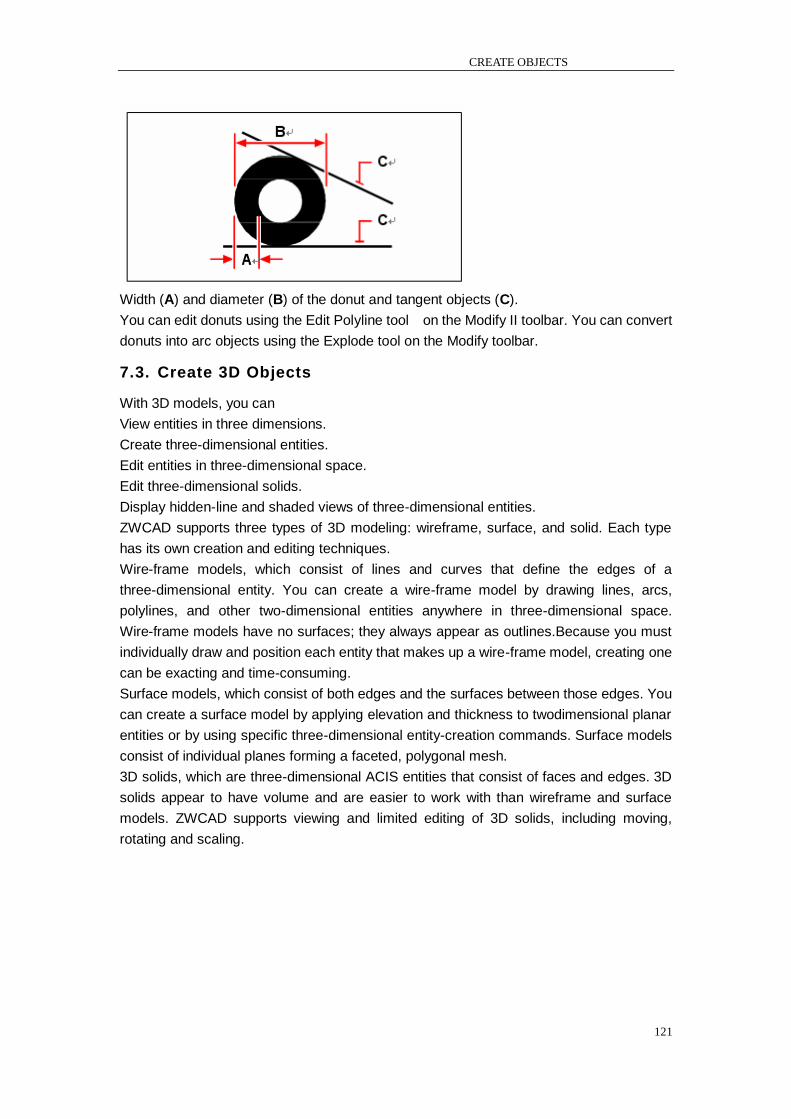
CREATE OBJECTS
121
Width (A) and diameter (B) of the donut and tangent objects (C).
You can edit donuts using the Edit Polyline tool on the Modify II toolbar. You can convert
donuts into arc objects using the Explode tool on the Modify toolbar.
7.3. Create 3D Objects
With 3D models, you can
View entities in three dimensions.
Create three-dimensional entities.
Edit entities in three-dimensional space.
Edit three-dimensional solids.
Display hidden-line and shaded views of three-dimensional entities.
ZWCAD supports three types of 3D modeling: wireframe, surface, and solid. Each type
has its own creation and editing techniques.
Wire-frame models, which consist of lines and curves that define the edges of a
three-dimensional entity. You can create a wire-frame model by drawing lines, arcs,
polylines, and other two-dimensional entities anywhere in three-dimensional space.
Wire-frame models have no surfaces; they always appear as outlines.Because you must
individually draw and position each entity that makes up a wire-frame model, creating one
can be exacting and time-consuming.
Surface models, which consist of both edges and the surfaces between those edges. You
can create a surface model by applying elevation and thickness to twodimensional planar
entities or by using specific three-dimensional entity-creation commands. Surface models
consist of individual planes forming a faceted, polygonal mesh.
3D solids, which are three-dimensional ACIS entities that consist of faces and edges. 3D
solids appear to have volume and are easier to work with than wireframe and surface
models. ZWCAD supports viewing and limited editing of 3D solids, including moving,
rotating and scaling.
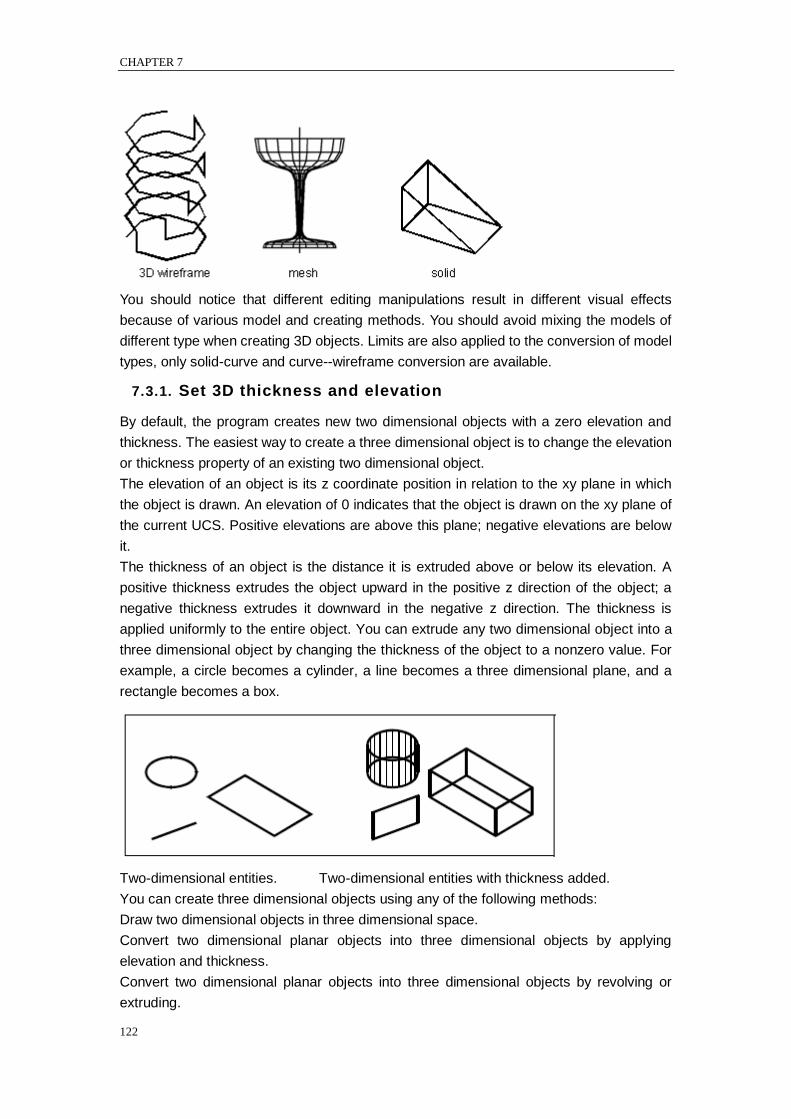
CHAPTER 7
122
You should notice that different editing manipulations result in different visual effects
because of various model and creating methods. You should avoid mixing the models of
different type when creating 3D objects. Limits are also applied to the conversion of model
types, only solid-curve and curve--wireframe conversion are available.
7.3.1. Set 3D thickness and elevation
By default, the program creates new two dimensional objects with a zero elevation and
thickness. The easiest way to create a three dimensional object is to change the elevation
or thickness property of an existing two dimensional object.
The elevation of an object is its z coordinate position in relation to the xy plane in which
the object is drawn. An elevation of 0 indicates that the object is drawn on the xy plane of
the current UCS. Positive elevations are above this plane; negative elevations are below
it.
The thickness of an object is the distance it is extruded above or below its elevation. A
positive thickness extrudes the object upward in the positive z direction of the object; a
negative thickness extrudes it downward in the negative z direction. The thickness is
applied uniformly to the entire object. You can extrude any two dimensional object into a
three dimensional object by changing the thickness of the object to a nonzero value. For
example, a circle becomes a cylinder, a line becomes a three dimensional plane, and a
rectangle becomes a box.
Two-dimensional entities. Two-dimensional entities with thickness added.
You can create three dimensional objects using any of the following methods:
Draw two dimensional objects in three dimensional space.
Convert two dimensional planar objects into three dimensional objects by applying
elevation and thickness.
Convert two dimensional planar objects into three dimensional objects by revolving or
extruding.
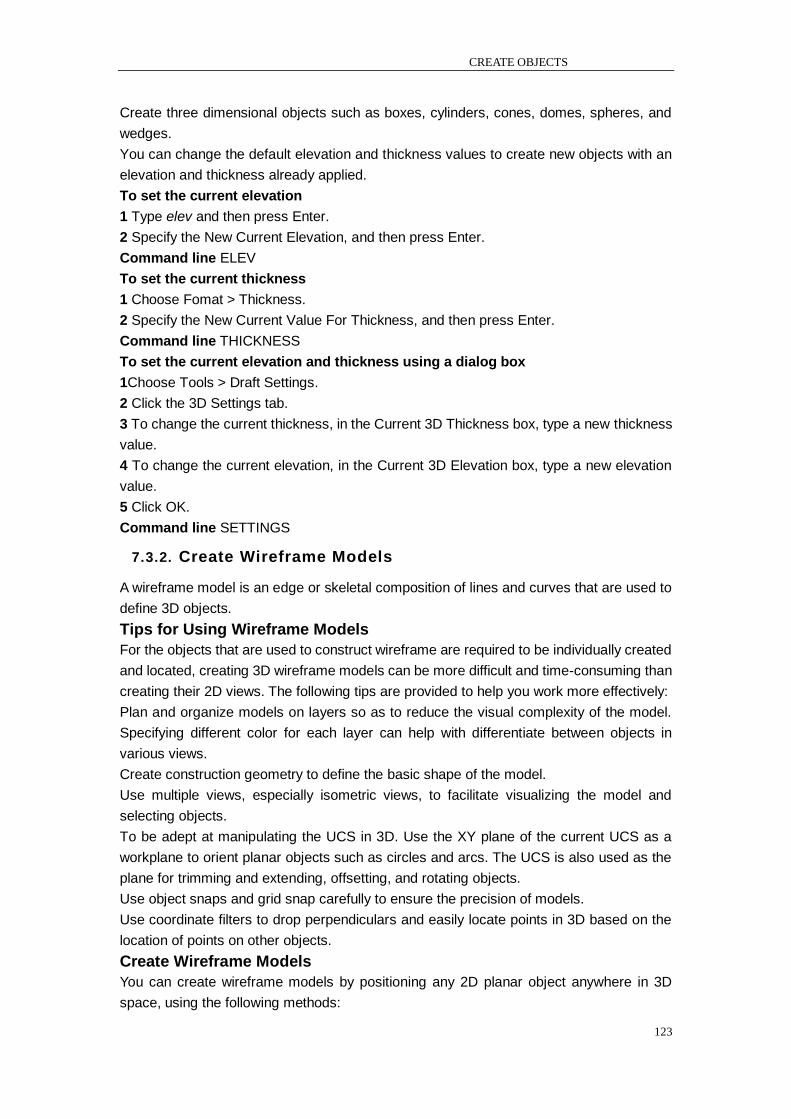
CREATE OBJECTS
123
Create three dimensional objects such as boxes, cylinders, cones, domes, spheres, and
wedges.
You can change the default elevation and thickness values to create new objects with an
elevation and thickness already applied.
To set the current elevation
1 Type elev and then press Enter.
2 Specify the New Current Elevation, and then press Enter.
Command line ELEV
To set the current thickness
1 Choose Fomat > Thickness.
2 Specify the New Current Value For Thickness, and then press Enter.
Command line THICKNESS
To set the current elevation and thickness using a dialog box
1Choose Tools > Draft Settings.
2 Click the 3D Settings tab.
3 To change the current thickness, in the Current 3D Thickness box, type a new thickness
value.
4 To change the current elevation, in the Current 3D Elevation box, type a new elevation
value.
5 Click OK.
Command line SETTINGS
7.3.2. Create Wireframe Models
A wireframe model is an edge or skeletal composition of lines and curves that are used to
define 3D objects.
Tips for Using Wireframe Models
For the objects that are used to construct wireframe are required to be individually created
and located, creating 3D wireframe models can be more difficult and time-consuming than
creating their 2D views. The following tips are provided to help you work more effectively:
Plan and organize models on layers so as to reduce the visual complexity of the model.
Specifying different color for each layer can help with differentiate between objects in
various views.
Create construction geometry to define the basic shape of the model.
Use multiple views, especially isometric views, to facilitate visualizing the model and
selecting objects.
To be adept at manipulating the UCS in 3D. Use the XY plane of the current UCS as a
workplane to orient planar objects such as circles and arcs. The UCS is also used as the
plane for trimming and extending, offsetting, and rotating objects.
Use object snaps and grid snap carefully to ensure the precision of models.
Use coordinate filters to drop perpendiculars and easily locate points in 3D based on the
location of points on other objects.
Create Wireframe Models
You can create wireframe models by positioning any 2D planar object anywhere in 3D
space, using the following methods:
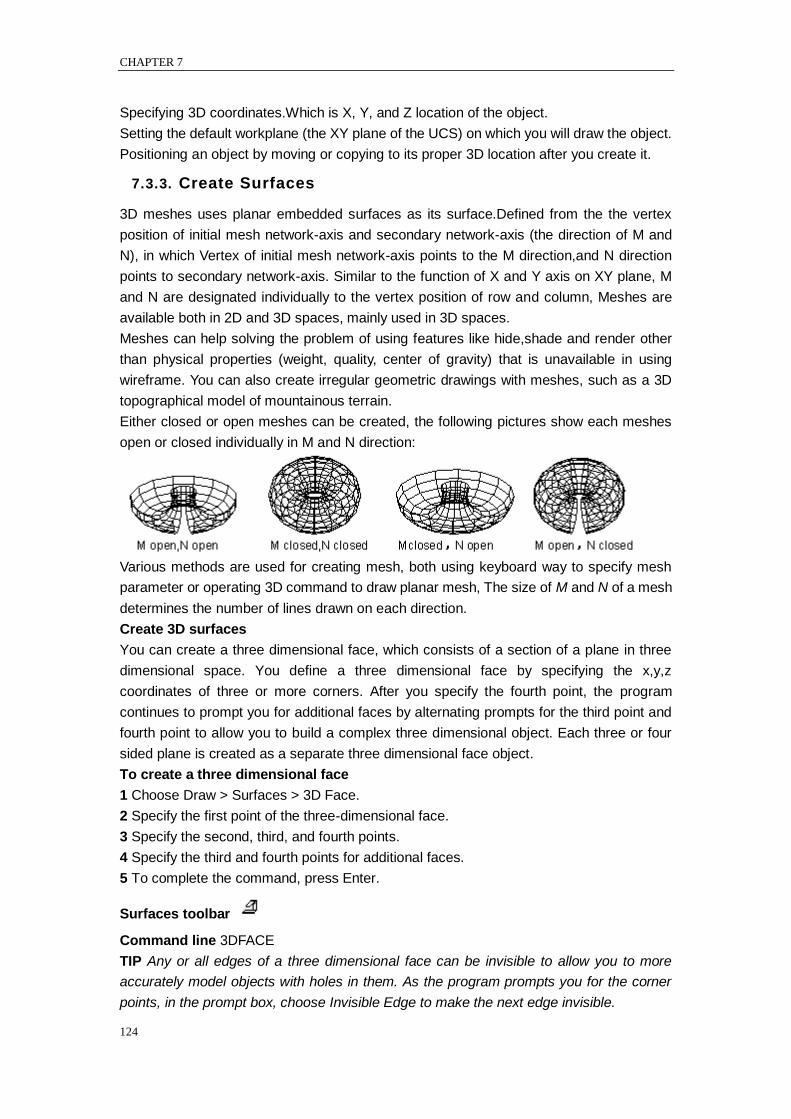
CHAPTER 7
124
Specifying 3D coordinates.Which is X, Y, and Z location of the object.
Setting the default workplane (the XY plane of the UCS) on which you will draw the object.
Positioning an object by moving or copying to its proper 3D location after you create it.
7.3.3. Create Surfaces
3D meshes uses planar embedded surfaces as its surface.Defined from the the vertex
position of initial mesh network-axis and secondary network-axis (the direction of M and
N), in which Vertex of initial mesh network-axis points to the M direction,and N direction
points to secondary network-axis. Similar to the function of X and Y axis on XY plane, M
and N are designated individually to the vertex position of row and column, Meshes are
available both in 2D and 3D spaces, mainly used in 3D spaces.
Meshes can help solving the problem of using features like hide,shade and render other
than physical properties (weight, quality, center of gravity) that is unavailable in using
wireframe. You can also create irregular geometric drawings with meshes, such as a 3D
topographical model of mountainous terrain.
Either closed or open meshes can be created, the following pictures show each meshes
open or closed individually in M and N direction:
Various methods are used for creating mesh, both using keyboard way to specify mesh
parameter or operating 3D command to draw planar mesh, The size of M and N of a mesh
determines the number of lines drawn on each direction.
Create 3D surfaces
You can create a three dimensional face, which consists of a section of a plane in three
dimensional space. You define a three dimensional face by specifying the x,y,z
coordinates of three or more corners. After you specify the fourth point, the program
continues to prompt you for additional faces by alternating prompts for the third point and
fourth point to allow you to build a complex three dimensional object. Each three or four
sided plane is created as a separate three dimensional face object.
To create a three dimensional face
1 Choose Draw > Surfaces > 3D Face.
2 Specify the first point of the three-dimensional face.
3 Specify the second, third, and fourth points.
4 Specify the third and fourth points for additional faces.
5 To complete the command, press Enter.
Surfaces toolbar
Command line 3DFACE
TIP Any or all edges of a three dimensional face can be invisible to allow you to more
accurately model objects with holes in them. As the program prompts you for the corner
points, in the prompt box, choose Invisible Edge to make the next edge invisible.
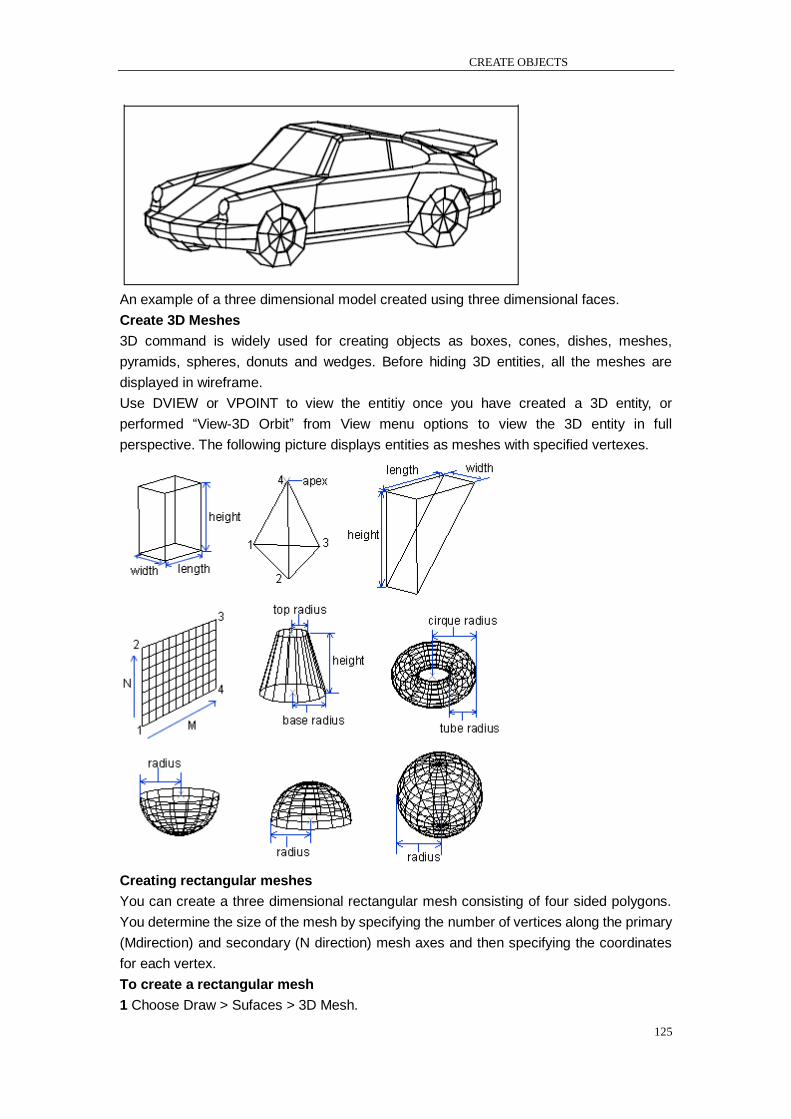
CREATE OBJECTS
125
An example of a three dimensional model created using three dimensional faces.
Create 3D Meshes
3D command is widely used for creating objects as boxes, cones, dishes, meshes,
pyramids, spheres, donuts and wedges. Before hiding 3D entities, all the meshes are
displayed in wireframe.
Use DVIEW or VPOINT to view the entitiy once you have created a 3D entity, or
performed ―View-3D Orbit‖ from View menu options to view the 3D entity in full
perspective. The following picture displays entities as meshes with specified vertexes.
Creating rectangular meshes
You can create a three dimensional rectangular mesh consisting of four sided polygons.
You determine the size of the mesh by specifying the number of vertices along the primary
(Mdirection) and secondary (N direction) mesh axes and then specifying the coordinates
for each vertex.
To create a rectangular mesh
1 Choose Draw > Sufaces > 3D Mesh.
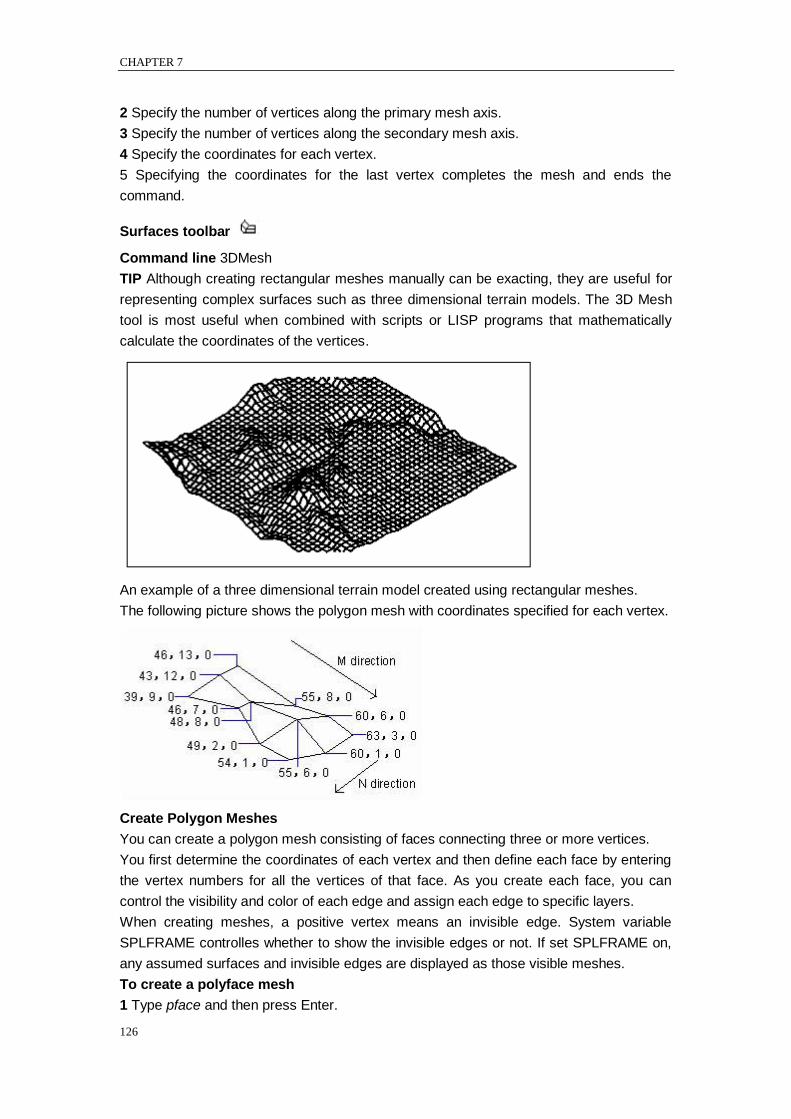
CHAPTER 7
126
2 Specify the number of vertices along the primary mesh axis.
3 Specify the number of vertices along the secondary mesh axis.
4 Specify the coordinates for each vertex.
5 Specifying the coordinates for the last vertex completes the mesh and ends the
command.
Surfaces toolbar
Command line 3DMesh
TIP Although creating rectangular meshes manually can be exacting, they are useful for
representing complex surfaces such as three dimensional terrain models. The 3D Mesh
tool is most useful when combined with scripts or LISP programs that mathematically
calculate the coordinates of the vertices.
An example of a three dimensional terrain model created using rectangular meshes.
The following picture shows the polygon mesh with coordinates specified for each vertex.
Create Polygon Meshes
You can create a polygon mesh consisting of faces connecting three or more vertices.
You first determine the coordinates of each vertex and then define each face by entering
the vertex numbers for all the vertices of that face. As you create each face, you can
control the visibility and color of each edge and assign each edge to specific layers.
When creating meshes, a positive vertex means an invisible edge. System variable
SPLFRAME controlles whether to show the invisible edges or not. If set SPLFRAME on,
any assumed surfaces and invisible edges are displayed as those visible meshes.
To create a polyface mesh
1 Type pface and then press Enter.
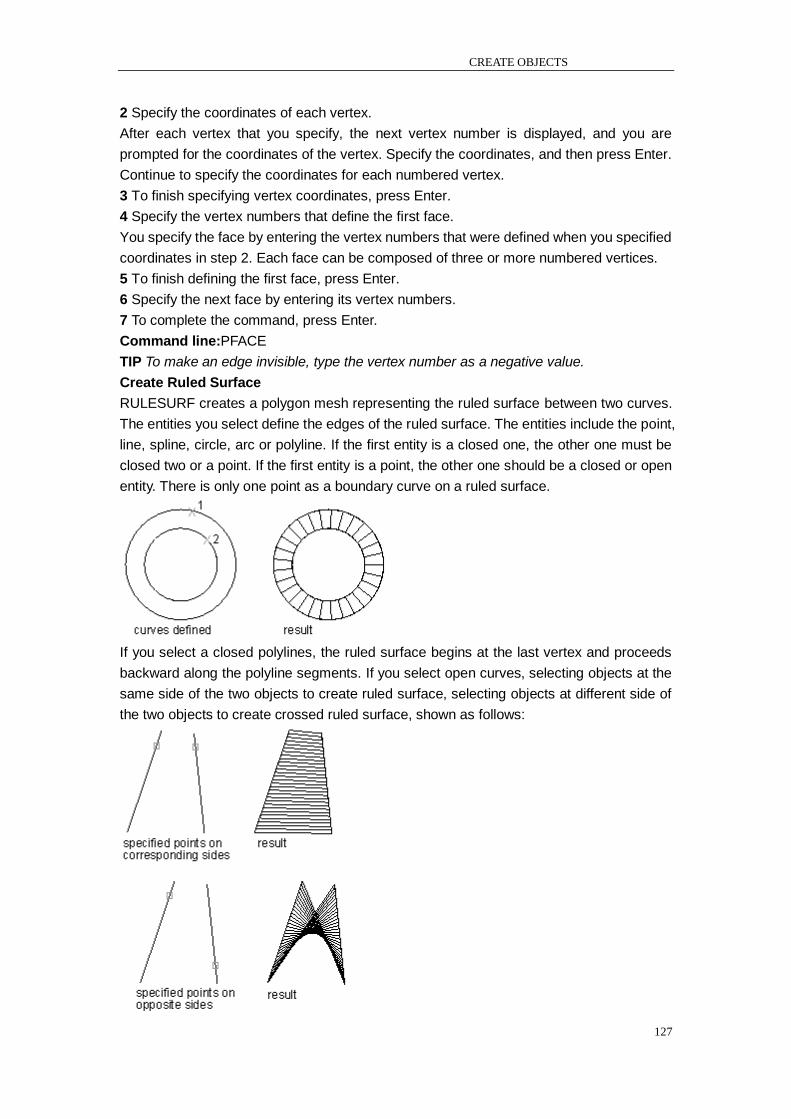
CREATE OBJECTS
127
2 Specify the coordinates of each vertex.
After each vertex that you specify, the next vertex number is displayed, and you are
prompted for the coordinates of the vertex. Specify the coordinates, and then press Enter.
Continue to specify the coordinates for each numbered vertex.
3 To finish specifying vertex coordinates, press Enter.
4 Specify the vertex numbers that define the first face.
You specify the face by entering the vertex numbers that were defined when you specified
coordinates in step 2. Each face can be composed of three or more numbered vertices.
5 To finish defining the first face, press Enter.
6 Specify the next face by entering its vertex numbers.
7 To complete the command, press Enter.
Command line:PFACE
TIP To make an edge invisible, type the vertex number as a negative value.
Create Ruled Surface
RULESURF creates a polygon mesh representing the ruled surface between two curves.
The entities you select define the edges of the ruled surface. The entities include the point,
line, spline, circle, arc or polyline. If the first entity is a closed one, the other one must be
closed two or a point. If the first entity is a point, the other one should be a closed or open
entity. There is only one point as a boundary curve on a ruled surface.
If you select a closed polylines, the ruled surface begins at the last vertex and proceeds
backward along the polyline segments. If you select open curves, selecting objects at the
same side of the two objects to create ruled surface, selecting objects at different side of
the two objects to create crossed ruled surface, shown as follows:
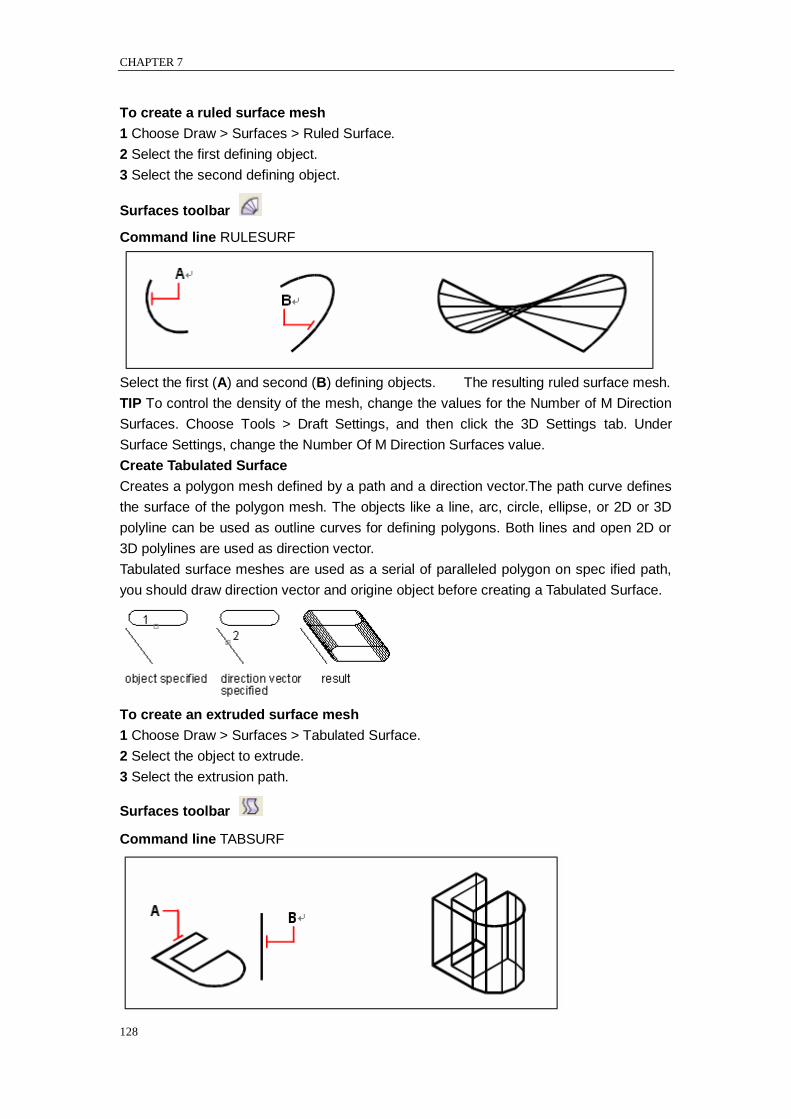
CHAPTER 7
128
To create a ruled surface mesh
1 Choose Draw > Surfaces > Ruled Surface.
2 Select the first defining object.
3 Select the second defining object.
Surfaces toolbar
Command line RULESURF
Select the first (A) and second (B) defining objects. The resulting ruled surface mesh.
TIP To control the density of the mesh, change the values for the Number of M Direction
Surfaces. Choose Tools > Draft Settings, and then click the 3D Settings tab. Under
Surface Settings, change the Number Of M Direction Surfaces value.
Create Tabulated Surface
Creates a polygon mesh defined by a path and a direction vector.The path curve defines
the surface of the polygon mesh. The objects like a line, arc, circle, ellipse, or 2D or 3D
polyline can be used as outline curves for defining polygons. Both lines and open 2D or
3D polylines are used as direction vector.
Tabulated surface meshes are used as a serial of paralleled polygon on spec ified path,
you should draw direction vector and origine object before creating a Tabulated Surface.
To create an extruded surface mesh
1 Choose Draw > Surfaces > Tabulated Surface.
2 Select the object to extrude.
3 Select the extrusion path.
Surfaces toolbar
Command line TABSURF
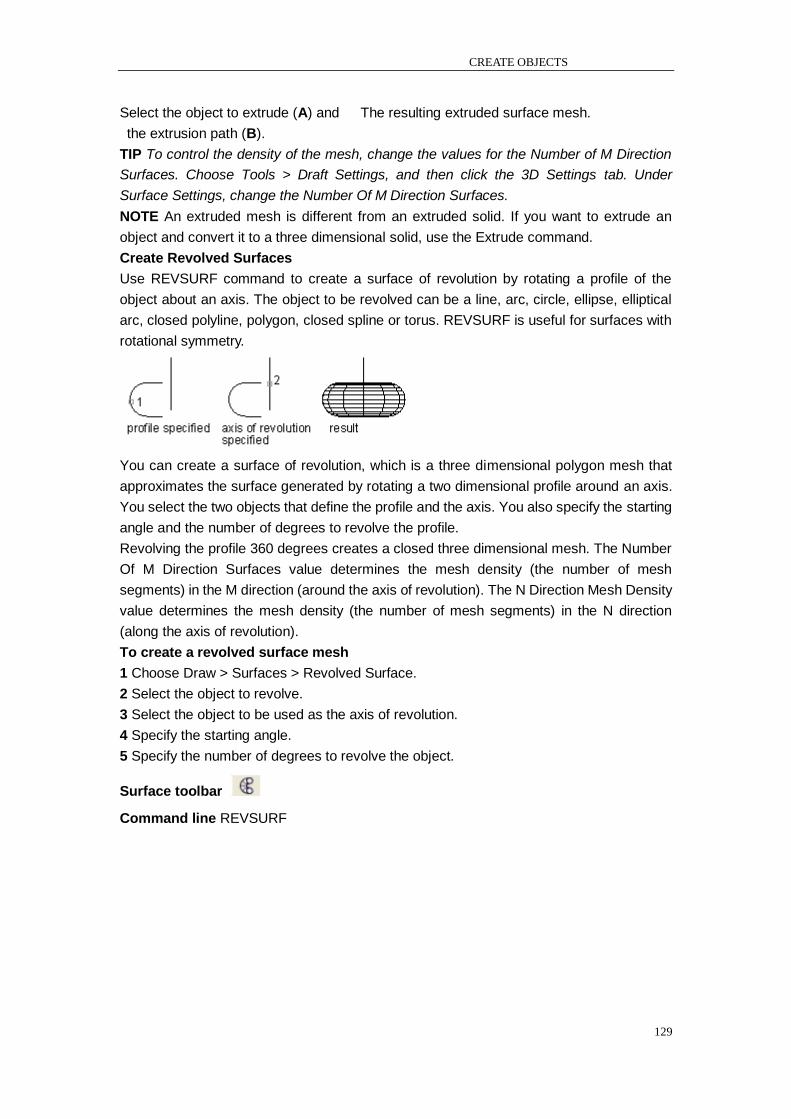
CREATE OBJECTS
129
Select the object to extrude (A) and The resulting extruded surface mesh.
the extrusion path (B).
TIP To control the density of the mesh, change the values for the Number of M Direction
Surfaces. Choose Tools > Draft Settings, and then click the 3D Settings tab. Under
Surface Settings, change the Number Of M Direction Surfaces.
NOTE An extruded mesh is different from an extruded solid. If you want to extrude an
object and convert it to a three dimensional solid, use the Extrude command.
Create Revolved Surfaces
Use REVSURF command to create a surface of revolution by rotating a profile of the
object about an axis. The object to be revolved can be a line, arc, circle, ellipse, elliptical
arc, closed polyline, polygon, closed spline or torus. REVSURF is useful for surfaces with
rotational symmetry.
You can create a surface of revolution, which is a three dimensional polygon mesh that
approximates the surface generated by rotating a two dimensional profile around an axis.
You select the two objects that define the profile and the axis. You also specify the starting
angle and the number of degrees to revolve the profile.
Revolving the profile 360 degrees creates a closed three dimensional mesh. The Number
Of M Direction Surfaces value determines the mesh density (the number of mesh
segments) in the M direction (around the axis of revolution). The N Direction Mesh Density
value determines the mesh density (the number of mesh segments) in the N direction
(along the axis of revolution).
To create a revolved surface mesh
1 Choose Draw > Surfaces > Revolved Surface.
2 Select the object to revolve.
3 Select the object to be used as the axis of revolution.
4 Specify the starting angle.
5 Specify the number of degrees to revolve the object.
Surface toolbar
Command line REVSURF
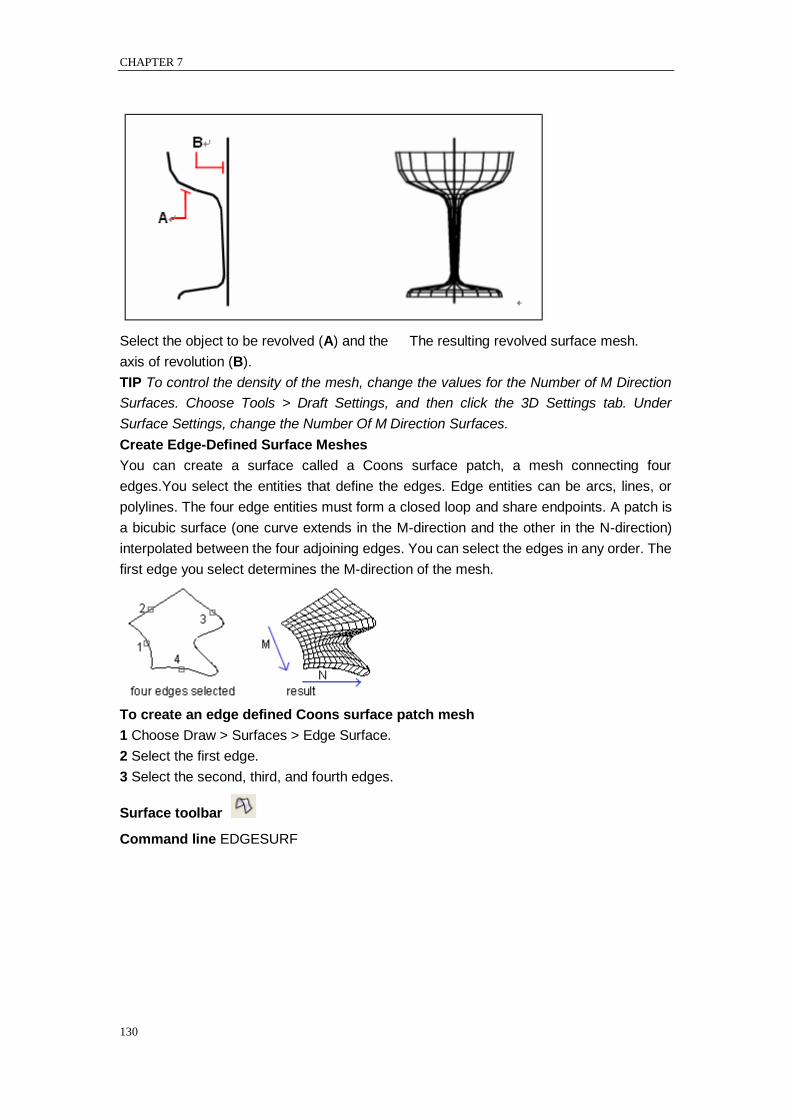
CHAPTER 7
130
Select the object to be revolved (A) and the The resulting revolved surface mesh.
axis of revolution (B).
TIP To control the density of the mesh, change the values for the Number of M Direction
Surfaces. Choose Tools > Draft Settings, and then click the 3D Settings tab. Under
Surface Settings, change the Number Of M Direction Surfaces.
Create Edge-Defined Surface Meshes
You can create a surface called a Coons surface patch, a mesh connecting four
edges.You select the entities that define the edges. Edge entities can be arcs, lines, or
polylines. The four edge entities must form a closed loop and share endpoints. A patch is
a bicubic surface (one curve extends in the M-direction and the other in the N-direction)
interpolated between the four adjoining edges. You can select the edges in any order. The
first edge you select determines the M-direction of the mesh.
To create an edge defined Coons surface patch mesh
1 Choose Draw > Surfaces > Edge Surface.
2 Select the first edge.
3 Select the second, third, and fourth edges.
Surface toolbar
Command line EDGESURF
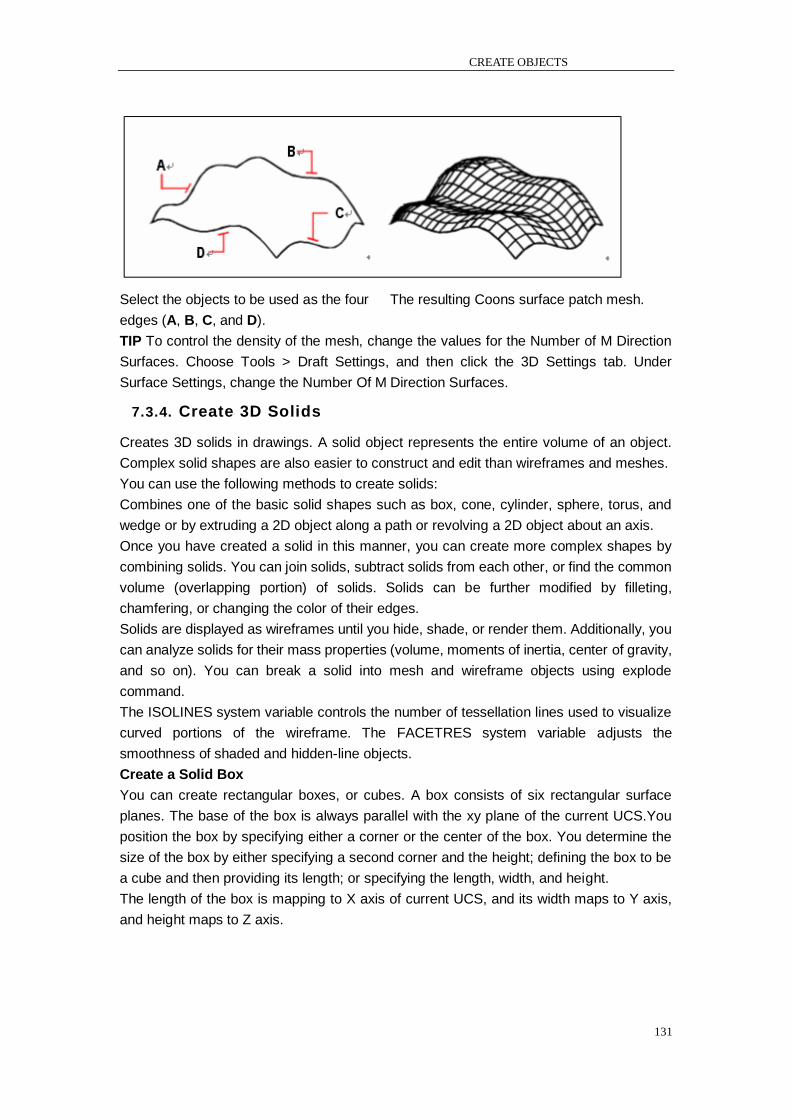
CREATE OBJECTS
131
Select the objects to be used as the four The resulting Coons surface patch mesh.
edges (A, B, C, and D).
TIP To control the density of the mesh, change the values for the Number of M Direction
Surfaces. Choose Tools > Draft Settings, and then click the 3D Settings tab. Under
Surface Settings, change the Number Of M Direction Surfaces.
7.3.4. Create 3D Solids
Creates 3D solids in drawings. A solid object represents the entire volume of an object.
Complex solid shapes are also easier to construct and edit than wireframes and meshes.
You can use the following methods to create solids:
Combines one of the basic solid shapes such as box, cone, cylinder, sphere, torus, and
wedge or by extruding a 2D object along a path or revolving a 2D object about an axis.
Once you have created a solid in this manner, you can create more complex shapes by
combining solids. You can join solids, subtract solids from each other, or find the common
volume (overlapping portion) of solids. Solids can be further modified by filleting,
chamfering, or changing the color of their edges.
Solids are displayed as wireframes until you hide, shade, or render them. Additionally, you
can analyze solids for their mass properties (volume, moments of inertia, center of gravity,
and so on). You can break a solid into mesh and wireframe objects using explode
command.
The ISOLINES system variable controls the number of tessellation lines used to visualize
curved portions of the wireframe. The FACETRES system variable adjusts the
smoothness of shaded and hidden-line objects.
Create a Solid Box
You can create rectangular boxes, or cubes. A box consists of six rectangular surface
planes. The base of the box is always parallel with the xy plane of the current UCS.You
position the box by specifying either a corner or the center of the box. You determine the
size of the box by either specifying a second corner and the height; defining the box to be
a cube and then providing its length; or specifying the length, width, and height.
The length of the box is mapping to X axis of current UCS, and its width maps to Y axis,
and height maps to Z axis.
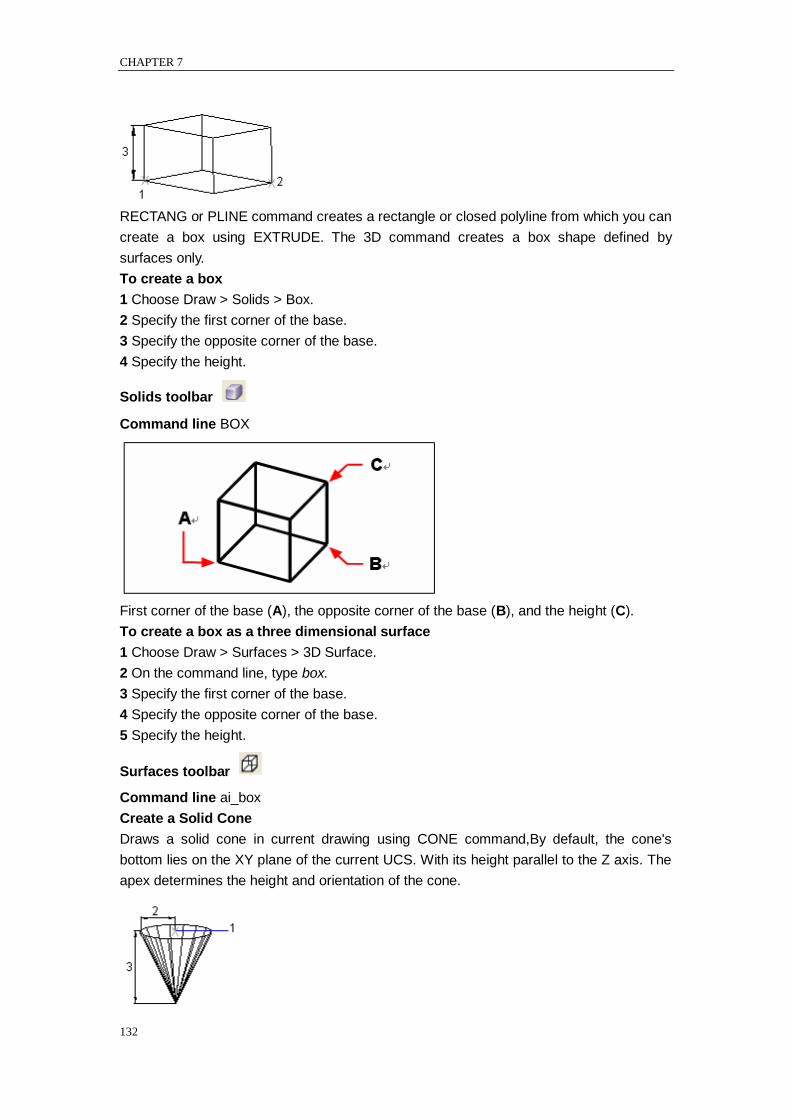
CHAPTER 7
132
RECTANG or PLINE command creates a rectangle or closed polyline from which you can
create a box using EXTRUDE. The 3D command creates a box shape defined by
surfaces only.
To create a box
1 Choose Draw > Solids > Box.
2 Specify the first corner of the base.
3 Specify the opposite corner of the base.
4 Specify the height.
Solids toolbar
Command line BOX
First corner of the base (A), the opposite corner of the base (B), and the height (C).
To create a box as a three dimensional surface
1 Choose Draw > Surfaces > 3D Surface.
2 On the command line, type box.
3 Specify the first corner of the base.
4 Specify the opposite corner of the base.
5 Specify the height.
Surfaces toolbar
Command line ai_box
Create a Solid Cone
Draws a solid cone in current drawing using CONE command,By default, the cone's
bottom lies on the XY plane of the current UCS. With its height parallel to the Z axis. The
apex determines the height and orientation of the cone.
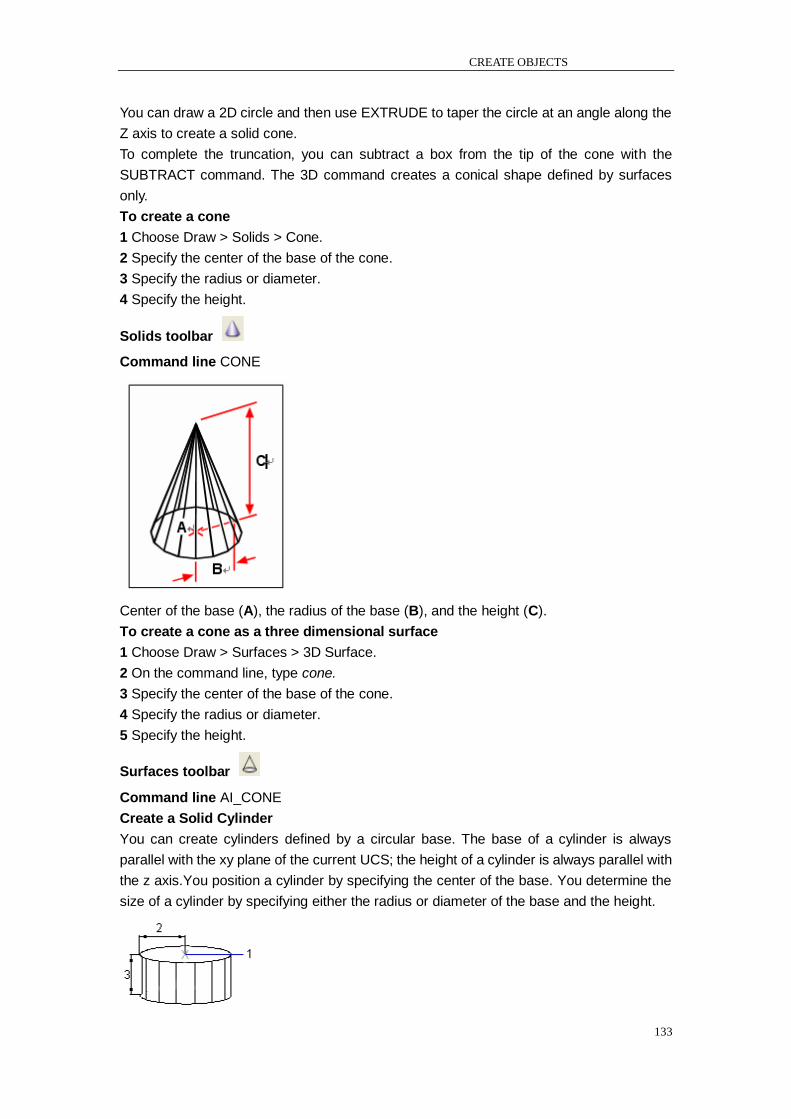
CREATE OBJECTS
133
You can draw a 2D circle and then use EXTRUDE to taper the circle at an angle along the
Z axis to create a solid cone.
To complete the truncation, you can subtract a box from the tip of the cone with the
SUBTRACT command. The 3D command creates a conical shape defined by surfaces
only.
To create a cone
1 Choose Draw > Solids > Cone.
2 Specify the center of the base of the cone.
3 Specify the radius or diameter.
4 Specify the height.
Solids toolbar
Command line CONE
Center of the base (A), the radius of the base (B), and the height (C).
To create a cone as a three dimensional surface
1 Choose Draw > Surfaces > 3D Surface.
2 On the command line, type cone.
3 Specify the center of the base of the cone.
4 Specify the radius or diameter.
5 Specify the height.
Surfaces toolbar
Command line AI_CONE
Create a Solid Cylinder
You can create cylinders defined by a circular base. The base of a cylinder is always
parallel with the xy plane of the current UCS; the height of a cylinder is always parallel with
the z axis.You position a cylinder by specifying the center of the base. You determine the
size of a cylinder by specifying either the radius or diameter of the base and the height.
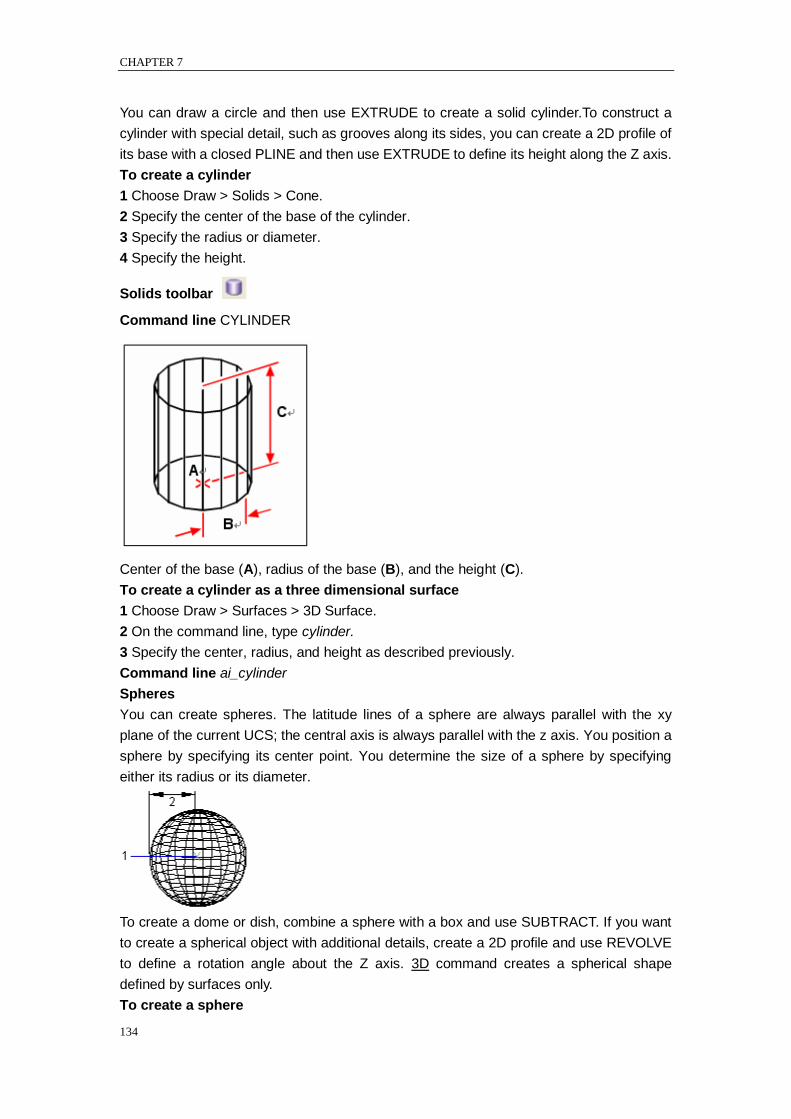
CHAPTER 7
134
You can draw a circle and then use EXTRUDE to create a solid cylinder.To construct a
cylinder with special detail, such as grooves along its sides, you can create a 2D profile of
its base with a closed PLINE and then use EXTRUDE to define its height along the Z axis.
To create a cylinder
1 Choose Draw > Solids > Cone.
2 Specify the center of the base of the cylinder.
3 Specify the radius or diameter.
4 Specify the height.
Solids toolbar
Command line CYLINDER
Center of the base (A), radius of the base (B), and the height (C).
To create a cylinder as a three dimensional surface
1 Choose Draw > Surfaces > 3D Surface.
2 On the command line, type cylinder.
3 Specify the center, radius, and height as described previously.
Command line ai_cylinder
Spheres
You can create spheres. The latitude lines of a sphere are always parallel with the xy
plane of the current UCS; the central axis is always parallel with the z axis. You position a
sphere by specifying its center point. You determine the size of a sphere by specifying
either its radius or its diameter.
To create a dome or dish, combine a sphere with a box and use SUBTRACT. If you want
to create a spherical object with additional details, create a 2D profile and use REVOLVE
to define a rotation angle about the Z axis. 3D command creates a spherical shape
defined by surfaces only.
To create a sphere
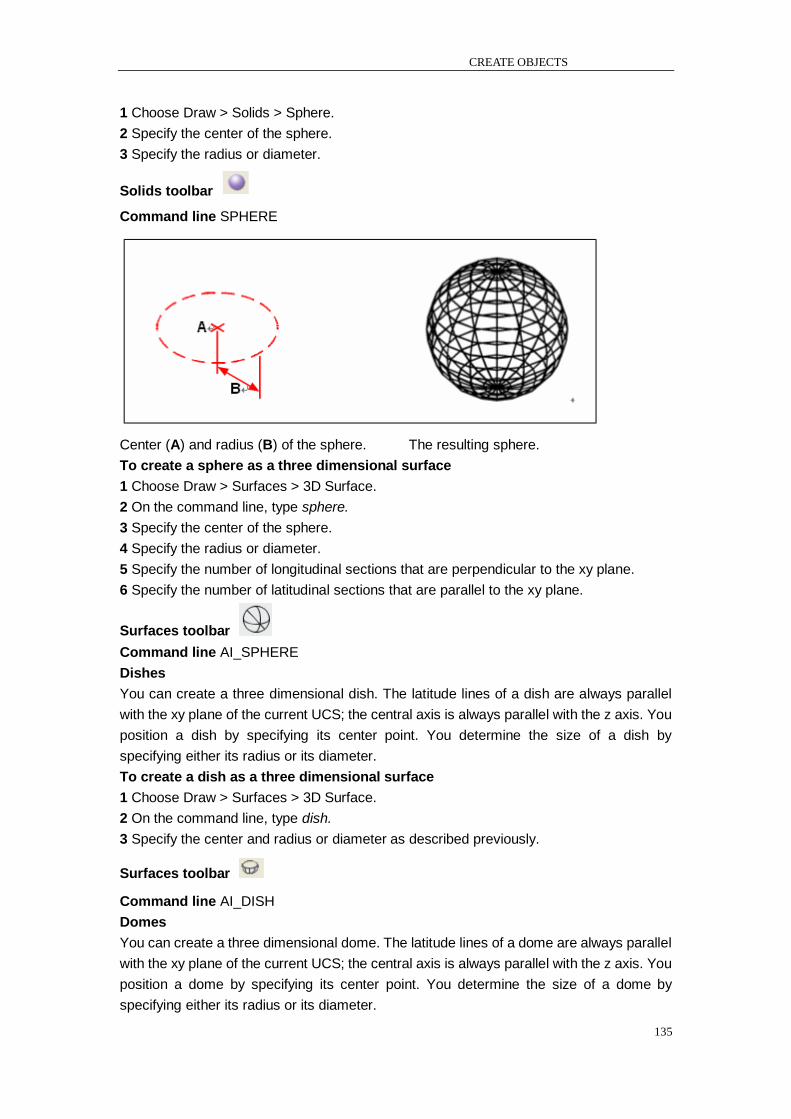
CREATE OBJECTS
135
1 Choose Draw > Solids > Sphere.
2 Specify the center of the sphere.
3 Specify the radius or diameter.
Solids toolbar
Command line SPHERE
Center (A) and radius (B) of the sphere. The resulting sphere.
To create a sphere as a three dimensional surface
1 Choose Draw > Surfaces > 3D Surface.
2 On the command line, type sphere.
3 Specify the center of the sphere.
4 Specify the radius or diameter.
5 Specify the number of longitudinal sections that are perpendicular to the xy plane.
6 Specify the number of latitudinal sections that are parallel to the xy plane.
Surfaces toolbar
Command line AI_SPHERE
Dishes
You can create a three dimensional dish. The latitude lines of a dish are always parallel
with the xy plane of the current UCS; the central axis is always parallel with the z axis. You
position a dish by specifying its center point. You determine the size of a dish by
specifying either its radius or its diameter.
To create a dish as a three dimensional surface
1 Choose Draw > Surfaces > 3D Surface.
2 On the command line, type dish.
3 Specify the center and radius or diameter as described previously.
Surfaces toolbar
Command line AI_DISH
Domes
You can create a three dimensional dome. The latitude lines of a dome are always parallel
with the xy plane of the current UCS; the central axis is always parallel with the z axis. You
position a dome by specifying its center point. You determine the size of a dome by
specifying either its radius or its diameter.
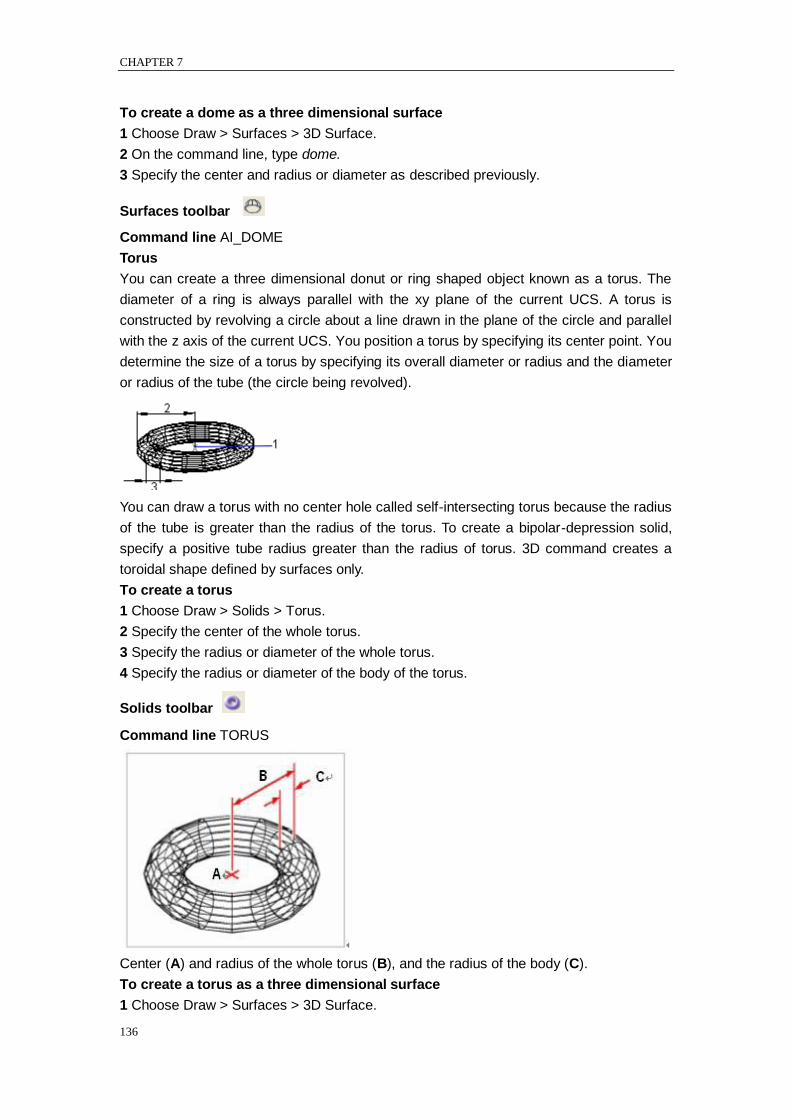
CHAPTER 7
136
To create a dome as a three dimensional surface
1 Choose Draw > Surfaces > 3D Surface.
2 On the command line, type dome.
3 Specify the center and radius or diameter as described previously.
Surfaces toolbar
Command line AI_DOME
Torus
You can create a three dimensional donut or ring shaped object known as a torus. The
diameter of a ring is always parallel with the xy plane of the current UCS. A torus is
constructed by revolving a circle about a line drawn in the plane of the circle and parallel
with the z axis of the current UCS. You position a torus by specifying its center point. You
determine the size of a torus by specifying its overall diameter or radius and the diameter
or radius of the tube (the circle being revolved).
You can draw a torus with no center hole called self-intersecting torus because the radius
of the tube is greater than the radius of the torus. To create a bipolar-depression solid,
specify a positive tube radius greater than the radius of torus. 3D command creates a
toroidal shape defined by surfaces only.
To create a torus
1 Choose Draw > Solids > Torus.
2 Specify the center of the whole torus.
3 Specify the radius or diameter of the whole torus.
4 Specify the radius or diameter of the body of the torus.
Solids toolbar
Command line TORUS
Center (A) and radius of the whole torus (B), and the radius of the body (C).
To create a torus as a three dimensional surface
1 Choose Draw > Surfaces > 3D Surface.
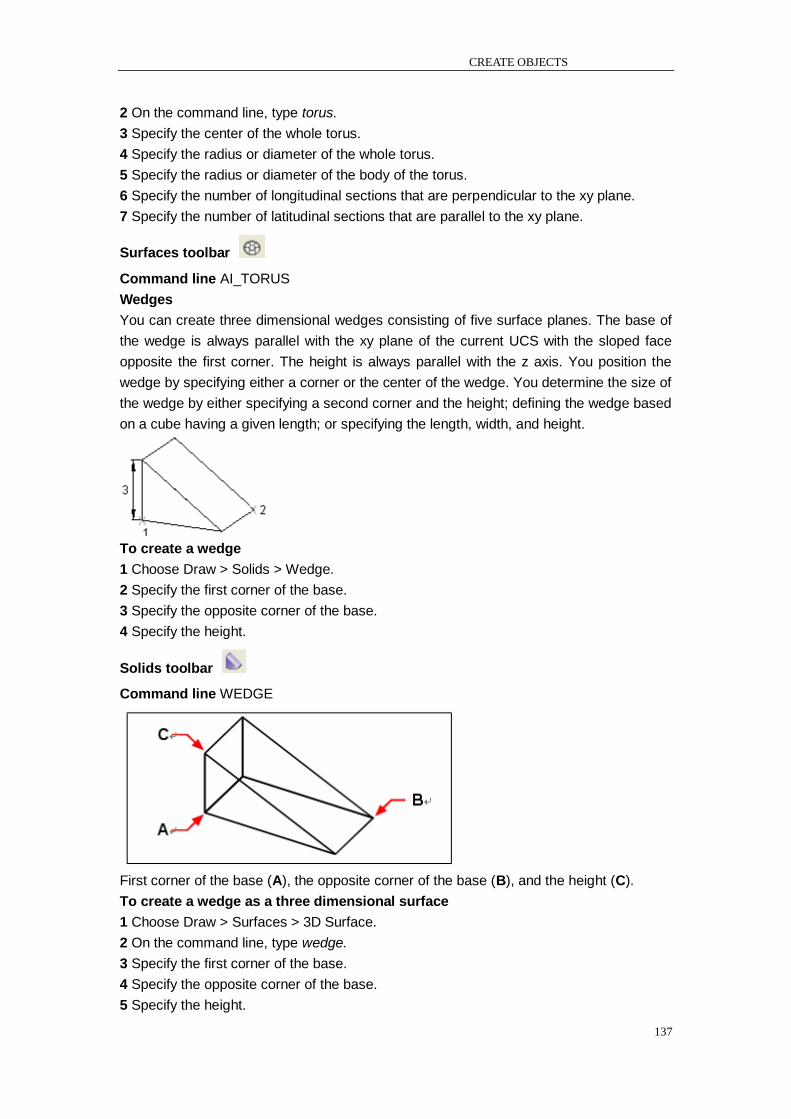
CREATE OBJECTS
137
2 On the command line, type torus.
3 Specify the center of the whole torus.
4 Specify the radius or diameter of the whole torus.
5 Specify the radius or diameter of the body of the torus.
6 Specify the number of longitudinal sections that are perpendicular to the xy plane.
7 Specify the number of latitudinal sections that are parallel to the xy plane.
Surfaces toolbar
Command line AI_TORUS
Wedges
You can create three dimensional wedges consisting of five surface planes. The base of
the wedge is always parallel with the xy plane of the current UCS with the sloped face
opposite the first corner. The height is always parallel with the z axis. You position the
wedge by specifying either a corner or the center of the wedge. You determine the size of
the wedge by either specifying a second corner and the height; defining the wedge based
on a cube having a given length; or specifying the length, width, and height.
To create a wedge
1 Choose Draw > Solids > Wedge.
2 Specify the first corner of the base.
3 Specify the opposite corner of the base.
4 Specify the height.
Solids toolbar
Command line WEDGE
First corner of the base (A), the opposite corner of the base (B), and the height (C).
To create a wedge as a three dimensional surface
1 Choose Draw > Surfaces > 3D Surface.
2 On the command line, type wedge.
3 Specify the first corner of the base.
4 Specify the opposite corner of the base.
5 Specify the height.
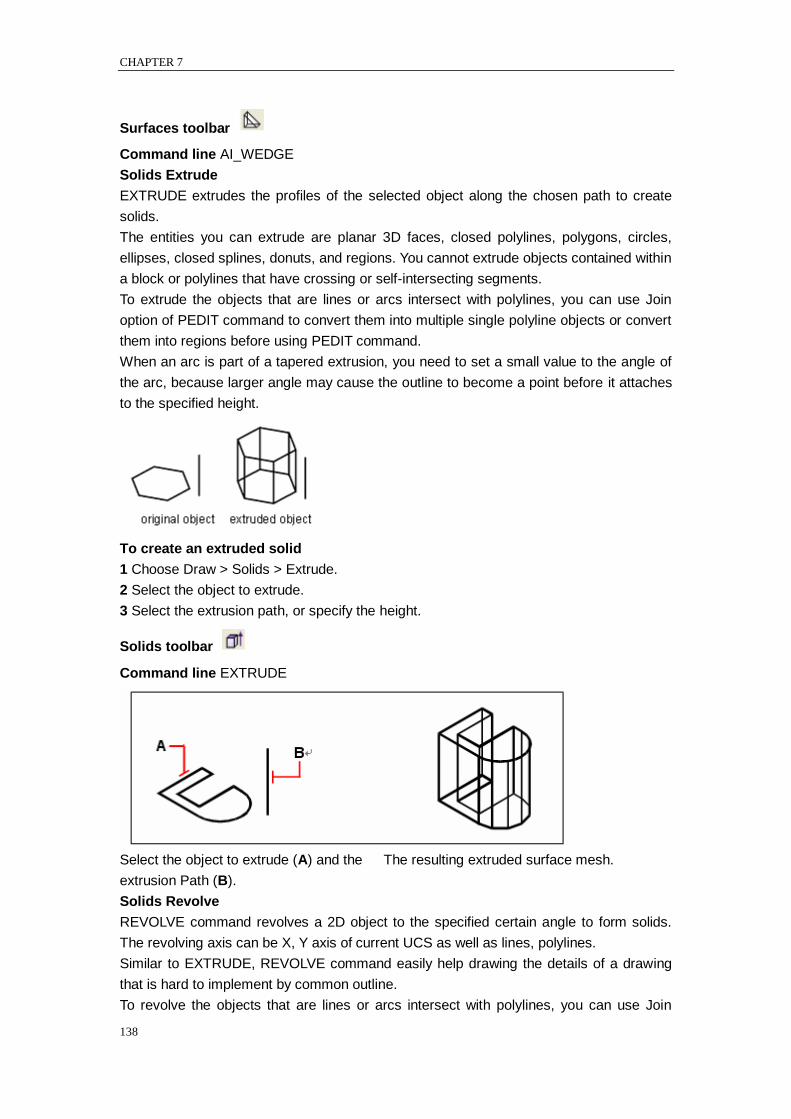
CHAPTER 7
138
Surfaces toolbar
Command line AI_WEDGE
Solids Extrude
EXTRUDE extrudes the profiles of the selected object along the chosen path to create
solids.
The entities you can extrude are planar 3D faces, closed polylines, polygons, circles,
ellipses, closed splines, donuts, and regions. You cannot extrude objects contained within
a block or polylines that have crossing or self-intersecting segments.
To extrude the objects that are lines or arcs intersect with polylines, you can use Join
option of PEDIT command to convert them into multiple single polyline objects or convert
them into regions before using PEDIT command.
When an arc is part of a tapered extrusion, you need to set a small value to the angle of
the arc, because larger angle may cause the outline to become a point before it attaches
to the specified height.
To create an extruded solid
1 Choose Draw > Solids > Extrude.
2 Select the object to extrude.
3 Select the extrusion path, or specify the height.
Solids toolbar
Command line EXTRUDE
Select the object to extrude (A) and the The resulting extruded surface mesh.
extrusion Path (B).
Solids Revolve
REVOLVE command revolves a 2D object to the specified certain angle to form solids.
The revolving axis can be X, Y axis of current UCS as well as lines, polylines.
Similar to EXTRUDE, REVOLVE command easily help drawing the details of a drawing
that is hard to implement by common outline.
To revolve the objects that are lines or arcs intersect with polylines, you can use Join

CREATE OBJECTS
139
option of PEDIT command to convert them into multiple single polyline objects, and then
perform REVOLVE command.
Objects can be revolved are closed polylines, polygons, rectangles, circles, ellipses,
regions and so on. On contrary,the objects can‘t be revolved are 3D objects, objects that
are included in a block, polylines with intersections and transections or unclosed polylines.
To create a revolved solid
1 Choose Draw > Solids > Revolve.
2 Select the object to revolve.
3 Do one of the following to define the axis of revolution:
Specify a start point and an end point.
Type o and press Enter to select an object that determines the axis.
Type x and press Enter to select the x axis.
Type y and press Enter to select the y axis.
4 Specify the angle of revolution.
Solids toolbar
Command line REVOLVE
Select the object to revolve (A) and the axis (B) about The resulting revolved solid.
which to revolve it. followed by the angle of revolution.
Creating composite solids
You can create composite three-dimensional solids by combining, subtracting, and finding
the intersection of two or more solids.
With UNION command, you can combine the total volume of two or more solids or two or
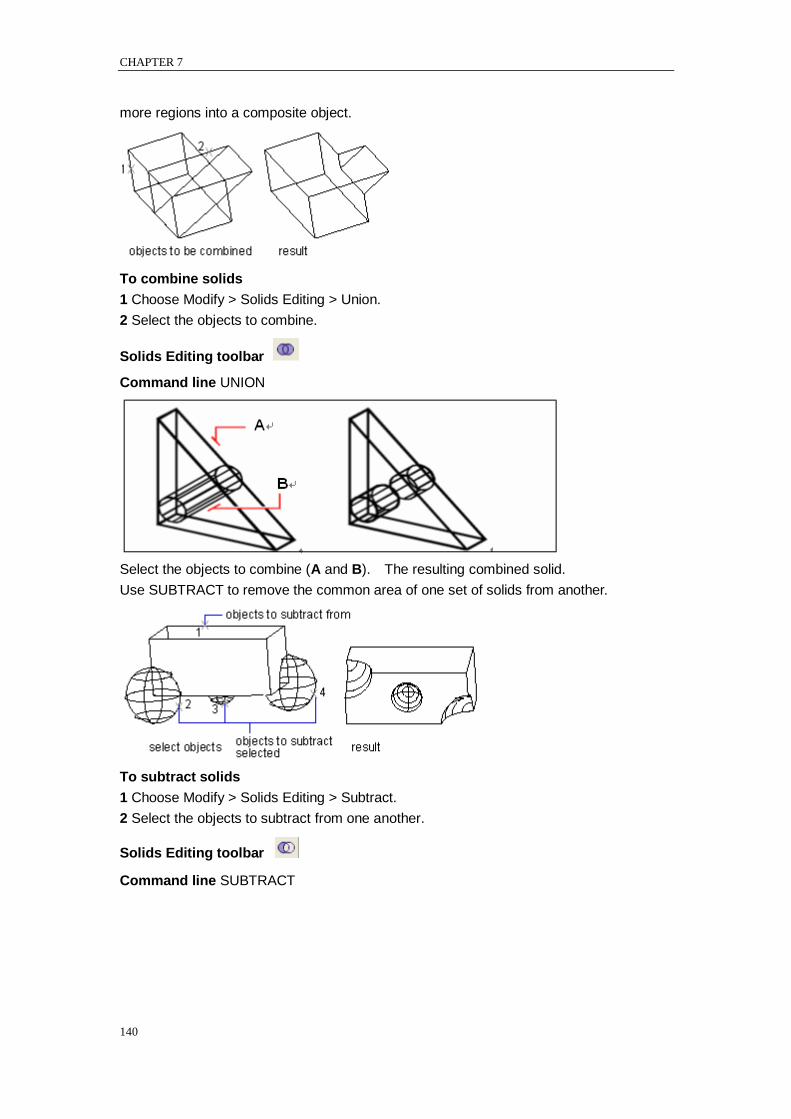
CHAPTER 7
140
more regions into a composite object.
To combine solids
1 Choose Modify > Solids Editing > Union.
2 Select the objects to combine.
Solids Editing toolbar
Command line UNION
Select the objects to combine (A and B). The resulting combined solid.
Use SUBTRACT to remove the common area of one set of solids from another.
To subtract solids
1 Choose Modify > Solids Editing > Subtract.
2 Select the objects to subtract from one another.
Solids Editing toolbar
Command line SUBTRACT
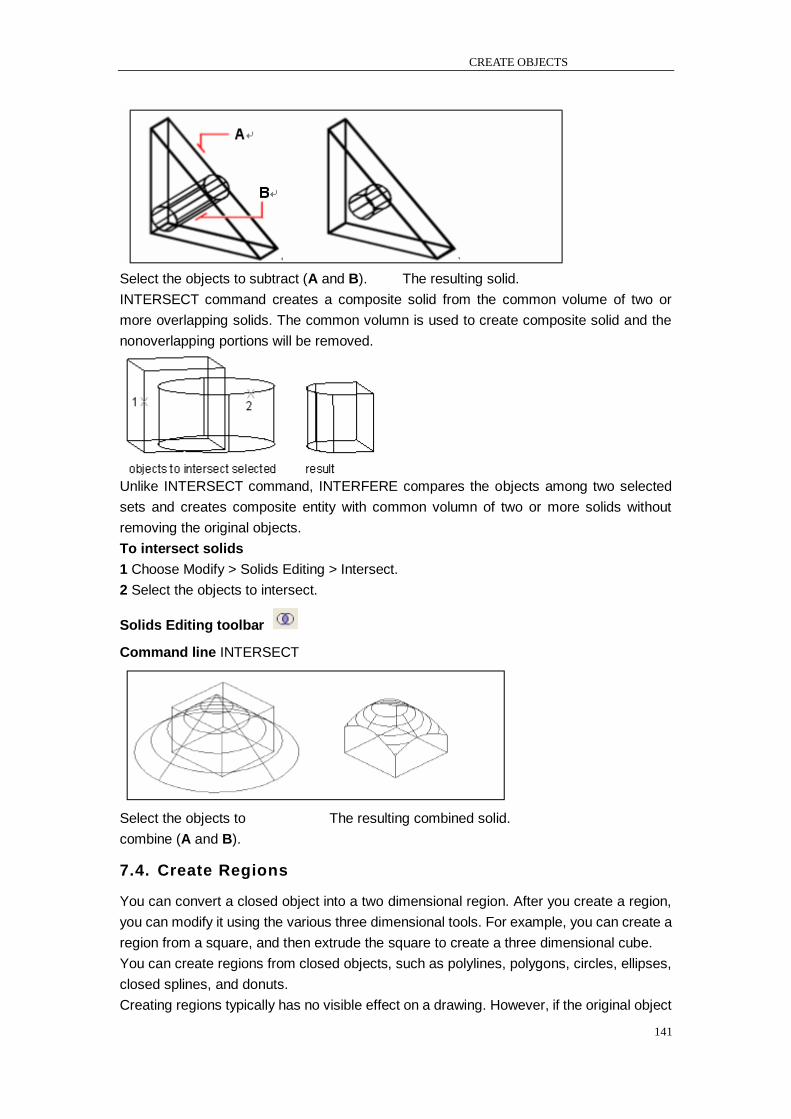
CREATE OBJECTS
141
Select the objects to subtract (A and B). The resulting solid.
INTERSECT command creates a composite solid from the common volume of two or
more overlapping solids. The common volumn is used to create composite solid and the
nonoverlapping portions will be removed.
Unlike INTERSECT command, INTERFERE compares the objects among two selected
sets and creates composite entity with common volumn of two or more solids without
removing the original objects.
To intersect solids
1 Choose Modify > Solids Editing > Intersect.
2 Select the objects to intersect.
Solids Editing toolbar
Command line INTERSECT
Select the objects to The resulting combined solid.
combine (A and B).
7.4. Create Regions
You can convert a closed object into a two dimensional region. After you create a region,
you can modify it using the various three dimensional tools. For example, you can create a
region from a square, and then extrude the square to create a three dimensional cube.
You can create regions from closed objects, such as polylines, polygons, circles, ellipses,
closed splines, and donuts.
Creating regions typically has no visible effect on a drawing. However, if the original object
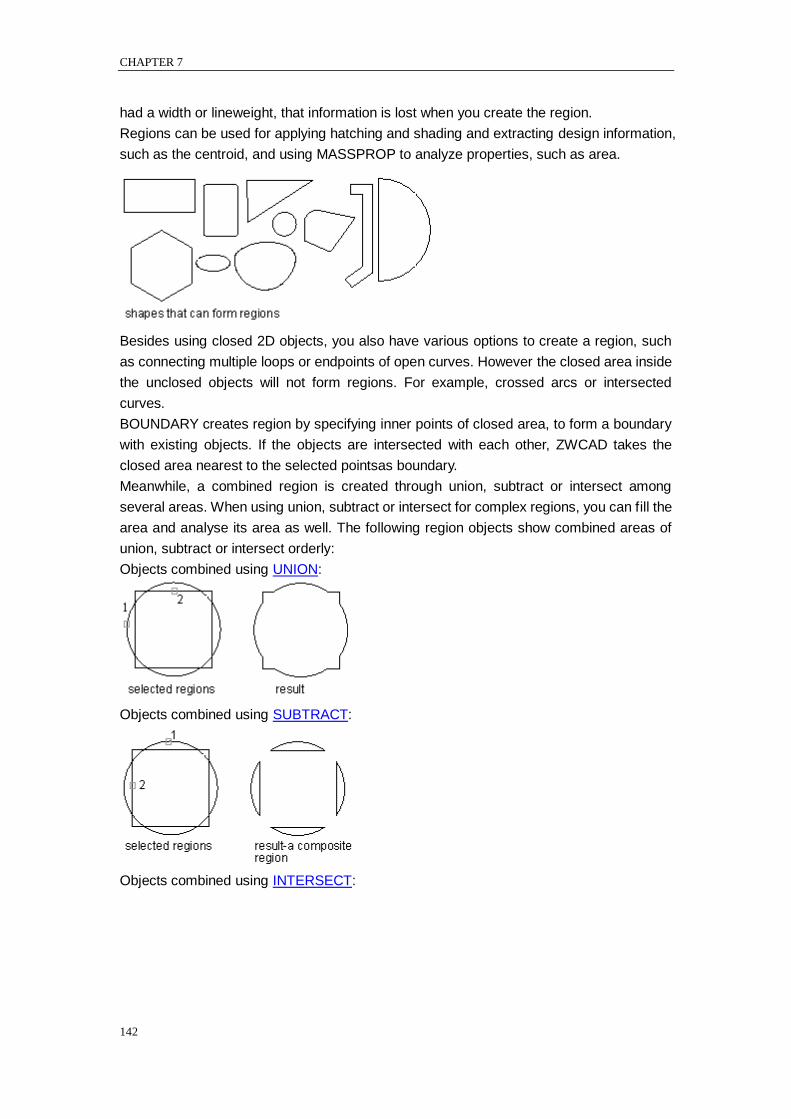
CHAPTER 7
142
had a width or lineweight, that information is lost when you create the region.
Regions can be used for applying hatching and shading and extracting design information,
such as the centroid, and using MASSPROP to analyze properties, such as area.
Besides using closed 2D objects, you also have various options to create a region, such
as connecting multiple loops or endpoints of open curves. However the closed area inside
the unclosed objects will not form regions. For example, crossed arcs or intersected
curves.
BOUNDARY creates region by specifying inner points of closed area, to form a boundary
with existing objects. If the objects are intersected with each other, ZWCAD takes the
closed area nearest to the selected pointsas boundary.
Meanwhile, a combined region is created through union, subtract or intersect among
several areas. When using union, subtract or intersect for complex regions, you can fill the
area and analyse its area as well. The following region objects show combined areas of
union, subtract or intersect orderly:
Objects combined using UNION:
Objects combined using SUBTRACT:
Objects combined using INTERSECT:

CREATE OBJECTS
143
To create a region
1 Choose Draw > Region.
2 Select the objects to create the region.
3 Press Enter.
The command bar displays a message that describes how many regions were created.
Draw toolbar
Command line REGION
7.5. Create Revision Clouds
REVCLOUD creates a polyline of sequential arcs to form a cloud-shaped object. Revision
Cloud help mark your drawings by highlighting some important parts when review or
redline drawings.
You can create a revision cloud from scratch, or you can convert objects, such as a circle,
ellipse, polyline, or spline, to a revision cloud. If DELOBJ is set to 1 (the default),the
original object is deleted once you convert an object to a revision cloud.
You can set the minimum and maximum default values for the arc lengths of a revision
cloud. You should notice that the maximum arc length can't be more than 3 times as big as
the minimum arc length.REVCLOUD stores the last used arc length as a multiple of the
DIMSCALE system variable to provide consistency among drawings with different scale
factors.
Make sure that the entire area to be outlined with REVCLOUD before using the command.
REVCLOUD can‘t be transparent used and real-time panning and zooming.
7.6. Create Break Lines
Creates a polyline and inserts the breakline symbol. Options are provided to control the
relative size and appearance of the breakline symbol and an extension of the polyline
beyond the selected start and end points.
To use your own block for the breakline symbol, make sure that the block contains two
point objects on the Defpoints layer. Those point objects determine the placement of the
symbol and how the line will be broken.
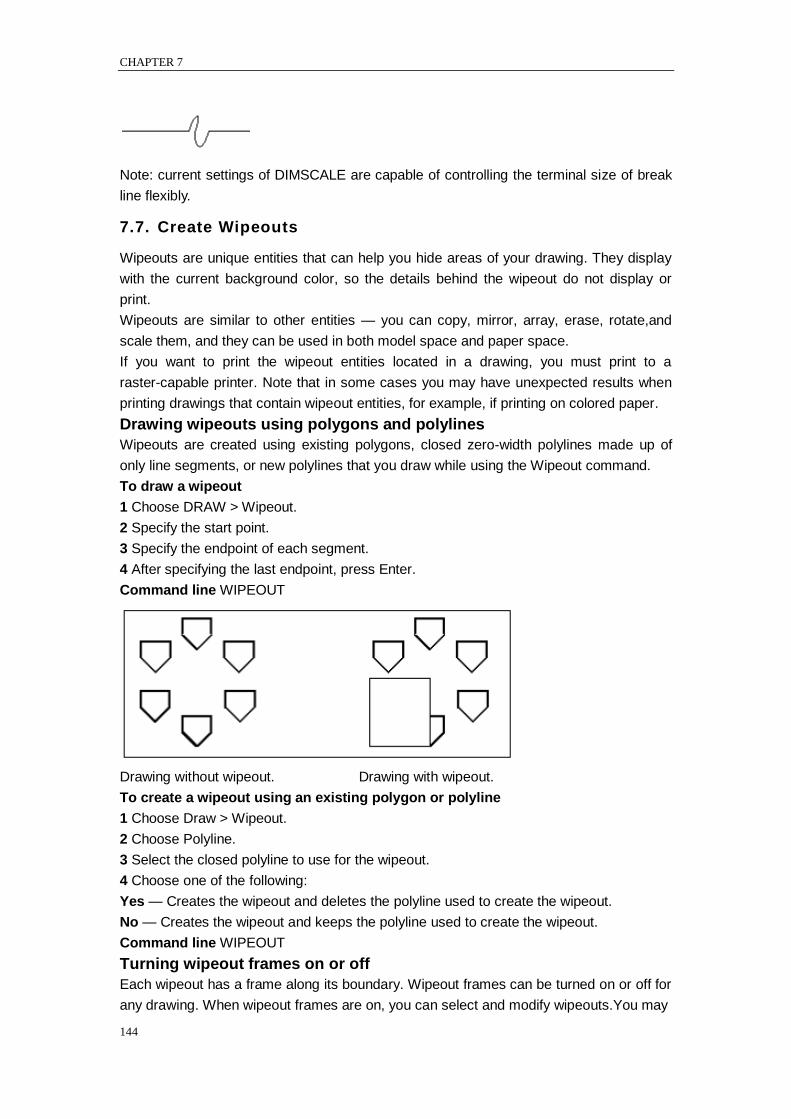
CHAPTER 7
144
Note: current settings of DIMSCALE are capable of controlling the terminal size of break
line flexibly.
7.7. Create Wipeouts
Wipeouts are unique entities that can help you hide areas of your drawing. They display
with the current background color, so the details behind the wipeout do not display or
print.
Wipeouts are similar to other entities — you can copy, mirror, array, erase, rotate,and
scale them, and they can be used in both model space and paper space.
If you want to print the wipeout entities located in a drawing, you must print to a
raster-capable printer. Note that in some cases you may have unexpected results when
printing drawings that contain wipeout entities, for example, if printing on colored paper.
Drawing wipeouts using polygons and polylines
Wipeouts are created using existing polygons, closed zero-width polylines made up of
only line segments, or new polylines that you draw while using the Wipeout command.
To draw a wipeout
1 Choose DRAW > Wipeout.
2 Specify the start point.
3 Specify the endpoint of each segment.
4 After specifying the last endpoint, press Enter.
Command line WIPEOUT
Drawing without wipeout. Drawing with wipeout.
To create a wipeout using an existing polygon or polyline
1 Choose Draw > Wipeout.
2 Choose Polyline.
3 Select the closed polyline to use for the wipeout.
4 Choose one of the following:
Yes — Creates the wipeout and deletes the polyline used to create the wipeout.
No — Creates the wipeout and keeps the polyline used to create the wipeout.
Command line WIPEOUT
Turning wipeout frames on or off
Each wipeout has a frame along its boundary. Wipeout frames can be turned on or off for
any drawing. When wipeout frames are on, you can select and modify wipeouts.You may
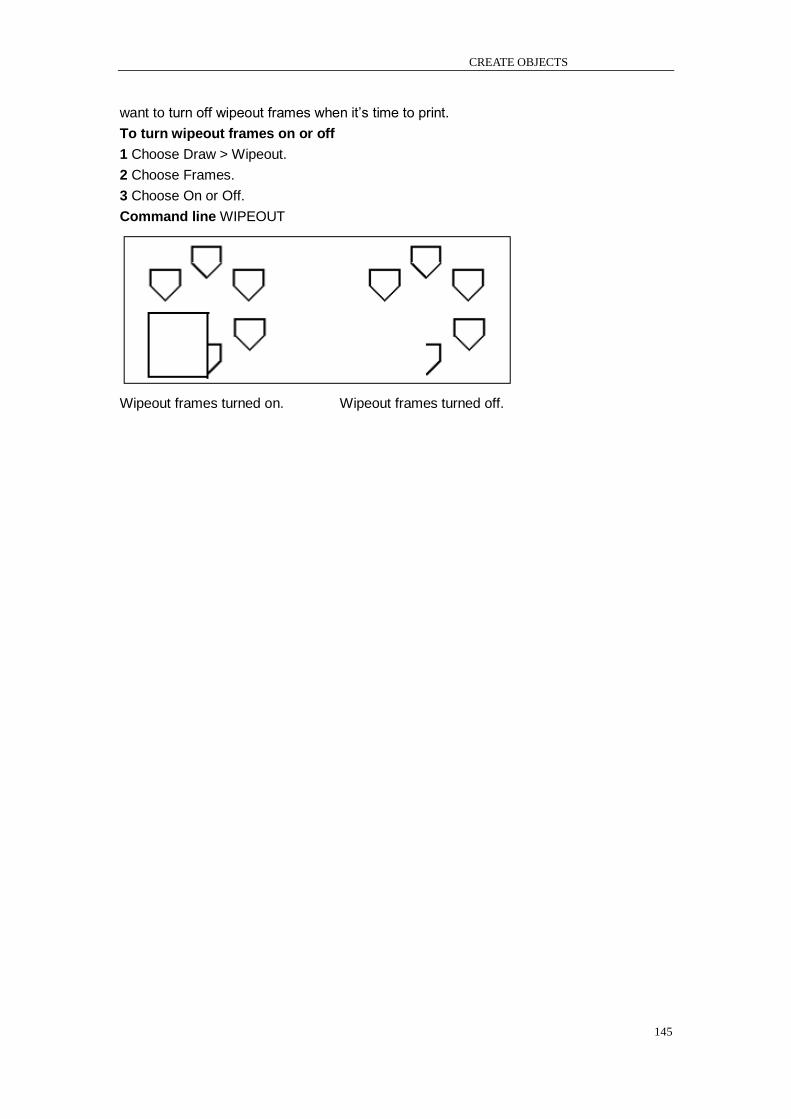
CREATE OBJECTS
145
want to turn off wipeout frames when it‘s time to print.
To turn wipeout frames on or off
1 Choose Draw > Wipeout.
2 Choose Frames.
3 Choose On or Off.
Command line WIPEOUT
Wipeout frames turned on. Wipeout frames turned off.
CHAPTER 8
146
8. Modify Objects
8.1. Select Objects
You can create a selection set that consists of one or more objects before you modify
them.
Use any of the following methods to create a selection set:
Choose a command or tool first, and then select objects.
Select objects first, and then choose a command or tool (most objects).
Select objects by pointing, and then use grips to modify them.
8.1.1. Select Objects Individually
You can select one or more objects under the prompt of Select entities on the command
line. The selected highlights on the screen and could be removed from the selection set.
Select objects with pickbox.
You can select objects using mouse or other pointing device. The mouse or other pointing
device is represented of square pickbox on the drawing area. When selecting object, the
cursor square pickbox should be in the position of an object but not inside it. The size of
pickbox can be changed on the Selection tab of Options dialog box.
Remove Selection from Objects
If an entity is no longer needed in a selection set, you can deselect it to remove it from the
selection set.
To remove an entity from the selection set
1 Press Shift, and then select the entity again.
NOTE Pressing Shift while selecting entities using a crossing window removes all entities
from the specified selection set.
To remove all entities from the selection set
1 Press Escape.
Prevent Objects from Being Selected
You can prevent objects from being selected by locking layer. Because locking layer
means that you can do any operations except for editing objects on this layer. You can set
the locked layer as the current layer and add objects as well as using requiring command
(such as LIST) and Objects Snap.
You can control whether you select objects first or type a command first, whether the
selected objects is highlighted, how to define the selection area, how to create a selection
set.
Select Objects First
You can select objects first and then choose how to modify them. As you select each
object, it is highlighted with small squares called grips, which appear at strategic points on
the object.
The locations of the grips depend on the type of object selected. For example, grips
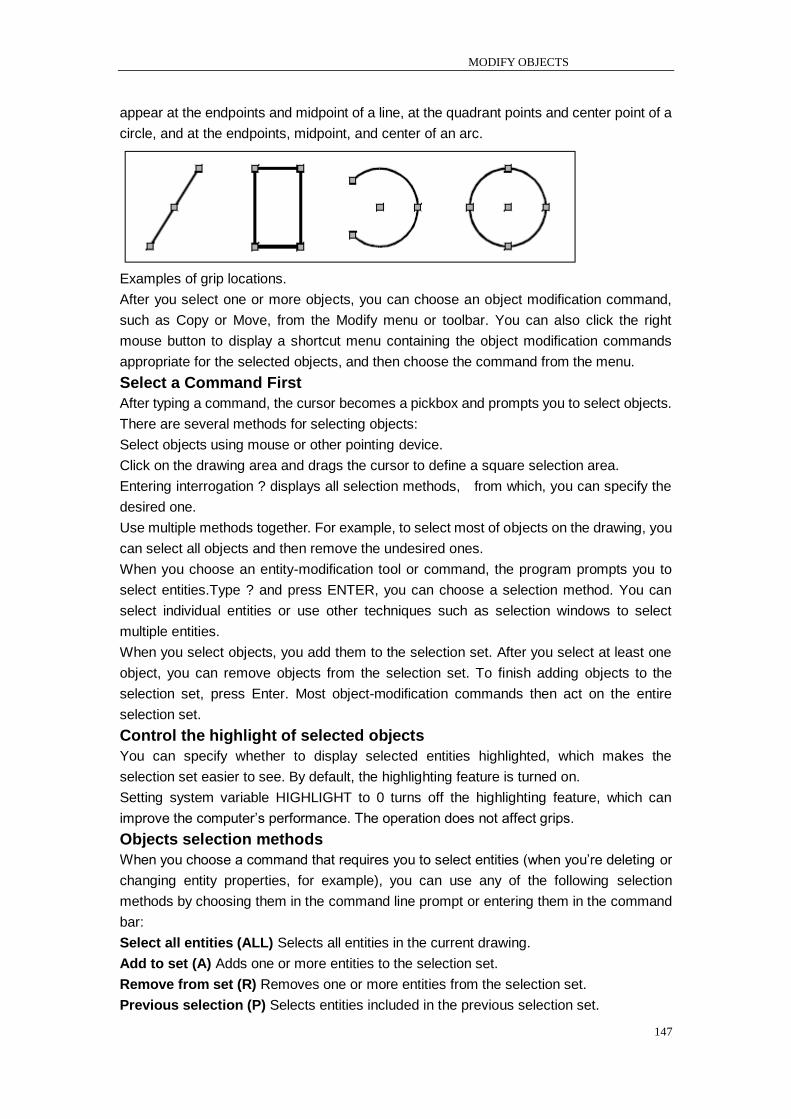
MODIFY OBJECTS
147
appear at the endpoints and midpoint of a line, at the quadrant points and center point of a
circle, and at the endpoints, midpoint, and center of an arc.
Examples of grip locations.
After you select one or more objects, you can choose an object modification command,
such as Copy or Move, from the Modify menu or toolbar. You can also click the right
mouse button to display a shortcut menu containing the object modification commands
appropriate for the selected objects, and then choose the command from the menu.
Select a Command First
After typing a command, the cursor becomes a pickbox and prompts you to select objects.
There are several methods for selecting objects:
Select objects using mouse or other pointing device.
Click on the drawing area and drags the cursor to define a square selection area.
Entering interrogation ? displays all selection methods, from which, you can specify the
desired one.
Use multiple methods together. For example, to select most of objects on the drawing, you
can select all objects and then remove the undesired ones.
When you choose an entity-modification tool or command, the program prompts you to
select entities.Type ? and press ENTER, you can choose a selection method. You can
select individual entities or use other techniques such as selection windows to select
multiple entities.
When you select objects, you add them to the selection set. After you select at least one
object, you can remove objects from the selection set. To finish adding objects to the
selection set, press Enter. Most object-modification commands then act on the entire
selection set.
Control the highlight of selected objects
You can specify whether to display selected entities highlighted, which makes the
selection set easier to see. By default, the highlighting feature is turned on.
Setting system variable HIGHLIGHT to 0 turns off the highlighting feature, which can
improve the computer‘s performance. The operation does not affect grips.
Objects selection methods
When you choose a command that requires you to select entities (when you‘re deleting or
changing entity properties, for example), you can use any of the following selection
methods by choosing them in the command line prompt or entering them in the command
bar:
Select all entities (ALL) Selects all entities in the current drawing.
Add to set (A) Adds one or more entities to the selection set.
Remove from set (R) Removes one or more entities from the selection set.
Previous selection (P) Selects entities included in the previous selection set.
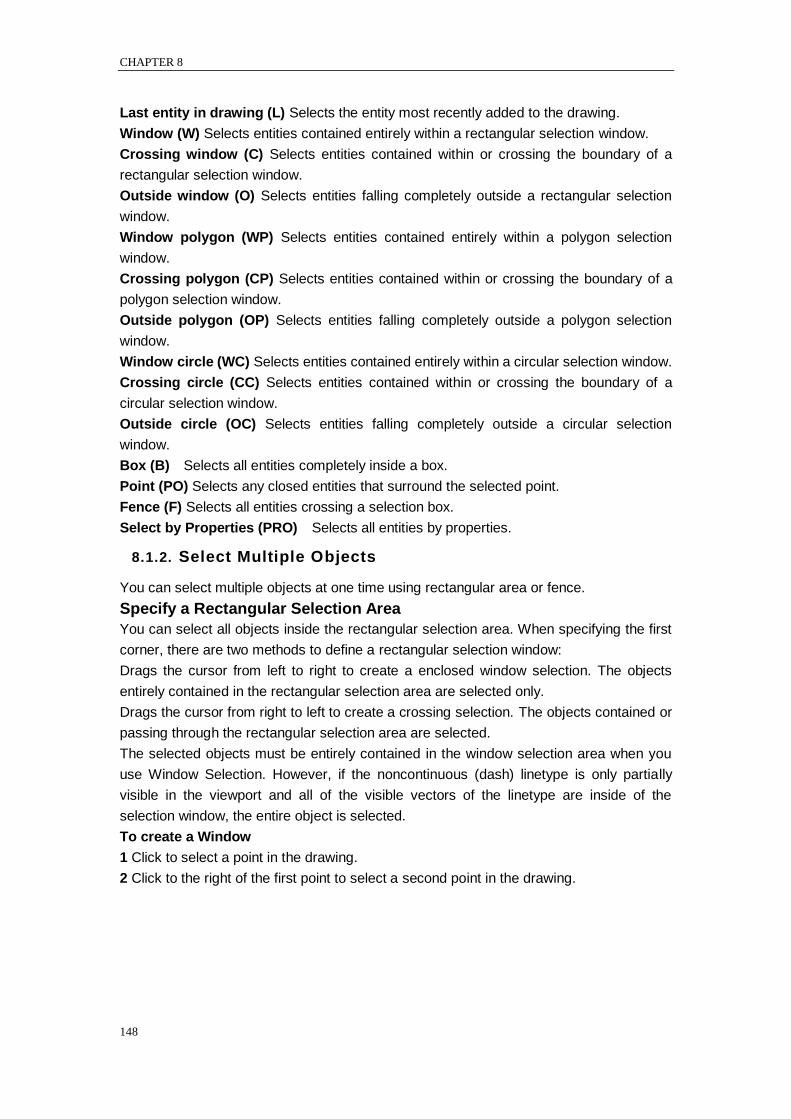
CHAPTER 8
148
Last entity in drawing (L) Selects the entity most recently added to the drawing.
Window (W) Selects entities contained entirely within a rectangular selection window.
Crossing window (C) Selects entities contained within or crossing the boundary of a
rectangular selection window.
Outside window (O) Selects entities falling completely outside a rectangular selection
window.
Window polygon (WP) Selects entities contained entirely within a polygon selection
window.
Crossing polygon (CP) Selects entities contained within or crossing the boundary of a
polygon selection window.
Outside polygon (OP) Selects entities falling completely outside a polygon selection
window.
Window circle (WC) Selects entities contained entirely within a circular selection window.
Crossing circle (CC) Selects entities contained within or crossing the boundary of a
circular selection window.
Outside circle (OC) Selects entities falling completely outside a circular selection
window.
Box (B) Selects all entities completely inside a box.
Point (PO) Selects any closed entities that surround the selected point.
Fence (F) Selects all entities crossing a selection box.
Select by Properties (PRO) Selects all entities by properties.
8.1.2. Select Multiple Objects
You can select multiple objects at one time using rectangular area or fence.
Specify a Rectangular Selection Area
You can select all objects inside the rectangular selection area. When specifying the first
corner, there are two methods to define a rectangular selection window:
Drags the cursor from left to right to create a enclosed window selection. The objects
entirely contained in the rectangular selection area are selected only.
Drags the cursor from right to left to create a crossing selection. The objects contained or
passing through the rectangular selection area are selected.
The selected objects must be entirely contained in the window selection area when you
use Window Selection. However, if the noncontinuous (dash) linetype is only partially
visible in the viewport and all of the visible vectors of the linetype are inside of the
selection window, the entire object is selected.
To create a Window
1 Click to select a point in the drawing.
2 Click to the right of the first point to select a second point in the drawing.
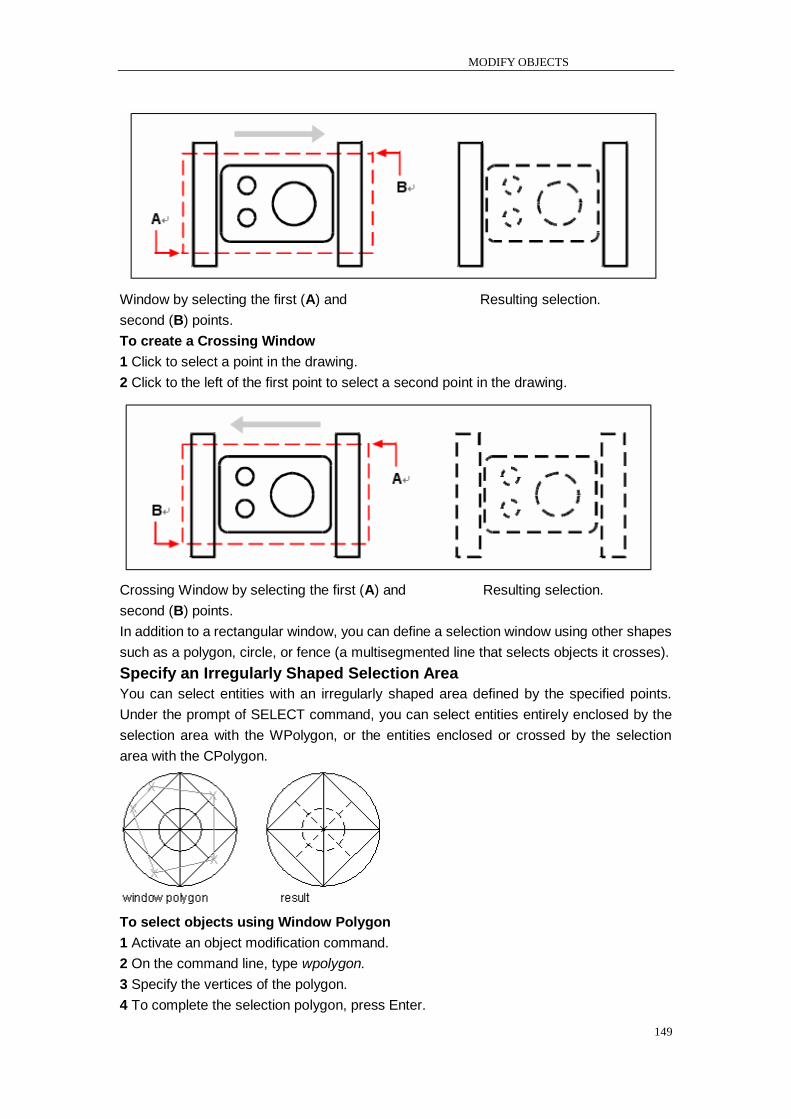
MODIFY OBJECTS
149
Window by selecting the first (A) and Resulting selection.
second (B) points.
To create a Crossing Window
1 Click to select a point in the drawing.
2 Click to the left of the first point to select a second point in the drawing.
Crossing Window by selecting the first (A) and Resulting selection.
second (B) points.
In addition to a rectangular window, you can define a selection window using other shapes
such as a polygon, circle, or fence (a multisegmented line that selects objects it crosses).
Specify an Irregularly Shaped Selection Area
You can select entities with an irregularly shaped area defined by the specified points.
Under the prompt of SELECT command, you can select entities entirely enclosed by the
selection area with the WPolygon, or the entities enclosed or crossed by the selection
area with the CPolygon.
To select objects using Window Polygon
1 Activate an object modification command.
2 On the command line, type wpolygon.
3 Specify the vertices of the polygon.
4 To complete the selection polygon, press Enter.
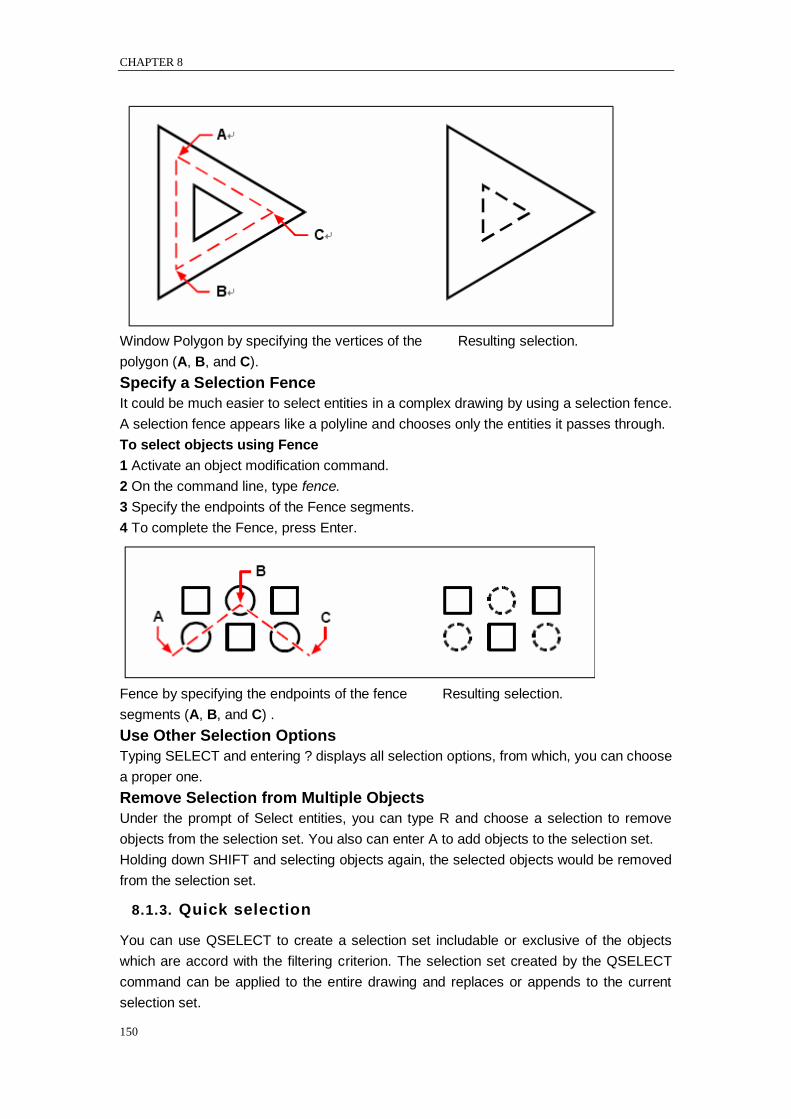
CHAPTER 8
150
Window Polygon by specifying the vertices of the Resulting selection.
polygon (A, B, and C).
Specify a Selection Fence
It could be much easier to select entities in a complex drawing by using a selection fence.
A selection fence appears like a polyline and chooses only the entities it passes through.
To select objects using Fence
1 Activate an object modification command.
2 On the command line, type fence.
3 Specify the endpoints of the Fence segments.
4 To complete the Fence, press Enter.
Fence by specifying the endpoints of the fence Resulting selection.
segments (A, B, and C) .
Use Other Selection Options
Typing SELECT and entering ? displays all selection options, from which, you can choose
a proper one.
Remove Selection from Multiple Objects
Under the prompt of Select entities, you can type R and choose a selection to remove
objects from the selection set. You also can enter A to add objects to the selection set.
Holding down SHIFT and selecting objects again, the selected objects would be removed
from the selection set.
8.1.3. Quick selection
You can use QSELECT to create a selection set includable or exclusive of the objects
which are accord with the filtering criterion. The selection set created by the QSELECT
command can be applied to the entire drawing and replaces or appends to the current
selection set.
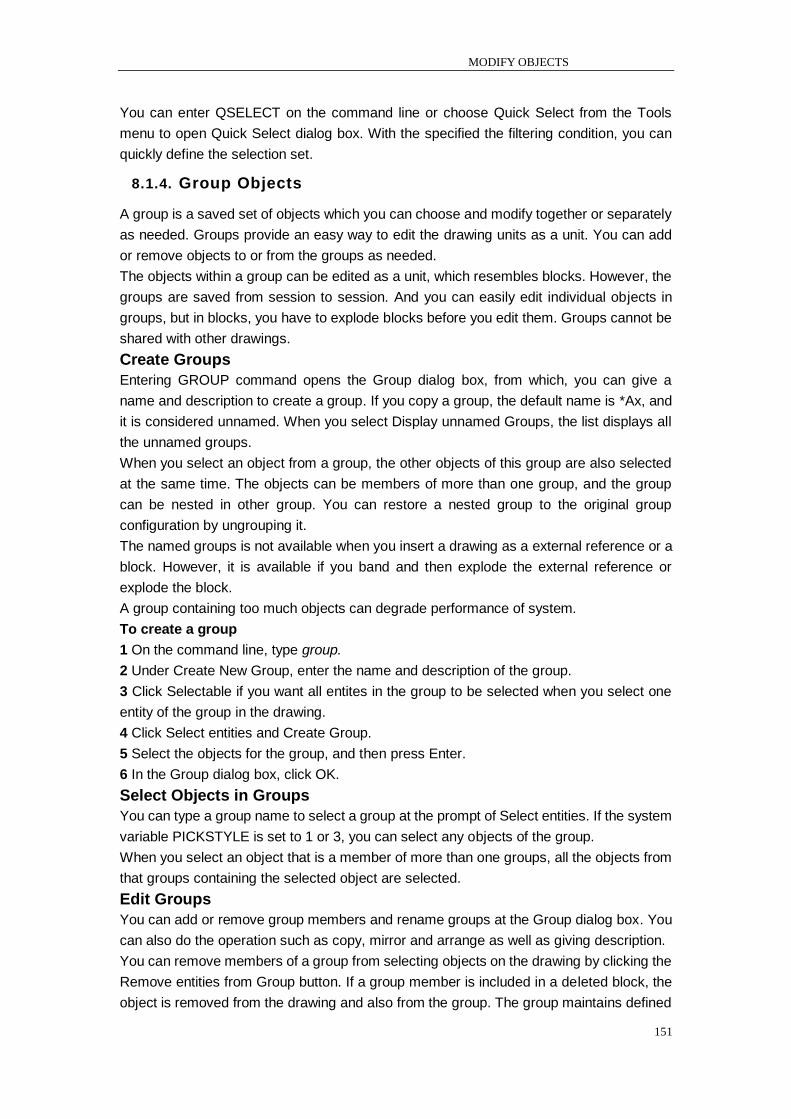
MODIFY OBJECTS
151
You can enter QSELECT on the command line or choose Quick Select from the Tools
menu to open Quick Select dialog box. With the specified the filtering condition, you can
quickly define the selection set.
8.1.4. Group Objects
A group is a saved set of objects which you can choose and modify together or separately
as needed. Groups provide an easy way to edit the drawing units as a unit. You can add
or remove objects to or from the groups as needed.
The objects within a group can be edited as a unit, which resembles blocks. However, the
groups are saved from session to session. And you can easily edit individual objects in
groups, but in blocks, you have to explode blocks before you edit them. Groups cannot be
shared with other drawings.
Create Groups
Entering GROUP command opens the Group dialog box, from which, you can give a
name and description to create a group. If you copy a group, the default name is *Ax, and
it is considered unnamed. When you select Display unnamed Groups, the list displays all
the unnamed groups.
When you select an object from a group, the other objects of this group are also selected
at the same time. The objects can be members of more than one group, and the group
can be nested in other group. You can restore a nested group to the original group
configuration by ungrouping it.
The named groups is not available when you insert a drawing as a external reference or a
block. However, it is available if you band and then explode the external reference or
explode the block.
A group containing too much objects can degrade performance of system.
To create a group
1 On the command line, type group.
2 Under Create New Group, enter the name and description of the group.
3 Click Selectable if you want all entites in the group to be selected when you select one
entity of the group in the drawing.
4 Click Select entities and Create Group.
5 Select the objects for the group, and then press Enter.
6 In the Group dialog box, click OK.
Select Objects in Groups
You can type a group name to select a group at the prompt of Select entities. If the system
variable PICKSTYLE is set to 1 or 3, you can select any objects of the group.
When you select an object that is a member of more than one groups, all the objects from
that groups containing the selected object are selected.
Edit Groups
You can add or remove group members and rename groups at the Group dialog box. You
can also do the operation such as copy, mirror and arrange as well as giving description.
You can remove members of a group from selecting objects on the drawing by clicking the
Remove entities from Group button. If a group member is included in a deleted block, the
object is removed from the drawing and also from the group. The group maintains defined
CHAPTER 8
152
even all the group members are removed.
To modify a group and its objects
1 On the command line, type group.
2 Select the group you want to modify.
3 Under Modify Selected Group, do one or more of the following:
Enter a new name, and then click Rename Group.
Enter a new description, and then click Change Group Description.
Select whether you want the group to be selectable in the drawing.
Click Add Entities to Group, select the objects to add to the group, and then press Enter.
Click Remove Entities from Group, select the objects to remove from the group, and then
press Enter.
4 In the Group dialog box, click OK.
You can delete group definition by clicking Un-group entities button. The group is also
removed from the drawing; however, the group members remain in the drawing.
To ungroup objects
1 On the command line, type group.
2 Select the group to delete.
3 Under Modify Selected Group, click Ungroup Entities.
4 Click OK.
Exploding a group deletes it from a drawing; however, objects that were part of the group
remain in the drawing.
The group‘s member order can be changed (the order in which the objects were selected).
There are two ways to reorder group members.
Change the serial number of individual members or arranges of group members.
Reverse the ranking of all members. The number of first object in each group starts from 0
rather than 1.
To change the order of objects in a group
1 On the command line, type group.
2 Under Modify Selected Group, click Reorder Entities.
3 In the Reorder Grouped Entities dialog box, select the group you want to reorder.
4 To see the order of objects in the group, click Highlight. Follow the prompts that display
to view the objects one by one.
5 To reverse the order of all objects in the group, click Reverse Order.
6 To change the order of specific objects or a range of objects:
In Remove from Position, enter the current position of the object.
In Place to Position, enter the new position of the object.
In Number of Objects, enter the number of objects or range of objects to reorder. For
example, if you are changing the order of only one object, enter 1.
Click Reorder.
NOTE The objects in a group are numbered 0, 1, 2, 3, and so on.
7 Click OK, and then click OK again.
8.2. Modify Objects
8.2.1. Remove Objects

MODIFY OBJECTS
153
Removes objects using one of the following methods:
Delete objects with ERASE command.
Cut the selected objects to the clipboard.
Press DELETE to remove the selected objects.
You can use ERASE command to delete objects, whatever the methods you use to select
objects.
To restore the deleted objects, use UNDO command.
OOPS command can restore objects deleted with the ERASE, BLOCK or WBLOCK
command.
To delete mark of plus sign (point mark), perform REDRAW command to refresh screen.
To delete unused named objects, such as block definition, dimension style, layer, linetype
and text style, perform PURGE command.
8.2.2. Copy Objects
You can copy one or more entities, making one copy or multiple copies within the current
drawing. You can also copy entities between drawings.
You can duplicate objects within the current drawing. The default method is to create a
selection set and then specify a base point, and a displacement point, for the copy.
While specifying two point, you can enter two coordinates to copy objects with the relative
distance. The location of copies is determined by the relative coordinate. You do not have
to enter coordinate with the @ as the relative coordinate is assumed.
To copy objects at the specified distance, you can specify the distance directly when the
ORTHO or POLAR is on.
Create only one copy of object one time
1 Choose Modify > Copy.
2 Select the objects, and then press Enter.
3 On the command line, type MODE.
4 On the command line, type Single.
5 Specify the base point.
6 Specify the displacement point.
Modify toolbar
Command line COPY
Object to copy (A), base point (B), and Result.
displacement point (C).
You can copy objects more than one time, until you press ENTER to exit COPY operation.
Create multiple copies for selected object one time
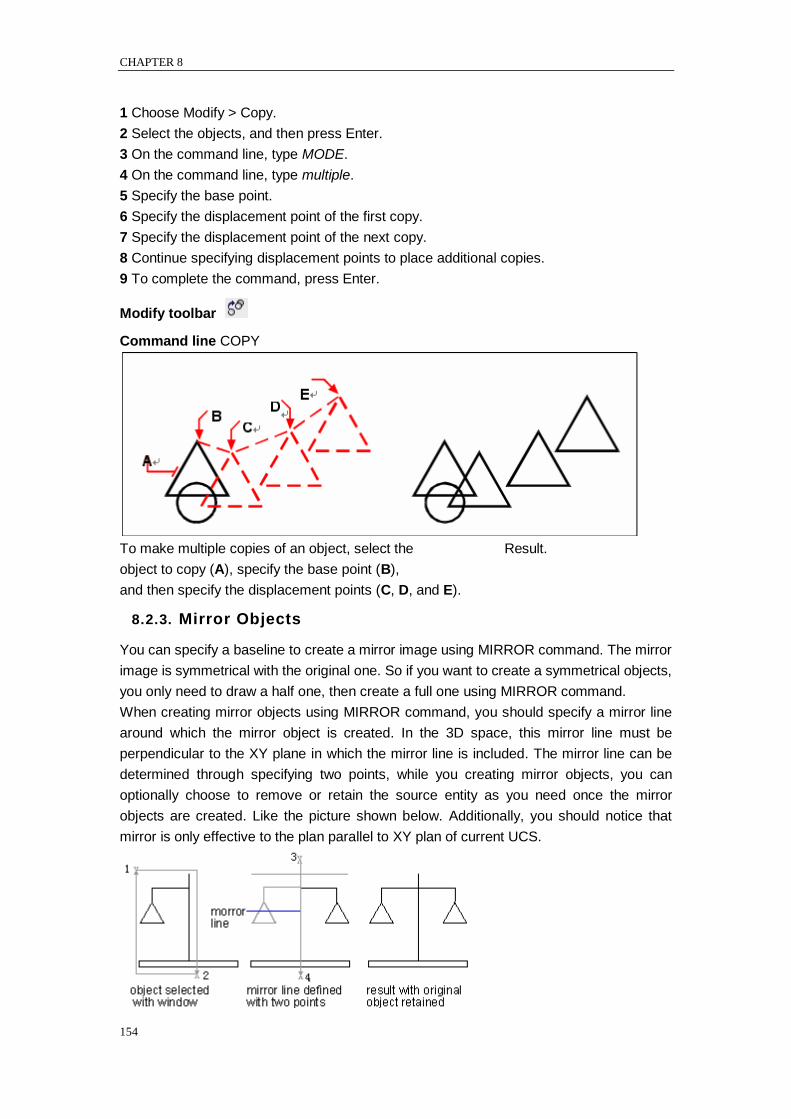
CHAPTER 8
154
1 Choose Modify > Copy.
2 Select the objects, and then press Enter.
3 On the command line, type MODE.
4 On the command line, type multiple.
5 Specify the base point.
6 Specify the displacement point of the first copy.
7 Specify the displacement point of the next copy.
8 Continue specifying displacement points to place additional copies.
9 To complete the command, press Enter.
Modify toolbar
Command line COPY
To make multiple copies of an object, select the Result.
object to copy (A), specify the base point (B),
and then specify the displacement points (C, D, and E).
8.2.3. Mirror Objects
You can specify a baseline to create a mirror image using MIRROR command. The mirror
image is symmetrical with the original one. So if you want to create a symmetrical objects,
you only need to draw a half one, then create a full one using MIRROR command.
When creating mirror objects using MIRROR command, you should specify a mirror line
around which the mirror object is created. In the 3D space, this mirror line must be
perpendicular to the XY plane in which the mirror line is included. The mirror line can be
determined through specifying two points, while you creating mirror objects, you can
optionally choose to remove or retain the source entity as you need once the mirror
objects are created. Like the picture shown below. Additionally, you should notice that
mirror is only effective to the plan parallel to XY plan of current UCS.

MODIFY OBJECTS
155
System variable MIRRTEXT affects texts created with MIRROR command. When
MIRRTEXT is on, the copy of text object is displayed in mirroring way as other objects do.
When MIRRTEXT is off, the direction of text objects remains unchanged. Displaying as
follows:
By default, the MIRRTEXT is on. It affects text objects created with TEXT, ATTDER,
METEXT command as well as attribute definition and variable attribute. Text as well as
constant attributes that are included in an insert block are mirrored together with the block
while mirroring.
To mirror objects
1 Choose Modify > Mirror.
2 Select the object, and then press Enter.
3 Specify the first point of the mirror line.
4 Specify the second point of the mirror line.
5 On the command line, if you want to retain the original objects, type N; if you want to
delete the original objects, type Y.
Modify toolbar
Command line MIRROR
To mirror an object, select it (A), and then specify the Result.
first point (B) and second point (C) of the mirror line.
Mirror in 3D
You can create a mirror image of selected objects in three dimensional space. You mirror
the objects about a mirror plane that you define by either specifying three points; selecting
an existing two dimensional planar object; aligning the plane parallel with the xy, yz, or xz
plane of the current UCS; or aligning the plane with the current view. You can delete or
retain the original objects.
To mirror an object about a three dimensional plane
1 Choose Modify > 3D Operation > Mirror 3D.
2 Select the objects, and then press Enter.
3 In the command line prompt, choose 3 Points, or press Enter to select the default.
4 Specify the first point on the mirror plane.
5 Specify the second and third points on the plane.
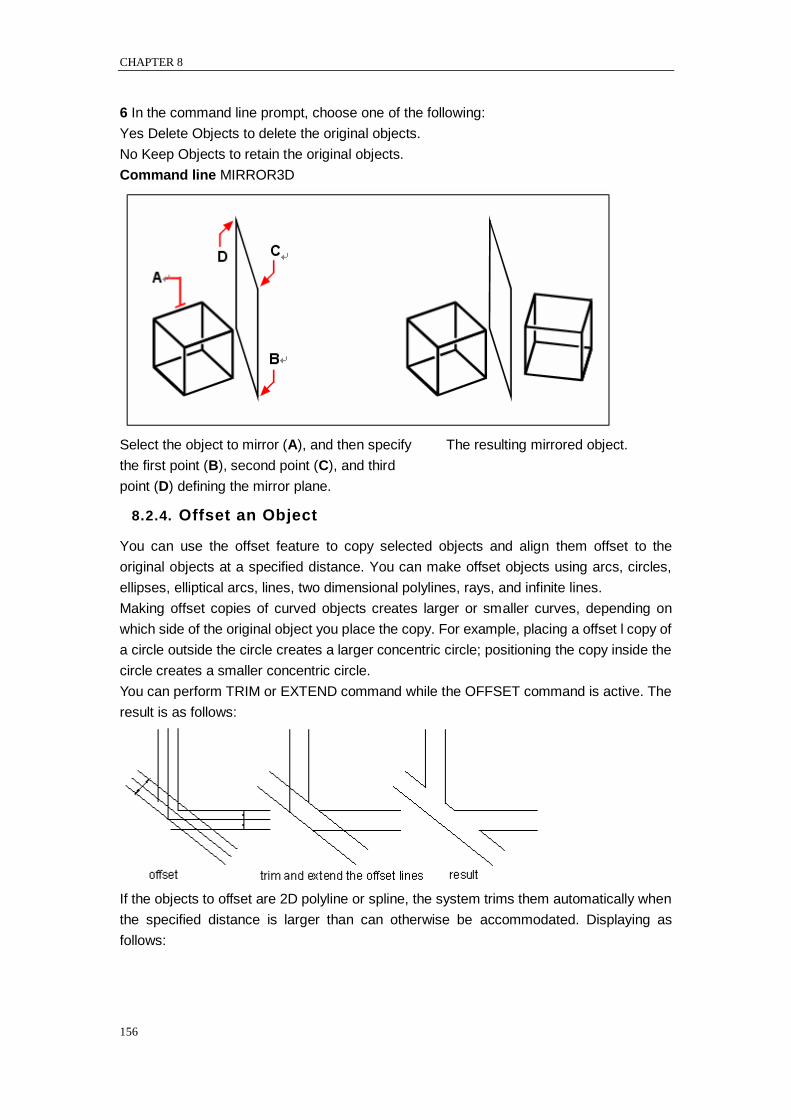
CHAPTER 8
156
6 In the command line prompt, choose one of the following:
Yes Delete Objects to delete the original objects.
No Keep Objects to retain the original objects.
Command line MIRROR3D
Select the object to mirror (A), and then specify The resulting mirrored object.
the first point (B), second point (C), and third
point (D) defining the mirror plane.
8.2.4. Offset an Object
You can use the offset feature to copy selected objects and align them offset to the
original objects at a specified distance. You can make offset objects using arcs, circles,
ellipses, elliptical arcs, lines, two dimensional polylines, rays, and infinite lines.
Making offset copies of curved objects creates larger or smaller curves, depending on
which side of the original object you place the copy. For example, placing a offset l copy of
a circle outside the circle creates a larger concentric circle; positioning the copy inside the
circle creates a smaller concentric circle.
You can perform TRIM or EXTEND command while the OFFSET command is active. The
result is as follows:
If the objects to offset are 2D polyline or spline, the system trims them automatically when
the specified distance is larger than can otherwise be accommodated. Displaying as
follows:
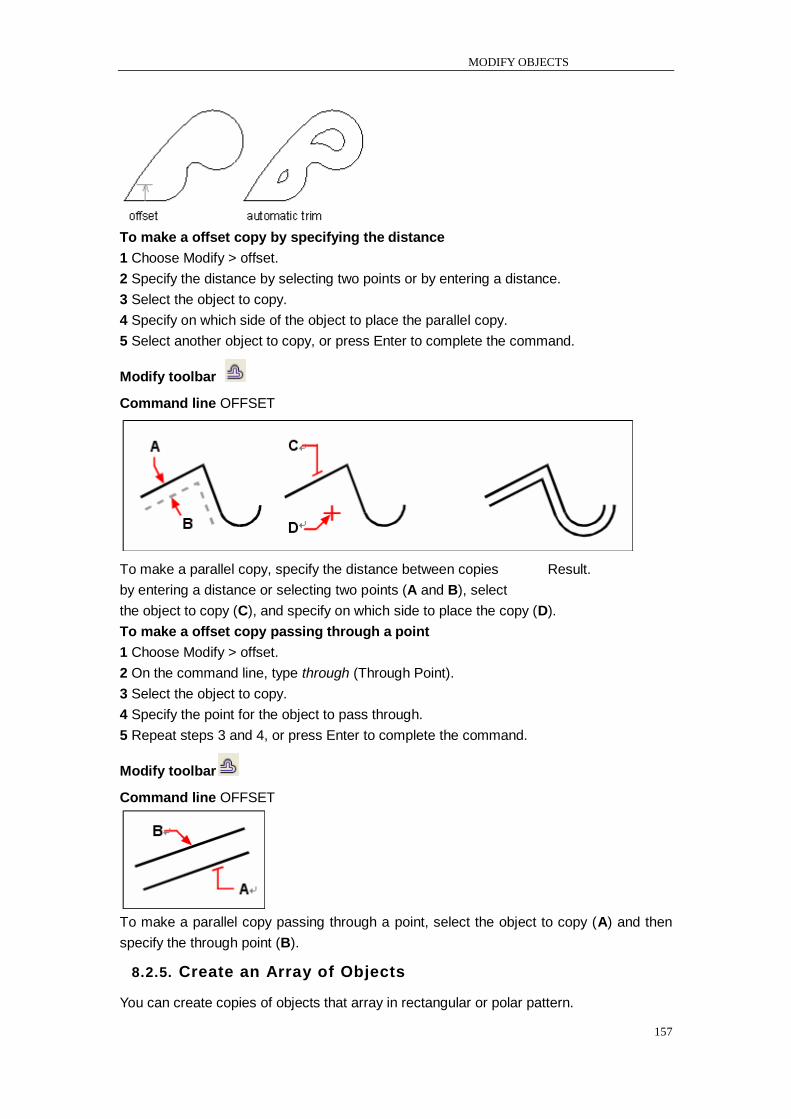
MODIFY OBJECTS
157
To make a offset copy by specifying the distance
1 Choose Modify > offset.
2 Specify the distance by selecting two points or by entering a distance.
3 Select the object to copy.
4 Specify on which side of the object to place the parallel copy.
5 Select another object to copy, or press Enter to complete the command.
Modify toolbar
Command line OFFSET
To make a parallel copy, specify the distance between copies Result.
by entering a distance or selecting two points (A and B), select
the object to copy (C), and specify on which side to place the copy (D).
To make a offset copy passing through a point
1 Choose Modify > offset.
2 On the command line, type through (Through Point).
3 Select the object to copy.
4 Specify the point for the object to pass through.
5 Repeat steps 3 and 4, or press Enter to complete the command.
Modify toolbar
Command line OFFSET
To make a parallel copy passing through a point, select the object to copy (A) and then
specify the through point (B).
8.2.5. Create an Array of Objects
You can create copies of objects that array in rectangular or polar pattern.
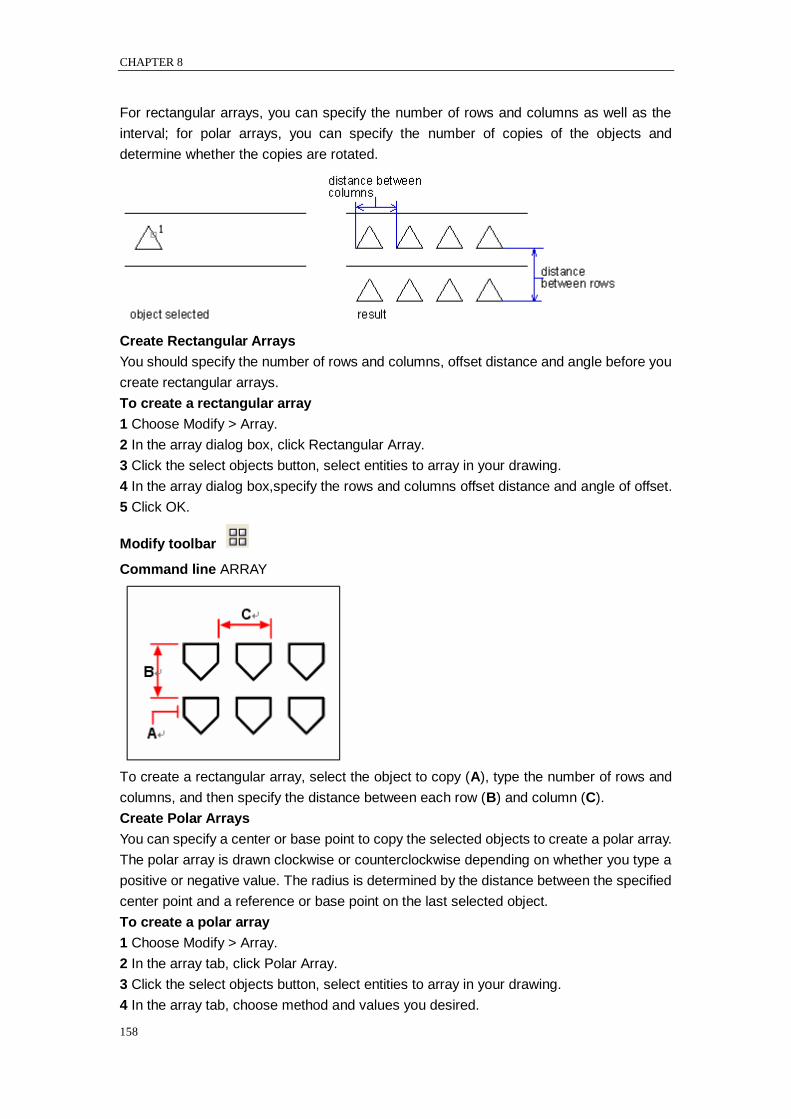
CHAPTER 8
158
For rectangular arrays, you can specify the number of rows and columns as well as the
interval; for polar arrays, you can specify the number of copies of the objects and
determine whether the copies are rotated.
Create Rectangular Arrays
You should specify the number of rows and columns, offset distance and angle before you
create rectangular arrays.
To create a rectangular array
1 Choose Modify > Array.
2 In the array dialog box, click Rectangular Array.
3 Click the select objects button, select entities to array in your drawing.
4 In the array dialog box,specify the rows and columns offset distance and angle of offset.
5 Click OK.
Modify toolbar
Command line ARRAY
To create a rectangular array, select the object to copy (A), type the number of rows and
columns, and then specify the distance between each row (B) and column (C).
Create Polar Arrays
You can specify a center or base point to copy the selected objects to create a polar array.
The polar array is drawn clockwise or counterclockwise depending on whether you type a
positive or negative value. The radius is determined by the distance between the specified
center point and a reference or base point on the last selected object.
To create a polar array
1 Choose Modify > Array.
2 In the array tab, click Polar Array.
3 Click the select objects button, select entities to array in your drawing.
4 In the array tab, choose method and values you desired.

MODIFY OBJECTS
159
5 Click OK.
Modify toolbar
Command line ARRAY
To create a polar array, select the object to copy (A), specify the center point of the array
(B), and then specify the number of items to array, the angle the array is to fill, and
whether to rotate the items.
Array in 3D
3DARRY command is designed to create 3D arrays in the 3D space. The arrays include
both rectangular and polar array. Besides specifying the number of rows (X direction) and
columns (Y direction), you have to give the number of layer (Z direction).
To create a three dimensional rectangular array
1 Choose Modify > 3D Operation > 3D Array.
2 Select the objects, and then press Enter.
3 In the command line prompt , choose Rectangular.
4 Type the number of rows in the array.
5 Type the number of columns.
6 Type the number of levels.
7 Specify the vertical distance between the rows.
8 Specify the horizontal distance between the columns.
9 Specify the depth between the levels.
Command line 3DARRAY
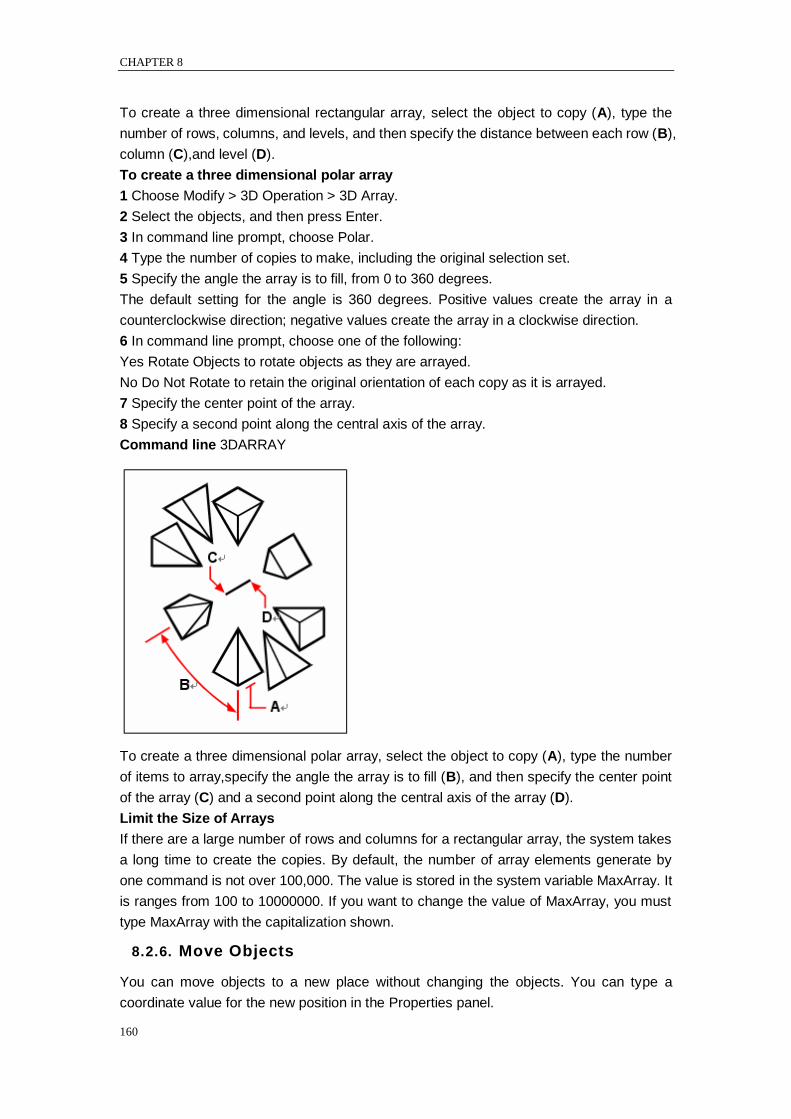
CHAPTER 8
160
To create a three dimensional rectangular array, select the object to copy (A), type the
number of rows, columns, and levels, and then specify the distance between each row (B),
column (C),and level (D).
To create a three dimensional polar array
1 Choose Modify > 3D Operation > 3D Array.
2 Select the objects, and then press Enter.
3 In command line prompt, choose Polar.
4 Type the number of copies to make, including the original selection set.
5 Specify the angle the array is to fill, from 0 to 360 degrees.
The default setting for the angle is 360 degrees. Positive values create the array in a
counterclockwise direction; negative values create the array in a clockwise direction.
6 In command line prompt, choose one of the following:
Yes Rotate Objects to rotate objects as they are arrayed.
No Do Not Rotate to retain the original orientation of each copy as it is arrayed.
7 Specify the center point of the array.
8 Specify a second point along the central axis of the array.
Command line 3DARRAY
To create a three dimensional polar array, select the object to copy (A), type the number
of items to array,specify the angle the array is to fill (B), and then specify the center point
of the array (C) and a second point along the central axis of the array (D).
Limit the Size of Arrays
If there are a large number of rows and columns for a rectangular array, the system takes
a long time to create the copies. By default, the number of array elements generate by
one command is not over 100,000. The value is stored in the system variable MaxArray. It
is ranges from 100 to 10000000. If you want to change the value of MaxArray, you must
type MaxArray with the capitalization shown.
8.2.6. Move Objects
You can move objects to a new place without changing the objects. You can type a
coordinate value for the new position in the Properties panel.
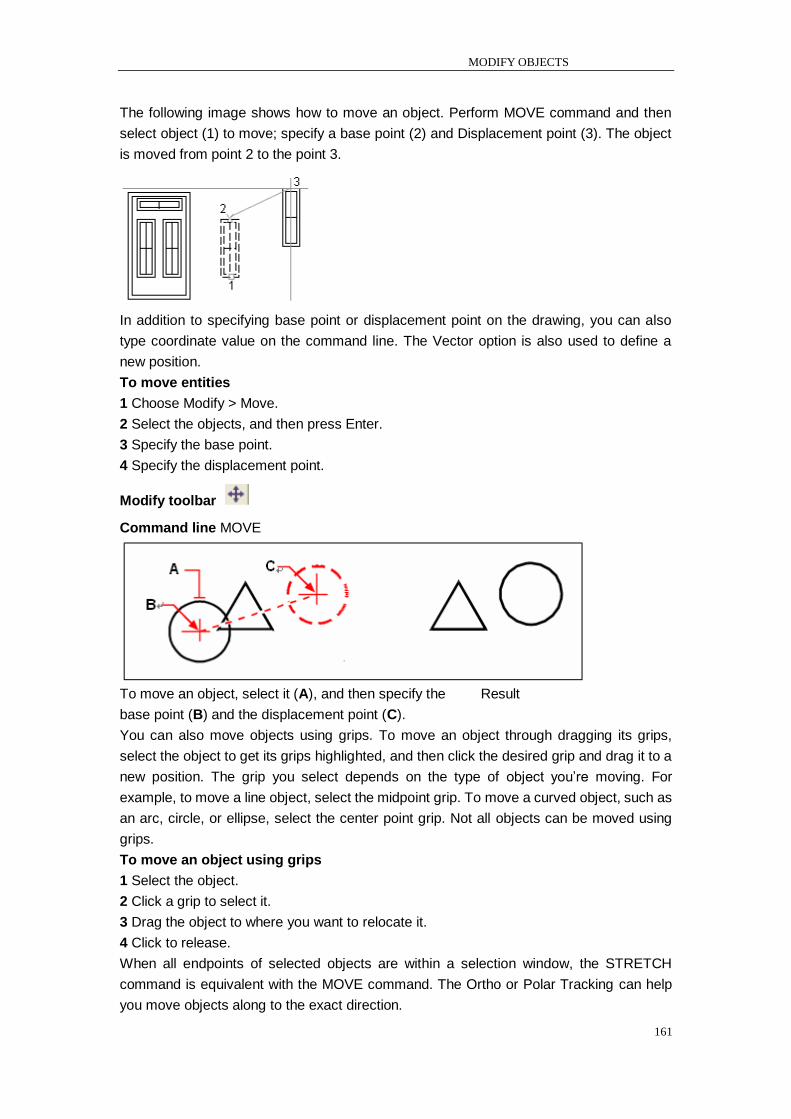
MODIFY OBJECTS
161
The following image shows how to move an object. Perform MOVE command and then
select object (1) to move; specify a base point (2) and Displacement point (3). The object
is moved from point 2 to the point 3.
In addition to specifying base point or displacement point on the drawing, you can also
type coordinate value on the command line. The Vector option is also used to define a
new position.
To move entities
1 Choose Modify > Move.
2 Select the objects, and then press Enter.
3 Specify the base point.
4 Specify the displacement point.
Modify toolbar
Command line MOVE
To move an object, select it (A), and then specify the Result
base point (B) and the displacement point (C).
You can also move objects using grips. To move an object through dragging its grips,
select the object to get its grips highlighted, and then click the desired grip and drag it to a
new position. The grip you select depends on the type of object you‘re moving. For
example, to move a line object, select the midpoint grip. To move a curved object, such as
an arc, circle, or ellipse, select the center point grip. Not all objects can be moved using
grips.
To move an object using grips
1 Select the object.
2 Click a grip to select it.
3 Drag the object to where you want to relocate it.
4 Click to release.
When all endpoints of selected objects are within a selection window, the STRETCH
command is equivalent with the MOVE command. The Ortho or Polar Tracking can help
you move objects along to the exact direction.
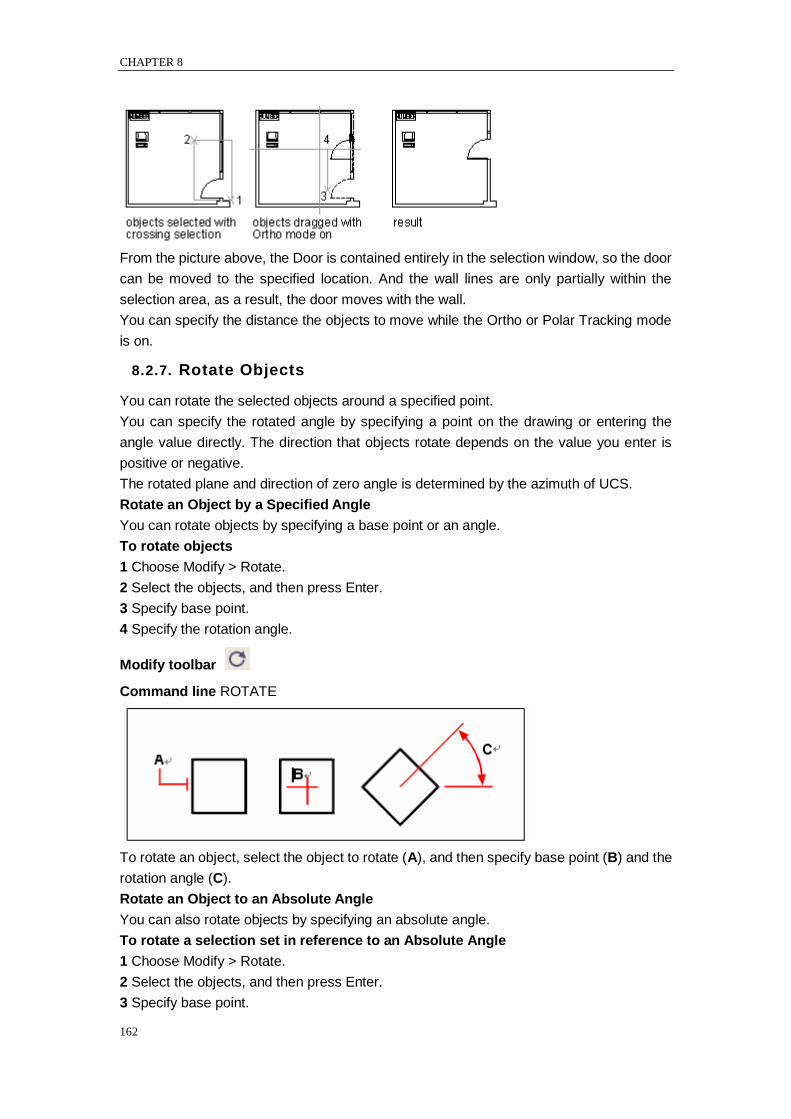
CHAPTER 8
162
From the picture above, the Door is contained entirely in the selection window, so the door
can be moved to the specified location. And the wall lines are only partially within the
selection area, as a result, the door moves with the wall.
You can specify the distance the objects to move while the Ortho or Polar Tracking mode
is on.
8.2.7. Rotate Objects
You can rotate the selected objects around a specified point.
You can specify the rotated angle by specifying a point on the drawing or entering the
angle value directly. The direction that objects rotate depends on the value you enter is
positive or negative.
The rotated plane and direction of zero angle is determined by the azimuth of UCS.
Rotate an Object by a Specified Angle
You can rotate objects by specifying a base point or an angle.
To rotate objects
1 Choose Modify > Rotate.
2 Select the objects, and then press Enter.
3 Specify base point.
4 Specify the rotation angle.
Modify toolbar
Command line ROTATE
To rotate an object, select the object to rotate (A), and then specify base point (B) and the
rotation angle (C).
Rotate an Object to an Absolute Angle
You can also rotate objects by specifying an absolute angle.
To rotate a selection set in reference to an Absolute Angle
1 Choose Modify > Rotate.
2 Select the objects, and then press Enter.
3 Specify base point.
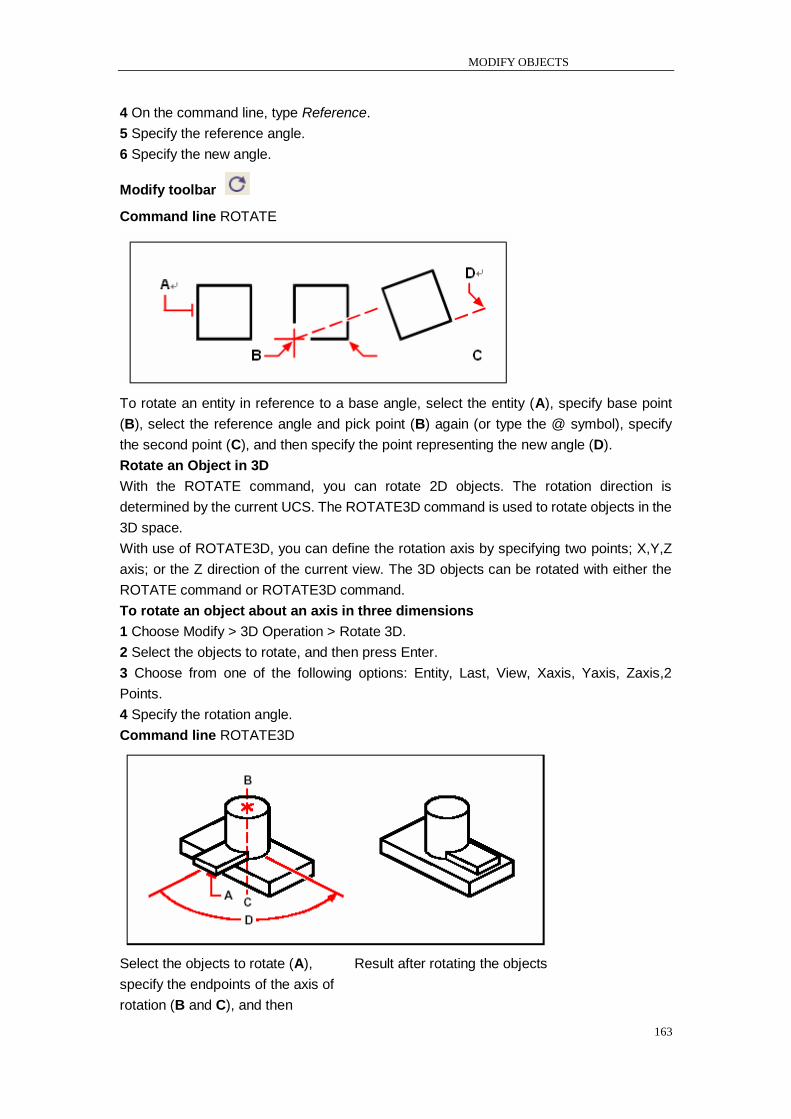
MODIFY OBJECTS
163
4 On the command line, type Reference.
5 Specify the reference angle.
6 Specify the new angle.
Modify toolbar
Command line ROTATE
To rotate an entity in reference to a base angle, select the entity (A), specify base point
(B), select the reference angle and pick point (B) again (or type the @ symbol), specify
the second point (C), and then specify the point representing the new angle (D).
Rotate an Object in 3D
With the ROTATE command, you can rotate 2D objects. The rotation direction is
determined by the current UCS. The ROTATE3D command is used to rotate objects in the
3D space.
With use of ROTATE3D, you can define the rotation axis by specifying two points; X,Y,Z
axis; or the Z direction of the current view. The 3D objects can be rotated with either the
ROTATE command or ROTATE3D command.
To rotate an object about an axis in three dimensions
1 Choose Modify > 3D Operation > Rotate 3D.
2 Select the objects to rotate, and then press Enter.
3 Choose from one of the following options: Entity, Last, View, Xaxis, Yaxis, Zaxis,2
Points.
4 Specify the rotation angle.
Command line ROTATE3D
Select the objects to rotate (A), Result after rotating the objects
specify the endpoints of the axis of
rotation (B and C), and then
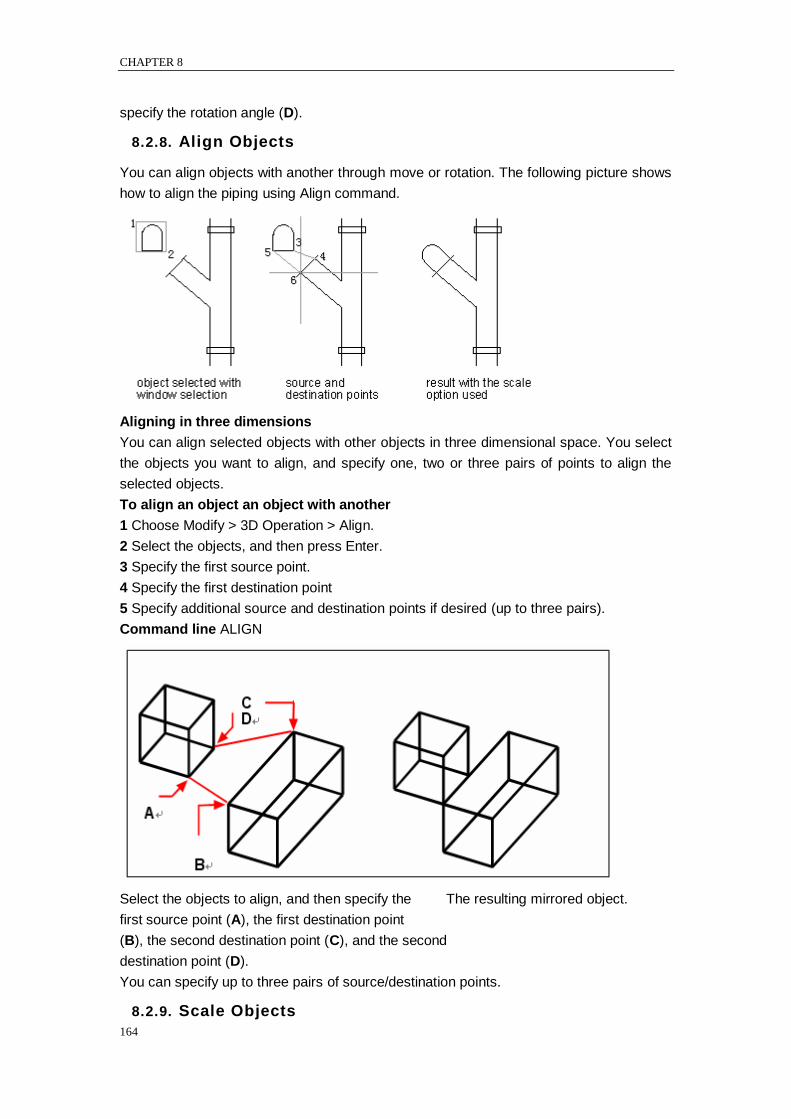
CHAPTER 8
164
specify the rotation angle (D).
8.2.8. Align Objects
You can align objects with another through move or rotation. The following picture shows
how to align the piping using Align command.
Aligning in three dimensions
You can align selected objects with other objects in three dimensional space. You select
the objects you want to align, and specify one, two or three pairs of points to align the
selected objects.
To align an object an object with another
1 Choose Modify > 3D Operation > Align.
2 Select the objects, and then press Enter.
3 Specify the first source point.
4 Specify the first destination point
5 Specify additional source and destination points if desired (up to three pairs).
Command line ALIGN
Select the objects to align, and then specify the The resulting mirrored object.
first source point (A), the first destination point
(B), the second destination point (C), and the second
destination point (D).
You can specify up to three pairs of source/destination points.
8.2.9. Scale Objects
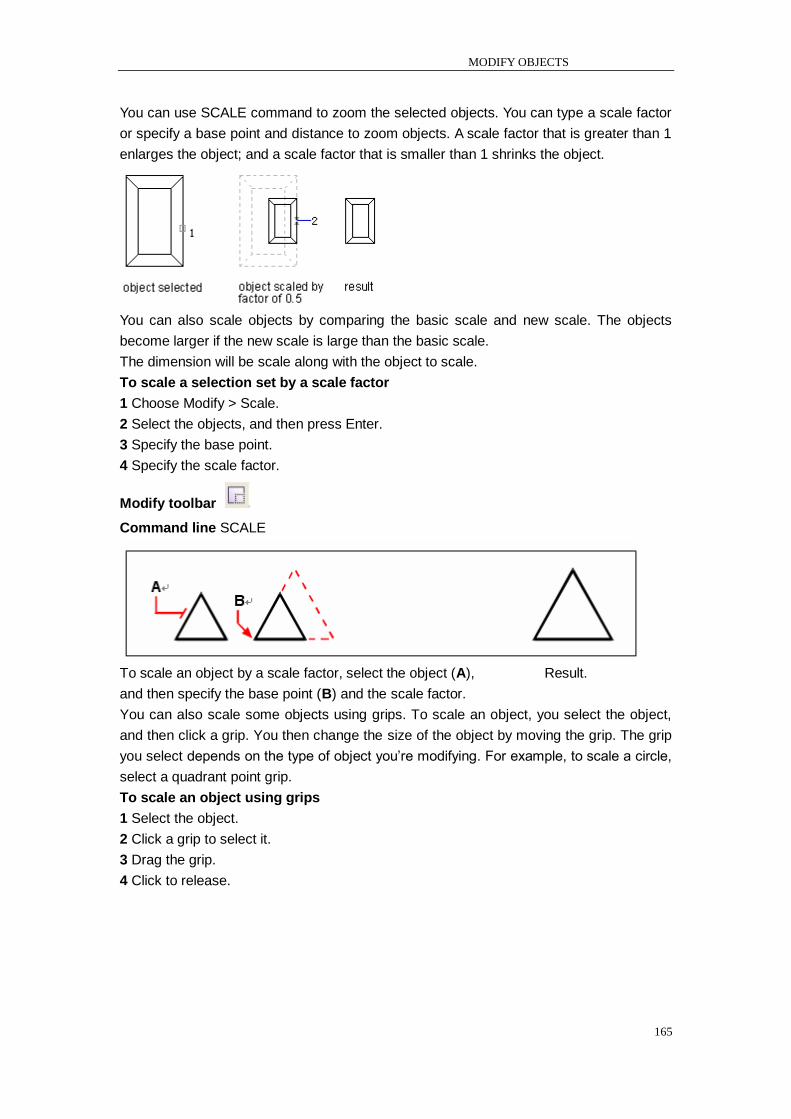
MODIFY OBJECTS
165
You can use SCALE command to zoom the selected objects. You can type a scale factor
or specify a base point and distance to zoom objects. A scale factor that is greater than 1
enlarges the object; and a scale factor that is smaller than 1 shrinks the object.
You can also scale objects by comparing the basic scale and new scale. The objects
become larger if the new scale is large than the basic scale.
The dimension will be scale along with the object to scale.
To scale a selection set by a scale factor
1 Choose Modify > Scale.
2 Select the objects, and then press Enter.
3 Specify the base point.
4 Specify the scale factor.
Modify toolbar
Command line SCALE
To scale an object by a scale factor, select the object (A), Result.
and then specify the base point (B) and the scale factor.
You can also scale some objects using grips. To scale an object, you select the object,
and then click a grip. You then change the size of the object by moving the grip. The grip
you select depends on the type of object you‘re modifying. For example, to scale a circle,
select a quadrant point grip.
To scale an object using grips
1 Select the object.
2 Click a grip to select it.
3 Drag the grip.
4 Click to release.
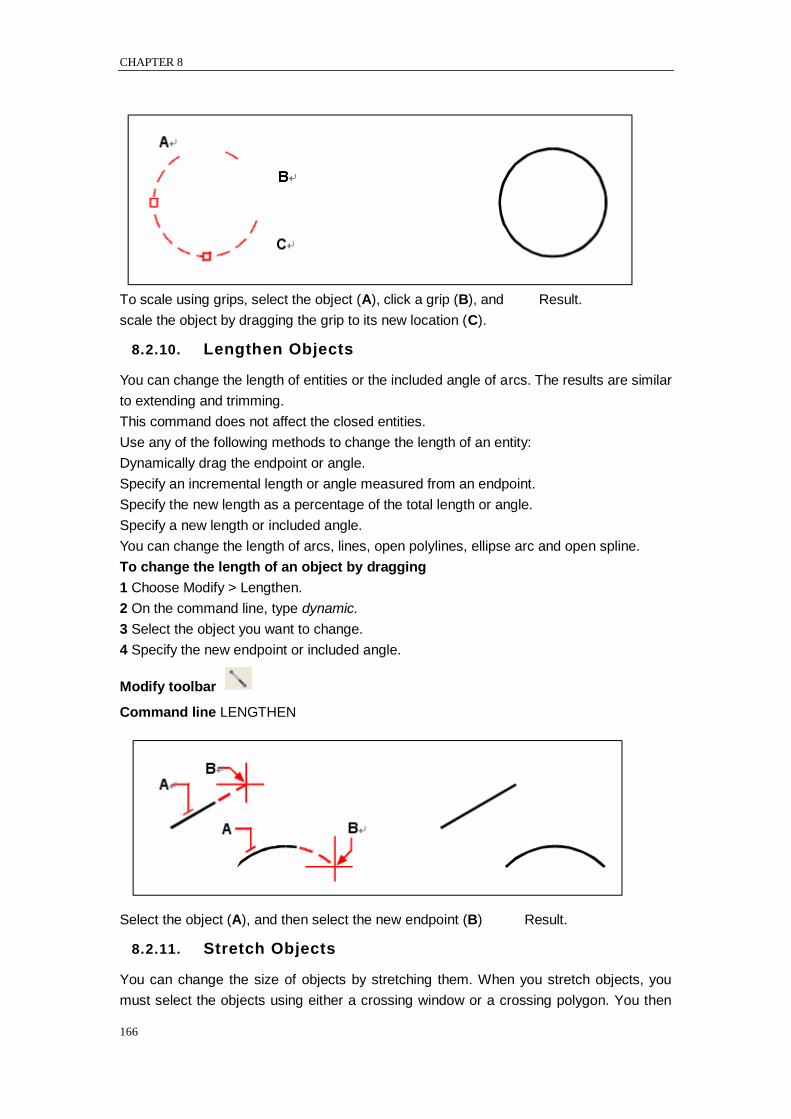
CHAPTER 8
166
To scale using grips, select the object (A), click a grip (B), and Result.
scale the object by dragging the grip to its new location (C).
8.2.10. Lengthen Objects
You can change the length of entities or the included angle of arcs. The results are similar
to extending and trimming.
This command does not affect the closed entities.
Use any of the following methods to change the length of an entity:
Dynamically drag the endpoint or angle.
Specify an incremental length or angle measured from an endpoint.
Specify the new length as a percentage of the total length or angle.
Specify a new length or included angle.
You can change the length of arcs, lines, open polylines, ellipse arc and open spline.
To change the length of an object by dragging
1 Choose Modify > Lengthen.
2 On the command line, type dynamic.
3 Select the object you want to change.
4 Specify the new endpoint or included angle.
Modify toolbar
Command line LENGTHEN
Select the object (A), and then select the new endpoint (B) Result.
8.2.11. Stretch Objects
You can change the size of objects by stretching them. When you stretch objects, you
must select the objects using either a crossing window or a crossing polygon. You then
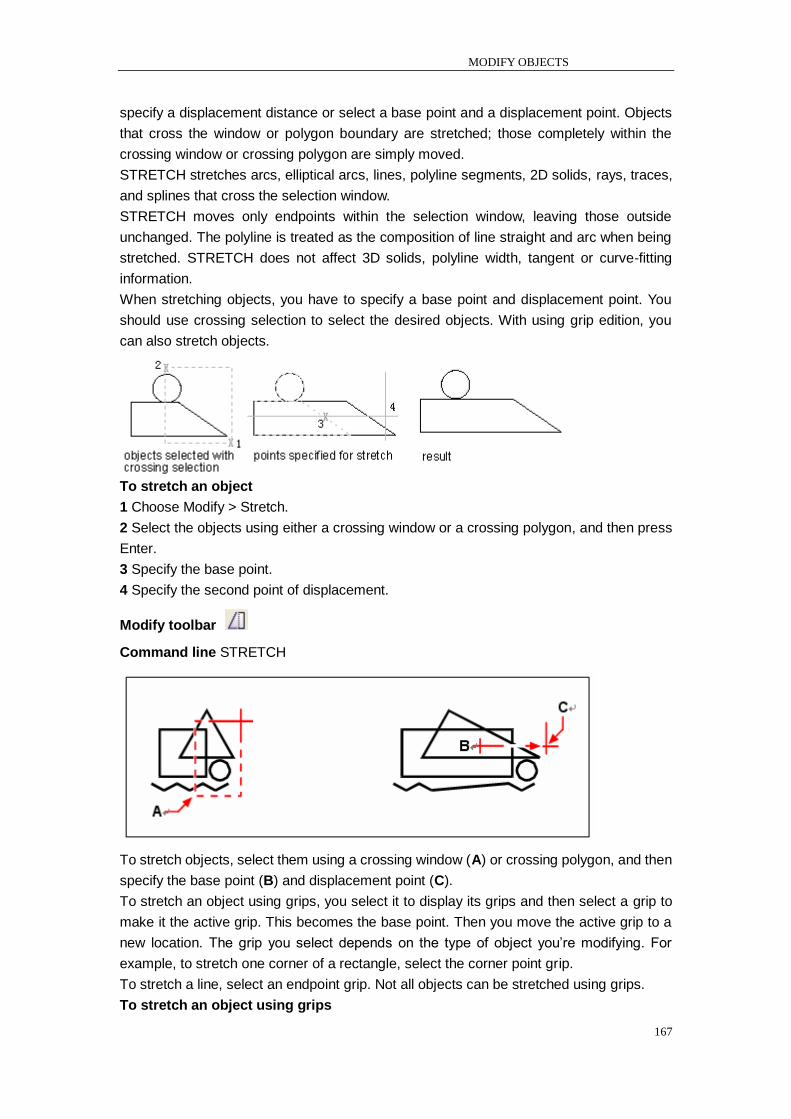
MODIFY OBJECTS
167
specify a displacement distance or select a base point and a displacement point. Objects
that cross the window or polygon boundary are stretched; those completely within the
crossing window or crossing polygon are simply moved.
STRETCH stretches arcs, elliptical arcs, lines, polyline segments, 2D solids, rays, traces,
and splines that cross the selection window.
STRETCH moves only endpoints within the selection window, leaving those outside
unchanged. The polyline is treated as the composition of line straight and arc when being
stretched. STRETCH does not affect 3D solids, polyline width, tangent or curve-fitting
information.
When stretching objects, you have to specify a base point and displacement point. You
should use crossing selection to select the desired objects. With using grip edition, you
can also stretch objects.
To stretch an object
1 Choose Modify > Stretch.
2 Select the objects using either a crossing window or a crossing polygon, and then press
Enter.
3 Specify the base point.
4 Specify the second point of displacement.
Modify toolbar
Command line STRETCH
To stretch objects, select them using a crossing window (A) or crossing polygon, and then
specify the base point (B) and displacement point (C).
To stretch an object using grips, you select it to display its grips and then select a grip to
make it the active grip. This becomes the base point. Then you move the active grip to a
new location. The grip you select depends on the type of object you‘re modifying. For
example, to stretch one corner of a rectangle, select the corner point grip.
To stretch a line, select an endpoint grip. Not all objects can be stretched using grips.
To stretch an object using grips
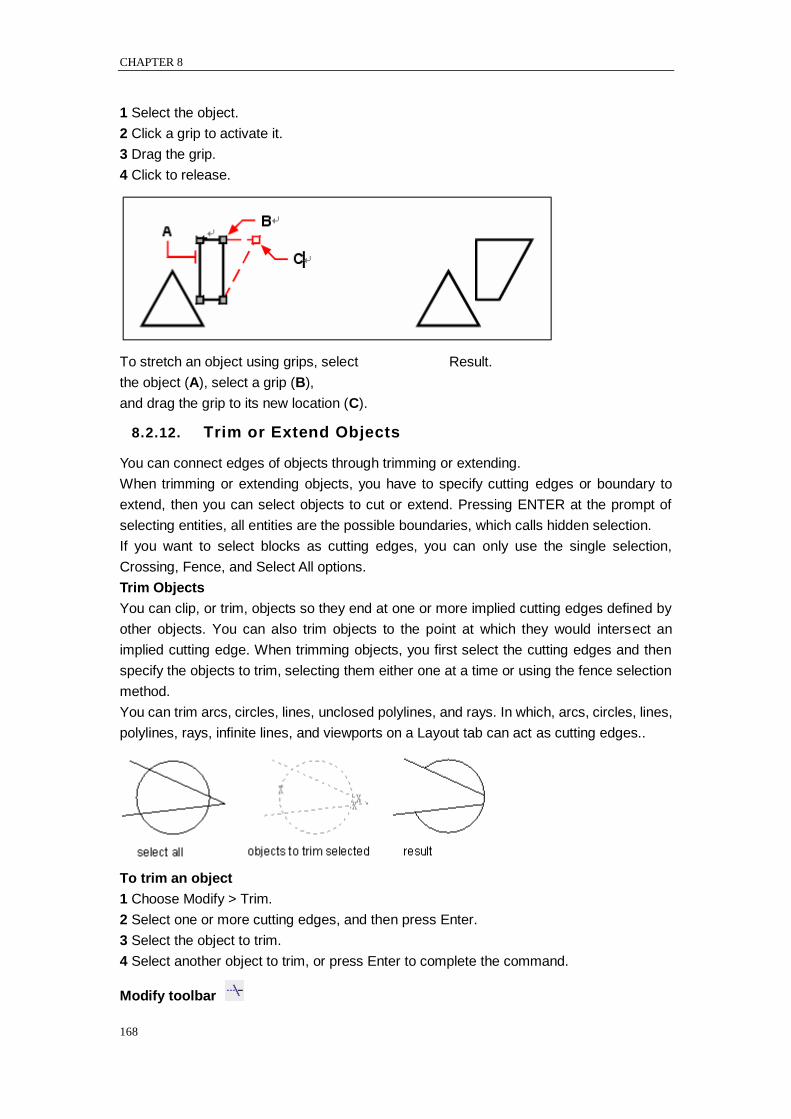
CHAPTER 8
168
1 Select the object.
2 Click a grip to activate it.
3 Drag the grip.
4 Click to release.
To stretch an object using grips, select Result.
the object (A), select a grip (B),
and drag the grip to its new location (C).
8.2.12. Trim or Extend Objects
You can connect edges of objects through trimming or extending.
When trimming or extending objects, you have to specify cutting edges or boundary to
extend, then you can select objects to cut or extend. Pressing ENTER at the prompt of
selecting entities, all entities are the possible boundaries, which calls hidden selection.
If you want to select blocks as cutting edges, you can only use the single selection,
Crossing, Fence, and Select All options.
Trim Objects
You can clip, or trim, objects so they end at one or more implied cutting edges defined by
other objects. You can also trim objects to the point at which they would intersect an
implied cutting edge. When trimming objects, you first select the cutting edges and then
specify the objects to trim, selecting them either one at a time or using the fence selection
method.
You can trim arcs, circles, lines, unclosed polylines, and rays. In which, arcs, circles, lines,
polylines, rays, infinite lines, and viewports on a Layout tab can act as cutting edges..
To trim an object
1 Choose Modify > Trim.
2 Select one or more cutting edges, and then press Enter.
3 Select the object to trim.
4 Select another object to trim, or press Enter to complete the command.
Modify toolbar
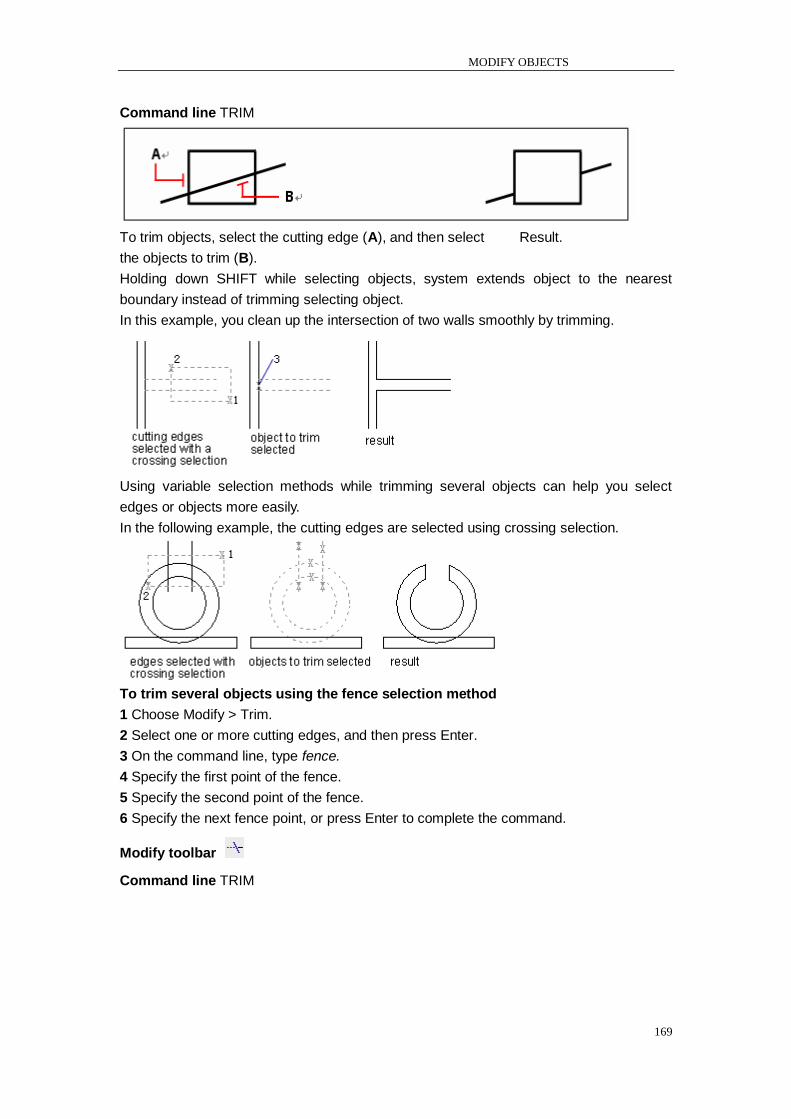
MODIFY OBJECTS
169
Command line TRIM
To trim objects, select the cutting edge (A), and then select Result.
the objects to trim (B).
Holding down SHIFT while selecting objects, system extends object to the nearest
boundary instead of trimming selecting object.
In this example, you clean up the intersection of two walls smoothly by trimming.
Using variable selection methods while trimming several objects can help you select
edges or objects more easily.
In the following example, the cutting edges are selected using crossing selection.
To trim several objects using the fence selection method
1 Choose Modify > Trim.
2 Select one or more cutting edges, and then press Enter.
3 On the command line, type fence.
4 Specify the first point of the fence.
5 Specify the second point of the fence.
6 Specify the next fence point, or press Enter to complete the command.
Modify toolbar
Command line TRIM
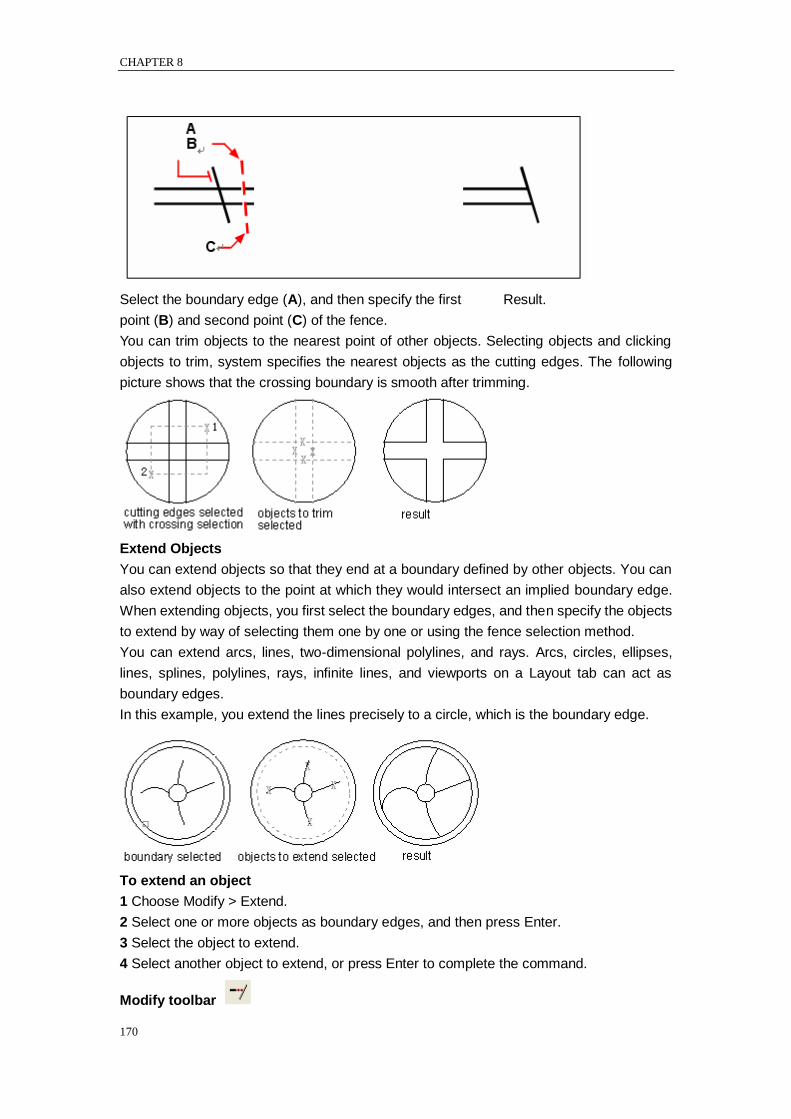
CHAPTER 8
170
Select the boundary edge (A), and then specify the first Result.
point (B) and second point (C) of the fence.
You can trim objects to the nearest point of other objects. Selecting objects and clicking
objects to trim, system specifies the nearest objects as the cutting edges. The following
picture shows that the crossing boundary is smooth after trimming.
Extend Objects
You can extend objects so that they end at a boundary defined by other objects. You can
also extend objects to the point at which they would intersect an implied boundary edge.
When extending objects, you first select the boundary edges, and then specify the objects
to extend by way of selecting them one by one or using the fence selection method.
You can extend arcs, lines, two-dimensional polylines, and rays. Arcs, circles, ellipses,
lines, splines, polylines, rays, infinite lines, and viewports on a Layout tab can act as
boundary edges.
In this example, you extend the lines precisely to a circle, which is the boundary edge.
To extend an object
1 Choose Modify > Extend.
2 Select one or more objects as boundary edges, and then press Enter.
3 Select the object to extend.
4 Select another object to extend, or press Enter to complete the command.
Modify toolbar
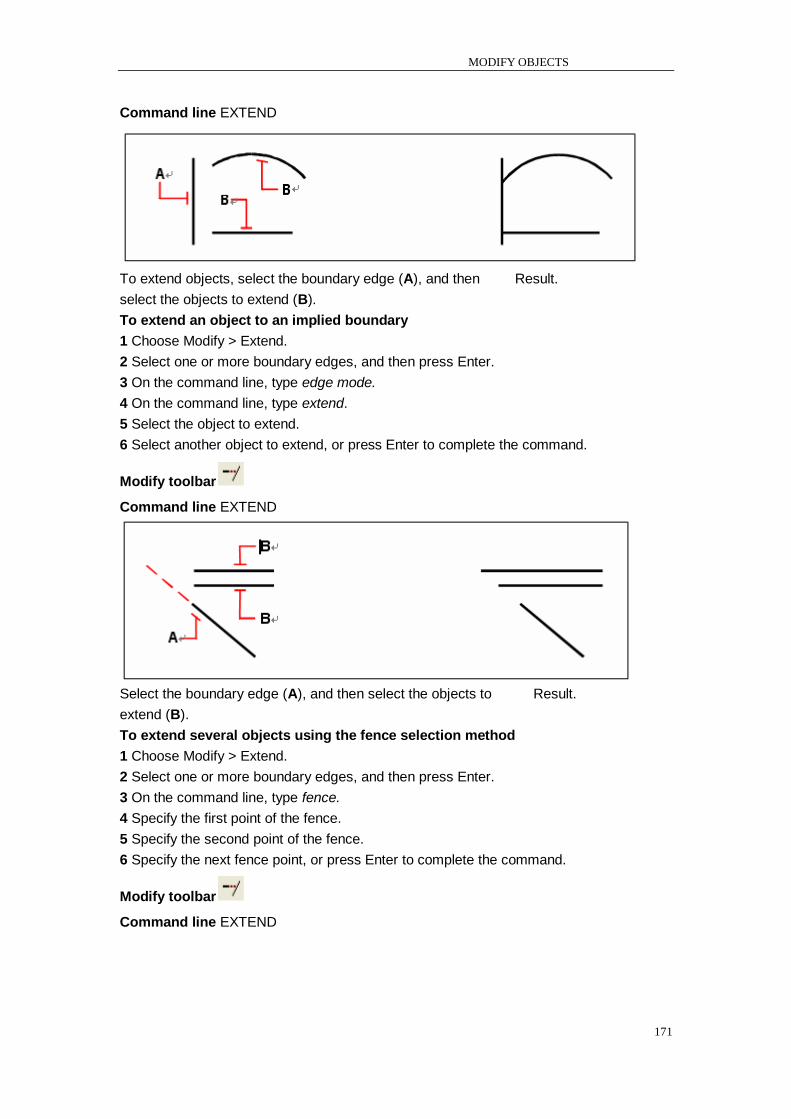
MODIFY OBJECTS
171
Command line EXTEND
To extend objects, select the boundary edge (A), and then Result.
select the objects to extend (B).
To extend an object to an implied boundary
1 Choose Modify > Extend.
2 Select one or more boundary edges, and then press Enter.
3 On the command line, type edge mode.
4 On the command line, type extend.
5 Select the object to extend.
6 Select another object to extend, or press Enter to complete the command.
Modify toolbar
Command line EXTEND
Select the boundary edge (A), and then select the objects to Result.
extend (B).
To extend several objects using the fence selection method
1 Choose Modify > Extend.
2 Select one or more boundary edges, and then press Enter.
3 On the command line, type fence.
4 Specify the first point of the fence.
5 Specify the second point of the fence.
6 Specify the next fence point, or press Enter to complete the command.
Modify toolbar
Command line EXTEND
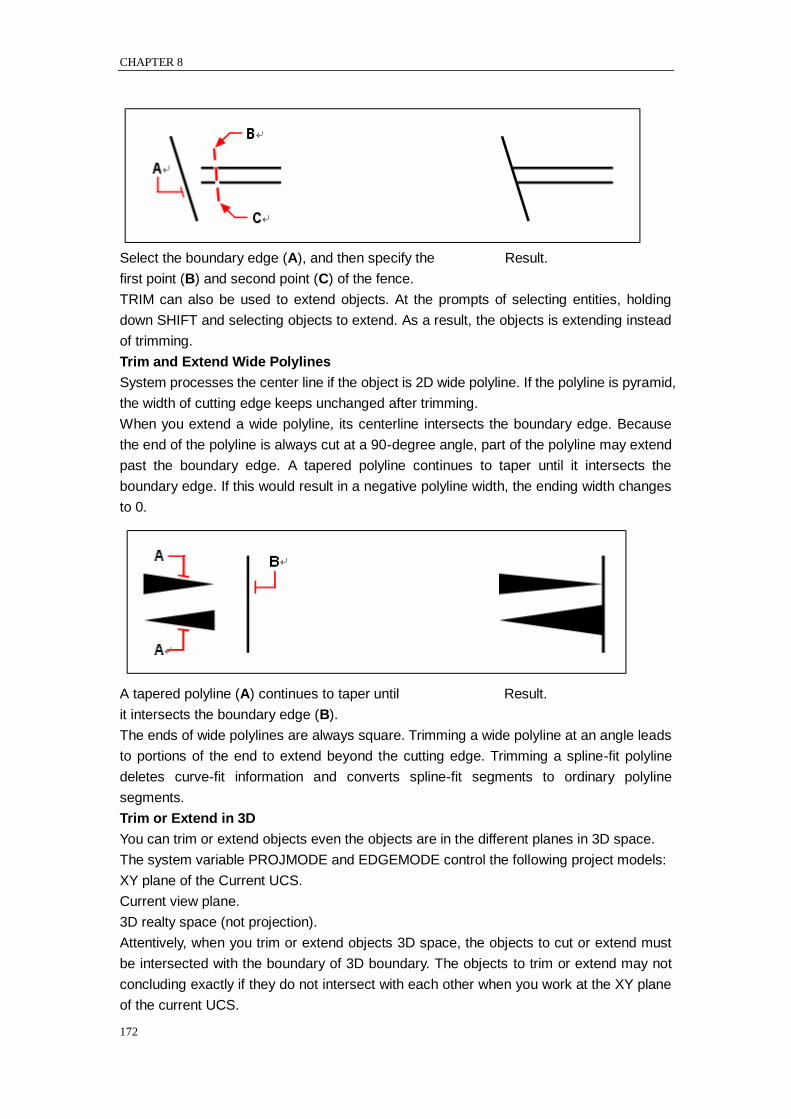
CHAPTER 8
172
Select the boundary edge (A), and then specify the Result.
first point (B) and second point (C) of the fence.
TRIM can also be used to extend objects. At the prompts of selecting entities, holding
down SHIFT and selecting objects to extend. As a result, the objects is extending instead
of trimming.
Trim and Extend Wide Polylines
System processes the center line if the object is 2D wide polyline. If the polyline is pyramid,
the width of cutting edge keeps unchanged after trimming.
When you extend a wide polyline, its centerline intersects the boundary edge. Because
the end of the polyline is always cut at a 90-degree angle, part of the polyline may extend
past the boundary edge. A tapered polyline continues to taper until it intersects the
boundary edge. If this would result in a negative polyline width, the ending width changes
to 0.
A tapered polyline (A) continues to taper until Result.
it intersects the boundary edge (B).
The ends of wide polylines are always square. Trimming a wide polyline at an angle leads
to portions of the end to extend beyond the cutting edge. Trimming a spline-fit polyline
deletes curve-fit information and converts spline-fit segments to ordinary polyline
segments.
Trim or Extend in 3D
You can trim or extend objects even the objects are in the different planes in 3D space.
The system variable PROJMODE and EDGEMODE control the following project models:
XY plane of the Current UCS.
Current view plane.
3D realty space (not projection).
Attentively, when you trim or extend objects 3D space, the objects to cut or extend must
be intersected with the boundary of 3D boundary. The objects to trim or extend may not
concluding exactly if they do not intersect with each other when you work at the XY plane
of the current UCS.

MODIFY OBJECTS
173
8.2.13. Wrap Processing
Selecting objects by means of a rectangular frame, to trim or extend the objects inside the
rectangular frame, this procedure is also called wrap processing.
Unlike performing TRIM and EXTEND commands, you don't have to indicate whether to
extend or stretch while executing WRAP command, system responds to it automatically
and do the corresponding operation.
Objects that are enabled to be processed by WRAP command are: lines, 2D or 3D
polylines, construction lines, rays, arcs, circles, ellipse, spline polyline, wide polyline as
well as splines .etc. But only under such circumstances that curve objects intersect with
each other can wrap operates, except for the self-intersection of complex entities.
Nearly all of the entities are enabled wrapping as boundary objects, including blocks and
xrefs.
Once you have selected objects using a rectangular frame, ZWCAD processes the
objects based on their types:
For lines, construction lines, rays, arcs, circles, ellipse, spline polyline, you can both
extend and trim these entities. But no processing operation implemented in case that no
intersection on the selected objects or only one object is selected within the rectangular
frame.
For wide polylines and 2D or 3D polylines, it's also enabled for both trim and extend. But
different for that polylines can even be wrapped if only self-intersected curves are
selected.
For splines, it's only enabled for trim operation, while extend is disabled.
Theory of wrap processing is determined by the following circumstances of selected
object. ( the selection frame contains the whole entity being selected or only part of the
selected entity ) :
Intersection for the entities by frame selection.
If the whole entity is included in the selection frame, the curve being selected by the frame
is a part among the origins of source curve ( the intersection can be either on the curve or
at the extension intersection. ).
If the frame only covers a part of the entity, the residual part exclusive of the part among
intersections is eventually obtained after wrap processing.
Process some specific curves with particular methods, such as circle, ellipse, polyline an
so on. If the entire closed circle or ellipse is selected within the frame, such objects will be
taken as boundaries but not processing objects. Whereas arcs and ellipse arc have two
ends which determine the wrapped curve with the relation between two points and the
frame, if the two ends are not included in the frame, process them as trimming other than
extending, or in case that only one end point is included in the frame, extend the curve to
the far most extension intersection, and then get the curve with the same theory as getting
the first point . If two points are within the frame, the curve will be extended to the nearest
intersection among the two end points, and then get the wrapped curve with the same
theory as treating the first point.
You should pay attention to the following matters when operating wrap processing :
It's both enabled wrap processing no matter in model space or in layout space. As

CHAPTER 8
174
manipulating trim and extend operations in different space while performing TRIM and
EXTEND command.
Wrap processing is incapable of snapping entities even if the ESNAP is on, during the
wrapping procedure, the ESNAP will be off temporarily and turn back to On state as soon
as the wrap processing finished.
Changes for UCS take no effect on wrap processing.
Supports UNDO partially, that is to input u or ctrl + z to cancel the last manipulation but not
exit the command.
8.2.14. Create Breaks
You can break arcs, circles, ellipses, lines, polylines, rays, and infinite lines. When
breaking entities, you must specify two points for the break. By default, the point you use
to select the entity becomes the first break point; however, you can use the First break
point option to select a break point different from the one that selects the entity.
To break an object
1 Choose Modify > Break.
2 Select the object.
3 Specify the second break point.
Modify toolbar
Command line BREAK
Select the object (A), and then specify the Result.
second break point (B).
To select an object and then specify the two break points
1 Choose Modify > Break.
2 Select the object.
3 On the command line, type first break point.
4 Specify the first break point.
5 Specify the second break point.
Modify toolbar
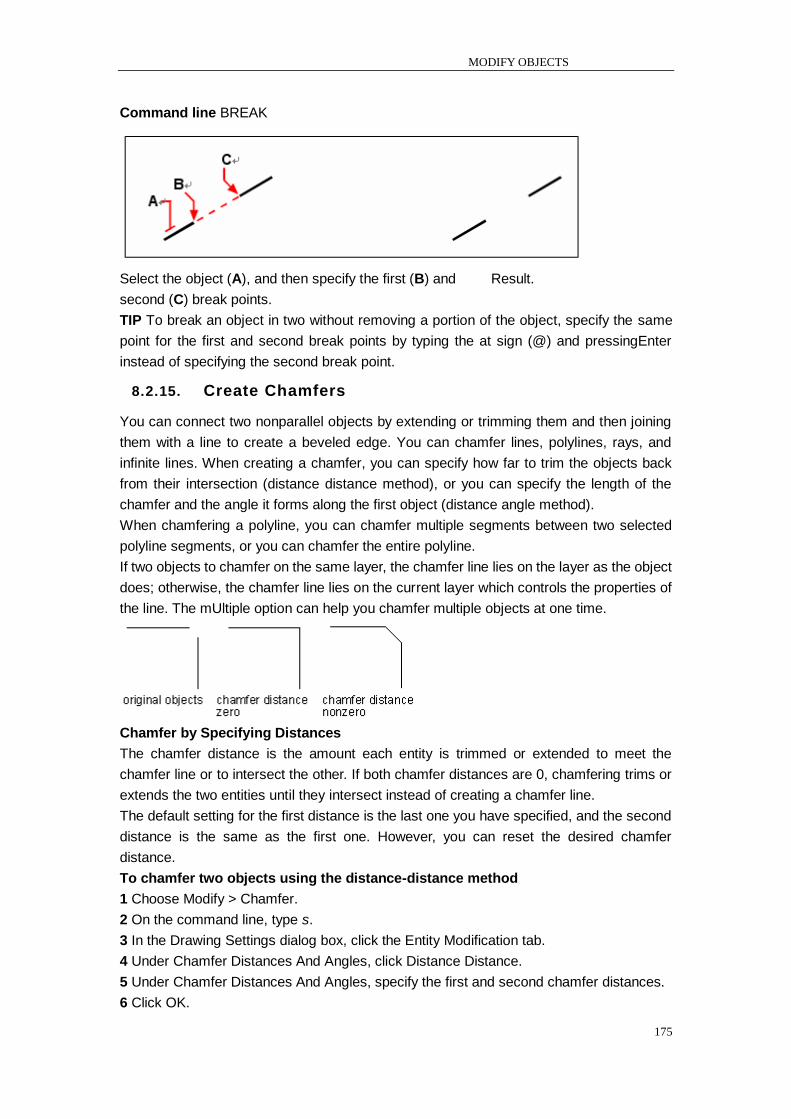
MODIFY OBJECTS
175
Command line BREAK
Select the object (A), and then specify the first (B) and Result.
second (C) break points.
TIP To break an object in two without removing a portion of the object, specify the same
point for the first and second break points by typing the at sign (@) and pressingEnter
instead of specifying the second break point.
8.2.15. Create Chamfers
You can connect two nonparallel objects by extending or trimming them and then joining
them with a line to create a beveled edge. You can chamfer lines, polylines, rays, and
infinite lines. When creating a chamfer, you can specify how far to trim the objects back
from their intersection (distance distance method), or you can specify the length of the
chamfer and the angle it forms along the first object (distance angle method).
When chamfering a polyline, you can chamfer multiple segments between two selected
polyline segments, or you can chamfer the entire polyline.
If two objects to chamfer on the same layer, the chamfer line lies on the layer as the object
does; otherwise, the chamfer line lies on the current layer which controls the properties of
the line. The mUltiple option can help you chamfer multiple objects at one time.
Chamfer by Specifying Distances
The chamfer distance is the amount each entity is trimmed or extended to meet the
chamfer line or to intersect the other. If both chamfer distances are 0, chamfering trims or
extends the two entities until they intersect instead of creating a chamfer line.
The default setting for the first distance is the last one you have specified, and the second
distance is the same as the first one. However, you can reset the desired chamfer
distance.
To chamfer two objects using the distance-distance method
1 Choose Modify > Chamfer.
2 On the command line, type s.
3 In the Drawing Settings dialog box, click the Entity Modification tab.
4 Under Chamfer Distances And Angles, click Distance Distance.
5 Under Chamfer Distances And Angles, specify the first and second chamfer distances.
6 Click OK.
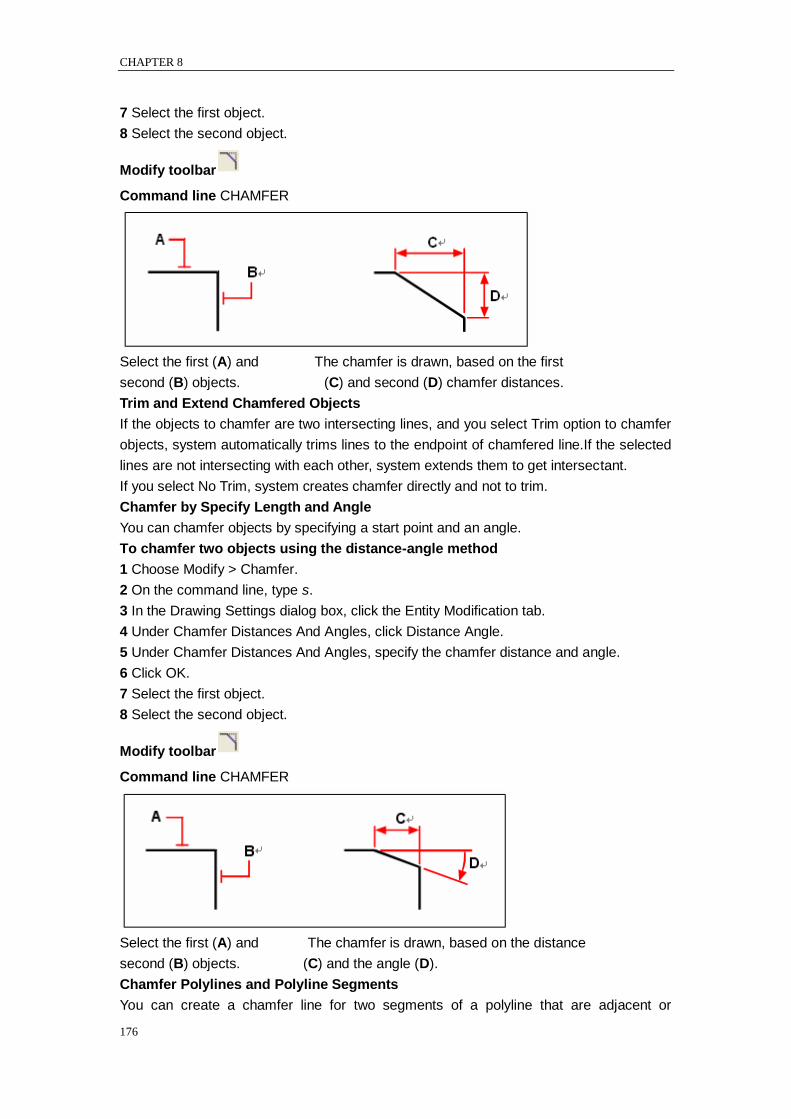
CHAPTER 8
176
7 Select the first object.
8 Select the second object.
Modify toolbar
Command line CHAMFER
Select the first (A) and The chamfer is drawn, based on the first
second (B) objects. (C) and second (D) chamfer distances.
Trim and Extend Chamfered Objects
If the objects to chamfer are two intersecting lines, and you select Trim option to chamfer
objects, system automatically trims lines to the endpoint of chamfered line.If the selected
lines are not intersecting with each other, system extends them to get intersectant.
If you select No Trim, system creates chamfer directly and not to trim.
Chamfer by Specify Length and Angle
You can chamfer objects by specifying a start point and an angle.
To chamfer two objects using the distance-angle method
1 Choose Modify > Chamfer.
2 On the command line, type s.
3 In the Drawing Settings dialog box, click the Entity Modification tab.
4 Under Chamfer Distances And Angles, click Distance Angle.
5 Under Chamfer Distances And Angles, specify the chamfer distance and angle.
6 Click OK.
7 Select the first object.
8 Select the second object.
Modify toolbar
Command line CHAMFER
Select the first (A) and The chamfer is drawn, based on the distance
second (B) objects. (C) and the angle (D).
Chamfer Polylines and Polyline Segments
You can create a chamfer line for two segments of a polyline that are adjacent or

MODIFY OBJECTS
177
separated by no more than one arc segment. As shown in the illustration, if they
separated by a arc segment, the arc is deleted and replaced with a chamfer line.
To chamfer selected vertices in a polyline
1 Choose Modify > Chamfer.
2 Select the polyline along the segment where you want to begin the chamfer.
3 Select the polyline along the segment where you want to end the chamfer.
Modify toolbar
Command line CHAMFER
Select the polyline Result after chamfering.
along the (A)
and(B) segments.
Chamfer an Entire Polyline
You can use Polyline option to create chamfer lines for each intersection of an entire
polyline. To get the best results, keeps the first and second chamfer distance equal.
To chamfer all vertices in a polyline
1 Choose Modify > Chamfer.
2 On the command line, type polyline.
3 Select the polyline.
Modify toolbar
Command line CHAMFER
Original polyline. Result after chamfering.
When chamfering an entire polyline, only accommodated chamfer distance can create a
chamfer line. As shown in the illustration, some segments are too short to create a
chamfer line.

CHAPTER 8
178
8.2.16. Create Fillets
You can create a fillet using FILLIT command. This command can apply to the objects
such as arcs, circles, ellipses, lines, polylines, radials, splines or construction lines as well
as 3D solids. A fillet is an arc that connects two objects smoothly and has a specified
radius. An inside corner is called a fillet; an outside corner is called a round.
To fillet two objects
1 Choose Modify > Fillet.
2 On the command line, type s.
3 In the Drawing Settings dialog box, specify the fillet radius.
4 Click OK.
5 Select the first object.
6 Select the second object.
Modify toolbar
Command line FILLET
Select the first (A) and second (B) objects. Result after filleting.
Using FILLET command can help you create an arc that is tangent to the selected objects
easily. You can also use Polyline option to create fillets for each corners of a polyline.
When the objects to fillet are on the same layer, the fillet arc is created on that layer;
otherwise, the fillet arc is created on the current layer that affects the properties of objects
such as color and linetype. The Multiple option can create fillets for more than one set of
objects until you exit the command.
Set the Fillet Radius
You can specify the radius of a fillet arc connecting two objects. The latest value is always
the current radius value. This setting is only available when you create a new fillet arc.
When the radius is set to 0, the objects to fillet are trim or extend to get intersecting, but
not create a fillet arc.
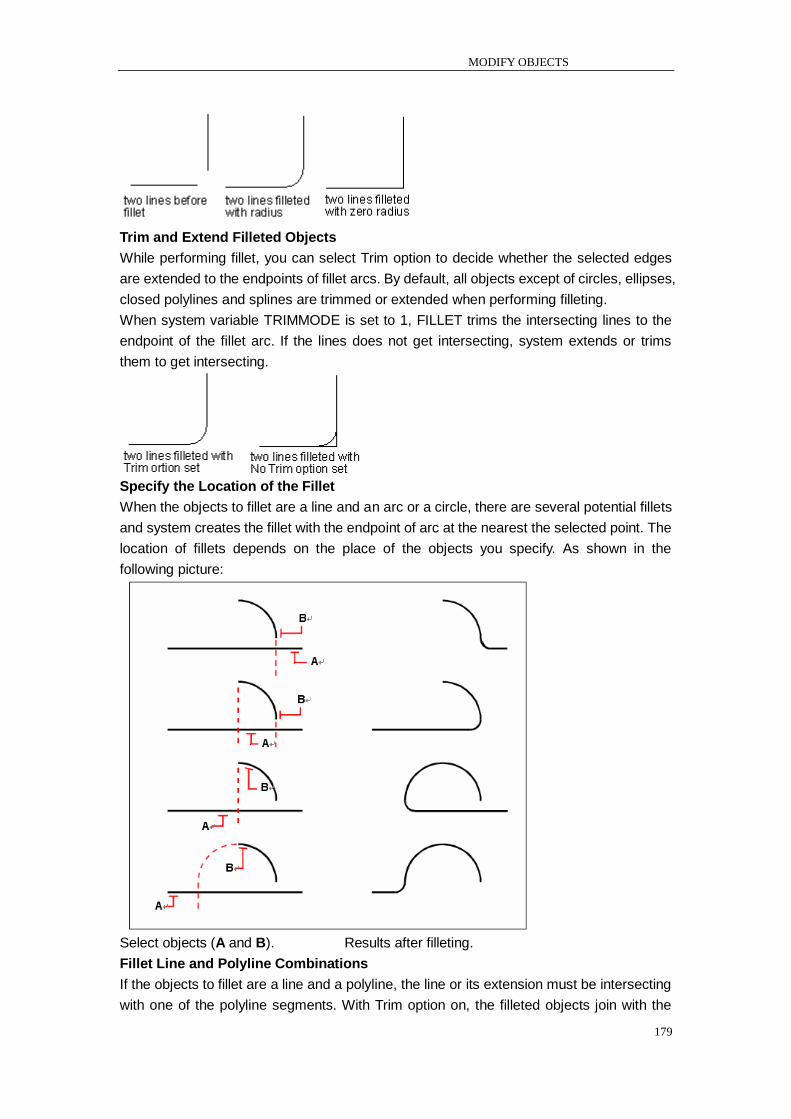
MODIFY OBJECTS
179
Trim and Extend Filleted Objects
While performing fillet, you can select Trim option to decide whether the selected edges
are extended to the endpoints of fillet arcs. By default, all objects except of circles, ellipses,
closed polylines and splines are trimmed or extended when performing filleting.
When system variable TRIMMODE is set to 1, FILLET trims the intersecting lines to the
endpoint of the fillet arc. If the lines does not get intersecting, system extends or trims
them to get intersecting.
Specify the Location of the Fillet
When the objects to fillet are a line and an arc or a circle, there are several potential fillets
and system creates the fillet with the endpoint of arc at the nearest the selected point. The
location of fillets depends on the place of the objects you specify. As shown in the
following picture:
Select objects (A and B). Results after filleting.
Fillet Line and Polyline Combinations
If the objects to fillet are a line and a polyline, the line or its extension must be intersecting
with one of the polyline segments. With Trim option on, the filleted objects join with the
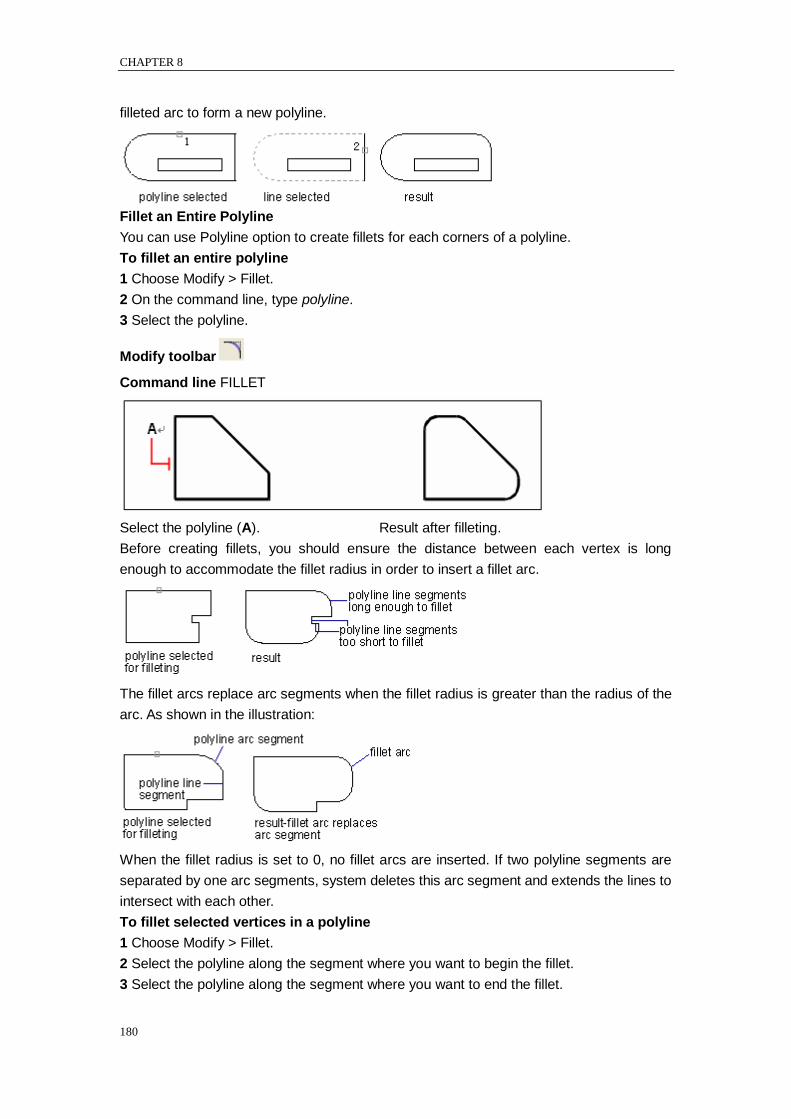
CHAPTER 8
180
filleted arc to form a new polyline.
Fillet an Entire Polyline
You can use Polyline option to create fillets for each corners of a polyline.
To fillet an entire polyline
1 Choose Modify > Fillet.
2 On the command line, type polyline.
3 Select the polyline.
Modify toolbar
Command line FILLET
Select the polyline (A). Result after filleting.
Before creating fillets, you should ensure the distance between each vertex is long
enough to accommodate the fillet radius in order to insert a fillet arc.
The fillet arcs replace arc segments when the fillet radius is greater than the radius of the
arc. As shown in the illustration:
When the fillet radius is set to 0, no fillet arcs are inserted. If two polyline segments are
separated by one arc segments, system deletes this arc segment and extends the lines to
intersect with each other.
To fillet selected vertices in a polyline
1 Choose Modify > Fillet.
2 Select the polyline along the segment where you want to begin the fillet.
3 Select the polyline along the segment where you want to end the fillet.

MODIFY OBJECTS
181
Modify toolbar
Command line FILLET
Select the polyline Result after filleting.
along the (A) and
(B) segments.
Fillet Parallel Lines
You can fillet parallel lines, rays, and infinite lines. The first entity must be a line or ray, the
second entity can be a line, ray, or infinite line. The diameter of the fillet arc is always
equal to the distance between the parallel entities. The current fillet radius is ignored.
Original entities. Result after filleting.
8.3. Modify Compound Objects
8.3.1. Disassociate Compound Objects
You can convert a complex entity, such as a block or polyline, from a single entity into its
component parts. Exploding a polyline, rectangle, donut, polygon, dimension,or leader
reduces it to a collection of individual line and arc entities that you can then modify
individually. Blocks are converted to the individual entities, possibly including other,
nested blocks that composed the original entity.
With the following exceptions, exploding an entity usually has no visible effect on a
drawing:
If the original polyline had a width, the width information is lost when you explode it. The
resulting lines and arcs follow the centerline of the original polyline. If you explode a donut,
its width becomes 0.
If you explode a block containing attributes, the attributes are lost, but the original attribute
definitions are retained. The colors and linetypes of objects in exploded block references
can be modified individually.
Colors, linetypes, lineweights, and print styles assigned BYBLOCK may be different after
exploding an entity, because they will adopt the default color, linetype, lineweight, and
print style until inserted into another block.
Explode Polylines
CHAPTER 8
182
You can explode polylines into simple line segments and arc segments, which neglects
the width of a polyline. The exploded lines and arcs are placed along to the center line of
the polyline. To be taken as a polyline object, the donut would be changed into two arcs
that form a circle ( with width as 0) after exploding.
Explode Dimensions and Hatches
You can explode a dimension or a hatch into individual objects (such as lines, texts, points
and 2D solids). all associativity is lost after exploding.
Explode Block References
You can explode a block reference into individual objects. if a block to be exploded
contains attributes, the attribute values are lost and leaving attribute definition. If you
explode a block that contains polyline objects, you have to explode the polyline
separately.
To explode a block
1 Choose Modify > Explode.
2 Select the block.
3 Press Enter.
Modify toolbar
Command line EXPLOD
Explode External References
You can not explode external references or the dependent blocks as they are linked or
attached to another drawing.
8.3.2. Modify Polylines
You can modify any type of two dimensional or three dimensional polyline. Objects such
as rectangles, polygons, and donuts, as well as three dimensional objects such as
pyramids, cylinders, and spheres, are all editable polylines.
You can edit a polyline by opening or closing it, by changing its overall width or the widths
of individual segments, and by converting a polyline with straight line segments into a
flowing curve or an approximation of a spline. In addition, you can use the Edit Polyline
tool to edit individual vertices, adding, removing, or moving vertices. You can also add
new segments to an existing polyline, change the linetypes of a polyline, and reverse the
direction or order of the vertices.
To modify a polyline, you first select the polyline, and then select a polyline editing
option.The available options vary depending on whether the selected polyline is a two
dimensional or three dimensional object. If the selected object is not a polyline, the Edit
Polyline tool provides the option of turning it into one. You can convert only arcs and lines
into polylines. If several arcs or lines are joined endpoint to endpoint, they can all be
selected and turned into one polyline.
To convert an object into a polyline
1 Choose Modify > Object > Polyline.
2 Select the object.
3 On the command line, type yes.
4 On the command line, type another option, or press Enter to complete the command.
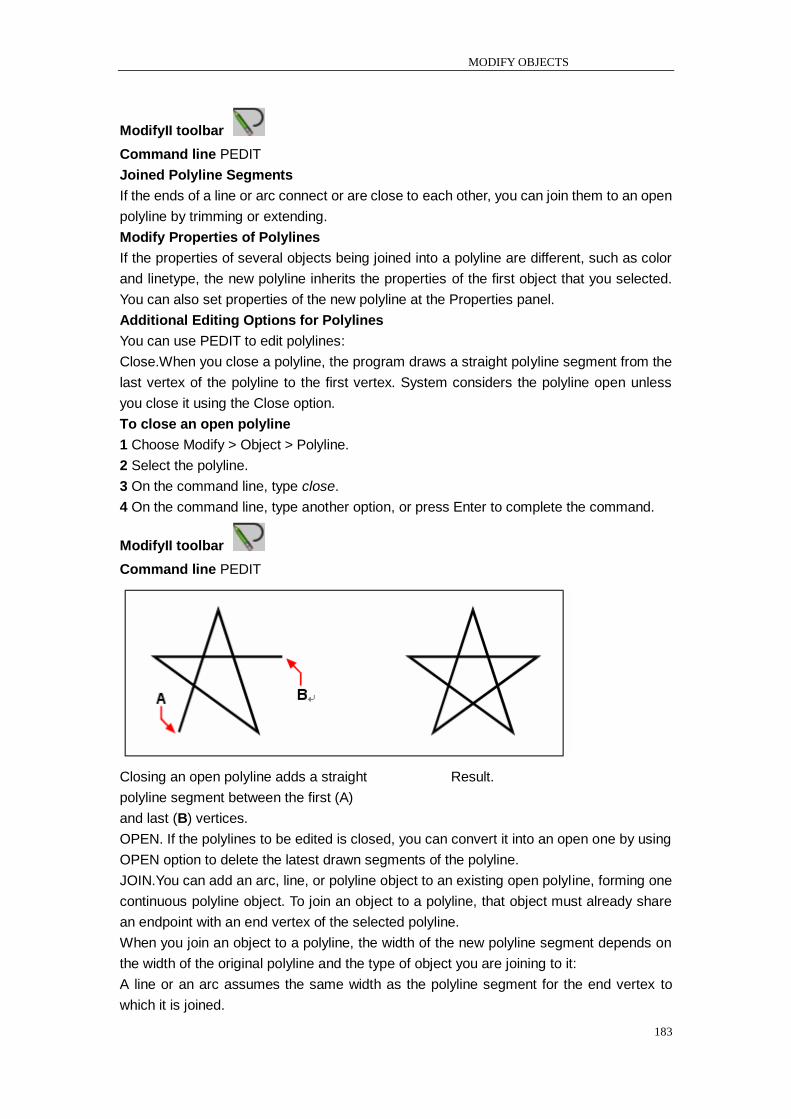
MODIFY OBJECTS
183
ModifyII toolbar
Command line PEDIT
Joined Polyline Segments
If the ends of a line or arc connect or are close to each other, you can join them to an open
polyline by trimming or extending.
Modify Properties of Polylines
If the properties of several objects being joined into a polyline are different, such as color
and linetype, the new polyline inherits the properties of the first object that you selected.
You can also set properties of the new polyline at the Properties panel.
Additional Editing Options for Polylines
You can use PEDIT to edit polylines:
Close.When you close a polyline, the program draws a straight polyline segment from the
last vertex of the polyline to the first vertex. System considers the polyline open unless
you close it using the Close option.
To close an open polyline
1 Choose Modify > Object > Polyline.
2 Select the polyline.
3 On the command line, type close.
4 On the command line, type another option, or press Enter to complete the command.
ModifyII toolbar
Command line PEDIT
Closing an open polyline adds a straight Result.
polyline segment between the first (A)
and last (B) vertices.
OPEN. If the polylines to be edited is closed, you can convert it into an open one by using
OPEN option to delete the latest drawn segments of the polyline.
JOIN.You can add an arc, line, or polyline object to an existing open polyline, forming one
continuous polyline object. To join an object to a polyline, that object must already share
an endpoint with an end vertex of the selected polyline.
When you join an object to a polyline, the width of the new polyline segment depends on
the width of the original polyline and the type of object you are joining to it:
A line or an arc assumes the same width as the polyline segment for the end vertex to
which it is joined.
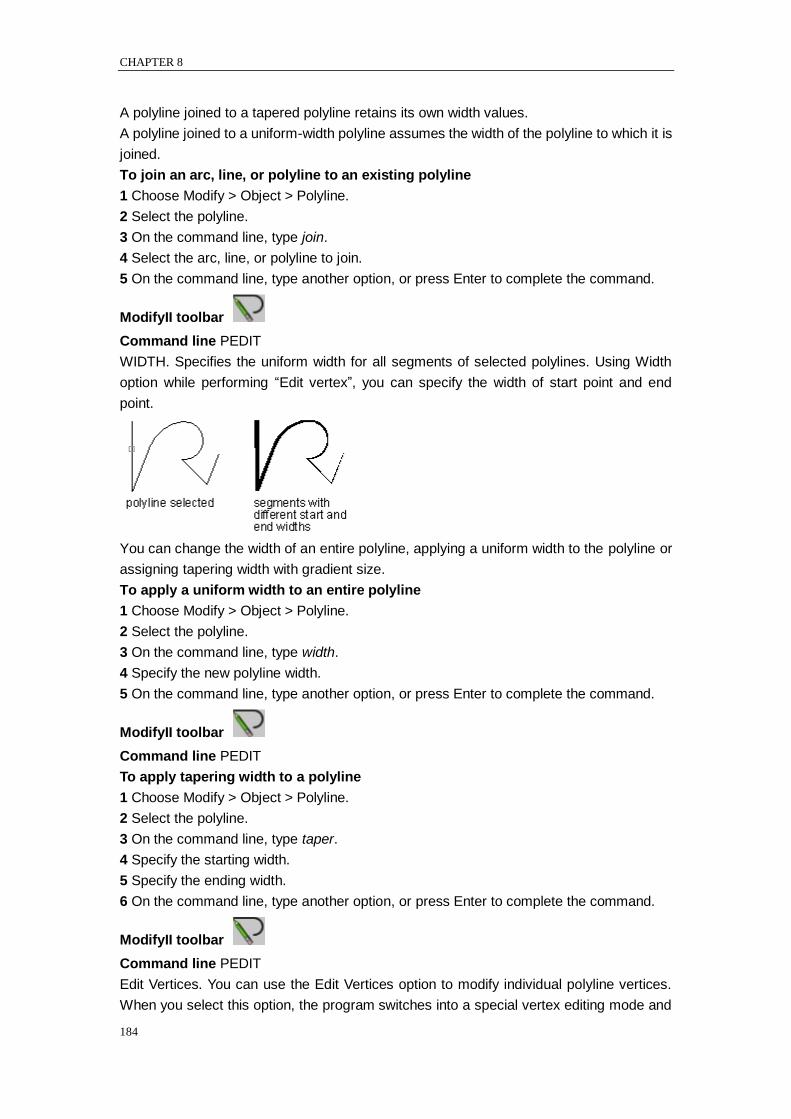
CHAPTER 8
184
A polyline joined to a tapered polyline retains its own width values.
A polyline joined to a uniform-width polyline assumes the width of the polyline to which it is
joined.
To join an arc, line, or polyline to an existing polyline
1 Choose Modify > Object > Polyline.
2 Select the polyline.
3 On the command line, type join.
4 Select the arc, line, or polyline to join.
5 On the command line, type another option, or press Enter to complete the command.
ModifyII toolbar
Command line PEDIT
WIDTH. Specifies the uniform width for all segments of selected polylines. Using Width
option while performing ―Edit vertex‖, you can specify the width of start point and end
point.
You can change the width of an entire polyline, applying a uniform width to the polyline or
assigning tapering width with gradient size.
To apply a uniform width to an entire polyline
1 Choose Modify > Object > Polyline.
2 Select the polyline.
3 On the command line, type width.
4 Specify the new polyline width.
5 On the command line, type another option, or press Enter to complete the command.
ModifyII toolbar
Command line PEDIT
To apply tapering width to a polyline
1 Choose Modify > Object > Polyline.
2 Select the polyline.
3 On the command line, type taper.
4 Specify the starting width.
5 Specify the ending width.
6 On the command line, type another option, or press Enter to complete the command.
ModifyII toolbar
Command line PEDIT
Edit Vertices. You can use the Edit Vertices option to modify individual polyline vertices.
When you select this option, the program switches into a special vertex editing mode and
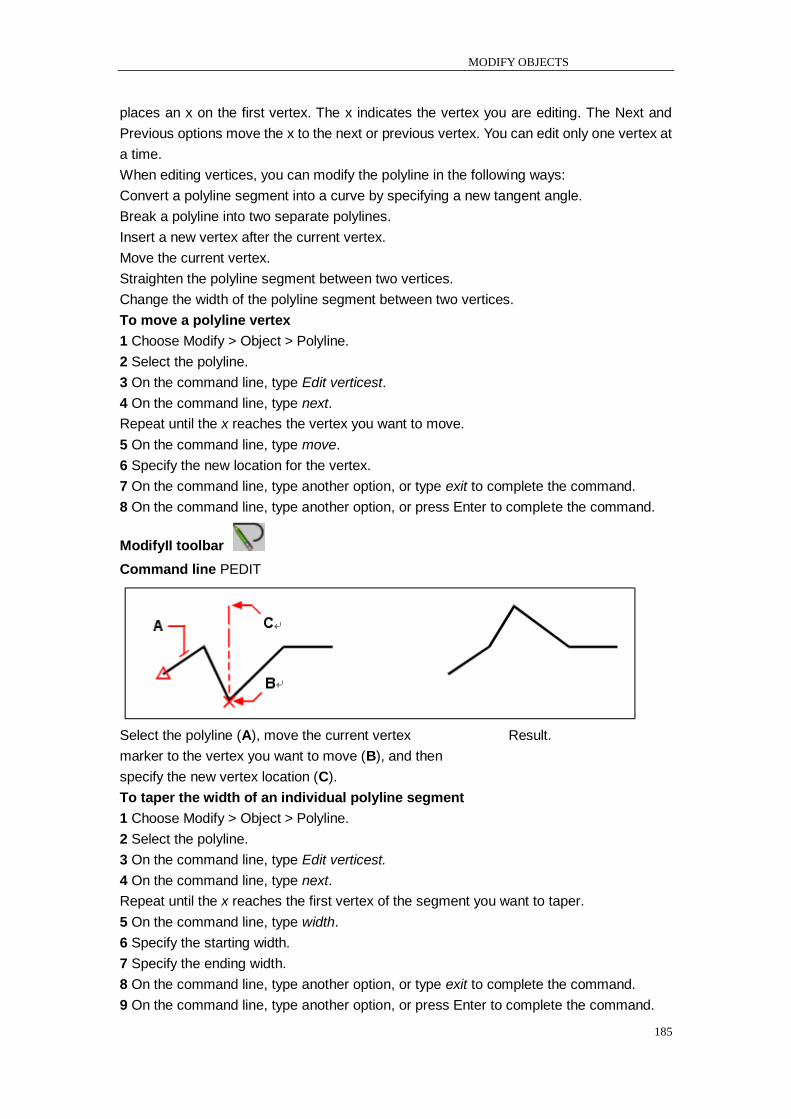
MODIFY OBJECTS
185
places an x on the first vertex. The x indicates the vertex you are editing. The Next and
Previous options move the x to the next or previous vertex. You can edit only one vertex at
a time.
When editing vertices, you can modify the polyline in the following ways:
Convert a polyline segment into a curve by specifying a new tangent angle.
Break a polyline into two separate polylines.
Insert a new vertex after the current vertex.
Move the current vertex.
Straighten the polyline segment between two vertices.
Change the width of the polyline segment between two vertices.
To move a polyline vertex
1 Choose Modify > Object > Polyline.
2 Select the polyline.
3 On the command line, type Edit verticest.
4 On the command line, type next.
Repeat until the x reaches the vertex you want to move.
5 On the command line, type move.
6 Specify the new location for the vertex.
7 On the command line, type another option, or type exit to complete the command.
8 On the command line, type another option, or press Enter to complete the command.
ModifyII toolbar
Command line PEDIT
Select the polyline (A), move the current vertex Result.
marker to the vertex you want to move (B), and then
specify the new vertex location (C).
To taper the width of an individual polyline segment
1 Choose Modify > Object > Polyline.
2 Select the polyline.
3 On the command line, type Edit verticest.
4 On the command line, type next.
Repeat until the x reaches the first vertex of the segment you want to taper.
5 On the command line, type width.
6 Specify the starting width.
7 Specify the ending width.
8 On the command line, type another option, or type exit to complete the command.
9 On the command line, type another option, or press Enter to complete the command.
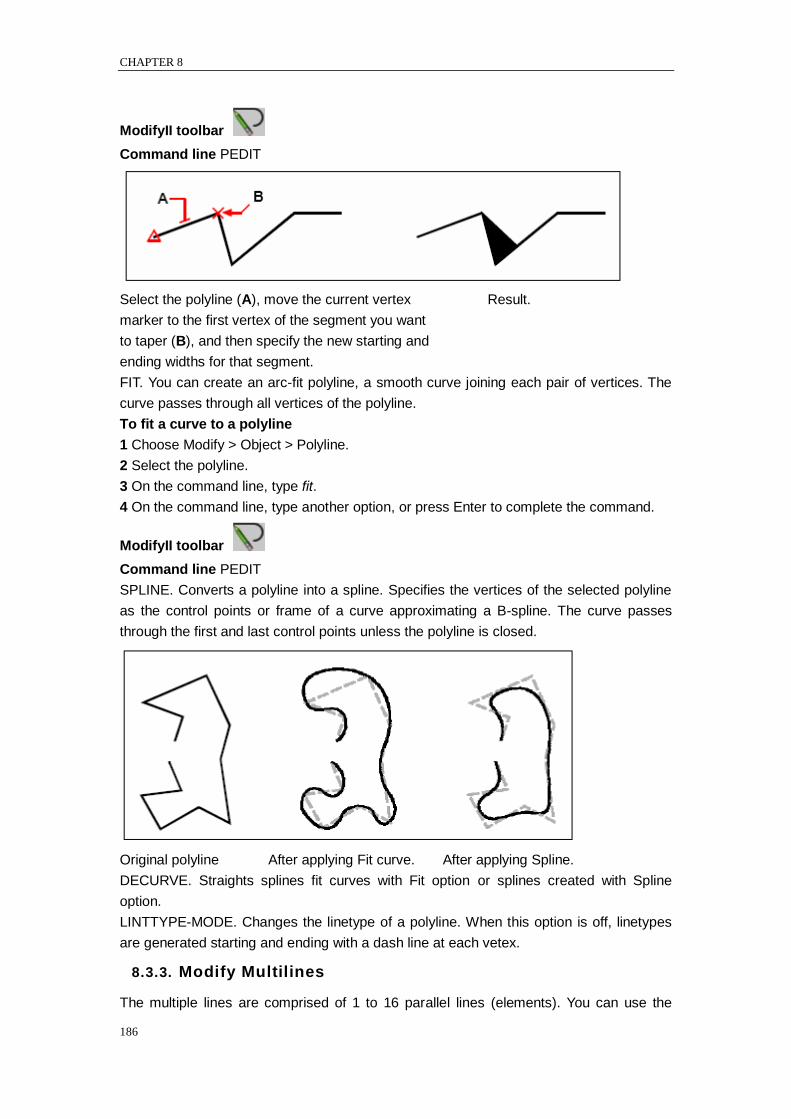
CHAPTER 8
186
ModifyII toolbar
Command line PEDIT
Select the polyline (A), move the current vertex Result.
marker to the first vertex of the segment you want
to taper (B), and then specify the new starting and
ending widths for that segment.
FIT. You can create an arc-fit polyline, a smooth curve joining each pair of vertices. The
curve passes through all vertices of the polyline.
To fit a curve to a polyline
1 Choose Modify > Object > Polyline.
2 Select the polyline.
3 On the command line, type fit.
4 On the command line, type another option, or press Enter to complete the command.
ModifyII toolbar
Command line PEDIT
SPLINE. Converts a polyline into a spline. Specifies the vertices of the selected polyline
as the control points or frame of a curve approximating a B-spline. The curve passes
through the first and last control points unless the polyline is closed.
Original polyline After applying Fit curve. After applying Spline.
DECURVE. Straights splines fit curves with Fit option or splines created with Spline
option.
LINTTYPE-MODE. Changes the linetype of a polyline. When this option is off, linetypes
are generated starting and ending with a dash line at each vetex.
8.3.3. Modify Multilines
The multiple lines are comprised of 1 to 16 parallel lines (elements). You can use the
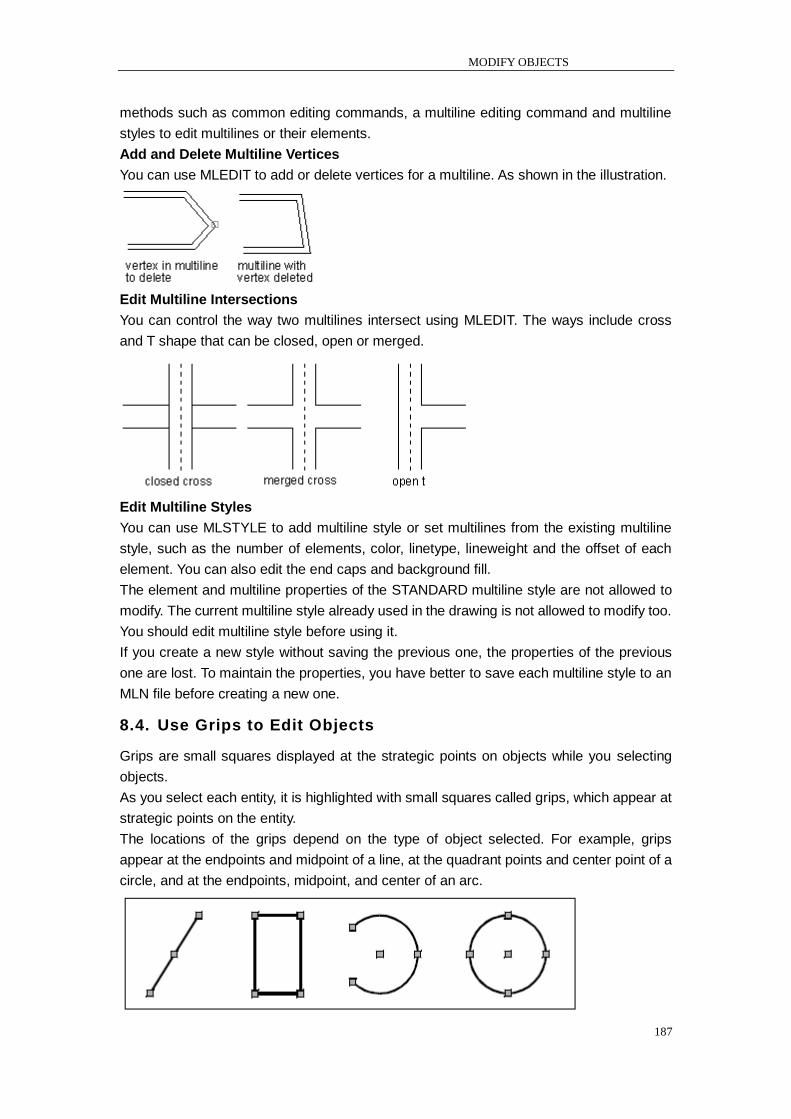
MODIFY OBJECTS
187
methods such as common editing commands, a multiline editing command and multiline
styles to edit multilines or their elements.
Add and Delete Multiline Vertices
You can use MLEDIT to add or delete vertices for a multiline. As shown in the illustration.
Edit Multiline Intersections
You can control the way two multilines intersect using MLEDIT. The ways include cross
and T shape that can be closed, open or merged.
Edit Multiline Styles
You can use MLSTYLE to add multiline style or set multilines from the existing multiline
style, such as the number of elements, color, linetype, lineweight and the offset of each
element. You can also edit the end caps and background fill.
The element and multiline properties of the STANDARD multiline style are not allowed to
modify. The current multiline style already used in the drawing is not allowed to modify too.
You should edit multiline style before using it.
If you create a new style without saving the previous one, the properties of the previous
one are lost. To maintain the properties, you have better to save each multiline style to an
MLN file before creating a new one.
8.4. Use Grips to Edit Objects
Grips are small squares displayed at the strategic points on objects while you selecting
objects.
As you select each entity, it is highlighted with small squares called grips, which appear at
strategic points on the entity.
The locations of the grips depend on the type of object selected. For example, grips
appear at the endpoints and midpoint of a line, at the quadrant points and center point of a
circle, and at the endpoints, midpoint, and center of an arc.

CHAPTER 8
188
Examples of grip locations.
To use grips for editing, you select an object to display the grips, and then click a grip to
make it active. The grip you select depends on the type of object you‘re modifying and the
editing operation you‘re performing. For example, to move a line object, drag it by its
midpoint grip.
To stretch the line, drag one of the endpoint grips. You do not need to enter a command
when using grips.
8.4.1. Control Status and Displaying of Grips
You can turn the use of grips on and off and control the size and color of grips under
different status.
To change grip settings
1 Choose Tools > Options.
2 In the Options dialog box, click the Selction tab.
3 In the Grip Size,specify the size.
4 In the Grips, click Enable grips.
5 Click on the color button separately behind the Unselected grip color, Selected grip color
and Hover grip color, to assign colors for grips under different status.
6 Click OK.
You can use grips to modify objects, such as move, stretch, scale and copy. With the
Grips on, the location of grips depending on the type of objects are displayed as follows:
When you perform quadrant grips on circles, the distance is measured from the center
point, but not the selected grip. For example, in Stretch mode, you can select a quadrant
grip to stretch a circle, and then specify a distance at the prompt of ―New circle radius‖.
The distance is measured from the center point, but not the selected quadrant. If you
select the center point, the circle moves.
When a 2D solid is not lie on the current UCS, the object is stretched on the plane that the
object is created, but not on the plane of the current UCS.
The system variable GRIPOBJLIMIT is used to control the number of grips displayed on
the selected object. The value of GRIPOBJLIMIT is not available when you add an object
to the current selection set.
Control Grips in Blocks
The system variable GRIPBLOCK is used to control whether the inserted block displays a
single grip or all of grips.
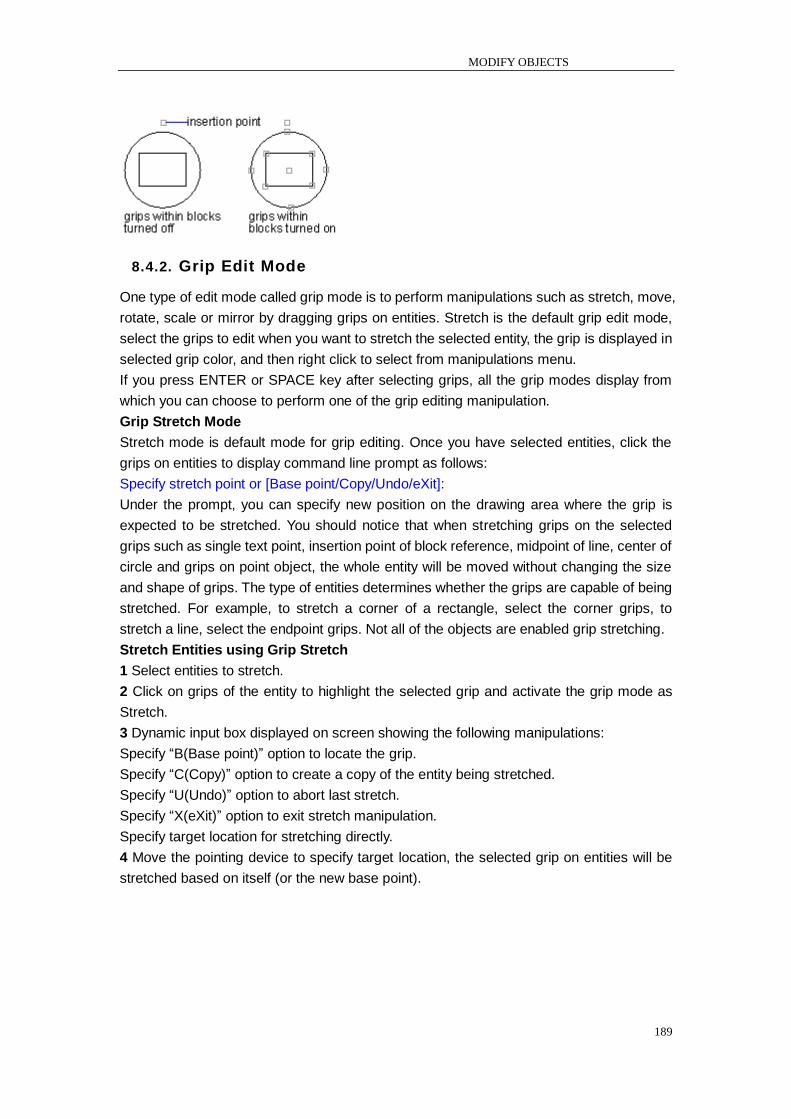
MODIFY OBJECTS
189
8.4.2. Grip Edit Mode
One type of edit mode called grip mode is to perform manipulations such as stretch, move,
rotate, scale or mirror by dragging grips on entities. Stretch is the default grip edit mode,
select the grips to edit when you want to stretch the selected entity, the grip is displayed in
selected grip color, and then right click to select from manipulations menu.
If you press ENTER or SPACE key after selecting grips, all the grip modes display from
which you can choose to perform one of the grip editing manipulation.
Grip Stretch Mode
Stretch mode is default mode for grip editing. Once you have selected entities, click the
grips on entities to display command line prompt as follows:
Specify stretch point or [Base point/Copy/Undo/eXit]:
Under the prompt, you can specify new position on the drawing area where the grip is
expected to be stretched. You should notice that when stretching grips on the selected
grips such as single text point, insertion point of block reference, midpoint of line, center of
circle and grips on point object, the whole entity will be moved without changing the size
and shape of grips. The type of entities determines whether the grips are capable of being
stretched. For example, to stretch a corner of a rectangle, select the corner grips, to
stretch a line, select the endpoint grips. Not all of the objects are enabled grip stretching.
Stretch Entities using Grip Stretch
1 Select entities to stretch.
2 Click on grips of the entity to highlight the selected grip and activate the grip mode as
Stretch.
3 Dynamic input box displayed on screen showing the following manipulations:
Specify ―B(Base point)‖ option to locate the grip.
Specify ―C(Copy)‖ option to create a copy of the entity being stretched.
Specify ―U(Undo)‖ option to abort last stretch.
Specify ―X(eXit)‖ option to exit stretch manipulation.
Specify target location for stretching directly.
4 Move the pointing device to specify target location, the selected grip on entities will be
stretched based on itself (or the new base point).
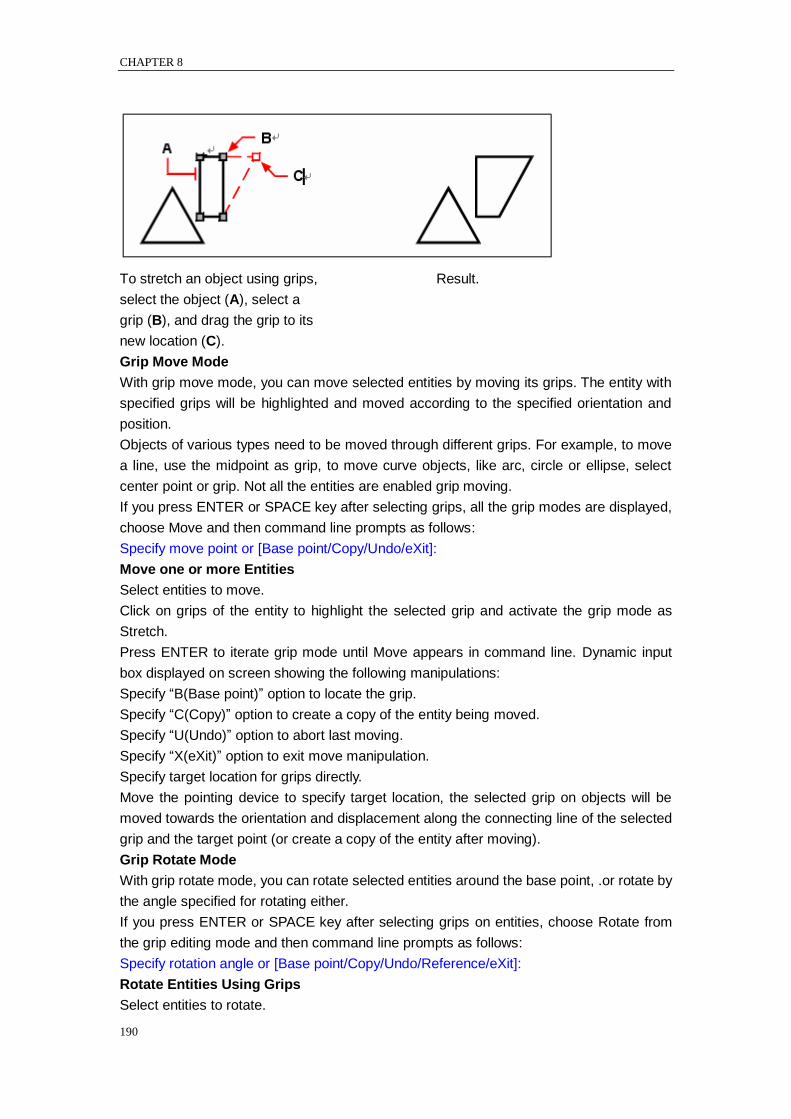
CHAPTER 8
190
To stretch an object using grips, Result.
select the object (A), select a
grip (B), and drag the grip to its
new location (C).
Grip Move Mode
With grip move mode, you can move selected entities by moving its grips. The entity with
specified grips will be highlighted and moved according to the specified orientation and
position.
Objects of various types need to be moved through different grips. For example, to move
a line, use the midpoint as grip, to move curve objects, like arc, circle or ellipse, select
center point or grip. Not all the entities are enabled grip moving.
If you press ENTER or SPACE key after selecting grips, all the grip modes are displayed,
choose Move and then command line prompts as follows:
Specify move point or [Base point/Copy/Undo/eXit]:
Move one or more Entities
Select entities to move.
Click on grips of the entity to highlight the selected grip and activate the grip mode as
Stretch.
Press ENTER to iterate grip mode until Move appears in command line. Dynamic input
box displayed on screen showing the following manipulations:
Specify ―B(Base point)‖ option to locate the grip.
Specify ―C(Copy)‖ option to create a copy of the entity being moved.
Specify ―U(Undo)‖ option to abort last moving.
Specify ―X(eXit)‖ option to exit move manipulation.
Specify target location for grips directly.
Move the pointing device to specify target location, the selected grip on objects will be
moved towards the orientation and displacement along the connecting line of the selected
grip and the target point (or create a copy of the entity after moving).
Grip Rotate Mode
With grip rotate mode, you can rotate selected entities around the base point, .or rotate by
the angle specified for rotating either.
If you press ENTER or SPACE key after selecting grips on entities, choose Rotate from
the grip editing mode and then command line prompts as follows:
Specify rotation angle or [Base point/Copy/Undo/Reference/eXit]:
Rotate Entities Using Grips
Select entities to rotate.
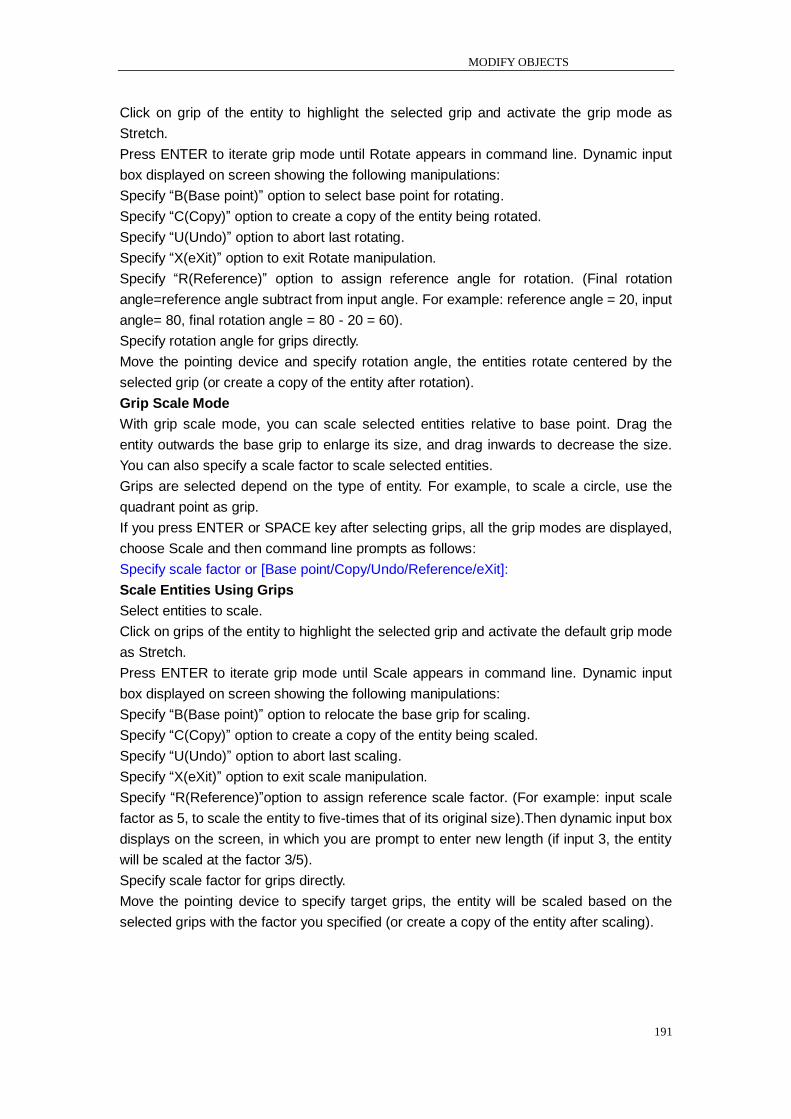
MODIFY OBJECTS
191
Click on grip of the entity to highlight the selected grip and activate the grip mode as
Stretch.
Press ENTER to iterate grip mode until Rotate appears in command line. Dynamic input
box displayed on screen showing the following manipulations:
Specify ―B(Base point)‖ option to select base point for rotating.
Specify ―C(Copy)‖ option to create a copy of the entity being rotated.
Specify ―U(Undo)‖ option to abort last rotating.
Specify ―X(eXit)‖ option to exit Rotate manipulation.
Specify ―R(Reference)‖ option to assign reference angle for rotation. (Final rotation
angle=reference angle subtract from input angle. For example: reference angle = 20, input
angle= 80, final rotation angle = 80 - 20 = 60).
Specify rotation angle for grips directly.
Move the pointing device and specify rotation angle, the entities rotate centered by the
selected grip (or create a copy of the entity after rotation).
Grip Scale Mode
With grip scale mode, you can scale selected entities relative to base point. Drag the
entity outwards the base grip to enlarge its size, and drag inwards to decrease the size.
You can also specify a scale factor to scale selected entities.
Grips are selected depend on the type of entity. For example, to scale a circle, use the
quadrant point as grip.
If you press ENTER or SPACE key after selecting grips, all the grip modes are displayed,
choose Scale and then command line prompts as follows:
Specify scale factor or [Base point/Copy/Undo/Reference/eXit]:
Scale Entities Using Grips
Select entities to scale.
Click on grips of the entity to highlight the selected grip and activate the default grip mode
as Stretch.
Press ENTER to iterate grip mode until Scale appears in command line. Dynamic input
box displayed on screen showing the following manipulations:
Specify ―B(Base point)‖ option to relocate the base grip for scaling.
Specify ―C(Copy)‖ option to create a copy of the entity being scaled.
Specify ―U(Undo)‖ option to abort last scaling.
Specify ―X(eXit)‖ option to exit scale manipulation.
Specify ―R(Reference)‖option to assign reference scale factor. (For example: input scale
factor as 5, to scale the entity to five-times that of its original size).Then dynamic input box
displays on the screen, in which you are prompt to enter new length (if input 3, the entity
will be scaled at the factor 3/5).
Specify scale factor for grips directly.
Move the pointing device to specify target grips, the entity will be scaled based on the
selected grips with the factor you specified (or create a copy of the entity after scaling).
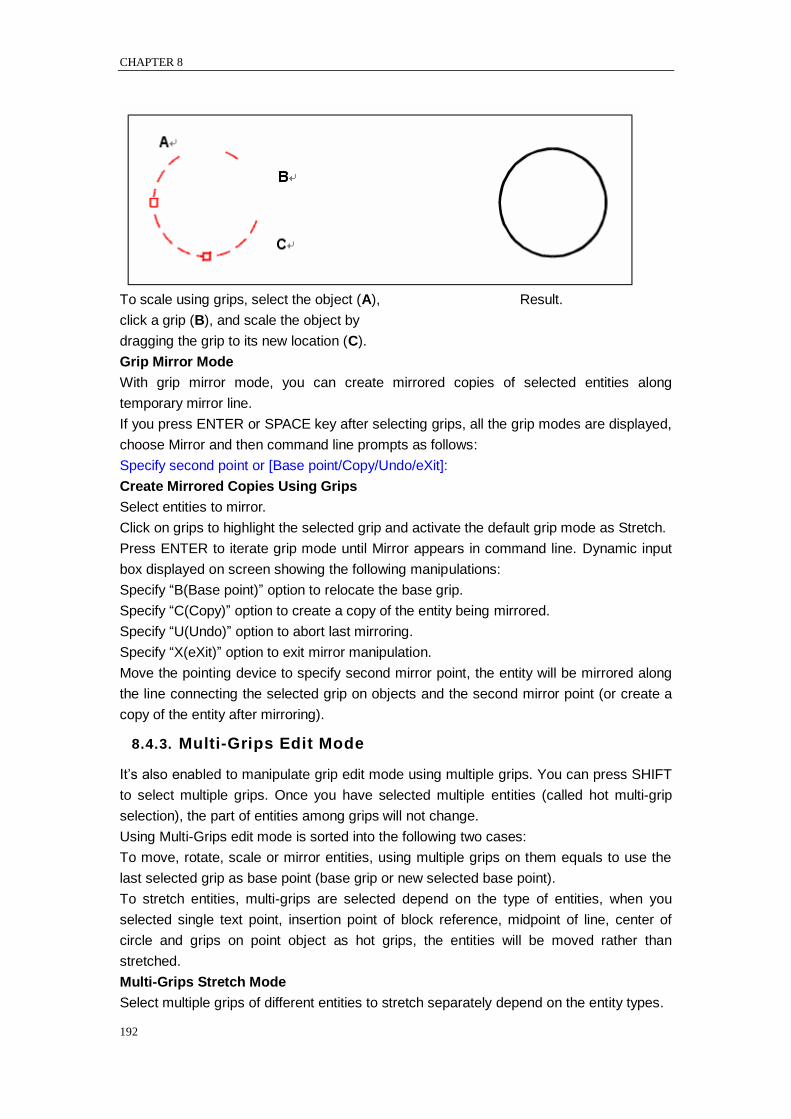
CHAPTER 8
192
To scale using grips, select the object (A), Result.
click a grip (B), and scale the object by
dragging the grip to its new location (C).
Grip Mirror Mode
With grip mirror mode, you can create mirrored copies of selected entities along
temporary mirror line.
If you press ENTER or SPACE key after selecting grips, all the grip modes are displayed,
choose Mirror and then command line prompts as follows:
Specify second point or [Base point/Copy/Undo/eXit]:
Create Mirrored Copies Using Grips
Select entities to mirror.
Click on grips to highlight the selected grip and activate the default grip mode as Stretch.
Press ENTER to iterate grip mode until Mirror appears in command line. Dynamic input
box displayed on screen showing the following manipulations:
Specify ―B(Base point)‖ option to relocate the base grip.
Specify ―C(Copy)‖ option to create a copy of the entity being mirrored.
Specify ―U(Undo)‖ option to abort last mirroring.
Specify ―X(eXit)‖ option to exit mirror manipulation.
Move the pointing device to specify second mirror point, the entity will be mirrored along
the line connecting the selected grip on objects and the second mirror point (or create a
copy of the entity after mirroring).
8.4.3. Multi-Grips Edit Mode
It‘s also enabled to manipulate grip edit mode using multiple grips. You can press SHIFT
to select multiple grips. Once you have selected multiple entities (called hot multi-grip
selection), the part of entities among grips will not change.
Using Multi-Grips edit mode is sorted into the following two cases:
To move, rotate, scale or mirror entities, using multiple grips on them equals to use the
last selected grip as base point (base grip or new selected base point).
To stretch entities, multi-grips are selected depend on the type of entities, when you
selected single text point, insertion point of block reference, midpoint of line, center of
circle and grips on point object as hot grips, the entities will be moved rather than
stretched.
Multi-Grips Stretch Mode
Select multiple grips of different entities to stretch separately depend on the entity types.
MODIFY OBJECTS
193
Stretch Lines, Polylines and Dimensions Using Multiple Grips
Select line, polyline and dimension entities to stretch.
Press SHIFT while selecting grips on entities, the selected grips will be highlighted.
Release SHIFT and click on one of the selected grips to use it as base grip and activate
the default grip mode as Stretch. Dynamic input box displayed on screen showing the
following manipulations:
Specify ―B(Base point)‖ option to locate the grip for stretching.
Specify ―C(Copy)‖ option to create a copy of the entity being stretched.
Specify ―U(Undo)‖ option to abort last stretch.
Specify ―X(eXit)‖ option to exit stretch manipulation.
Specify target location for stretching directly.
Move the pointing device to specify target grips, the selected grips on entities will be
stretched or moved towards the direction pointing from the base grip to the target location
(single text point, insertion point of block reference, midpoint of line, center of circle and
grips on point object).
Multi-Grips Move Mode
Move entities with multiple grips mode, use the last grip ( base grip or reselected base
point) as base point.
Move Lines, Polylines and Dimensions Using Multiple Grips
Select line, polyline and dimension entities to move.
Press SHIFT while selecting grips on entities, the selected grips will be highlighted.
Release SHIFT and click on one of the selected grips to use it as base grip
Press ENTER to activate the default grip mode as Stretch. Iterate grip mode until Move
appears in command line. Dynamic input box displayed on screen showing the following
manipulations:
Specify ―B(Base point)‖ option to locate the base point for moving.
Specify ―C(Copy)‖ option to create a copy of the entity being moved.
Specify ―U(Undo)‖ option to abort last moving.
Specify ―X(eXit)‖ option to exit move manipulation.
Specify target location for moving directly.
Move the pointing device to specify target location, the selected grips on entities will be
moved at a specified displacement towards the direction pointing from the base grip to the
target location.
Multi-Grips Rotate Mode
Rotate entities with multiple grips mode, use the last grip ( base grip or reselected base
point) as base point.
Rotate Lines, Polylines and Dimensions Using Multiple Grips
Select line, polyline and dimension entities to rotate.
Press SHIFT while selecting grips on entities, the selected grips will be highlighted.
Release SHIFT and click on one of the selected grips to use it as base grip
Press ENTER to activate the default grip mode as Stretch. Iterate grip mode until Rotate
appears in command line. Dynamic input box displayed on screen showing the following
manipulations:
Specify ―B(Base point)‖ option to locate the grip for rotating.
CHAPTER 8
194
Specify ―C(Copy)‖ option to create a copy of the entity being rotated.
Specify ―U(Undo)‖ option to abort last rotation.
Specify ―X(eXit)‖ option to exit rotate manipulation.
Specify ―R(Reference)‖ option to assign reference angle for rotation. (Final rotation
angle=reference angle subtract from input angle. For example: reference angle = 20, input
angle= 80, final rotation angle = 80 - 20 = 60).
Specify rotation angle for grips directly.
Move the pointing device to specify rotation angle, the entities will be rotated based on the
selected grip (or create a copy of the entity after rotation).
Multi-Grips Scale Mode
Scale entities with multiple grips mode, use the last grip ( base grip or reselected base
point) as base point.
Scale Lines, Polylines and Dimensions Using Multiple Grips
Select line, polyline and dimension entities to scale.
Press SHIFT while selecting grips on entities, the selected grips will be highlighted.
Release SHIFT and click on one of the selected grips to use it as base grip
Press ENTER to activate the default grip mode as Stretch. Iterate grip mode until Scale
appears in command line. Dynamic input box displayed on screen showing the following
manipulations:
Specify ―B(Base point)‖ option to locate the grip for scaling.
Specify ―C(Copy)‖ option to create a copy of the entity being scaled.
Specify ―U(Undo)‖ option to abort last scaling.
Specify ―X(eXit)‖ option to exit scale manipulation.
Specify ―R(Reference)‖option to assign reference scale factor. (For example: input scale
factor as 5, to scale the entity to 5 times of its original size).Then dynamic input box
displays on the screen, in which you are prompt to enter new length ( if input 3, the entity
will be scaled with the factor 3/5).
Specify scale factor for grips directly.
Move the pointing device to specify target grips, the entity will be scaled based on the
selected grips with the factor you specified ( or create a copy of the entity after scaling).
Multi-Grips Mirror Mode
Mirror entities and create their copies with multiple grips mode, use the last grip ( base
grip or reselected base point) as base point.
Mirror Lines, Polylines and Dimensions Using Multiple Grips
Select line, polyline and dimension entities to mirror.
Press SHIFT while selecting grips on entities, the selected grips will be highlighted.
Release SHIFT and click on one of the selected grips to use it as base grip
Press ENTER to activate the default grip mode as Stretch. Iterate grip mode until Mirror
appears in command line. Dynamic input box displayed on screen showing the following
manipulations:
Specify ―B(Base point)‖ option to relocate the base grip.
Specify ―C(Copy)‖ option to create a copy of the entity being mirrored.
Specify ―U(Undo)‖ option to abort last mirroring.
Specify ―X(eXit)‖ option to exit mirror manipulation.
MODIFY OBJECTS
195
Move the pointing device to specify second mirror point, the entity will be mirrored along
the line connecting the selected grip on objects and the second mirror point ( or create a
copy of the entity after mirroring).
8.5. Modifying the properties of entities
Overview of Object Properties
You can display information about the selected entities. The information varies,depending
on the type of entities you select. All of the listings display the following information:
Entity type.
Layer.
Color.
Linetype.
The location of the entity (its xyz-coordinates relative to the current user coordinate
system [UCS]).
The size of the entity (the information varies, depending on the entity type).
The layer, color, linetype are the common properties that most of objects possess. There
are a few properties that some individual objects possess, such as radius and area of a
circle, length and angle of a line.
Most of properties can be applied to an object by layer or applied to an object directly.
If value BYLAYER is set to the property value, the object has the same value as the layer
on which it is drawn. For example, if you set Yellow to the layer 0 and assign value
BYLAYER to the lines that were drawn on the layer 0, its color is yellow too.
You can also specify a new value to overwrite the layer‘s value. For example, yellow is
assigned to the layer 0 and the value of lines is set to blue, the color of lines is blue.
You can use the following methods to display or modify the object properties:
View or modify properties in the Properties Panel.
View or modify layer controls on the Layer Properties Manager dialog box, might change
Color, Linetype, Lineweight at the Properties toolbar as well.
Use command LIST to view the information on the text window.
Use command ID to display the coordinate of the specified point
Properties panel
The Properties panel shows all properties of the specified object. You can change them in
this panel.
When selecting multiple objects, the Properties panel shows the command properties of
the selected objects.
If none of the object is selected, the Properties panel displays the general properties of the
current layer, View properties as well as the UCS information.
By default, double-click an object opens Properties panel if the Properties panel is hidden.
This operation is not available when the objects are block, hatch pattern, text, multiline,
external reference or gradient fill.
Change the Properties of Objects
You can change the layer, thickness, linetype, color, and linetype scale of one or more
entities. Depending on the type of entity or entities you select, you can also change other
properties, such as the start point and endpoint of lines, the center point and radius of
CHAPTER 8
196
circles, and the vertices of polylines.
You can modify all the properties of all entities simultaneously.For example,using the
select command and the Select by Properties option, select all blue entities and change
their color to green.
In the Properties dialog box, changes that you make in the Layer, Color, Thickness,
Lineweight, Linetype and Linetype Scale affect all selected entities.
To modify properties of objects
1 Choose Modify > Properties.
2 Select the objects.
3 In the Properties dialog box, changes the desired properties.
Standard toolbar
Command line PROPERTIES
Note that the Properties dialog box settings that display when no objects are selected
determine the properties of new objects when you draw them.
Copy Properties Between Objects
Using Match Properties, you can copy some or all properties of one object to other
objects.
The types of properties that can be copied include, but are not limited to:
color
layer
linetype
linetype scale
lineweight
3D thickness
By default, all applicant properties are copied along with the objects. You can also specify
the desired properties to copy at the Property settings dialog box by typing MATCHPROP.
8.6. Modify 3D Solids
You can edit three-dimensional solids in several unique ways, including: chamfer,
fillet,section, and slice. You can also modify individual faces and edges of solids, as well
as imprint, separate, shell, and check solids. You can edit three-dimensional ACIS solids,
including: boxes, cones, cylinders, dishes, domes, spheres, torus, and wedges.
8.6.1. Fillet and Chamfer
You can chamfer or fillet a three dimensional solid much like you chamfer or fillet a
MODIFY OBJECTS
197
twodimensional object.
Create fillers
You can create fillets for the specified edges of 3D objects. At first, you need to specify the
fillet radius, and then choose one method to create fillets.
If you choose Edge, the system creates fillets for the two selected edges. If you select
three or more edges which were around a vertex, the system creates a spheral vertex if
the three fillets have the same radius.
After specifying an arc radius, the system creates a sequence of fillets for the tangential
sequence of edges, when you use Loop option and select an edge.
In 3D space, as the selected objects are coplanar and the extrusion direction is not
parallel with the Z axis, you can create a fillet. If the objects are on the same plane, there
are two kind of extrusion direction shown as follows:
If the objects are on the same plane with the same extrusion direction normal to that plane,
the fillet arc is on that plane and has the same extrusion direction.
For objects on the same plane with opposite or different extrusion directions, the fillet arc
is located on that object plane with an extrusion direction normal to the object plane and
inclined towards the positive Z direction of the current UCS. For example, we assume two
arcs A and B are on the same plane in 3D space but have opposite extrusion directions
(0,0.65,0.86) and (0,–0.65,–0.86) relative to the current UCS. The fillet arc adopts the
extrusion direction (0,0.65,0.86).
To fillet a solid
1 Choose Modify > Fillet.
2 Select the edge of the solid to fillet.
3 Specify the fillet radius.
4 Select additional edges to fillet, and press Enter to fillet
Modify toolbar
Command line FILLET
Create chamfer
Using CHAMFER creates chamfers for the adjacent planes. While creating fillets, the
system prompts you to specify distance for the first and second object. The first object is
the base plane and the second one is other plane.
After specifying the chamfer distance, you have to select edges to fillet. You can select all
edges of the base plane through selecting a edge using Loop option. Get more details
from the CHAMFER command.
To chamfer a solid
1 Choose Modify > Chamfer.
2 Select the edge of the base surface to chamfer.
3 Do one of the following:
To select a different surface, type n and press Enter.
To use the current surface, press Enter.
4 Specify the distance on first entity.
5 Specify the distance on second entity.
6 Do one of the following:
CHAPTER 8
198
Specify the edges to chamfer.
To select all edges around the base surface, type l and press Enter.
Modify toolbar
Command line CHAMFER
8.6.2. Section and Slice
You can section or slice a three dimensional solid, region, or body.
Section
You can create a region using the intersection of solid objects and a plane with the
SECTION command. After selecting objects, the system creates a region on the current
layer and inserts them into the location of the section.
Methods to define a section:
Specifies three points to define a sectioning plane.
Align the sectioning plane with a circle, ellipse, arc, 2D spline or 2D polyline object.
Specifies a point lied on the sectioning plane and a point lied on the normal of the defined
section.
Align the sectioning plane with the plane of the current view.
Specifies a point to determine the location of the sectioning plane on the XY, YZ or ZX
plane, and aligns the sectioning plane with the XY, YZ, or ZX plane of the current UCS.
To section an object
1 Choose Draw > Solids > Section.
2 Select the objects to cross section.
3 Do one of the following:
Specify three points to define the cross section plane. (The first point defines the
origin,while the second point defines the x axis and the third point defines the y axis.)
Type o and press Enter to select an object that defines the cross sectional plane.
Specify an axis by typing Z and pressing Enter.
Solids toolbar
Command line SECTION
Slice
You can use SLICE command to slice a solid with a plane and retain the specify part or
the entire solid. The sliced solids retain the layer and color‘s properties of the original ones.
To slice a solid, you have to define a cutting plane, then select which part to retain.
Methods to define a cutting plane:
Specifies three points to define a cutting plane.
Align the cutting plane with a circle, ellipse, arc, 2D spline or 2D polyline object.
Specifies a point lied on the cutting plane and a point lied on the normal of the defined
section.
Align the cutting plane with the plane of the current view.
Specifies a point to determine the location of the cutting plane on the XY, YZ or ZX plane,
and aligns the cutting plane with the XY, YZ, or ZX plane of the current UCS.
To slice a solid
MODIFY OBJECTS
199
1 Choose Draw > Solids > Slice.
2 Select the objects to slice.
3 Do one of the following:
Specify three points to define the cross section plane. (The first point defines the
origin,while the second point defines the x axis and the third point defines the y axis.)
Type o and press Enter to select an object that defines the cross sectional plane.
Specify an axis by typing Z and pressing Enter.
4 Specify which side to retain, or type b to retain both sides.
Solids toolbar
Command line SLICE
8.6.3. Modify Faces of 3D Solids
You can modify faces of 3D solids through extruding, moving, rotating, offsetting, tapering,
delete, copying or changing the color of the selected faces.
Extrude Faces
You can extrude one or more faces of 3D solids at the specified height and path.
Negative value extrudes faces along to the positive normal; positive value extrudes faces
along to the negative normal. After specifying the height, the system prompts you to
specify the angle of taper for extrusion. If you specify the angular value is greater than 0,
the plane tapers in from the base object; if the value is negative, the face tapers out. By
default, the value is of 0, which extrudes the face perpendicular. The extrusion stops when
the tapered face shrinks into a point.
If you select Path option, the selected face extrudes at the specified line or curve objects.
The objects that can be specified as a extrusion path contains line, circle, arc, ellipse,
ellipse arc, polyline and spline. These objects should not be coplanar with the object, nor
should have areas of high curvature. Generally, one of endpoints of the selected extrusion
path should lie on the center of the face to extrude, if not, the system will do it.
To extrude a solid face
1 Choose Modify > Solids Editing > Extrude Faces.
2 Select the face(s) to extrude, and press Enter.
3 Do one of the following:
Specify the height of extrusion.
Type p and press Enter to select a path for extrusion.
4 If you specified a height, specify a taper angle.
Solids Editing toolbar
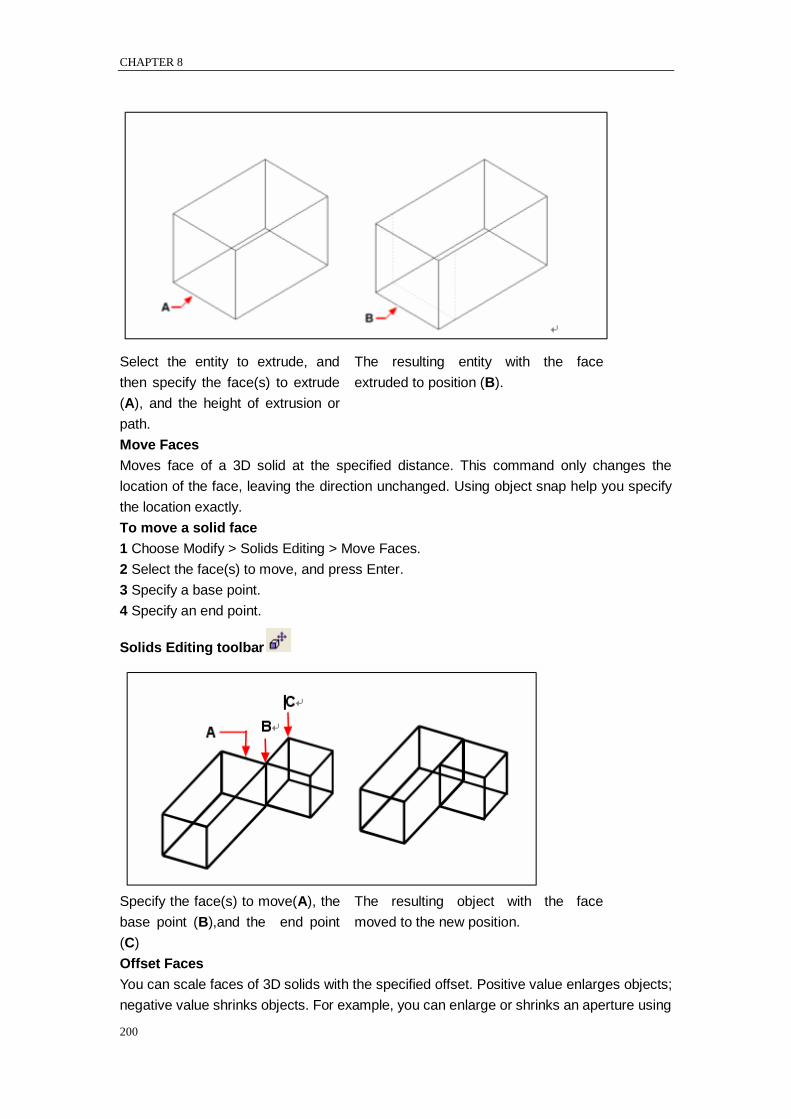
CHAPTER 8
200
Select the entity to extrude, and
then specify the face(s) to extrude
(A), and the height of extrusion or
path.
The resulting entity with the face
extruded to position (B).
Move Faces
Moves face of a 3D solid at the specified distance. This command only changes the
location of the face, leaving the direction unchanged. Using object snap help you specify
the location exactly.
To move a solid face
1 Choose Modify > Solids Editing > Move Faces.
2 Select the face(s) to move, and press Enter.
3 Specify a base point.
4 Specify an end point.
Solids Editing toolbar
Specify the face(s) to move(A), the
base point (B),and the end point
(C)
The resulting object with the face
moved to the new position.
Offset Faces
You can scale faces of 3D solids with the specified offset. Positive value enlarges objects;
negative value shrinks objects. For example, you can enlarge or shrinks an aperture using
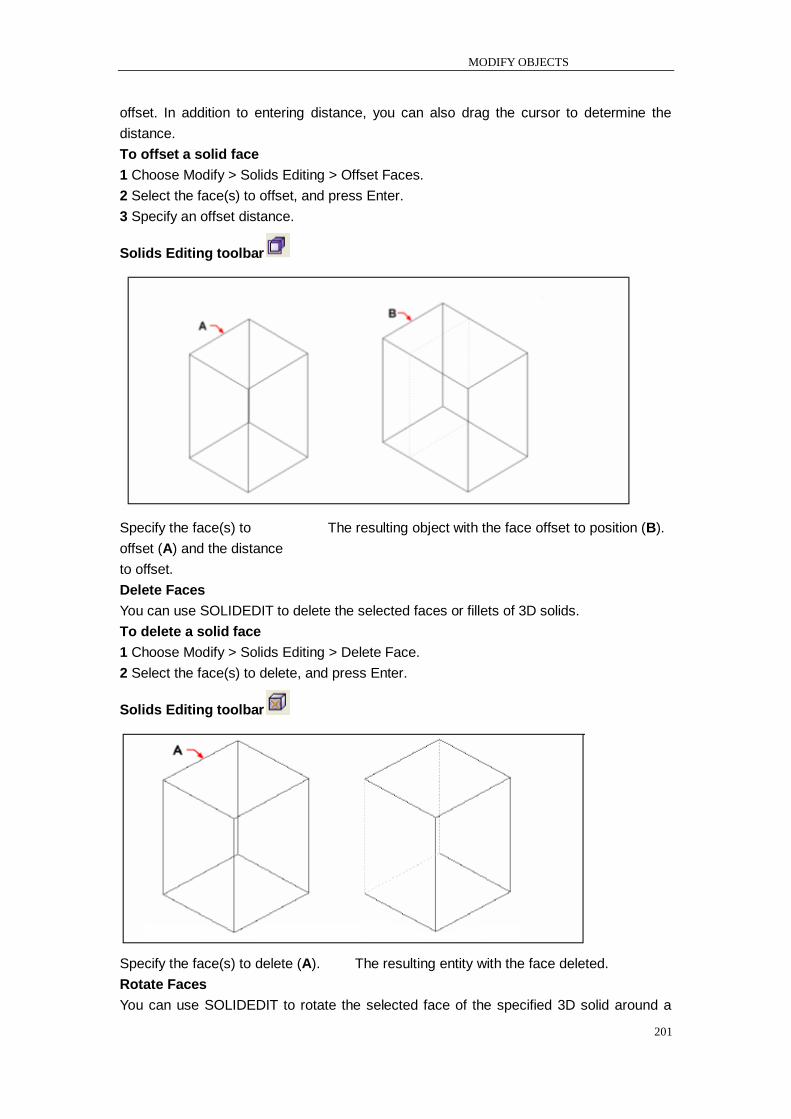
MODIFY OBJECTS
201
offset. In addition to entering distance, you can also drag the cursor to determine the
distance.
To offset a solid face
1 Choose Modify > Solids Editing > Offset Faces.
2 Select the face(s) to offset, and press Enter.
3 Specify an offset distance.
Solids Editing toolbar
Specify the face(s) to The resulting object with the face offset to position (B).
offset (A) and the distance
to offset.
Delete Faces
You can use SOLIDEDIT to delete the selected faces or fillets of 3D solids.
To delete a solid face
1 Choose Modify > Solids Editing > Delete Face.
2 Select the face(s) to delete, and press Enter.
Solids Editing toolbar
Specify the face(s) to delete (A). The resulting entity with the face deleted.
Rotate Faces
You can use SOLIDEDIT to rotate the selected face of the specified 3D solid around a
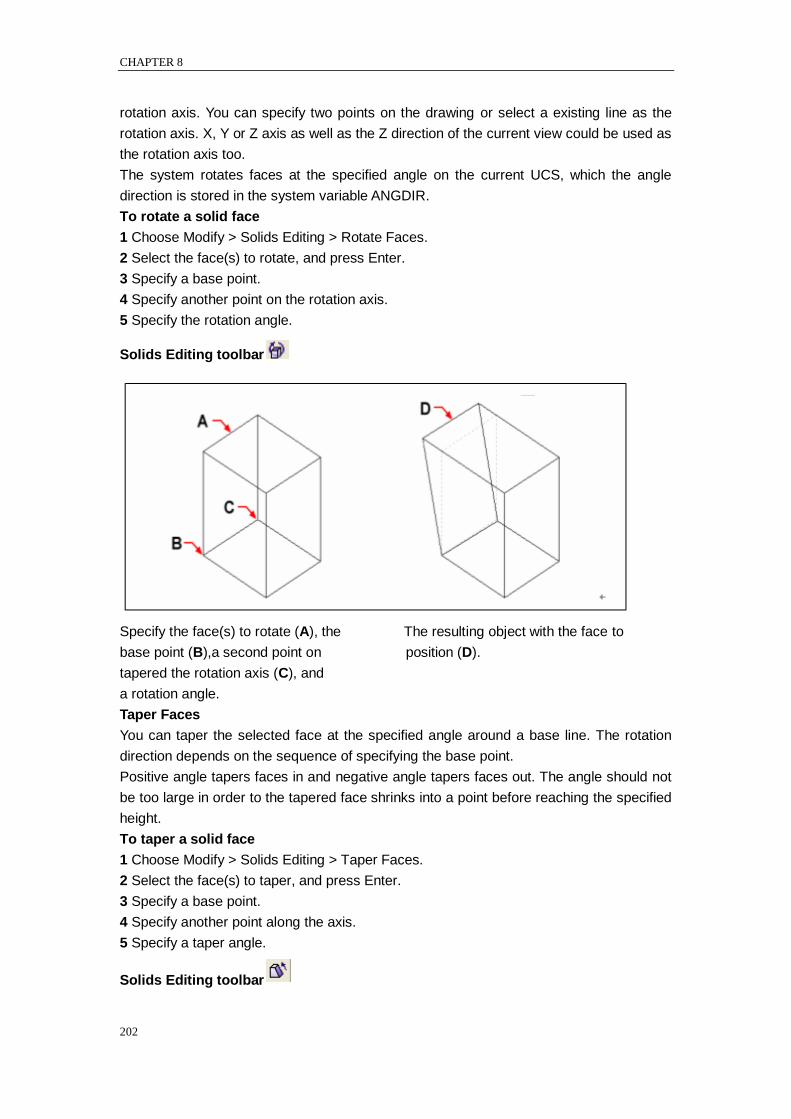
CHAPTER 8
202
rotation axis. You can specify two points on the drawing or select a existing line as the
rotation axis. X, Y or Z axis as well as the Z direction of the current view could be used as
the rotation axis too.
The system rotates faces at the specified angle on the current UCS, which the angle
direction is stored in the system variable ANGDIR.
To rotate a solid face
1 Choose Modify > Solids Editing > Rotate Faces.
2 Select the face(s) to rotate, and press Enter.
3 Specify a base point.
4 Specify another point on the rotation axis.
5 Specify the rotation angle.
Solids Editing toolbar
Specify the face(s) to rotate (A), the The resulting object with the face to
base point (B),a second point on position (D).
tapered the rotation axis (C), and
a rotation angle.
Taper Faces
You can taper the selected face at the specified angle around a base line. The rotation
direction depends on the sequence of specifying the base point.
Positive angle tapers faces in and negative angle tapers faces out. The angle should not
be too large in order to the tapered face shrinks into a point before reaching the specified
height.
To taper a solid face
1 Choose Modify > Solids Editing > Taper Faces.
2 Select the face(s) to taper, and press Enter.
3 Specify a base point.
4 Specify another point along the axis.
5 Specify a taper angle.
Solids Editing toolbar
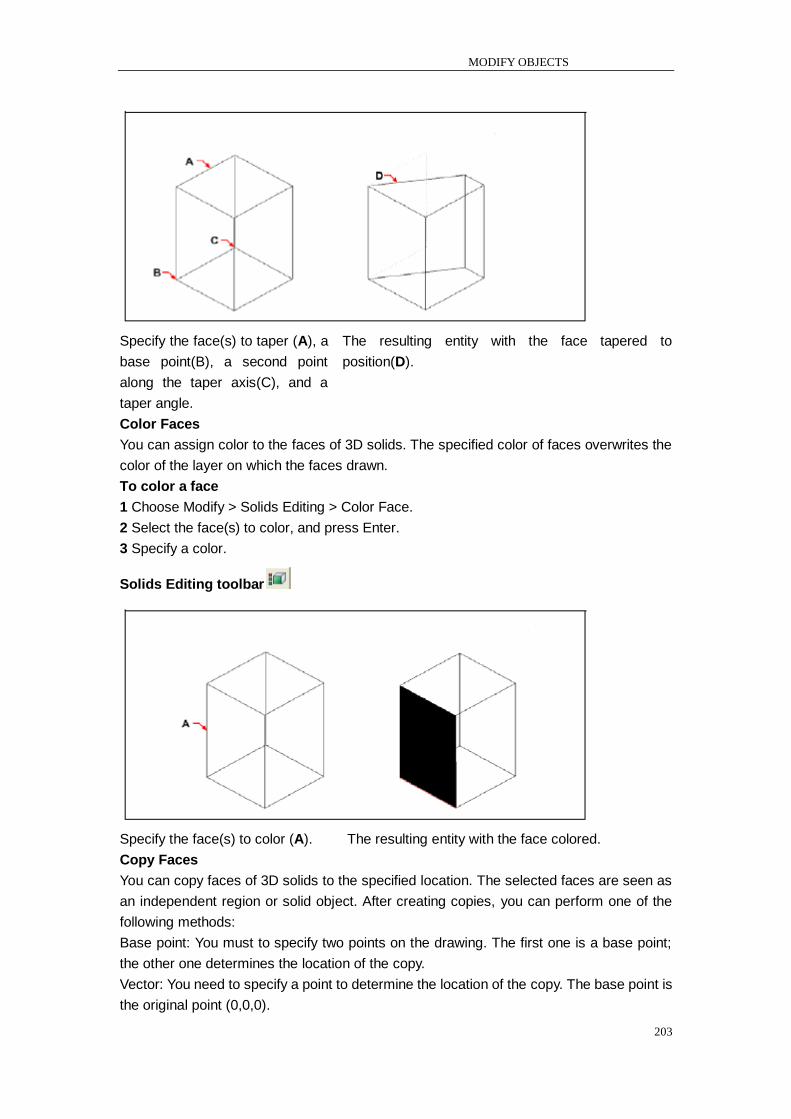
MODIFY OBJECTS
203
Specify the face(s) to taper (A), a
base point(B), a second point
along the taper axis(C), and a
taper angle.
The resulting entity with the face tapered to
position(D).
Color Faces
You can assign color to the faces of 3D solids. The specified color of faces overwrites the
color of the layer on which the faces drawn.
To color a face
1 Choose Modify > Solids Editing > Color Face.
2 Select the face(s) to color, and press Enter.
3 Specify a color.
Solids Editing toolbar
Specify the face(s) to color (A). The resulting entity with the face colored.
Copy Faces
You can copy faces of 3D solids to the specified location. The selected faces are seen as
an independent region or solid object. After creating copies, you can perform one of the
following methods:
Base point: You must to specify two points on the drawing. The first one is a base point;
the other one determines the location of the copy.
Vector: You need to specify a point to determine the location of the copy. The base point is
the original point (0,0,0).
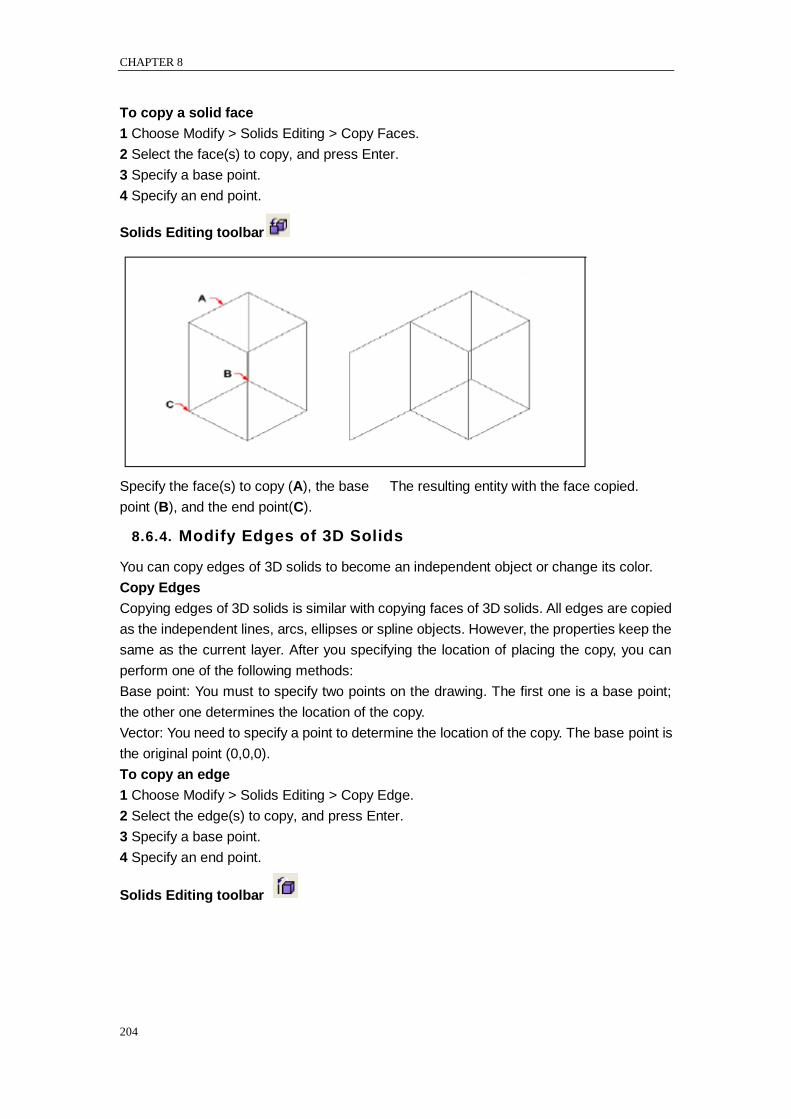
CHAPTER 8
204
To copy a solid face
1 Choose Modify > Solids Editing > Copy Faces.
2 Select the face(s) to copy, and press Enter.
3 Specify a base point.
4 Specify an end point.
Solids Editing toolbar
Specify the face(s) to copy (A), the base The resulting entity with the face copied.
point (B), and the end point(C).
8.6.4. Modify Edges of 3D Solids
You can copy edges of 3D solids to become an independent object or change its color.
Copy Edges
Copying edges of 3D solids is similar with copying faces of 3D solids. All edges are copied
as the independent lines, arcs, ellipses or spline objects. However, the properties keep the
same as the current layer. After you specifying the location of placing the copy, you can
perform one of the following methods:
Base point: You must to specify two points on the drawing. The first one is a base point;
the other one determines the location of the copy.
Vector: You need to specify a point to determine the location of the copy. The base point is
the original point (0,0,0).
To copy an edge
1 Choose Modify > Solids Editing > Copy Edge.
2 Select the edge(s) to copy, and press Enter.
3 Specify a base point.
4 Specify an end point.
Solids Editing toolbar
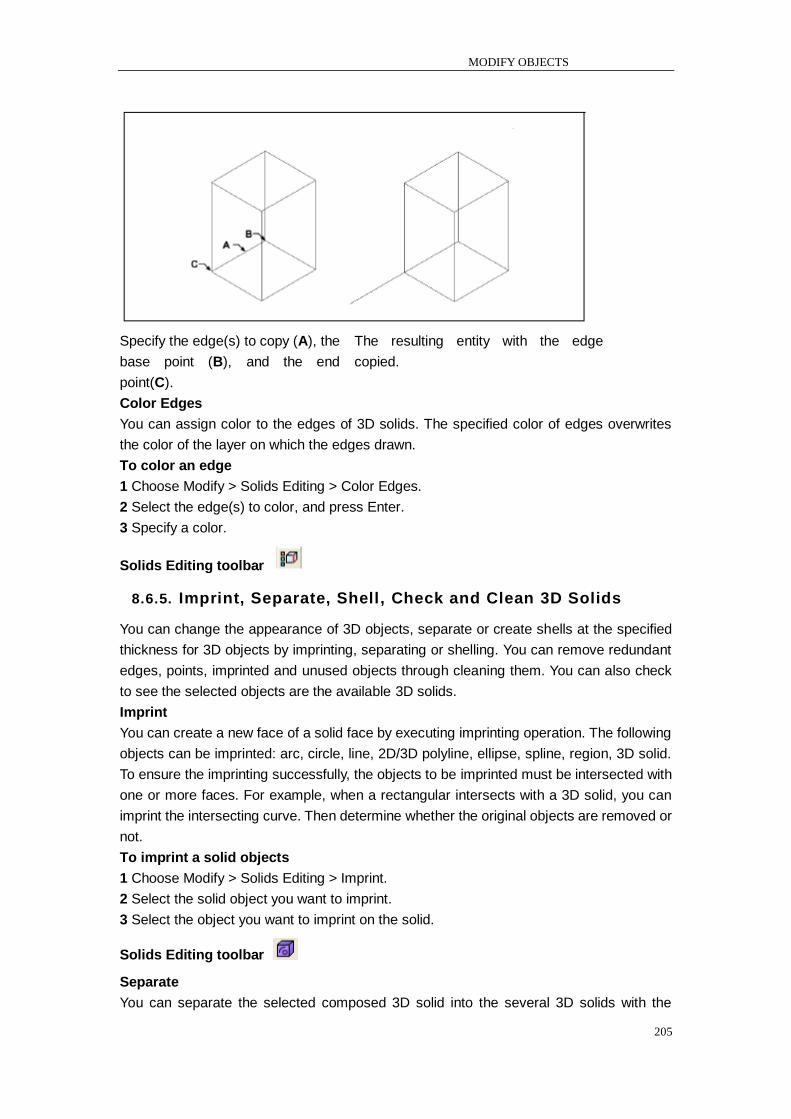
MODIFY OBJECTS
205
Specify the edge(s) to copy (A), the
base point (B), and the end
point(C).
The resulting entity with the edge
copied.
Color Edges
You can assign color to the edges of 3D solids. The specified color of edges overwrites
the color of the layer on which the edges drawn.
To color an edge
1 Choose Modify > Solids Editing > Color Edges.
2 Select the edge(s) to color, and press Enter.
3 Specify a color.
Solids Editing toolbar
8.6.5. Imprint, Separate, Shell, Check and Clean 3D Solids
You can change the appearance of 3D objects, separate or create shells at the specified
thickness for 3D objects by imprinting, separating or shelling. You can remove redundant
edges, points, imprinted and unused objects through cleaning them. You can also check
to see the selected objects are the available 3D solids.
Imprint
You can create a new face of a solid face by executing imprinting operation. The following
objects can be imprinted: arc, circle, line, 2D/3D polyline, ellipse, spline, region, 3D solid.
To ensure the imprinting successfully, the objects to be imprinted must be intersected with
one or more faces. For example, when a rectangular intersects with a 3D solid, you can
imprint the intersecting curve. Then determine whether the original objects are removed or
not.
To imprint a solid objects
1 Choose Modify > Solids Editing > Imprint.
2 Select the solid object you want to imprint.
3 Select the object you want to imprint on the solid.
Solids Editing toolbar
Separate
You can separate the selected composed 3D solid into the several 3D solids with the
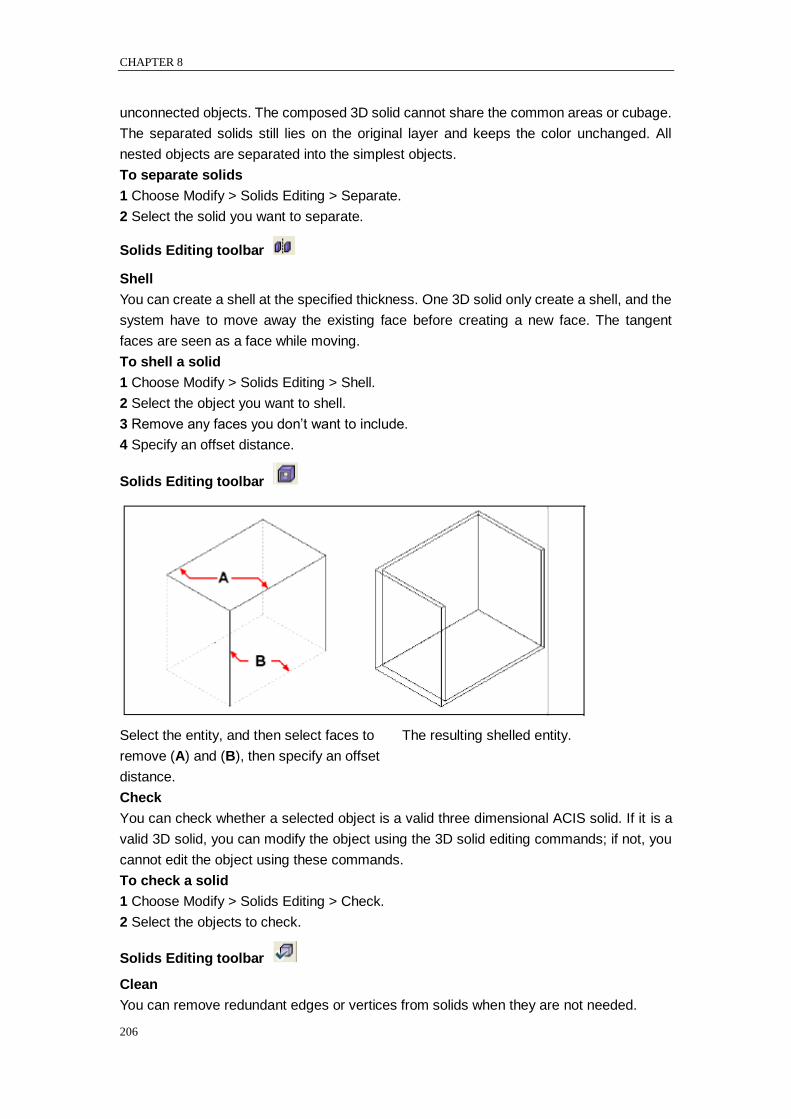
CHAPTER 8
206
unconnected objects. The composed 3D solid cannot share the common areas or cubage.
The separated solids still lies on the original layer and keeps the color unchanged. All
nested objects are separated into the simplest objects.
To separate solids
1 Choose Modify > Solids Editing > Separate.
2 Select the solid you want to separate.
Solids Editing toolbar
Shell
You can create a shell at the specified thickness. One 3D solid only create a shell, and the
system have to move away the existing face before creating a new face. The tangent
faces are seen as a face while moving.
To shell a solid
1 Choose Modify > Solids Editing > Shell.
2 Select the object you want to shell.
3 Remove any faces you don‘t want to include.
4 Specify an offset distance.
Solids Editing toolbar
Select the entity, and then select faces to The resulting shelled entity.
remove (A) and (B), then specify an offset
distance.
Check
You can check whether a selected object is a valid three dimensional ACIS solid. If it is a
valid 3D solid, you can modify the object using the 3D solid editing commands; if not, you
cannot edit the object using these commands.
To check a solid
1 Choose Modify > Solids Editing > Check.
2 Select the objects to check.
Solids Editing toolbar
Clean
You can remove redundant edges or vertices from solids when they are not needed.
MODIFY OBJECTS
207
To clean a solid
1 Choose Modify > Solids Editing > Clean.
2 Select the object you want to clean.
Solids Editing toolbar
8.7. Use Windows Cut, Copy, and Paste
You can use the Clipboard to cut or copy objects from one drawing to another. Cutting
removes the selected objects from a drawing and stores them on the Clipboard. Copying
duplicates the selected objects from a drawing and places them on the Clipboard.
Cut Objects
You can use Window commands such as Cut, Copy and Paste to move or copy objects.
With using Cut command, the objects on the clipboard can be pasted to a document or
drawing as a OLE object. See more from the PASTECLIP and PASTESPEC command.
The links is not available after executing Cut command.
To cut objects to the Clipboard
1 Select the objects you want to cut.
2 Choose Edit > Cut.
Standard toolbar
Command line CUTCLIP
Copy Objects
You can copy the objects on the clipboard into the document created by other application.
The copied objects can keep the height resolution as they are copied with the vector
format. These objects store on the clipboard with the WMF (Windows Metafile Format)
format. The copies keep unchanged at the other application even if the original drawing
has changed.
To copy objects to the Clipboard
1 Select the objects you want to copy.
2 Choose Edit > Copy.
Standard toolbar
Command line COPYCLIP
Anything that you can copy to the Clipboard can be pasted into a drawing. The format in
which the program adds the Clipboard contents to the drawing depends on the type of
information in the Clipboard. For example, if you copy ZWCAD drawing entities to the
Clipboard, the program pastes them into the drawing as ZWCAD entities. If you copy
items to the Clipboard from other programs, they are pasted into the current drawing as
embedded ActiveX objects.
Paste Objects
The system used all available formats to store information when you copy objects into the
clipboard. The format that stores the most information was used when pasting the objects
on the clipboard into the current drawing.
To paste objects from the Clipboard
CHAPTER 8
208
Choose Edit > Paste.
Standard toolbar
Command line PASTECLIP
To change format to paste, you can select the desired format from the Edit menu.
The WMF format contains the screen vector information, which can scale or plot the
pasted objects without decreasing resolution. It can be applied to the application that
supports WMF format.
The color of objects keeps unchanged when pasting. However, you can use the system
variable WMFBKGND and WMFFORGND to control whether the background or
foreground is transparent or not, where the pasted objects lie on.
When the objects to be pasted contain links or nest other objects, you can use
PASTESPEC command to insert them from the clipboard into the ZWCAD drawing. When
selecting ZWCAD Block, the objects are processed as a block. And you have to explore
them before editing. Converting WMF format into ZWCAD Drawing format may lead to the
scale factor changed. To avoid of this situation, you can convert the selected objects to a
block and then insert it into the ZWCAD drawing using INSERT.
8.8. Correct Mistakes
Various methods can be used to cancel errors until the latest correct operation if perform
error manipulations.
Undo a Single Action
You can reverse to the last operation by pressing Undo button on the Standard toolbar or
entering U on the command line. Some commands contain the Undo option, so you can
enter u to reverse to the last operation without exiting the command. For example, when
creating a line or polyline, you can enter u to undo the latest drawn line segment.
Undo Several Actions at Once
UNDO command help aborting multiple operations at a time.
When using UNDO command, system groups a number of operations assigned within
Begin set and End set so that you can cancel all the steps as a group object at a time. Use
Mark and Back to mark to enable users to cancel all the later operations since the marked
step. If you use Back to mark or Number of steps to undo option, the drawing will be
redrawn if necessary. This may happen to the end of UNDO command, and the frequency
of redrawing can be different based on the option you select, for example enter UNDO 3
to redraw once, while enter U command three times to redraw three times.
Reverse the Effect of Undo
You can use REDO to reverse the effects of previous UNDO or U command. This
command is equivalent with the REDO button on the standard toolbar.
Undo or Redo Actions Using Undo or Redo button
The Undo or Redo button on Standard toolbar are displayed in gray if there isn't any
operations to undo or redo, at this moment this function is unavailable.
The Undo button is available as soon as you have operated a certain commands, click left
part of this button to undo last manipulation performed previously. There is a pull-down list
beside the undo button, click here to pop-up a list in which all of the possible operations
MODIFY OBJECTS
209
are displayed, containing up to 6 commands within one list page, if more than 6 operations
have been manipulated, you can drag the scroll bar on the right side of the list page to
browse the commands.
The Redo button is available once you have manipulated undo. Like performing Undo
operation, click the Redo button to perform the last Undo operation, while click the
pull-down arrow to pop-up a list in which all of the manipulations available to perform
Redo are displayed.
Move the mouse to select manipulations from the pull-down list of Undo and Redo button,
highlight the items on which the mouse stays to illustrate how many items are selected
among the manipulations from the top of the list page, and display a message at the
bottom of the list to explain the number of items being selected. And then click the mouse
or press ENTER directly to perform Undo or Redo command. Move the mouse to the top
or button of the pull-down list box to enable it scrolling by itself, additionally you can press
the direction key to select commands upwards or downwards.
Once you select BEgin set option when performing UNDO command, the manipulations
displayed in the pull-down list beside the Undo button will be unavailable, at this time you
can only undo the subsequent manipulations unless you perform the UNDO command
again and select the End set option.
Erase Objects
You can also use OOPS command to restore the deleted objects except for the objects
deleted by PRUGE command. You can use OOPS to remove the selected block objects
after performing BLOCK or WBLOCK.
Cancel a Command
You can click ESC to exit during performing command.
CHAPTER 9
210
9. Notes and Labels
9.1. Create Text
9.1.1. Single-Line Text
You can use TEXT command to create a single or multiline text. Each line text is an
independent object which can be modified.
Before typing text, you can specify the text style and the way to align at the prompt of
creating text. The text style is applied to both of a single and multiline text objects. The
justification way determined which part of text justify with an insert point.
Characters created by MTEXT can be applied with independent text styles, but single line
text cannot do that.
Press ENTER if you have typed some characters, and then the command line prompts to
input characters for the next row of text. While creating single line text, you are also
enabled to extend or compress certain single line text object in specified space to meet
with your need by means of selecting Align or Fit option from the TEXT command line
prompt.
To create text
1 Choose Draw> Text > Single Line Text.
2 Specify the start point for the text.
3 Specify the height of the text.
4 Specify the text rotation angle.
5 Type the text, and then press Enter at the end of each new line.
6 To complete the command, press Enter again.
Text toolbar
Command line TEXT
TIP If you‘ve already created text and want new text to appear immediately below the
previous text, Choose Draw> Text > Single Line Text. When prompted for start point,
press Enter. The new text will keep the same height and rotation angle as the previous
text.
Align Single-Line Text
When you create text, you can set the text alignment before you specify the start point.
You set the alignment by choosing Justify in the command line prompt. By default, text is
left justified.
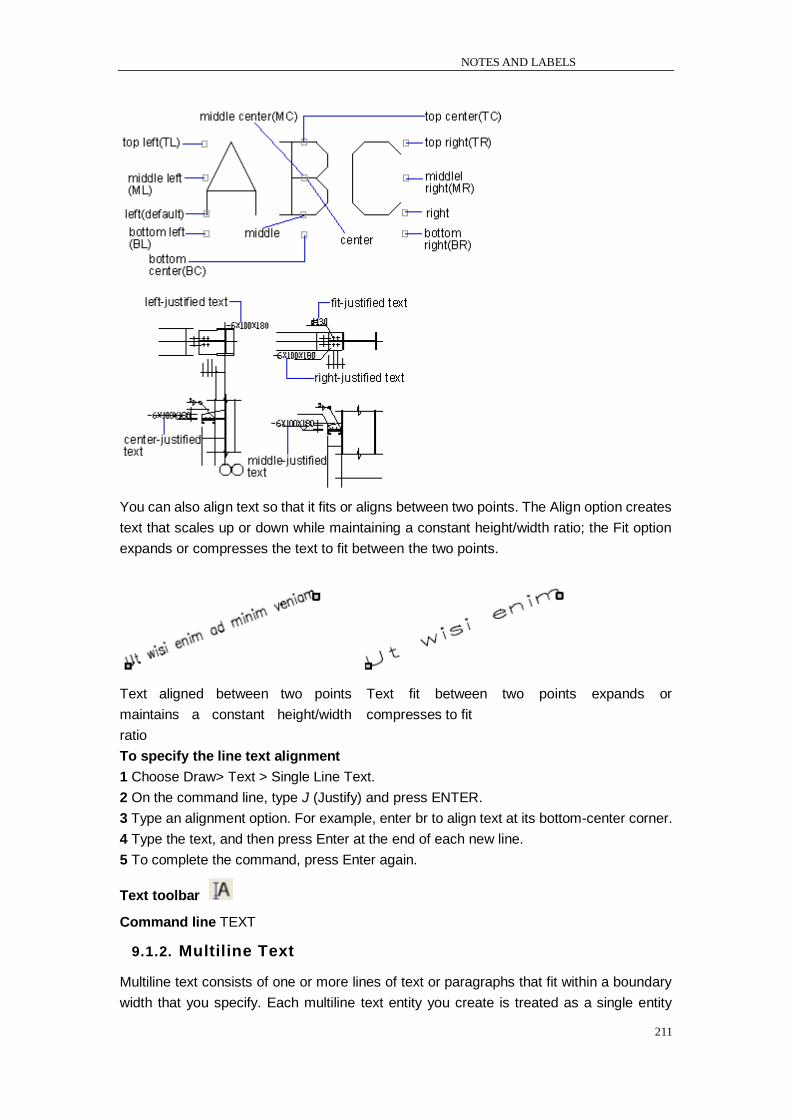
NOTES AND LABELS
211
You can also align text so that it fits or aligns between two points. The Align option creates
text that scales up or down while maintaining a constant height/width ratio; the Fit option
expands or compresses the text to fit between the two points.
Text aligned between two points
maintains a constant height/width
ratio
Text fit between two points expands or
compresses to fit
To specify the line text alignment
1 Choose Draw> Text > Single Line Text.
2 On the command line, type J (Justify) and press ENTER.
3 Type an alignment option. For example, enter br to align text at its bottom-center corner.
4 Type the text, and then press Enter at the end of each new line.
5 To complete the command, press Enter again.
Text toolbar
Command line TEXT
9.1.2. Multiline Text
Multiline text consists of one or more lines of text or paragraphs that fit within a boundary
width that you specify. Each multiline text entity you create is treated as a single entity
CHAPTER 9
212
regardless of the number of individual paragraphs or lines of text it contains.
When you create multiline text, you first determine the paragraph‘s boundary width by
specifying the opposite corners of a rectangle. The multiline text automatically wraps so
that it fits within this rectangle. The first corner of the rectangle determines the default
attachment point of the multiline text. You can change the location of the attachment point
in reference to the rectangle, and you can determine the direction in which text flows
within the rectangle.
After defining the text frame, the system opens the ―multiline text editor‖ which is
comprised of a text frame and the Text Formating toolbar. You can type text in the text
frame and change the style from the Text Formating toolbar.
The text style can control the style of characters, such as default fronts, line spacing,
aligned way and color. STANDARD is the default text style.
You can change the value of text objects in the Properties panel that includes the Justify,
Direction and so on.
You can also assign the underline, color or other fonts to the current text to overlap the
default style. Stacked characters (such as fractions and tolerance), special characters and
Unicode characters used for TrueType fonts can be create in the text frame. At the same
time, you can also control the appearance of text object and create a list by specifying the
tap and characters to retract.
To create multiline text
1 Choose Draw> Text > Multiline Line Text.
2 Select the first corner of the text area.
3 Select the second corner of the text area.
4 In the Multiline Text window, type the text you want.
To create paragraphs, press Enter and continue typing.
5 On the toolbar, make format changes as follows:
To change the font of the selected text, select a font from the list.
To change the height of the selected text, enter a new value in the Height box.
To format text in a TrueType font with boldface or italics, or to create underlined text for
any font, click the corresponding button on the toolbar. SHX fonts do not support boldface
or italics.
To apply color to selected text, choose a color from the Color list. Click Other colors to
display the Select Color dialog box.
6 To save your changes and exit the Multiline Text Editor, use one of the following
methods:
Click OK on the toolbar.
Press Ctrl + Enter.
Text toolbar
Command line MTEXT
TIP You can paste text from the Clipboard into the Multiline Text Editor.
Justify Multiline Text
When you create multiline text, you can set the text alignment by specifying the
attachment point location in relation to the multiline text boundary and the direction in
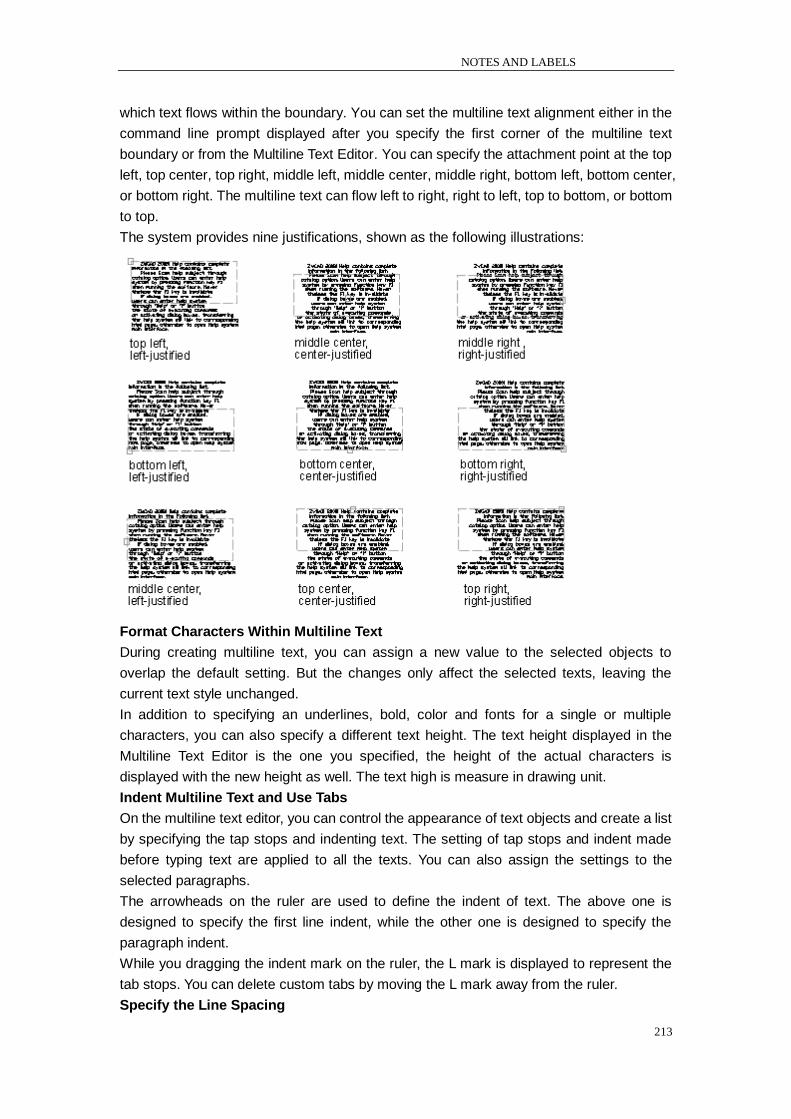
NOTES AND LABELS
213
which text flows within the boundary. You can set the multiline text alignment either in the
command line prompt displayed after you specify the first corner of the multiline text
boundary or from the Multiline Text Editor. You can specify the attachment point at the top
left, top center, top right, middle left, middle center, middle right, bottom left, bottom center,
or bottom right. The multiline text can flow left to right, right to left, top to bottom, or bottom
to top.
The system provides nine justifications, shown as the following illustrations:
Format Characters Within Multiline Text
During creating multiline text, you can assign a new value to the selected objects to
overlap the default setting. But the changes only affect the selected texts, leaving the
current text style unchanged.
In addition to specifying an underlines, bold, color and fonts for a single or multiple
characters, you can also specify a different text height. The text height displayed in the
Multiline Text Editor is the one you specified, the height of the actual characters is
displayed with the new height as well. The text high is measure in drawing unit.
Indent Multiline Text and Use Tabs
On the multiline text editor, you can control the appearance of text objects and create a list
by specifying the tap stops and indenting text. The setting of tap stops and indent made
before typing text are applied to all the texts. You can also assign the settings to the
selected paragraphs.
The arrowheads on the ruler are used to define the indent of text. The above one is
designed to specify the first line indent, while the other one is designed to specify the
paragraph indent.
While you dragging the indent mark on the ruler, the L mark is displayed to represent the
tab stops. You can delete custom tabs by moving the L mark away from the ruler.
Specify the Line Spacing
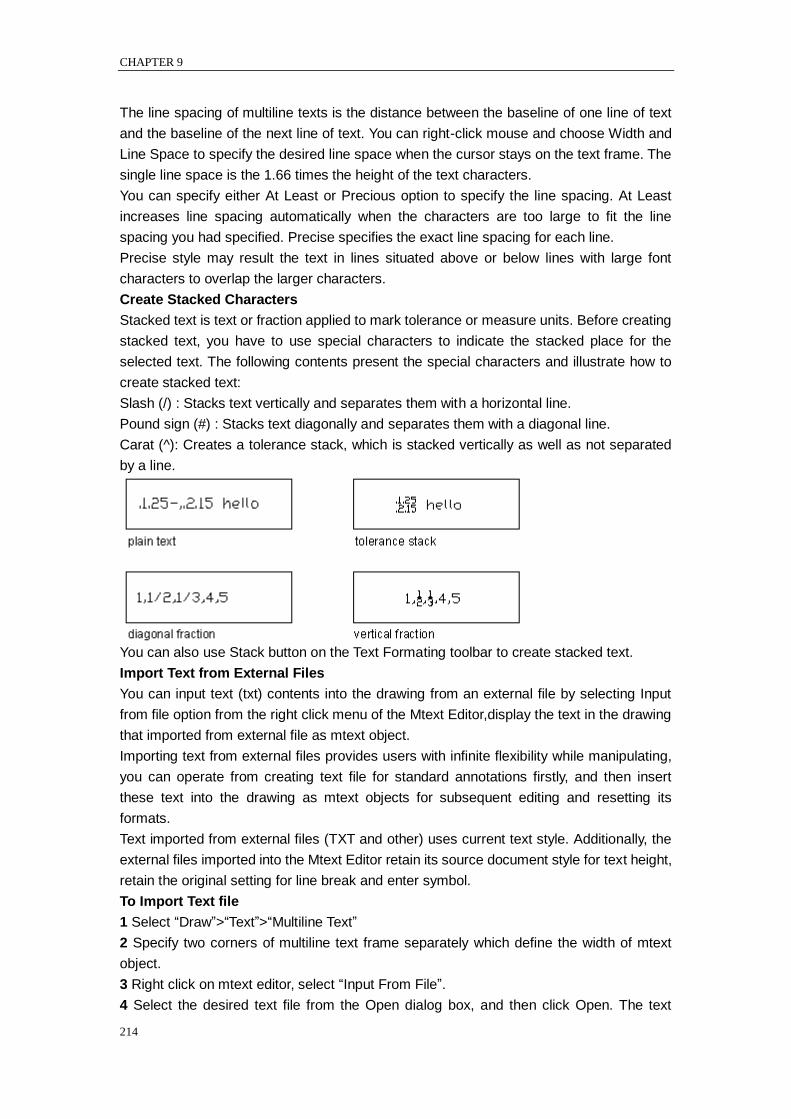
CHAPTER 9
214
The line spacing of multiline texts is the distance between the baseline of one line of text
and the baseline of the next line of text. You can right-click mouse and choose Width and
Line Space to specify the desired line space when the cursor stays on the text frame. The
single line space is the 1.66 times the height of the text characters.
You can specify either At Least or Precious option to specify the line spacing. At Least
increases line spacing automatically when the characters are too large to fit the line
spacing you had specified. Precise specifies the exact line spacing for each line.
Precise style may result the text in lines situated above or below lines with large font
characters to overlap the larger characters.
Create Stacked Characters
Stacked text is text or fraction applied to mark tolerance or measure units. Before creating
stacked text, you have to use special characters to indicate the stacked place for the
selected text. The following contents present the special characters and illustrate how to
create stacked text:
Slash (/) : Stacks text vertically and separates them with a horizontal line.
Pound sign (#) : Stacks text diagonally and separates them with a diagonal line.
Carat (^): Creates a tolerance stack, which is stacked vertically as well as not separated
by a line.
You can also use Stack button on the Text Formating toolbar to create stacked text.
Import Text from External Files
You can input text (txt) contents into the drawing from an external file by selecting Input
from file option from the right click menu of the Mtext Editor,display the text in the drawing
that imported from external file as mtext object.
Importing text from external files provides users with infinite flexibility while manipulating,
you can operate from creating text file for standard annotations firstly, and then insert
these text into the drawing as mtext objects for subsequent editing and resetting its
formats.
Text imported from external files (TXT and other) uses current text style. Additionally, the
external files imported into the Mtext Editor retain its source document style for text height,
retain the original setting for line break and enter symbol.
To Import Text file
1 Select ―Draw‖>―Text‖>―Multiline Text‖
2 Specify two corners of multiline text frame separately which define the width of mtext
object.
3 Right click on mtext editor, select ―Input From File‖.
4 Select the desired text file from the Open dialog box, and then click Open. The text
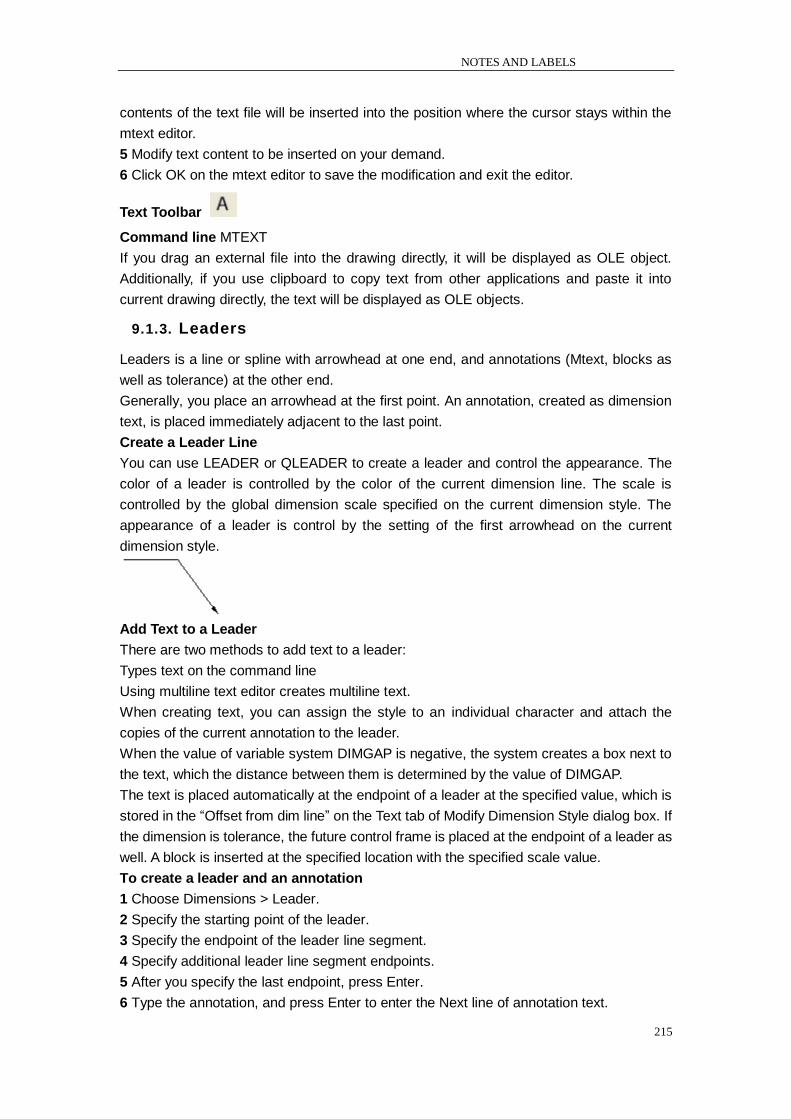
NOTES AND LABELS
215
contents of the text file will be inserted into the position where the cursor stays within the
mtext editor.
5 Modify text content to be inserted on your demand.
6 Click OK on the mtext editor to save the modification and exit the editor.
Text Toolbar
Command line MTEXT
If you drag an external file into the drawing directly, it will be displayed as OLE object.
Additionally, if you use clipboard to copy text from other applications and paste it into
current drawing directly, the text will be displayed as OLE objects.
9.1.3. Leaders
Leaders is a line or spline with arrowhead at one end, and annotations (Mtext, blocks as
well as tolerance) at the other end.
Generally, you place an arrowhead at the first point. An annotation, created as dimension
text, is placed immediately adjacent to the last point.
Create a Leader Line
You can use LEADER or QLEADER to create a leader and control the appearance. The
color of a leader is controlled by the color of the current dimension line. The scale is
controlled by the global dimension scale specified on the current dimension style. The
appearance of a leader is control by the setting of the first arrowhead on the current
dimension style.
Add Text to a Leader
There are two methods to add text to a leader:
Types text on the command line
Using multiline text editor creates multiline text.
When creating text, you can assign the style to an individual character and attach the
copies of the current annotation to the leader.
When the value of variable system DIMGAP is negative, the system creates a box next to
the text, which the distance between them is determined by the value of DIMGAP.
The text is placed automatically at the endpoint of a leader at the specified value, which is
stored in the ―Offset from dim line‖ on the Text tab of Modify Dimension Style dialog box. If
the dimension is tolerance, the future control frame is placed at the endpoint of a leader as
well. A block is inserted at the specified location with the specified scale value.
To create a leader and an annotation
1 Choose Dimensions > Leader.
2 Specify the starting point of the leader.
3 Specify the endpoint of the leader line segment.
4 Specify additional leader line segment endpoints.
5 After you specify the last endpoint, press Enter.
6 Type the annotation, and press Enter to enter the Next line of annotation text.
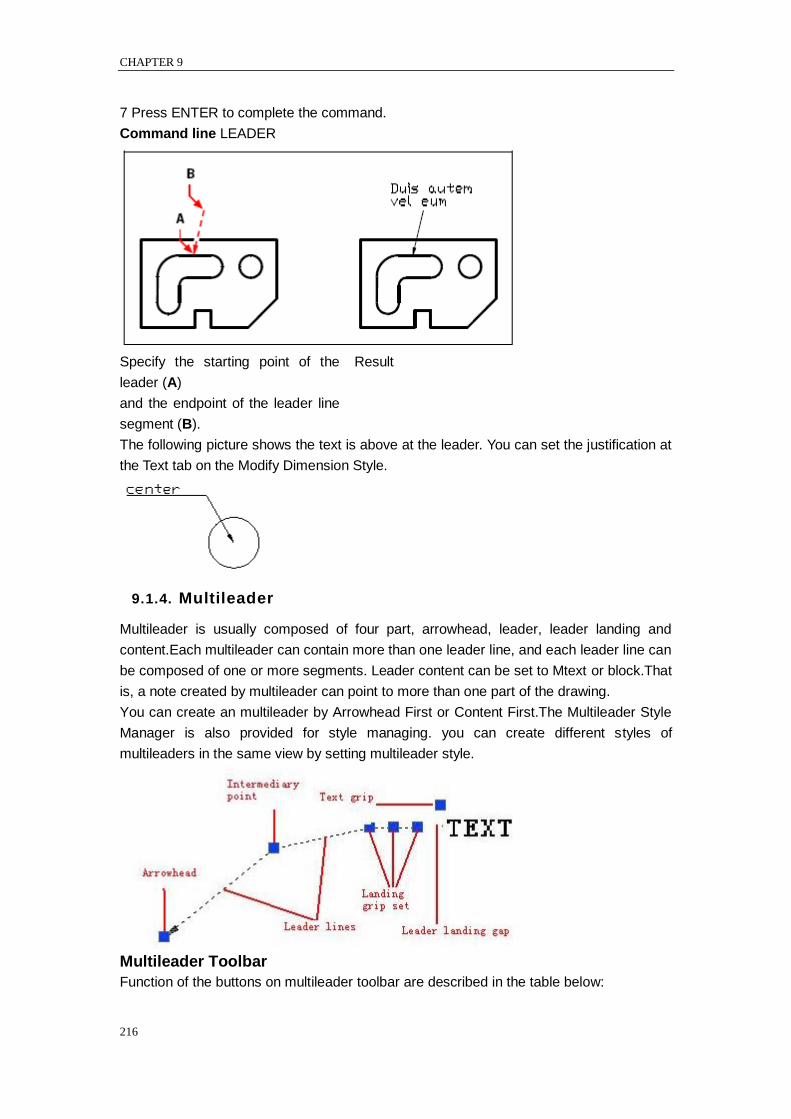
CHAPTER 9
216
7 Press ENTER to complete the command.
Command line LEADER
Specify the starting point of the
leader (A)
and the endpoint of the leader line
segment (B).
Result
The following picture shows the text is above at the leader. You can set the justification at
the Text tab on the Modify Dimension Style.
9.1.4. Multileader
Multileader is usually composed of four part, arrowhead, leader, leader landing and
content.Each multileader can contain more than one leader line, and each leader line can
be composed of one or more segments. Leader content can be set to Mtext or block.That
is, a note created by multileader can point to more than one part of the drawing.
You can create an multileader by Arrowhead First or Content First.The Multileader Style
Manager is also provided for style managing. you can create different styles of
multileaders in the same view by setting multileader style.
Multileader Toolbar
Function of the buttons on multileader toolbar are described in the table below:
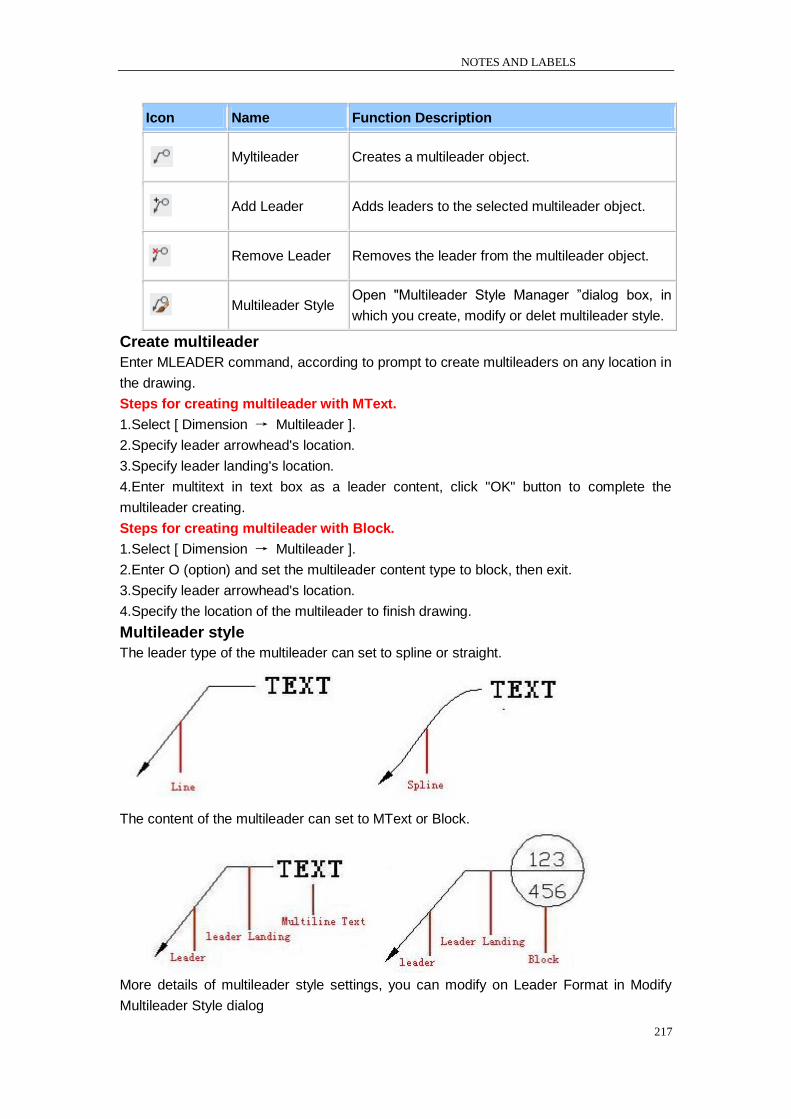
NOTES AND LABELS
217
Icon Name Function Description
Myltileader Creates a multileader object.
Add Leader Adds leaders to the selected multileader object.
Remove Leader Removes the leader from the multileader object.
Multileader Style Open "Multileader Style Manager ‖dialog box, in
which you create, modify or delet multileader style.
Create multileader
Enter MLEADER command, according to prompt to create multileaders on any location in
the drawing.
Steps for creating multileader with MText.
1.Select [ Dimension → Multileader ].
2.Specify leader arrowhead's location.
3.Specify leader landing's location.
4.Enter multitext in text box as a leader content, click "OK" button to complete the
multileader creating.
Steps for creating multileader with Block.
1.Select [ Dimension → Multileader ].
2.Enter O (option) and set the multileader content type to block, then exit.
3.Specify leader arrowhead's location.
4.Specify the location of the multileader to finish drawing.
Multileader style
The leader type of the multileader can set to spline or straight.
The content of the multileader can set to MText or Block.
More details of multileader style settings, you can modify on Leader Format in Modify
Multileader Style dialog

CHAPTER 9
218
Multileader toolbar:
Command line: MLEADER
9.2. Change Text
All of text objects can be moved, rotated, deleted and copied, just as like other objects.
You can change the properties at the Properties panel.
You can also modify the contents of existing text and create a mirror image. The system
variable MIRRTEXT controls whether the text is reversed or not when you mirror object.
Change single-line text
You have two methods to modify single-line text.
To modify only the content of text, use DDEDIT command.
To change text style, location, size and content, use PROPERTIES command to open
Properties panel, from which, you can make the relevant settings.
To edit text
1 Type ddedit and then press Enter.
2 Select the text entity.
3 In the Text Editor field, edit the text, and then click OK.
Text toolbar
Command line DDEDIT
To change text properties
1 Select a single line text object.
2 Right-click the selected object and click Properties on the shortcut menu.
3 In the Properties palette, enter any new text in the Text Contents, and then change
formatting and other properties as needed.
Standard toolbar
Command line PROPERTIES
You can also move, scale or rotate text through grips as like other objects. The grip of a
single-line text is displayed at the lower-left corner of the baseline and the alignment point.
As shown in the following picture:
Different grips generate different effect even though with the same command.
Change Multiline Text
You can change the properties of multiline text at the Properties panel.
To edit multiline text
1 Type ddedit and then press Enter.

NOTES AND LABELS
219
2 Select the multiline text.
3 Edit the text in the Multiline Text Editor.
4 Click OK.
Text toolbar
Command line DDEDIT
To change multiline text properties
1 Select a multiline text object.
2 Right click the selected object and click Properties on the shortcut menu.
3 In the Properties palette, enter any new text and change formatting and other settings
as needed.
Standard toolbar
Command line PROPERTIES
Double-clicking mouse opens multiline text editor, from which, you can modify the content
and format of text.
Change Text Location
You can move or change the line width through grips as well.
Generally, the location of grips is displayed at the four grips of the text, in some cases, at
the justification point.
You can also replace the text by entering the coordinate at the Properties panel.
Find and Replace Text
Within the multiline text editor, right-clicking mouse and selects Find and Replace to
replace the selected characters. The content of text is replaced, but the properties of the
text remains.
Change Text with a Leader
You can change the size of a leader by stretching or scaling it. Stretch changes the
distance between the endpoint and the annotation. Scale only updates the scale of the
selected objects. For example, when scaling a leader, the location of the annotation keeps
unchanged. A leader can be used as the boundary for trimming or extending, but not be
trimmed or extended.
9.3. Work with Text Styles
The text style is applied to the text objects. You can use text style to control the text font,
size, angle, direction and other features. By default, the current text style is STANDARD,
you have to make other text style current when you want to applied them.
The STANDARD text style has the following default properties:
Setting Default Description
Style name STANDARD Name with up to 255 characters
Font name txt.shx File associated with a font (character style)
Big Font None Special shape definition file used for a non-ASCII character
set, such as Kanji
Height 0 Character height
CHAPTER 9
220
Width factor 1 Expansion or compression of the characters
Obliquing
angle
0 Slant of the characters
Backwards No Backwards text
Upside down No Upside-down text
Vertical No Vertical or horizontal text
You can modify the current text style or create a new text style directly. You can also
delete the created text style but not the default STANDARD text style.
Creat new text styles
When you apply some settings that the STANDARD does not have to the text, you have to
create a new text style or change the current text style.
Before creating a text style, you have to specify a name which can be up to 255
characters. The name can contain characters, underscore, hyphen, dollar sign and other
special characters that are not used by Microsoft Windows or ZWCAD.
You can also modify the current text style at the Text Style dialog box.
Some style settings have different effects on single-line and multiline text objects. For
example, the Upside Down and Backwards options are not available for multiline text
objects.
You can also rename an existing text style except for the STANDARD.
Except for the STANDARD text style, all text styles can be removed using PRUGE
command or deleted from the Text Style dialog box.
Certain formatting applied to individual characters within multiline text may not be retained.
The formatting not to be retained includes bold, font, height and obliquing. The formatting
that can be retained includes color, stack and underscore.
To create a text style
1 Choose Format > Text Styles.
2 Click New, type a new text style name, then click OK.
3 Under Text Measurements, specify the Text Height, Width Factor, and Oblique Angle.
4 Under Text Font, select the name, style, language, and Bigfont of the font you want to
use.
5 Under Text Generation, select the check boxes you want to indicate the direction for
printed text to appear.
6 Click Apply,and then click OK.
Text toolbar
Command line STYLE
Assign Text Fonts
Each character set is consisted of text characters, which shape is defined by fonts. In
addition to TureYype font, you can use compiled SHX font in ZWCAD. One font can be
used for multiple text styles as long as you make other settings different. The following
illustration shows the same font used by different text styles that use different settings.

NOTES AND LABELS
221
You can specify the desired font from the Text Font field to the current or a new created
text font at the Text Style dialog box.
Use TrueType Fonts
TrueType fonts always appear filled in the drawing. By default, the system plot the filled-in
fonts, which is controlled by the system variable TEXTFILL.
Use Unicode and Big Fonts
ZWCAD supports the Unicode character-encoding standard. A Unicode font contains
65,535 characters and shapes for many languages. You can enter characters that are not
available from the keyboard through escape sequence. The escape sequence is of
\U+nnnn, where nnnn represents the Unicode hexadecimal value for the character. All of
SHX shape fonts are Unicode fonts.
ZWCAD also supports the big font in order to accommodate alphabet text files consisted
of thousands of ASCII characters.
When you use –SYTLE command to specify fonts, you can specify two fonts separated by
a comma. The first one is common font and the second is big font. The specification
shown as follows: ( specify font and big font on the command line)
Enter this ... To specify this ...
[font name],[big font name] Both normal fonts and Big Fonts
[font name], Only a normal font (Big Font unchanged)
,[big font name] Only a Big Font (normal font unchanged)
[font name] Only a normal font (Big Font, if any, removed)
ENTER (null response) No change
You should not enter a long file name consisted of commas. The comma is interpreted as
a separator.
Replace Font
If the font to be contained in the drawing can‘t be obtained from current system, ZWCAD
process it by replacing these fonts with another specified one.
Specify fonts to replace
If the font to be contained in the drawing can‘t be found in current system, ZWCAD
replaces these fonts with another specified font automatically. Otherwise, system uses
―simplex.shx‖ font to override those unknown fonts instead. To modify the replace fonts by
system default, you can modify the system variable FONTALT which is applied for
specifying new font file name. However the FONTALT value will be mapped to another
font if big font is used currently. Default font file for this system variable is
―txt.shx‖and‖bigfont.shx‖.
Edit Font Mapping File
Font mapping file is the list file for fonts and their corresponding replace fonts. If the
specified fonts can‘t be found in current system, you can obtain from a font mapping file to
CHAPTER 9
222
replace them with specified fonts.
Sometimes, to ensure partial specific fonts or enable fonts conversion in current drawing,
you can create font mapping file with any text editor.
With these font mapping files, you can stipulate and manage fonts uniformly or use them
directly when off-line printing. If encountering font objects created by other fonts, you can
specify replace fonts to apply in platform through font mapping. It‘s also available for users
to set a font mapping file to convert each font to corresponding font, for example, when
editing drawings, the SHX which is easy drawing can be used for replacing other fonts in
the drawing, and subsequently switched to more complex fonts when printing.
Font mapping file is a type of common ASCII text file with an extension name as .fmp,
containing text file name without extensions or path in each line, the font file name with
extension .ttf behind the font file is replace font, the two file names are separated by a
semicolon. System uses zwcad.fmp (used for ZWCAD only) as default font mapping file.
Any ASCII text editor is available for changing text for replacing specified fonts from the
font mapping file.
For example, you can input the following contents in font mapping file, to replace
timesnr.pfb font file with times.ttf font file : timesnr;times.ttf
If you can‘t find specified font file when opening a drawing, system determines how to find
the replace font specific to the font type (single text, Mtext).
If the text is single text, system processes it with the following procedures:
1. Search for replace font file in ZWCAD.fmp file.
2. Iterate font style table, search for the font file in the same format.
3. Use default font ZWCAD.fnt.
4. Pop-up font file dialog box, in which user can specify replace font file, otherwise uses
ZWCAD.fnt as default font.
5. If big fonts are being used, search for corresponding font files in font mapping table
(zwcad.alt).
6. Search for corresponding codepage in font mapping table (zwcad.ini), and then
search for replace font file in font mapping table through this codepage.
7. If the corresponding text can‘t be found no matter which font is applied, use the
mapping font file found in zwcad.ini, if still unfound, use zwcad.fnt.
If text object is mtext, system handles it by subsection through language set so as to judge
whether the font file corresponding to this font file is capable of displaying this text object.
If the font file corresponding to this text object isn‘t existed in current system, the text style
corresponding to this text will be used for displaying this text. Even if the text style
corresponding to this text can‘t be found, Chinese system will take Song typeface as
default, while other language systems take current font style as default. If the
corresponding font file exists but not display, system reads the specified font in system
configured file (zwcad.alt). If the replacing font is corrupted or useless in some cases, the
fonts will not be replaced.
Set Text Height
Text height is the size of characters, which is measured in drawing unit. With the same
height setting, the displaying height of TrueType font is usually lower than the one of SHX
font. When the font is not of TrueType font, the value represents the size of the uppercase

NOTES AND LABELS
223
letters.
When the text height is set to 0 in the text style, the system prompts you to type a height
value while creating single-line text each time. So you can set text height to 0 in the text
style in order to specify a new height before creating text.
For TrueType fonts, the value of text height represents the height of a capital letter plus an
ascent area. The ascent is reserved for accent marks and other marks used in
non-English languages. The relative portion of text height assigned to capital letters and
ascent characters is determined by the font designer at the time the font is designed;
consequently, it varies from font to font.
When you apply a text height to all text in the Multiline Text Editor, the whole multiline text
object is scaled, including its width.
Set Text Obliquing Angle
The obliquing angle determines that the text slant forward or backward. The obliquing
angle ranges from the -85 to 85. Positive value slants forward; negative value slants
backward. As shown the following picture:
Set Horizontal or Vertical Text Orientation
The text directions include horizon and vertical. Only if the associated font supports dual
orientation, you can create the vertical text. Each sequent text line is drawn to the right of
the preceding line. Generally, the rotation angle for vertical text is 270 degrees. You
cannot create vertical text when the font is TureYype.
To specify a line text style
1 Choose Draw> Text > Single Line Text.
2 On the command line, type s (Style) and press ENTER.
3 Type the name of a previously defined text style, and then press Enter.
To display a list of available text styles, type a question mark (?), and then press Enter.
CHAPTER 9
224
4 Specify the text insertion point.
5 Specify the text height.
6 Specify the rotation angle.
7 Type the text line, and then press Enter.
8 To complete the command, press Enter again.
Text toolbar
Command line TEXT
To specify a multiline text style
1 Choose Draw> Text > Multiline Line Text.
2 Specify the first point of the Multiline Text box.
3 On the command line, type s (Style) and press ENTER.
4 Type the name of a previously defined text style, and then press Enter.
5 Specify the opposite corner of the Multiline Text box.
6 Type the text.
7 Click Ok.
Text toolbar
Command line MTEXT
Check Spelling
You can use the Spell command to check the spelling of text in your drawings, use various
spelling dictionaries, and create custom spelling dictionary.It is comprised of the following
items.
9.4. Checking the spelling of text
You can use the Spell command to check the spelling of single-line text, multiline text,
paragraph text, attributes, attribute definitions, and dimension text.
Checking the spelling of text
1 Choose Tools > Spelling.
2 Select one or more text entities.
3 In the Check Spelling dialog box, misspelled words display one at a time. Do one of the
following for each found word:
Keep text unchanged — Click Ignore to keep the found word unchanged in the drawing, or
click Ignore All to keep all instances of the found word unchanged in the drawing.
Change text — Select or type a word in the Suggestions box, then click Change to change
the found word in the drawing to the new text, or click Change All to change all instances
of the found word in the drawing.
4 Click Add if you want to add the currently found word to a list of custom spelling words.
The Check Spelling dialog will recognize the added word as spelled correctly the next time
the word is checked for spelling.
Text toolbar
Command line SPELL
Work With Spelling Dictionary
NOTES AND LABELS
225
Most drawings contain text that is not recognized as spelled correctly, even though it is
spelled correctly. For example, if your company name Zaffer, Inc. appears in all of your
drawings, the company name will appear as misspelled every time you check the spelling
of drawing text. You can easily add words to a custom dictionary so that any word in the
custom dictionary is recognized as spelled correctly.
The custom dictionary is independent of any spelling dictionary you have chosen to use.
You can check the spelling of text using one dictionary, check the spelling of the same or
other text using a different dictionary, and in both cases your custom dictionary is used.
TIP You can also add custom words to the custom dictionary directly during spell checking
of text. In the Check Spelling dialog, click Add to add the currently found word to the
custom dictionary.
To download and install a new dictionary
1 Choose Tools > Spelling, select one or more text entities, then in the Check Spelling
dialog box, click Change Dictionaries.
2 Click Download.
3 From the web page that displays (or from a different web page), download the desired
dictionary.
4 Unzip the contents of the downloaded file to \MyDocuments\HunSpell, or the location
where you installed spelling dictionaries for ZWCAD.
5 Click Change Dictionaries again, which will load the newly installed dictionary.
6 In Main Dictionary, select the desired dictionary.
7 Click OK.
Text toolbar
Command line SPELL
To use a dictionary already installed on your computer
1 Copy the existing dictionary (DIC file) to \MyDocuments\HunSpell, or to the location
where you install spelling dictionaries for ZWCAD. Or add the folder of the existing
dictionary to the list of folders where ZWCAD searches for dictionaries. Choose Tools >
Options, click Paths/Files and add the folder location to the Dictionary paths.
2 Choose Tools > Spelling, select one or more text entities, then in the Check Spelling
dialog box, click Change Dictionaries.
3 In Main Dictionary, select the desired dictionary.
4 Click OK.
Create custom spelling dictionary
The Spell command compares text found in the drawing with correctly spelled words in an
installed dictionary (DIC file). There are many different dictionaries that can be used with
ZWCAD, including dictionaries in many different languages. You can download and install
a new dictionary or use a dictionary already installed on your computer.
To create and manage a custom dictionary
1 Choose Tools > Spelling.
2 Select one or more text entities.
3 In the Check Spelling dialog box, click Change Dictionaries.
4 To add a custom word, type a word in Custom Dictionary Words, then click Add.

CHAPTER 9
226
5 To delete a custom word, select a word in Custom Dictionary Words, then click Delete.
6 Click OK.
Text toolbar
Command line SPELL
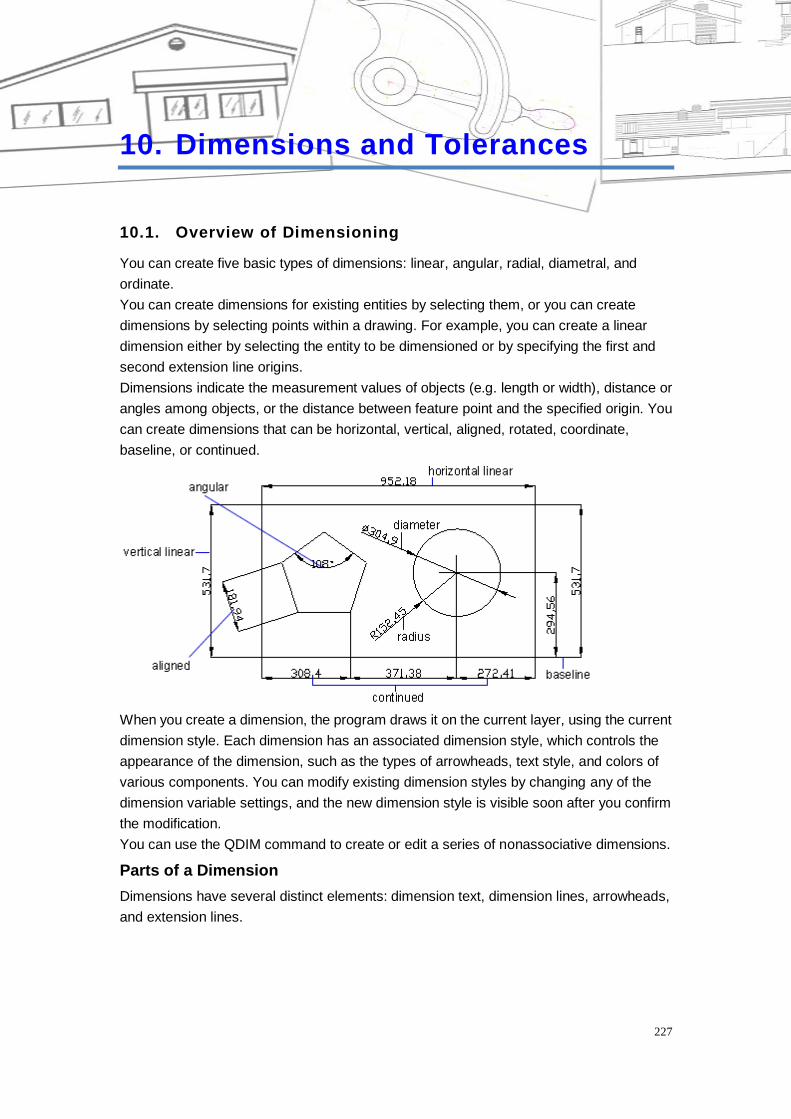
DIMENSION AND TOLERANCES
227
10. Dimensions and Tolerances
10.1. Overview of Dimensioning
You can create five basic types of dimensions: linear, angular, radial, diametral, and
ordinate.
You can create dimensions for existing entities by selecting them, or you can create
dimensions by selecting points within a drawing. For example, you can create a linear
dimension either by selecting the entity to be dimensioned or by specifying the first and
second extension line origins.
Dimensions indicate the measurement values of objects (e.g. length or width), distance or
angles among objects, or the distance between feature point and the specified origin. You
can create dimensions that can be horizontal, vertical, aligned, rotated, coordinate,
baseline, or continued.
When you create a dimension, the program draws it on the current layer, using the current
dimension style. Each dimension has an associated dimension style, which controls the
appearance of the dimension, such as the types of arrowheads, text style, and colors of
various components. You can modify existing dimension styles by changing any of the
dimension variable settings, and the new dimension style is visible soon after you confirm
the modification.
You can use the QDIM command to create or edit a series of nonassociative dimensions.
Parts of a Dimension
Dimensions have several distinct elements: dimension text, dimension lines, arrowheads,
and extension lines.
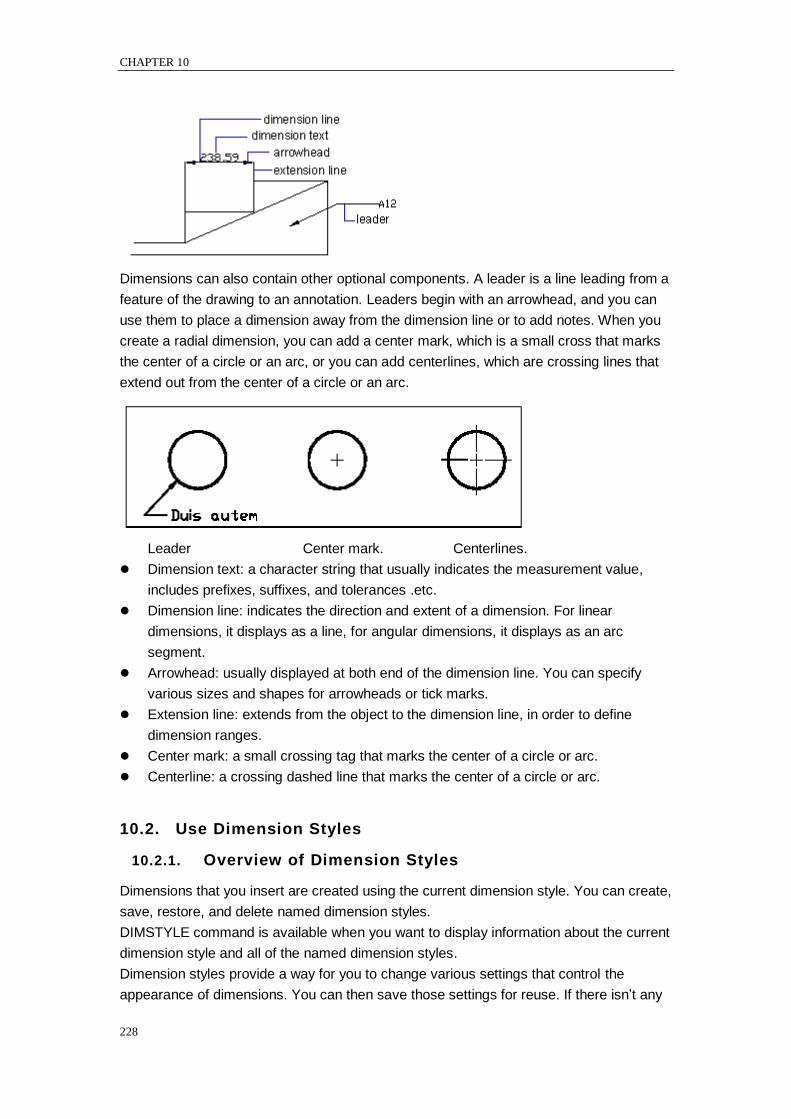
CHAPTER 10
228
Dimensions can also contain other optional components. A leader is a line leading from a
feature of the drawing to an annotation. Leaders begin with an arrowhead, and you can
use them to place a dimension away from the dimension line or to add notes. When you
create a radial dimension, you can add a center mark, which is a small cross that marks
the center of a circle or an arc, or you can add centerlines, which are crossing lines that
extend out from the center of a circle or an arc.
Leader Center mark. Centerlines.
Dimension text: a character string that usually indicates the measurement value,
includes prefixes, suffixes, and tolerances .etc.
Dimension line: indicates the direction and extent of a dimension. For linear
dimensions, it displays as a line, for angular dimensions, it displays as an arc
segment.
Arrowhead: usually displayed at both end of the dimension line. You can specify
various sizes and shapes for arrowheads or tick marks.
Extension line: extends from the object to the dimension line, in order to define
dimension ranges.
Center mark: a small crossing tag that marks the center of a circle or arc.
Centerline: a crossing dashed line that marks the center of a circle or arc.
10.2. Use Dimension Styles
10.2.1. Overview of Dimension Styles
Dimensions that you insert are created using the current dimension style. You can create,
save, restore, and delete named dimension styles.
DIMSTYLE command is available when you want to display information about the current
dimension style and all of the named dimension styles.
Dimension styles provide a way for you to change various settings that control the
appearance of dimensions. You can then save those settings for reuse. If there isn‘t any
DIMENSION AND TOLERANCES
229
predefined dimension style before you start drawing dimensions, the program uses the
Standard dimension style, which stores the default dimension variable settings. You can
get Modify Dimension Style dialog started through clicking Modify button on Dimension
Style Manager dialog, for further modification about each dimstyle settings.
You can change the following settings in the Dimension Style Manager.
Extension lines, dimension lines, arrowheads, center marks or lines, and the offsets
between them
The positioning of the parts of the dimension in relation to one another and the
orientation of the dimension text
The content and appearance of the dimension text
The units of the dimension value
With the Compare button of the Dimension Style Manager, you can list the difference
between any two named dimension styles.
If there is a dimension contained in the xref being inserted, then dimension style applied in
this dimension is also existing in current drawing.You can compare externally referenced
dimension styles with other styles, but not allowed to modify them or make them current.
An externally referenced dimension style can be used as a template to create a new
dimension style in the current drawing.
To create a dimension style
1 Choose Dimensions > Dimension Style.
2 In the Dimension Style Manager dialog box, click New.
3 Type the name of the new dimension style, and choose which style started with and
what kind of dimension used for.
4 Click Continue.
5 In the Dimension Style dialog box, click one of the other tabs, and then change the
dimension settings as necessary.Repeat this step for each tab, as needed.
6 To end the command, click OK.
Dimension toolbar
Command line DIMSTYLE
To select a dimension style
1 Choose Dimensions >Dimension Style.
2 Select a dimension style from the styles list.
Dimension toolbar
Command line DIMSTYLE
To rename a dimension style
1 Choose Dimensions >Dimension Style.
2 In the Styles list of Dimension Style Manager dialog box, do one of the following:
Double click the required style.
Right click at the required style name, then choose rename.
3 Type the new name.
4 Click Close to exit.
CHAPTER 10
230
Dimension toolbar
Command line DIMSTYLE
To delete a named dimension style
1 Choose Dimensions >Dimension Style.
2 In the Styles list of Dimension Style Manager dialog box, right click at the required style
name, and then choose delete.
3 Click Close to close.
Dimension toolbar
Command line DIMSTYLE
To display information about the current style
1 Choose Dimensions >Dimension Style.
2 In the Dimension Style Manager dialog box, click Compare.
3 In the Compare Dimension Style dialog box, choose the same dimension style from the
Compare and With pulldown list, all properties for specified dimension style will be
displayed.
4 If you want to know the different information between two styles, choose one style in
Compare box, and choose the other in the With box, you will see difference in the
following tab.
5 Click Close to close.
Dimension toolbar
Command line DIMSTYLE
10.2.2. Control Dimension Elements
You can modify the appearance of dimension lines, extension lines, arrowheads, and
center marks.
Modify Dimension Lines
On the Lines and Text tab of the Modify Dimension Style dialog box, you can set the color
of dimension lies, lineweight, ticks beyond extend line, baseline spacing, and visibility.
Only when the arrowheads are assigned oblique stroke arrowheads, architectural tick,
Integral, dot small or none arrowheads, you can set the displacement explains how far the
dimension line extends beyond the extend lines, otherwise this setting is not available.
You can also set the baseline spacing to control the spacing between successive
dimension lines.
If text splits a dimension line, you can specify whether each part of the dimension line is
visible or not.
Modify Extension Lines
Extension lines have the following properties: color, lineweight, distance beyond
extension lines, offset from start of extension lines, and visibility. You can set these
properties on the Lines and Arrows tab of the Modify Dimension Style dialog box.
If extension lines are unnecessary or there is not enough space to display extension lines,
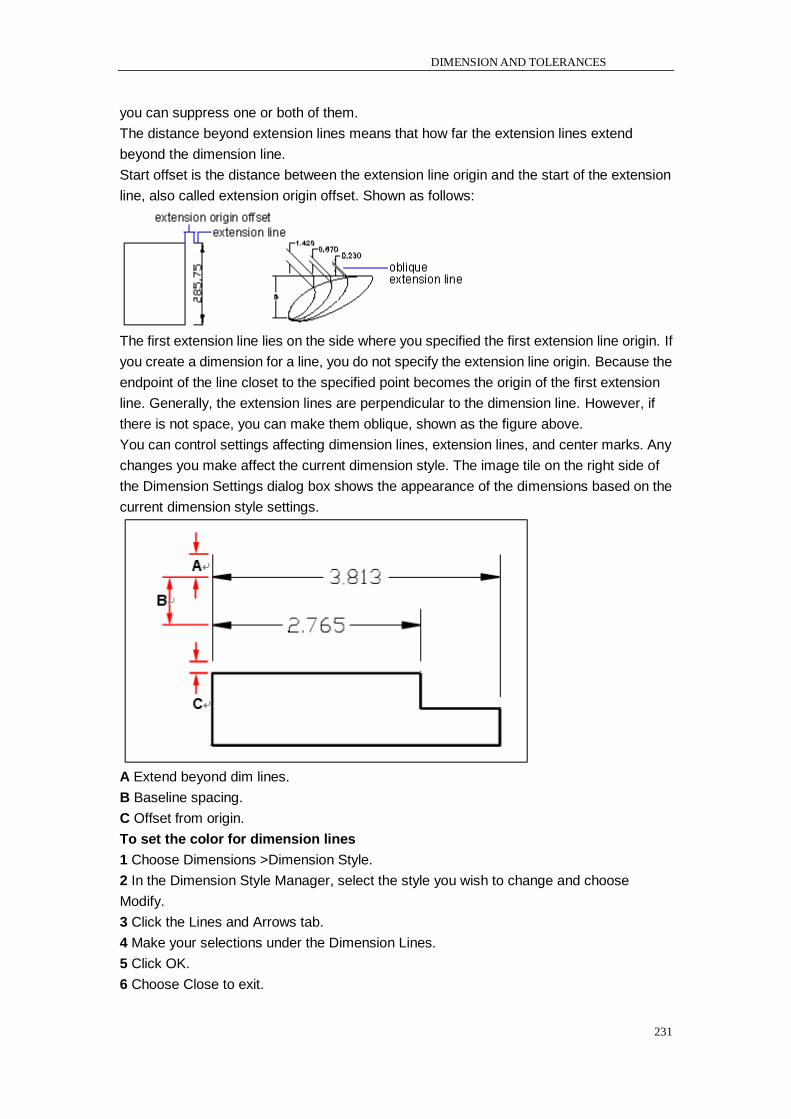
DIMENSION AND TOLERANCES
231
you can suppress one or both of them.
The distance beyond extension lines means that how far the extension lines extend
beyond the dimension line.
Start offset is the distance between the extension line origin and the start of the extension
line, also called extension origin offset. Shown as follows:
The first extension line lies on the side where you specified the first extension line origin. If
you create a dimension for a line, you do not specify the extension line origin. Because the
endpoint of the line closet to the specified point becomes the origin of the first extension
line. Generally, the extension lines are perpendicular to the dimension line. However, if
there is not space, you can make them oblique, shown as the figure above.
You can control settings affecting dimension lines, extension lines, and center marks. Any
changes you make affect the current dimension style. The image tile on the right side of
the Dimension Settings dialog box shows the appearance of the dimensions based on the
current dimension style settings.
A Extend beyond dim lines.
B Baseline spacing.
C Offset from origin.
To set the color for dimension lines
1 Choose Dimensions >Dimension Style.
2 In the Dimension Style Manager, select the style you wish to change and choose
Modify.
3 Click the Lines and Arrows tab.
4 Make your selections under the Dimension Lines.
5 Click OK.
6 Choose Close to exit.

CHAPTER 10
232
Dimension toolbar
Command line DIMSTYLE
Choose Dimension Arrowheads
You can control the appearance and size of arrowheads or hook marks placed at the ends
of dimension lines. Any changes you make affect the current dimension style. The
appearance of selected arrowhead is display in the preview frame placed at the upper
right corner of the Modify Dimension Style or New Dimension Style dialog box.
You can specify different arrowheads for both ends of a dimension line and for leader lines.
The First arrow is toward the first extension line; The Second arrow is toward the second
extension line. Blocks defined in the drawing also display in the three Arrowhead lists as
user defined arrows. You can use these blocks to create and assign your own arrowheads.
The Arrow Size value determines the size of the arrowhead, measured in drawing units.
You can also use tick marks instead of arrowheads.
To choose an arrowhead
1 Choose Dimensions >Dimension Style.
2 In the Dimension Style Manager, select the style you want to change and click Modify
button.
3 Click the Lines and Arrows tab.
4 Make your selections under the Arrowheads.
5 Click OK.
6 Choose Close to exit.
Dimension toolbar
Command line DIMSTYLE
NOTE You can also specify leader arrow types using the DIMLDRBLK system variable.
Customize Arrowheads
The default arrowheads are stored as block definitions. If you select User Defined as your
arrowhead type, you‘ll be prompted to assign a name for an existing block definition.
The overall dimension scale factor determines the arrowhead size. If you assign the User
Define Arrowhead to the arrowhead in the Dimension Style Manager dialog box, the block
is inserted where the arrowheads would normally go when you create a dimension. The X
and Y scale factors of the object are set to ―arrowhead size overall scale. You can trim the
dimension line with text gap x overall scale units at each end. If you want to trim the
dimension line, insert the rightmost block with a zero rotation angle for horizontal
dimensioning. And rotate the leftmost block at 180 degrees about its insertion point.
If you use paper-spacing scale, the scale factor is calculated before you applied it to the
arrowhead size value.
Center marks
While you are creating dimensions for circle or arc entities, you can setup type and size
for the center mark. Three types of marks are provided here: None, Mark, and Line.
10.2.3. Control Dimension Text
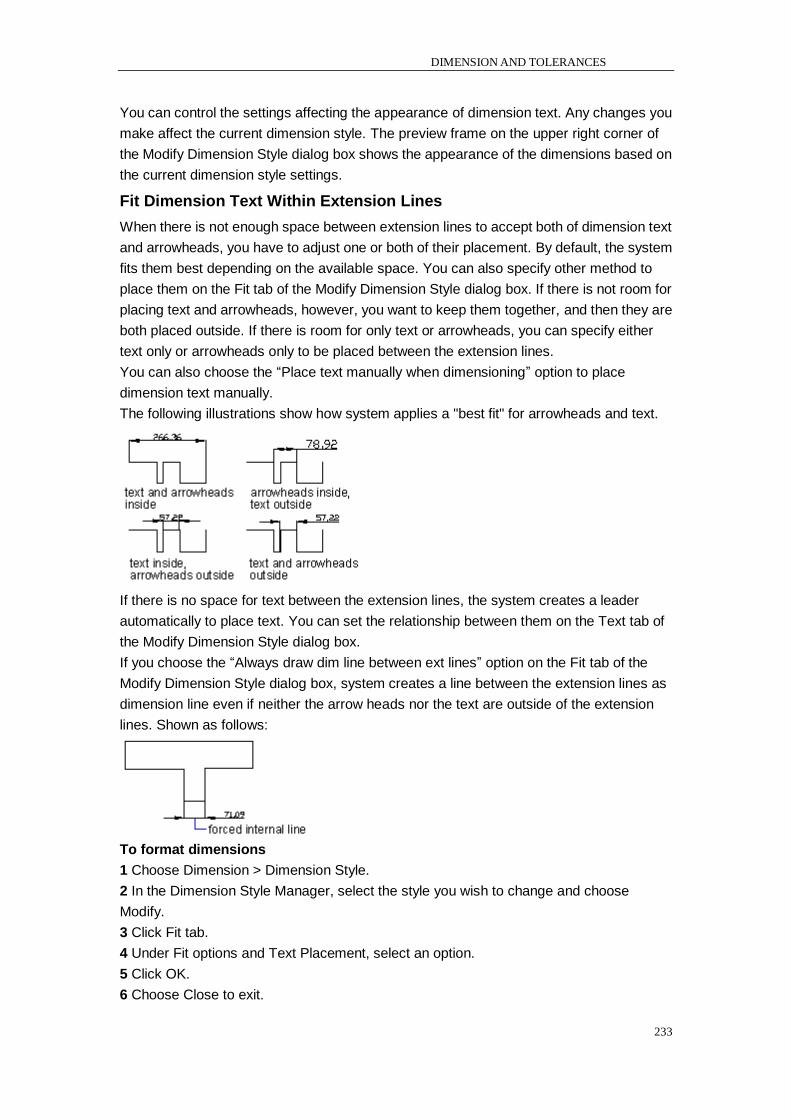
DIMENSION AND TOLERANCES
233
You can control the settings affecting the appearance of dimension text. Any changes you
make affect the current dimension style. The preview frame on the upper right corner of
the Modify Dimension Style dialog box shows the appearance of the dimensions based on
the current dimension style settings.
Fit Dimension Text Within Extension Lines
When there is not enough space between extension lines to accept both of dimension text
and arrowheads, you have to adjust one or both of their placement. By default, the system
fits them best depending on the available space. You can also specify other method to
place them on the Fit tab of the Modify Dimension Style dialog box. If there is not room for
placing text and arrowheads, however, you want to keep them together, and then they are
both placed outside. If there is room for only text or arrowheads, you can specify either
text only or arrowheads only to be placed between the extension lines.
You can also choose the ―Place text manually when dimensioning‖ option to place
dimension text manually.
The following illustrations show how system applies a "best fit" for arrowheads and text.
If there is no space for text between the extension lines, the system creates a leader
automatically to place text. You can set the relationship between them on the Text tab of
the Modify Dimension Style dialog box.
If you choose the ―Always draw dim line between ext lines‖ option on the Fit tab of the
Modify Dimension Style dialog box, system creates a line between the extension lines as
dimension line even if neither the arrow heads nor the text are outside of the extension
lines. Shown as follows:
To format dimensions
1 Choose Dimension > Dimension Style.
2 In the Dimension Style Manager, select the style you wish to change and choose
Modify.
3 Click Fit tab.
4 Under Fit options and Text Placement, select an option.
5 Click OK.
6 Choose Close to exit.
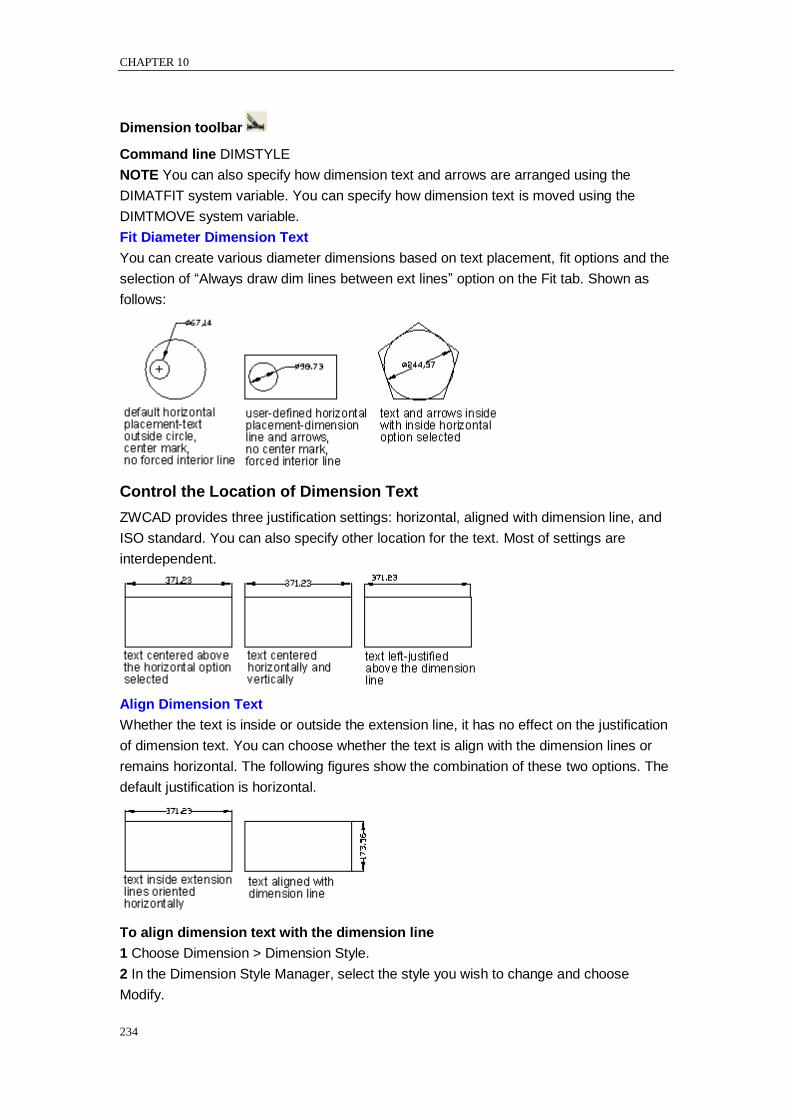
CHAPTER 10
234
Dimension toolbar
Command line DIMSTYLE
NOTE You can also specify how dimension text and arrows are arranged using the
DIMATFIT system variable. You can specify how dimension text is moved using the
DIMTMOVE system variable.
Fit Diameter Dimension Text
You can create various diameter dimensions based on text placement, fit options and the
selection of ―Always draw dim lines between ext lines‖ option on the Fit tab. Shown as
follows:
Control the Location of Dimension Text
ZWCAD provides three justification settings: horizontal, aligned with dimension line, and
ISO standard. You can also specify other location for the text. Most of settings are
interdependent.
Align Dimension Text
Whether the text is inside or outside the extension line, it has no effect on the justification
of dimension text. You can choose whether the text is align with the dimension lines or
remains horizontal. The following figures show the combination of these two options. The
default justification is horizontal.
To align dimension text with the dimension line
1 Choose Dimension > Dimension Style.
2 In the Dimension Style Manager, select the style you wish to change and choose
Modify.
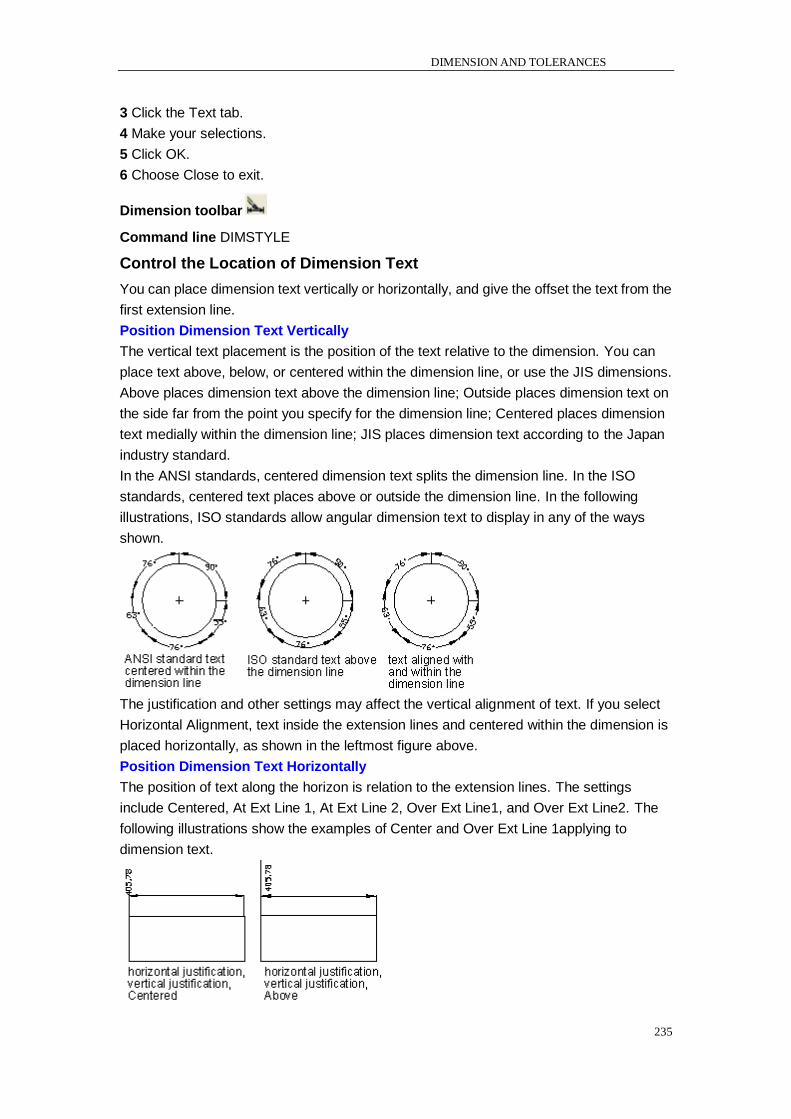
DIMENSION AND TOLERANCES
235
3 Click the Text tab.
4 Make your selections.
5 Click OK.
6 Choose Close to exit.
Dimension toolbar
Command line DIMSTYLE
Control the Location of Dimension Text
You can place dimension text vertically or horizontally, and give the offset the text from the
first extension line.
Position Dimension Text Vertically
The vertical text placement is the position of the text relative to the dimension. You can
place text above, below, or centered within the dimension line, or use the JIS dimensions.
Above places dimension text above the dimension line; Outside places dimension text on
the side far from the point you specify for the dimension line; Centered places dimension
text medially within the dimension line; JIS places dimension text according to the Japan
industry standard.
In the ANSI standards, centered dimension text splits the dimension line. In the ISO
standards, centered text places above or outside the dimension line. In the following
illustrations, ISO standards allow angular dimension text to display in any of the ways
shown.
The justification and other settings may affect the vertical alignment of text. If you select
Horizontal Alignment, text inside the extension lines and centered within the dimension is
placed horizontally, as shown in the leftmost figure above.
Position Dimension Text Horizontally
The position of text along the horizon is relation to the extension lines. The settings
include Centered, At Ext Line 1, At Ext Line 2, Over Ext Line1, and Over Ext Line2. The
following illustrations show the examples of Center and Over Ext Line 1applying to
dimension text.
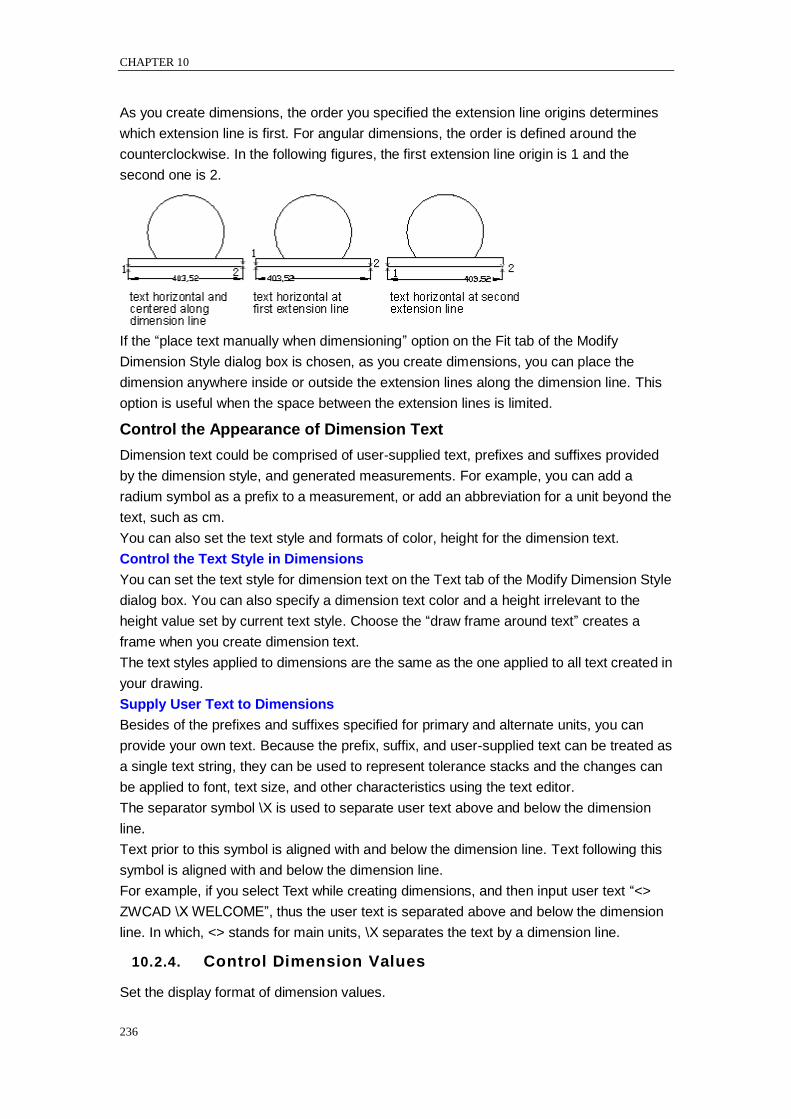
CHAPTER 10
236
As you create dimensions, the order you specified the extension line origins determines
which extension line is first. For angular dimensions, the order is defined around the
counterclockwise. In the following figures, the first extension line origin is 1 and the
second one is 2.
If the ―place text manually when dimensioning‖ option on the Fit tab of the Modify
Dimension Style dialog box is chosen, as you create dimensions, you can place the
dimension anywhere inside or outside the extension lines along the dimension line. This
option is useful when the space between the extension lines is limited.
Control the Appearance of Dimension Text
Dimension text could be comprised of user-supplied text, prefixes and suffixes provided
by the dimension style, and generated measurements. For example, you can add a
radium symbol as a prefix to a measurement, or add an abbreviation for a unit beyond the
text, such as cm.
You can also set the text style and formats of color, height for the dimension text.
Control the Text Style in Dimensions
You can set the text style for dimension text on the Text tab of the Modify Dimension Style
dialog box. You can also specify a dimension text color and a height irrelevant to the
height value set by current text style. Choose the ―draw frame around text‖ creates a
frame when you create dimension text.
The text styles applied to dimensions are the same as the one applied to all text created in
your drawing.
Supply User Text to Dimensions
Besides of the prefixes and suffixes specified for primary and alternate units, you can
provide your own text. Because the prefix, suffix, and user-supplied text can be treated as
a single text string, they can be used to represent tolerance stacks and the changes can
be applied to font, text size, and other characteristics using the text editor.
The separator symbol \X is used to separate user text above and below the dimension
line.
Text prior to this symbol is aligned with and below the dimension line. Text following this
symbol is aligned with and below the dimension line.
For example, if you select Text while creating dimensions, and then input user text ―<>
ZWCAD \X WELCOME‖, thus the user text is separated above and below the dimension
line. In which, <> stands for main units, \X separates the text by a dimension line.
10.2.4. Control Dimension Values
Set the display format of dimension values.
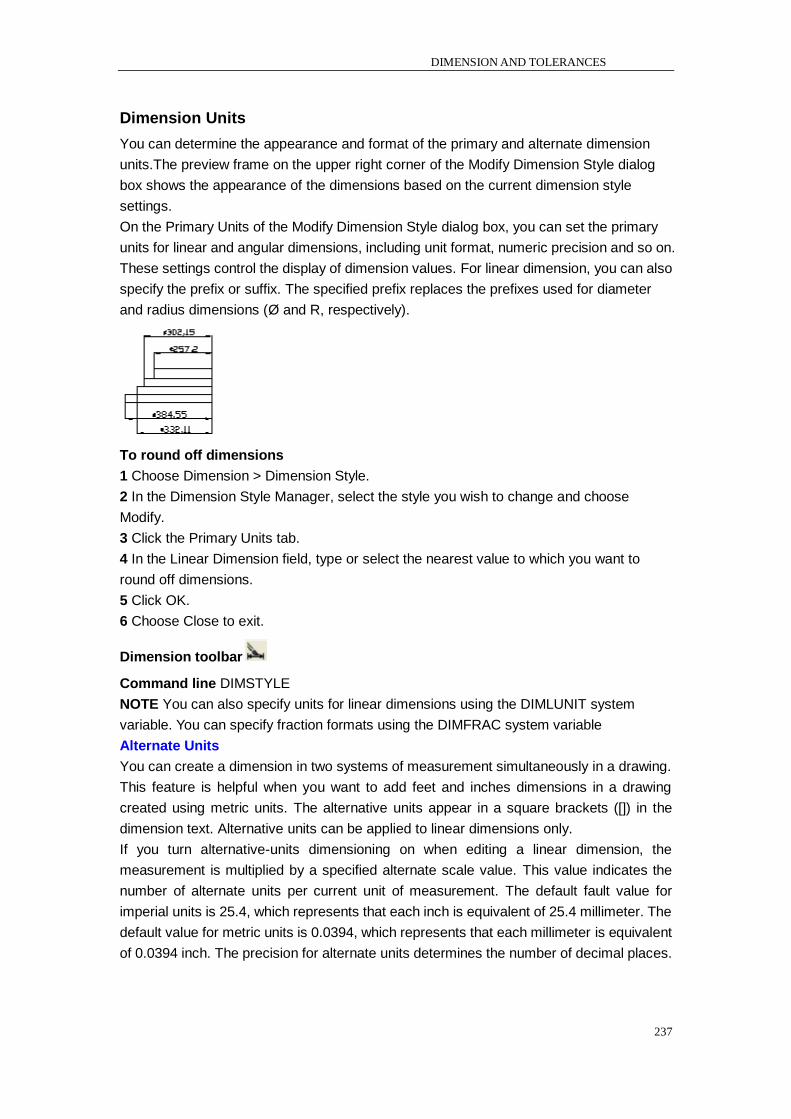
DIMENSION AND TOLERANCES
237
Dimension Units
You can determine the appearance and format of the primary and alternate dimension
units.The preview frame on the upper right corner of the Modify Dimension Style dialog
box shows the appearance of the dimensions based on the current dimension style
settings.
On the Primary Units of the Modify Dimension Style dialog box, you can set the primary
units for linear and angular dimensions, including unit format, numeric precision and so on.
These settings control the display of dimension values. For linear dimension, you can also
specify the prefix or suffix. The specified prefix replaces the prefixes used for diameter
and radius dimensions (Ø and R, respectively).
To round off dimensions
1 Choose Dimension > Dimension Style.
2 In the Dimension Style Manager, select the style you wish to change and choose
Modify.
3 Click the Primary Units tab.
4 In the Linear Dimension field, type or select the nearest value to which you want to
round off dimensions.
5 Click OK.
6 Choose Close to exit.
Dimension toolbar
Command line DIMSTYLE
NOTE You can also specify units for linear dimensions using the DIMLUNIT system
variable. You can specify fraction formats using the DIMFRAC system variable
Alternate Units
You can create a dimension in two systems of measurement simultaneously in a drawing.
This feature is helpful when you want to add feet and inches dimensions in a drawing
created using metric units. The alternative units appear in a square brackets ([]) in the
dimension text. Alternative units can be applied to linear dimensions only.
If you turn alternative-units dimensioning on when editing a linear dimension, the
measurement is multiplied by a specified alternate scale value. This value indicates the
number of alternate units per current unit of measurement. The default fault value for
imperial units is 25.4, which represents that each inch is equivalent of 25.4 millimeter. The
default value for metric units is 0.0394, which represents that each millimeter is equivalent
of 0.0394 inch. The precision for alternate units determines the number of decimal places.
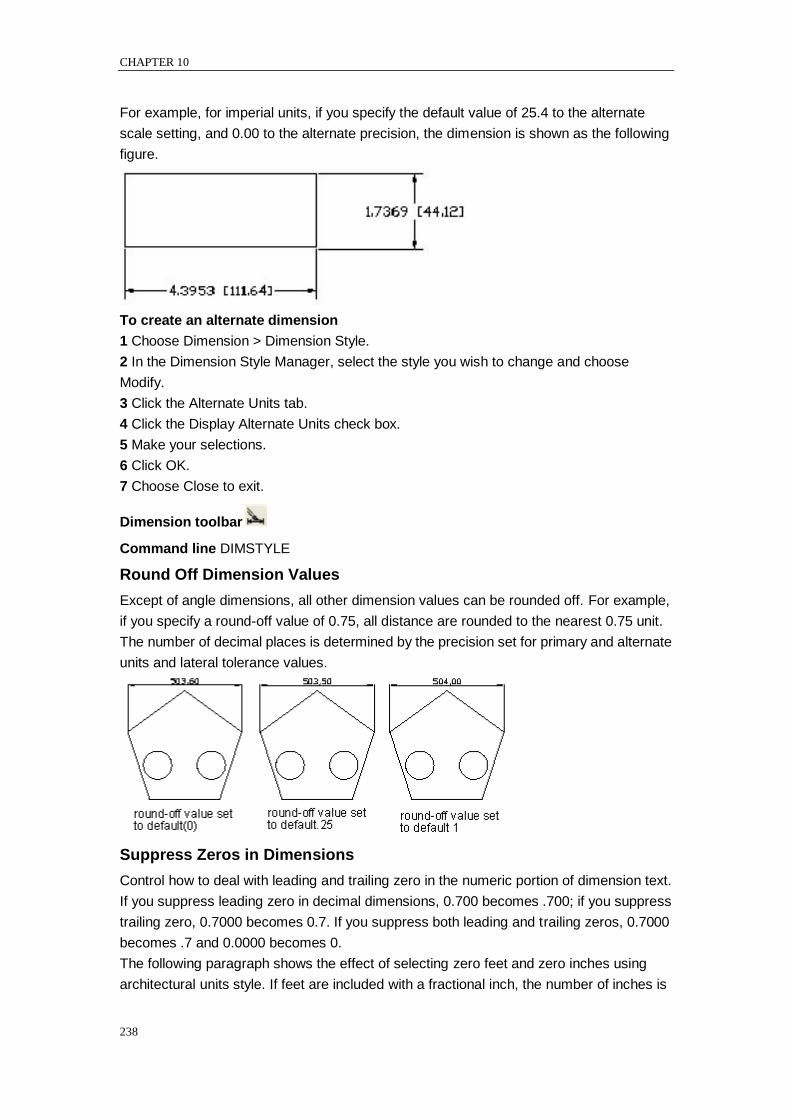
CHAPTER 10
238
For example, for imperial units, if you specify the default value of 25.4 to the alternate
scale setting, and 0.00 to the alternate precision, the dimension is shown as the following
figure.
To create an alternate dimension
1 Choose Dimension > Dimension Style.
2 In the Dimension Style Manager, select the style you wish to change and choose
Modify.
3 Click the Alternate Units tab.
4 Click the Display Alternate Units check box.
5 Make your selections.
6 Click OK.
7 Choose Close to exit.
Dimension toolbar
Command line DIMSTYLE
Round Off Dimension Values
Except of angle dimensions, all other dimension values can be rounded off. For example,
if you specify a round-off value of 0.75, all distance are rounded to the nearest 0.75 unit.
The number of decimal places is determined by the precision set for primary and alternate
units and lateral tolerance values.
Suppress Zeros in Dimensions
Control how to deal with leading and trailing zero in the numeric portion of dimension text.
If you suppress leading zero in decimal dimensions, 0.700 becomes .700; if you suppress
trailing zero, 0.7000 becomes 0.7. If you suppress both leading and trailing zeros, 0.7000
becomes .7 and 0.0000 becomes 0.
The following paragraph shows the effect of selecting zero feet and zero inches using
architectural units style. If feet are included with a fractional inch, the number of inches is
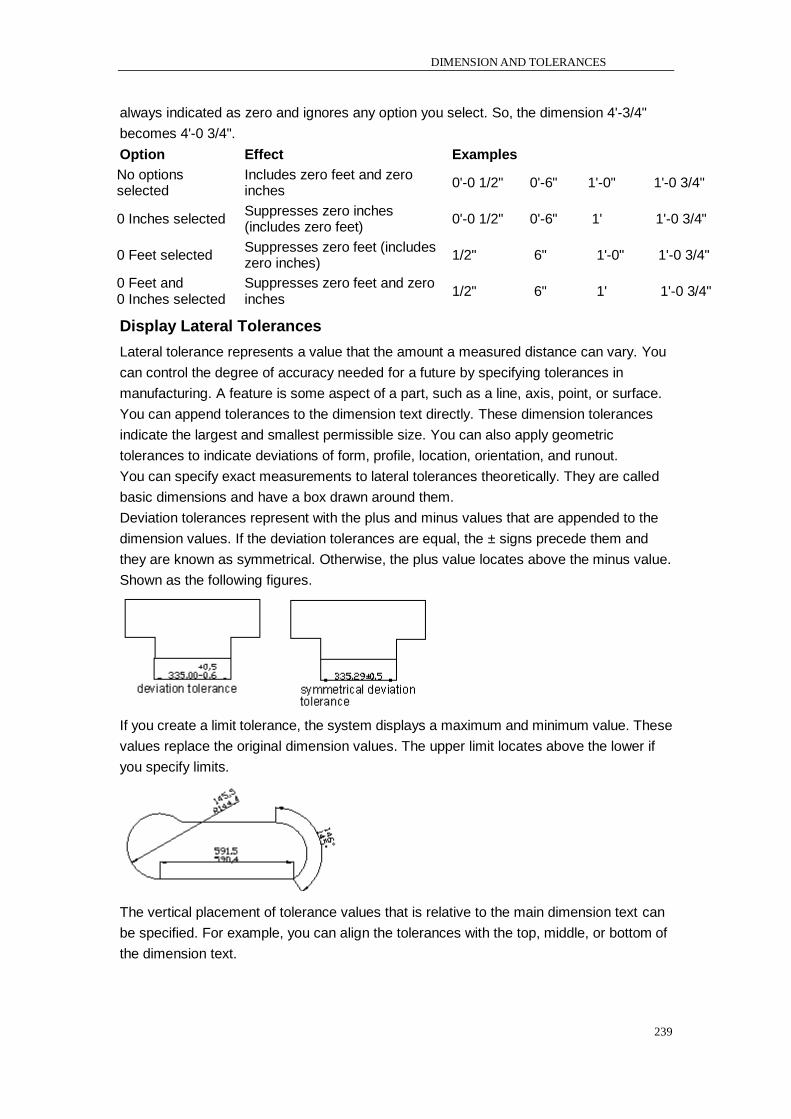
DIMENSION AND TOLERANCES
239
always indicated as zero and ignores any option you select. So, the dimension 4'-3/4"
becomes 4'-0 3/4".
Option Effect Examples
No options selected
Includes zero feet and zero inches
0'-0 1/2" 0'-6" 1'-0" 1'-0 3/4"
0 Inches selected Suppresses zero inches (includes zero feet)
0'-0 1/2" 0'-6" 1' 1'-0 3/4"
0 Feet selected Suppresses zero feet (includes zero inches)
1/2" 6" 1'-0" 1'-0 3/4"
0 Feet and 0 Inches selected
Suppresses zero feet and zero inches
1/2" 6" 1' 1'-0 3/4"
Display Lateral Tolerances
Lateral tolerance represents a value that the amount a measured distance can vary. You
can control the degree of accuracy needed for a future by specifying tolerances in
manufacturing. A feature is some aspect of a part, such as a line, axis, point, or surface.
You can append tolerances to the dimension text directly. These dimension tolerances
indicate the largest and smallest permissible size. You can also apply geometric
tolerances to indicate deviations of form, profile, location, orientation, and runout.
You can specify exact measurements to lateral tolerances theoretically. They are called
basic dimensions and have a box drawn around them.
Deviation tolerances represent with the plus and minus values that are appended to the
dimension values. If the deviation tolerances are equal, the ± signs precede them and
they are known as symmetrical. Otherwise, the plus value locates above the minus value.
Shown as the following figures.
If you create a limit tolerance, the system displays a maximum and minimum value. These
values replace the original dimension values. The upper limit locates above the lower if
you specify limits.
The vertical placement of tolerance values that is relative to the main dimension text can
be specified. For example, you can align the tolerances with the top, middle, or bottom of
the dimension text.

CHAPTER 10
240
You can also control how to suppress zero for tolerance values, as you can with the
primary and alternate units. The effect of suppressing zero in lateral tolerance is the same
as suppressing zero in the primary and alternate units.
10.2.5. Set the Scale for Dimensions
Set the scale for dimensions. Setting dimension scale depends on the method you use to
lay out and plot drawings.
Dimension scale has effects on the size of dimension geometry relative to the objects in
the drawing. In addition to text height and arrowhead size, dimension scale affects offsets
in dimension as well, such as the extension line origin offset. When you create dimensions,
it‘s recommended to set the size and offset to values that represent their actual plotted
size. However, the tolerances, measured lengths, coordinates, and angles cannot be
applied to the overall scale factor.
The method you lay out your drawing determines how to set the dimension scale. The
method of creating dimensions in a drawing layout is shown as follows:
Dimension in model space for plotting in model space. If you want to create
dimensions that are scaled correctly for plotting, you have to set the system variable
DIMSCALE to the inverse of the desired plot scale. For example, if the plot scale is
1/4, you have to set DIMSCALE to 4.
Dimension in model space for plotting in paper space. If you want to create
dimensions that are scaled automatically for display in a paper space layout, you
have to set the DIMSCALE to 0. This method is useful when you encounter the
following situations: the dimensions in a drawing need to be referenced by other
drawings (xrefs); when you create isometric dimensions in 3D isometric views. To
prevent the dimensions in one layout viewport from being displayed in other layout
viewports, it‘s recommended you to create a dimensioning layer for each layout
viewport that is frozen in all other layout viewports.
Dimension in layouts. You can create dimensions in paper space by selecting model
space objects or by specifying object snap locations on model space objects. The
dimensions created in a paper space layout do not need additional scaling: there is
no need to change the default value of DIMLFAC and DIMSCALE.
10.3. Create Dimensions
You can create dimensions by:
Selecting the entity to dimension and specifying the dimension line location.
Specifying the extension line origins and the dimension line location.
When you create dimensions by selecting an entity, the program automatically places the
extension line origins at the appropriate definition points based on the type of entity you
select. For example, the definition points are located at the endpoints of arcs, lines, and
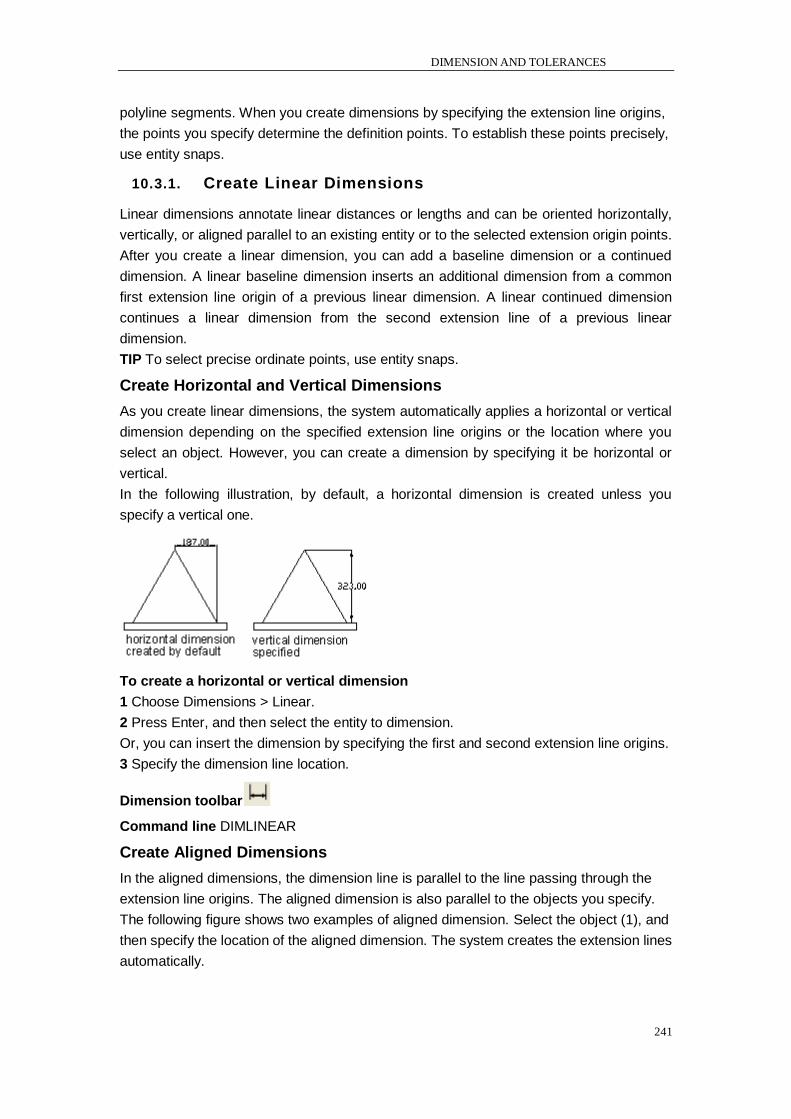
DIMENSION AND TOLERANCES
241
polyline segments. When you create dimensions by specifying the extension line origins,
the points you specify determine the definition points. To establish these points precisely,
use entity snaps.
10.3.1. Create Linear Dimensions
Linear dimensions annotate linear distances or lengths and can be oriented horizontally,
vertically, or aligned parallel to an existing entity or to the selected extension origin points.
After you create a linear dimension, you can add a baseline dimension or a continued
dimension. A linear baseline dimension inserts an additional dimension from a common
first extension line origin of a previous linear dimension. A linear continued dimension
continues a linear dimension from the second extension line of a previous linear
dimension.
TIP To select precise ordinate points, use entity snaps.
Create Horizontal and Vertical Dimensions
As you create linear dimensions, the system automatically applies a horizontal or vertical
dimension depending on the specified extension line origins or the location where you
select an object. However, you can create a dimension by specifying it be horizontal or
vertical.
In the following illustration, by default, a horizontal dimension is created unless you
specify a vertical one.
To create a horizontal or vertical dimension
1 Choose Dimensions > Linear.
2 Press Enter, and then select the entity to dimension.
Or, you can insert the dimension by specifying the first and second extension line origins.
3 Specify the dimension line location.
Dimension toolbar
Command line DIMLINEAR
Create Aligned Dimensions
In the aligned dimensions, the dimension line is parallel to the line passing through the
extension line origins. The aligned dimension is also parallel to the objects you specify.
The following figure shows two examples of aligned dimension. Select the object (1), and
then specify the location of the aligned dimension. The system creates the extension lines
automatically.
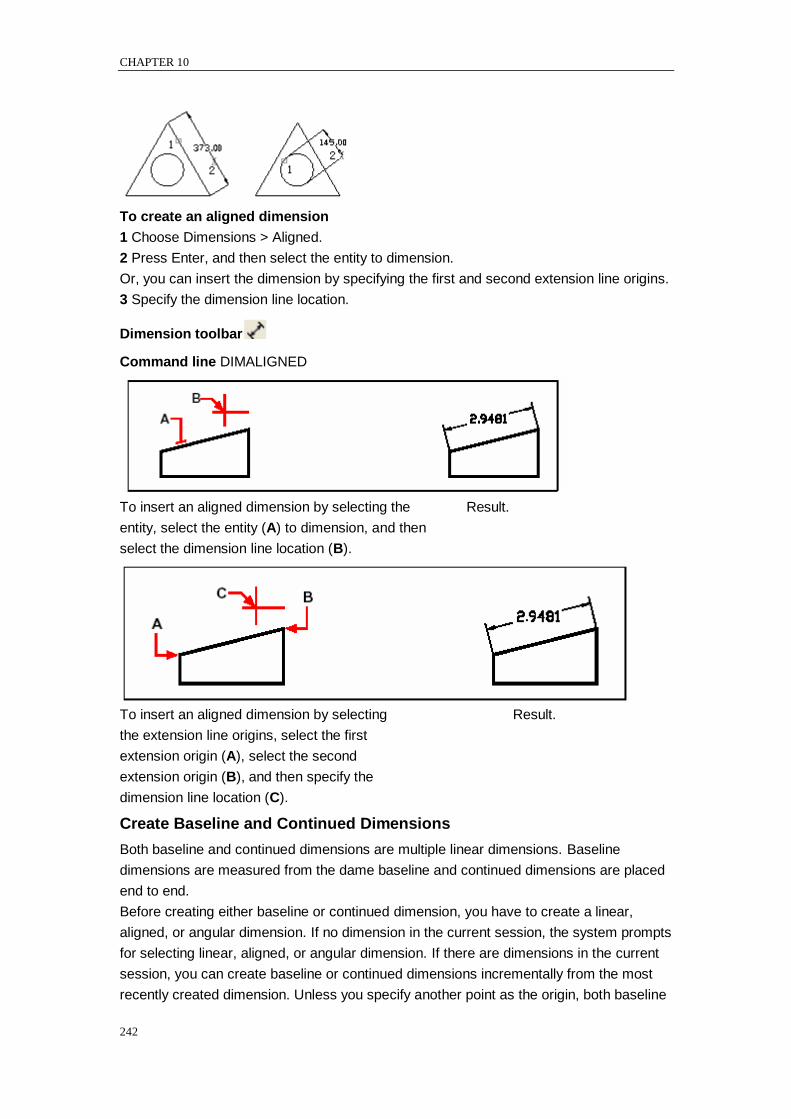
CHAPTER 10
242
To create an aligned dimension
1 Choose Dimensions > Aligned.
2 Press Enter, and then select the entity to dimension.
Or, you can insert the dimension by specifying the first and second extension line origins.
3 Specify the dimension line location.
Dimension toolbar
Command line DIMALIGNED
To insert an aligned dimension by selecting the Result.
entity, select the entity (A) to dimension, and then
select the dimension line location (B).
To insert an aligned dimension by selecting Result.
the extension line origins, select the first
extension origin (A), select the second
extension origin (B), and then specify the
dimension line location (C).
Create Baseline and Continued Dimensions
Both baseline and continued dimensions are multiple linear dimensions. Baseline
dimensions are measured from the dame baseline and continued dimensions are placed
end to end.
Before creating either baseline or continued dimension, you have to create a linear,
aligned, or angular dimension. If no dimension in the current session, the system prompts
for selecting linear, aligned, or angular dimension. If there are dimensions in the current
session, you can create baseline or continued dimensions incrementally from the most
recently created dimension. Unless you specify another point as the origin, both baseline
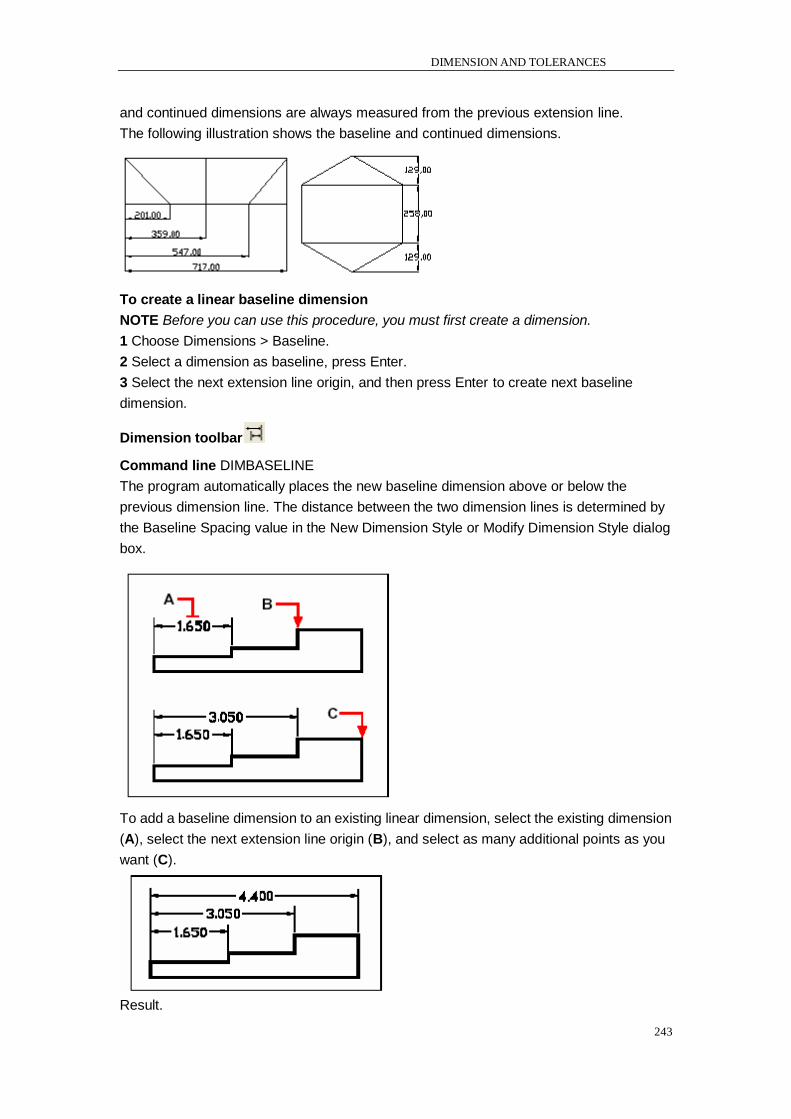
DIMENSION AND TOLERANCES
243
and continued dimensions are always measured from the previous extension line.
The following illustration shows the baseline and continued dimensions.
To create a linear baseline dimension
NOTE Before you can use this procedure, you must first create a dimension.
1 Choose Dimensions > Baseline.
2 Select a dimension as baseline, press Enter.
3 Select the next extension line origin, and then press Enter to create next baseline
dimension.
Dimension toolbar
Command line DIMBASELINE
The program automatically places the new baseline dimension above or below the
previous dimension line. The distance between the two dimension lines is determined by
the Baseline Spacing value in the New Dimension Style or Modify Dimension Style dialog
box.
To add a baseline dimension to an existing linear dimension, select the existing dimension
(A), select the next extension line origin (B), and select as many additional points as you
want (C).
Result.
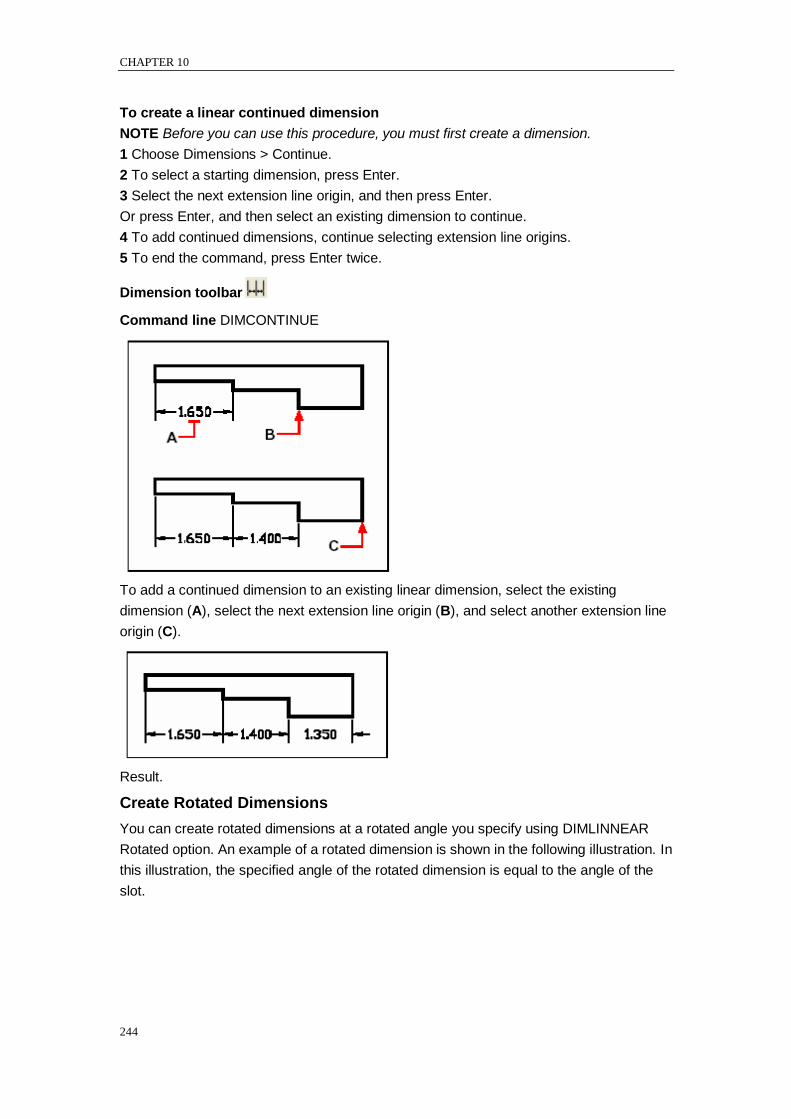
CHAPTER 10
244
To create a linear continued dimension
NOTE Before you can use this procedure, you must first create a dimension.
1 Choose Dimensions > Continue.
2 To select a starting dimension, press Enter.
3 Select the next extension line origin, and then press Enter.
Or press Enter, and then select an existing dimension to continue.
4 To add continued dimensions, continue selecting extension line origins.
5 To end the command, press Enter twice.
Dimension toolbar
Command line DIMCONTINUE
To add a continued dimension to an existing linear dimension, select the existing
dimension (A), select the next extension line origin (B), and select another extension line
origin (C).
Result.
Create Rotated Dimensions
You can create rotated dimensions at a rotated angle you specify using DIMLINNEAR
Rotated option. An example of a rotated dimension is shown in the following illustration. In
this illustration, the specified angle of the rotated dimension is equal to the angle of the
slot.
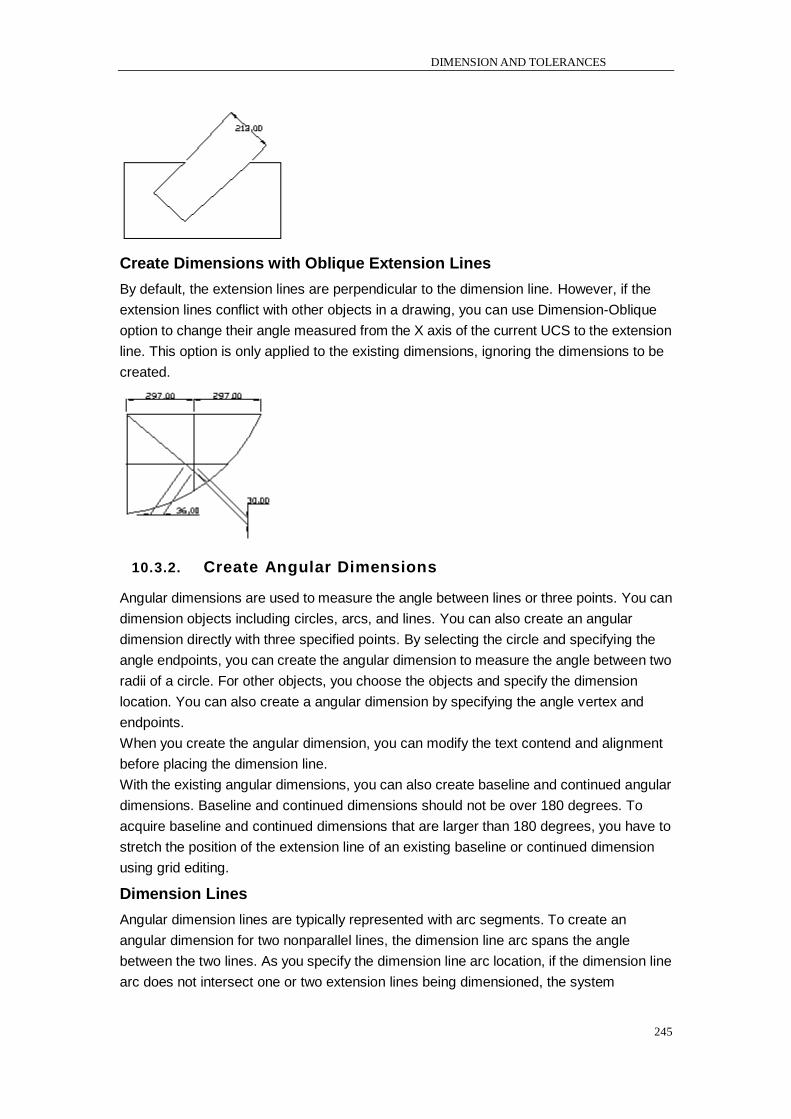
DIMENSION AND TOLERANCES
245
Create Dimensions with Oblique Extension Lines
By default, the extension lines are perpendicular to the dimension line. However, if the
extension lines conflict with other objects in a drawing, you can use Dimension-Oblique
option to change their angle measured from the X axis of the current UCS to the extension
line. This option is only applied to the existing dimensions, ignoring the dimensions to be
created.
10.3.2. Create Angular Dimensions
Angular dimensions are used to measure the angle between lines or three points. You can
dimension objects including circles, arcs, and lines. You can also create an angular
dimension directly with three specified points. By selecting the circle and specifying the
angle endpoints, you can create the angular dimension to measure the angle between two
radii of a circle. For other objects, you choose the objects and specify the dimension
location. You can also create a angular dimension by specifying the angle vertex and
endpoints.
When you create the angular dimension, you can modify the text contend and alignment
before placing the dimension line.
With the existing angular dimensions, you can also create baseline and continued angular
dimensions. Baseline and continued dimensions should not be over 180 degrees. To
acquire baseline and continued dimensions that are larger than 180 degrees, you have to
stretch the position of the extension line of an existing baseline or continued dimension
using grid editing.
Dimension Lines
Angular dimension lines are typically represented with arc segments. To create an
angular dimension for two nonparallel lines, the dimension line arc spans the angle
between the two lines. As you specify the dimension line arc location, if the dimension line
arc does not intersect one or two extension lines being dimensioned, the system
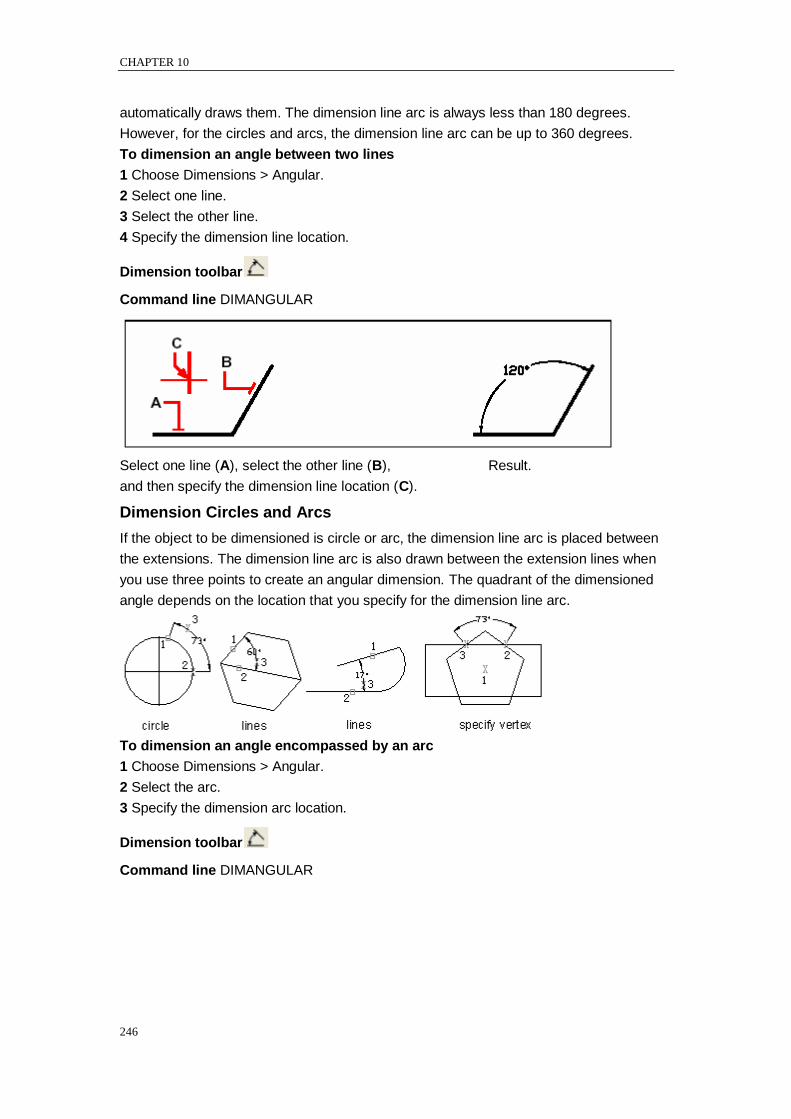
CHAPTER 10
246
automatically draws them. The dimension line arc is always less than 180 degrees.
However, for the circles and arcs, the dimension line arc can be up to 360 degrees.
To dimension an angle between two lines
1 Choose Dimensions > Angular.
2 Select one line.
3 Select the other line.
4 Specify the dimension line location.
Dimension toolbar
Command line DIMANGULAR
Select one line (A), select the other line (B), Result.
and then specify the dimension line location (C).
Dimension Circles and Arcs
If the object to be dimensioned is circle or arc, the dimension line arc is placed between
the extensions. The dimension line arc is also drawn between the extension lines when
you use three points to create an angular dimension. The quadrant of the dimensioned
angle depends on the location that you specify for the dimension line arc.
To dimension an angle encompassed by an arc
1 Choose Dimensions > Angular.
2 Select the arc.
3 Specify the dimension arc location.
Dimension toolbar
Command line DIMANGULAR
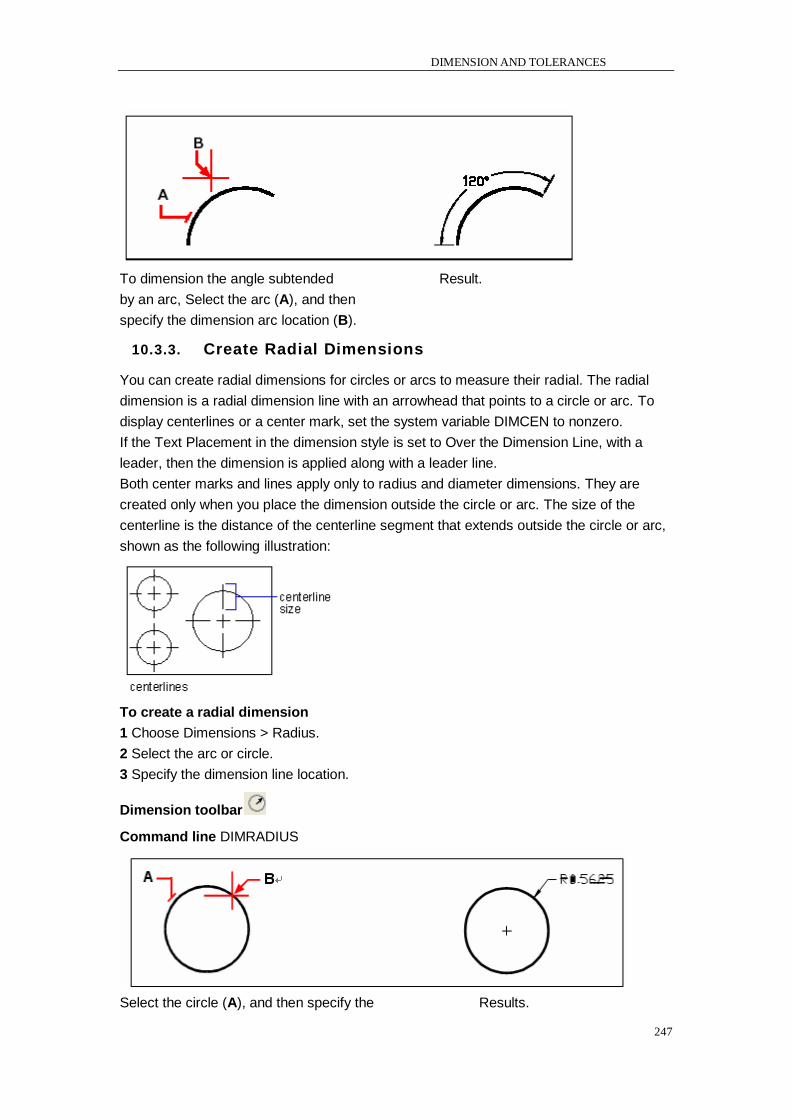
DIMENSION AND TOLERANCES
247
To dimension the angle subtended Result.
by an arc, Select the arc (A), and then
specify the dimension arc location (B).
10.3.3. Create Radial Dimensions
You can create radial dimensions for circles or arcs to measure their radial. The radial
dimension is a radial dimension line with an arrowhead that points to a circle or arc. To
display centerlines or a center mark, set the system variable DIMCEN to nonzero.
If the Text Placement in the dimension style is set to Over the Dimension Line, with a
leader, then the dimension is applied along with a leader line.
Both center marks and lines apply only to radius and diameter dimensions. They are
created only when you place the dimension outside the circle or arc. The size of the
centerline is the distance of the centerline segment that extends outside the circle or arc,
shown as the following illustration:
To create a radial dimension
1 Choose Dimensions > Radius.
2 Select the arc or circle.
3 Specify the dimension line location.
Dimension toolbar
Command line DIMRADIUS
Select the circle (A), and then specify the Results.
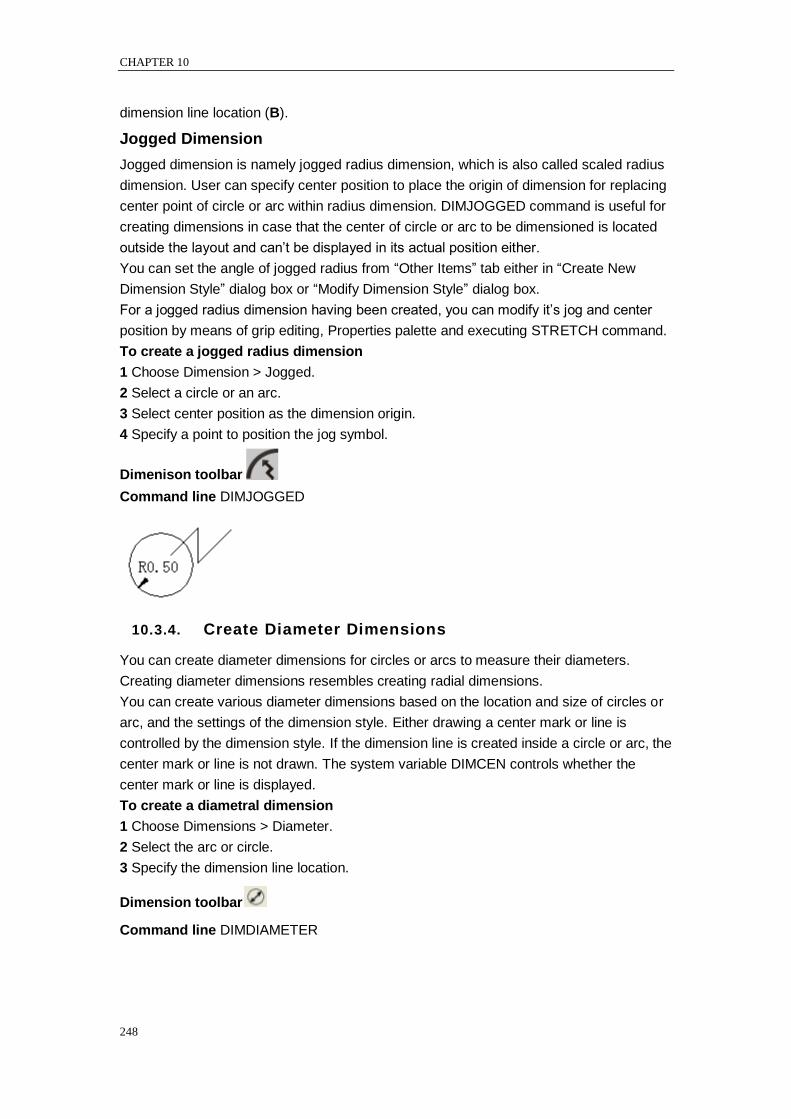
CHAPTER 10
248
dimension line location (B).
Jogged Dimension
Jogged dimension is namely jogged radius dimension, which is also called scaled radius
dimension. User can specify center position to place the origin of dimension for replacing
center point of circle or arc within radius dimension. DIMJOGGED command is useful for
creating dimensions in case that the center of circle or arc to be dimensioned is located
outside the layout and can‘t be displayed in its actual position either.
You can set the angle of jogged radius from ―Other Items‖ tab either in ―Create New
Dimension Style‖ dialog box or ―Modify Dimension Style‖ dialog box.
For a jogged radius dimension having been created, you can modify it‘s jog and center
position by means of grip editing, Properties palette and executing STRETCH command.
To create a jogged radius dimension
1 Choose Dimension > Jogged.
2 Select a circle or an arc.
3 Select center position as the dimension origin.
4 Specify a point to position the jog symbol.
Dimenison toolbar
Command line DIMJOGGED
10.3.4. Create Diameter Dimensions
You can create diameter dimensions for circles or arcs to measure their diameters.
Creating diameter dimensions resembles creating radial dimensions.
You can create various diameter dimensions based on the location and size of circles or
arc, and the settings of the dimension style. Either drawing a center mark or line is
controlled by the dimension style. If the dimension line is created inside a circle or arc, the
center mark or line is not drawn. The system variable DIMCEN controls whether the
center mark or line is displayed.
To create a diametral dimension
1 Choose Dimensions > Diameter.
2 Select the arc or circle.
3 Specify the dimension line location.
Dimension toolbar
Command line DIMDIAMETER
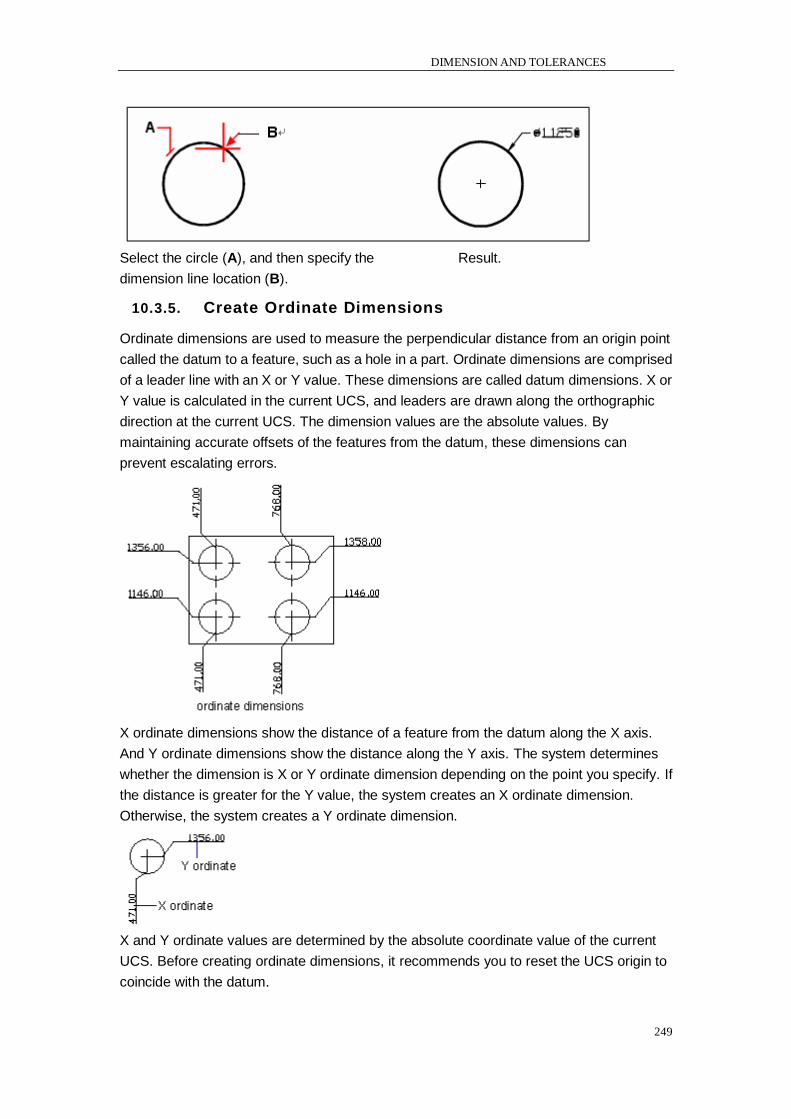
DIMENSION AND TOLERANCES
249
Select the circle (A), and then specify the Result.
dimension line location (B).
10.3.5. Create Ordinate Dimensions
Ordinate dimensions are used to measure the perpendicular distance from an origin point
called the datum to a feature, such as a hole in a part. Ordinate dimensions are comprised
of a leader line with an X or Y value. These dimensions are called datum dimensions. X or
Y value is calculated in the current UCS, and leaders are drawn along the orthographic
direction at the current UCS. The dimension values are the absolute values. By
maintaining accurate offsets of the features from the datum, these dimensions can
prevent escalating errors.
X ordinate dimensions show the distance of a feature from the datum along the X axis.
And Y ordinate dimensions show the distance along the Y axis. The system determines
whether the dimension is X or Y ordinate dimension depending on the point you specify. If
the distance is greater for the Y value, the system creates an X ordinate dimension.
Otherwise, the system creates a Y ordinate dimension.
X and Y ordinate values are determined by the absolute coordinate value of the current
UCS. Before creating ordinate dimensions, it recommends you to reset the UCS origin to
coincide with the datum.

CHAPTER 10
250
In ordinate dimensions, the dimension text is always aligned with the ordinate leader line,
ignoring the text orientation defined by the current dimension style. You can also supply
your own text or accept the default one.
To create an ordinate dimension
1 Choose Dimensions > Ordinate.
2 Select the point for ordinate dimension.
3 Specify the ordinate leader endpoint.
Dimension toolbar
Command line DIMORDINATE
Select the ordinate point (A), and then specify the ordinate leader endpoint (B).
TIP To select precise ordinate points, use entity snaps.
10.3.6. Create Quick Dimension
Creates or edits a series of dimensions quickly by typing QDIM command.
To create a quick dimension
1 Choose Dimensions > Quick Dimension.
2 Select the entity to dimension, then press Enter.
3 On the command line, it will display Specify dimension line position, or
[Continuous/Staggered/Baseline/Ordinate/Radius/Diameter/datumPoint/Edit]
<Continuous>:
You can type the command what you want. The default command is continuous.
Dimension toolbar
Command line QDIM
10.3.7. Create Arc Length Dimension
Arc length dimension is available for measuring the arc length of arc or polyline arc
segment. ZWCAD creates arc length dimension by specifying extension line position
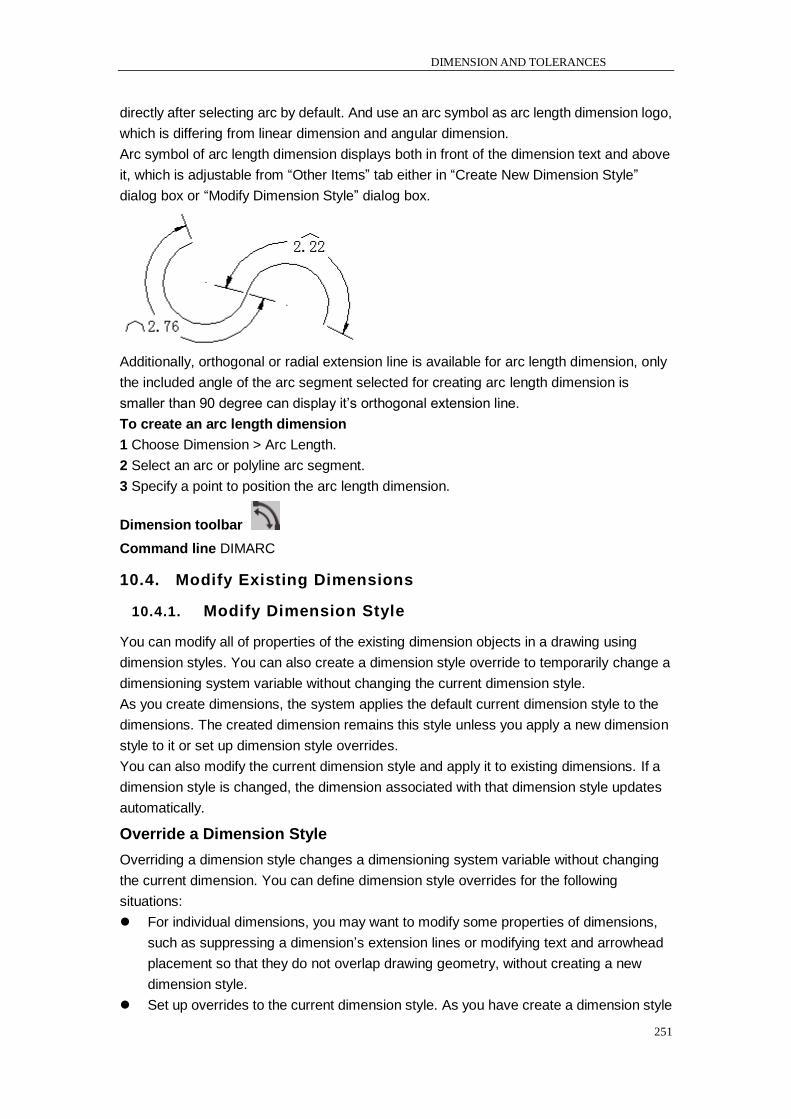
DIMENSION AND TOLERANCES
251
directly after selecting arc by default. And use an arc symbol as arc length dimension logo,
which is differing from linear dimension and angular dimension.
Arc symbol of arc length dimension displays both in front of the dimension text and above
it, which is adjustable from ―Other Items‖ tab either in ―Create New Dimension Style‖
dialog box or ―Modify Dimension Style‖ dialog box.
Additionally, orthogonal or radial extension line is available for arc length dimension, only
the included angle of the arc segment selected for creating arc length dimension is
smaller than 90 degree can display it‘s orthogonal extension line.
To create an arc length dimension
1 Choose Dimension > Arc Length.
2 Select an arc or polyline arc segment.
3 Specify a point to position the arc length dimension.
Dimension toolbar
Command line DIMARC
10.4. Modify Existing Dimensions
10.4.1. Modify Dimension Style
You can modify all of properties of the existing dimension objects in a drawing using
dimension styles. You can also create a dimension style override to temporarily change a
dimensioning system variable without changing the current dimension style.
As you create dimensions, the system applies the default current dimension style to the
dimensions. The created dimension remains this style unless you apply a new dimension
style to it or set up dimension style overrides.
You can also modify the current dimension style and apply it to existing dimensions. If a
dimension style is changed, the dimension associated with that dimension style updates
automatically.
Override a Dimension Style
Overriding a dimension style changes a dimensioning system variable without changing
the current dimension. You can define dimension style overrides for the following
situations:
For individual dimensions, you may want to modify some properties of dimensions,
such as suppressing a dimension‘s extension lines or modifying text and arrowhead
placement so that they do not overlap drawing geometry, without creating a new
dimension style.
Set up overrides to the current dimension style. As you have create a dimension style
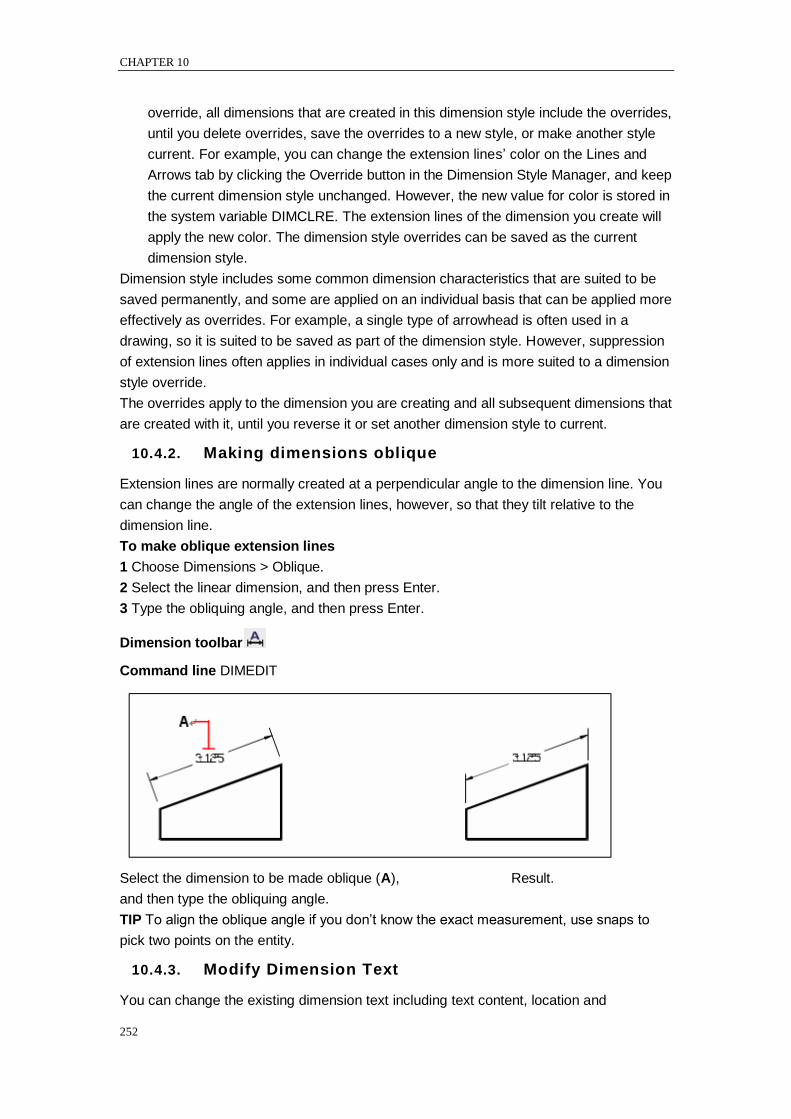
CHAPTER 10
252
override, all dimensions that are created in this dimension style include the overrides,
until you delete overrides, save the overrides to a new style, or make another style
current. For example, you can change the extension lines‘ color on the Lines and
Arrows tab by clicking the Override button in the Dimension Style Manager, and keep
the current dimension style unchanged. However, the new value for color is stored in
the system variable DIMCLRE. The extension lines of the dimension you create will
apply the new color. The dimension style overrides can be saved as the current
dimension style.
Dimension style includes some common dimension characteristics that are suited to be
saved permanently, and some are applied on an individual basis that can be applied more
effectively as overrides. For example, a single type of arrowhead is often used in a
drawing, so it is suited to be saved as part of the dimension style. However, suppression
of extension lines often applies in individual cases only and is more suited to a dimension
style override.
The overrides apply to the dimension you are creating and all subsequent dimensions that
are created with it, until you reverse it or set another dimension style to current.
10.4.2. Making dimensions oblique
Extension lines are normally created at a perpendicular angle to the dimension line. You
can change the angle of the extension lines, however, so that they tilt relative to the
dimension line.
To make oblique extension lines
1 Choose Dimensions > Oblique.
2 Select the linear dimension, and then press Enter.
3 Type the obliquing angle, and then press Enter.
Dimension toolbar
Command line DIMEDIT
Select the dimension to be made oblique (A), Result.
and then type the obliquing angle.
TIP To align the oblique angle if you don‘t know the exact measurement, use snaps to
pick two points on the entity.
10.4.3. Modify Dimension Text
You can change the existing dimension text including text content, location and
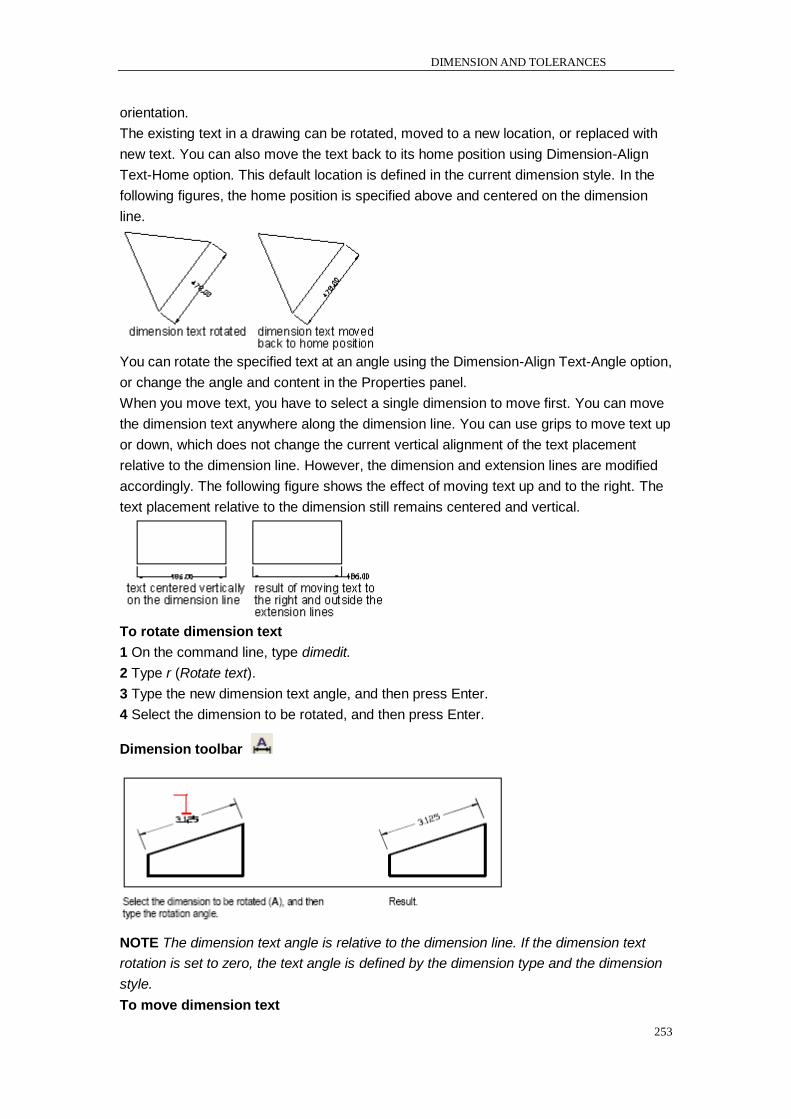
DIMENSION AND TOLERANCES
253
orientation.
The existing text in a drawing can be rotated, moved to a new location, or replaced with
new text. You can also move the text back to its home position using Dimension-Align
Text-Home option. This default location is defined in the current dimension style. In the
following figures, the home position is specified above and centered on the dimension
line.
You can rotate the specified text at an angle using the Dimension-Align Text-Angle option,
or change the angle and content in the Properties panel.
When you move text, you have to select a single dimension to move first. You can move
the dimension text anywhere along the dimension line. You can use grips to move text up
or down, which does not change the current vertical alignment of the text placement
relative to the dimension line. However, the dimension and extension lines are modified
accordingly. The following figure shows the effect of moving text up and to the right. The
text placement relative to the dimension still remains centered and vertical.
To rotate dimension text
1 On the command line, type dimedit.
2 Type r (Rotate text).
3 Type the new dimension text angle, and then press Enter.
4 Select the dimension to be rotated, and then press Enter.
Dimension toolbar
NOTE The dimension text angle is relative to the dimension line. If the dimension text
rotation is set to zero, the text angle is defined by the dimension type and the dimension
style.
To move dimension text
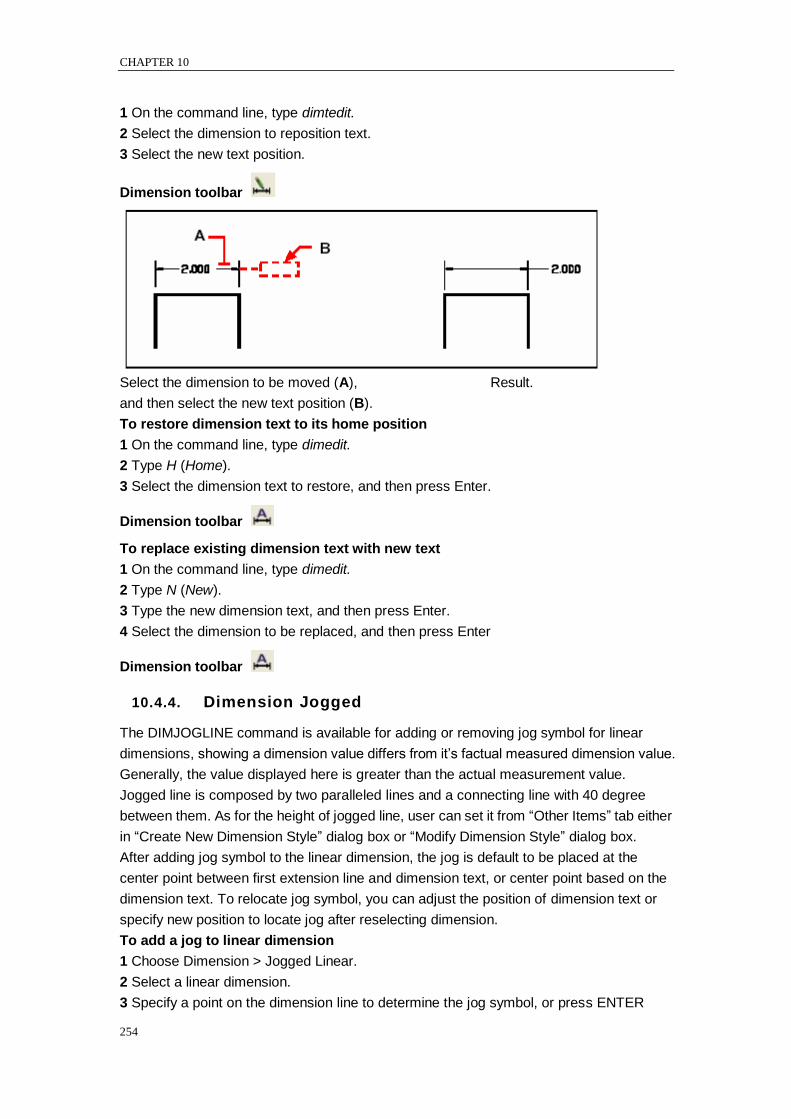
CHAPTER 10
254
1 On the command line, type dimtedit.
2 Select the dimension to reposition text.
3 Select the new text position.
Dimension toolbar
Select the dimension to be moved (A), Result.
and then select the new text position (B).
To restore dimension text to its home position
1 On the command line, type dimedit.
2 Type H (Home).
3 Select the dimension text to restore, and then press Enter.
Dimension toolbar
To replace existing dimension text with new text
1 On the command line, type dimedit.
2 Type N (New).
3 Type the new dimension text, and then press Enter.
4 Select the dimension to be replaced, and then press Enter
Dimension toolbar
10.4.4. Dimension Jogged
The DIMJOGLINE command is available for adding or removing jog symbol for linear
dimensions, showing a dimension value differs from it‘s factual measured dimension value.
Generally, the value displayed here is greater than the actual measurement value.
Jogged line is composed by two paralleled lines and a connecting line with 40 degree
between them. As for the height of jogged line, user can set it from ―Other Items‖ tab either
in ―Create New Dimension Style‖ dialog box or ―Modify Dimension Style‖ dialog box.
After adding jog symbol to the linear dimension, the jog is default to be placed at the
center point between first extension line and dimension text, or center point based on the
dimension text. To relocate jog symbol, you can adjust the position of dimension text or
specify new position to locate jog after reselecting dimension.
To add a jog to linear dimension
1 Choose Dimension > Jogged Linear.
2 Select a linear dimension.
3 Specify a point on the dimension line to determine the jog symbol, or press ENTER

DIMENSION AND TOLERANCES
255
directly to position the jog symbol in default place.
Dimension toolbar
Command line DIMJOGLINE
10.4.5. Dimension Inspection
You can add or remove dimension inspection for existing dimensions. For transmitting the
frequency of inspecting the part being dimensioned, the dimension value and parts
tolerance are ensured to be within specified range.
Dimension inspection can be added to any type of dimension objects, which is composed
by a frame and internal text. You can specify the shape of inspection frame as round,
angular or none. An inspection dimension contains utmost three kinds of information field:
inspection tag, dimension value and inspection rate. Using a perpendicular line to divide
the dimension information among each field.
In which, inspection tag, used for mark the text of dimension inspection is located at the
left side within the inspection frame.
Dimension value here is the value before adding dimension inspection, which is located at
the central part of the inspection dimension including tolerance, text and measurement
value.
Inspection rate which is expressed by percentage is located at the right side within the
inspection frame, indicates required frequency of the part being created.
After adding dimension inspection, user can modify current value of inspection dimension
through Geometry option of Properties palette, including frame shape, tag and inspection
rate.
To create an inspection dimension
1 Choose Dimension > Inspection.
2 On the Inspection dimension dialog box, click Select(S) dimensions button.
3 Close Inspection dimension dialog box temporarily to switch to drawing area, select
dimensions to add dimension inspection, press ENTER when finished selecting and turn
back to dialog box.
4 Select shape for frame from the Shape option.
5 Click Label option to input label in the text box.
CHAPTER 10
256
6 Click Inspection rate option to input a value in the text box.
7 Click OK.
Dimension toolbar
Command line DIMINSPECT
To remove an inspection dimension
1 Choose Dimension > Inspection.
2 On the Inspection dimension dialog box, click Select(S) dimensions button.
3 Close Inspection dimension dialog box temporarily to switch to drawing area, select
dimensions to remove dimension inspection, press ENTER when finished selecting and
turn back to dialog box.
4 Click Remove(E) inspection button.
5 Click OK.
Dimension toolbar
Command line DIMINSPECT
10.4.6. Adjust Dimension Space
Once you have created multiple paralleled linear dimensions or angular dimensions, you
can adjust the space among these paralleled lines with an equal value either default or
specified.
Various methods are available for creating paralleled linear dimensions and angular
dimensions. Either using DIMLINEAR and DIMANGULAR to create dimension one at a
time or executing DIMBASELINE and DIMCONTINUE to place other linear dimensions or
angular dimensions according to the linear dimension or angular dimension previously
created.
When using DIMBASELINE for creating baseline dimensions, the space between each
dimensions is the identical, which is controlled by system variable DIMDLI, but the
variable is only applied to control dimension space for the subsequent dimension space. If
you adjust dimension space by changing the size of dimension text is changed only, or
adjusting the dimension scale other than changing the position of dimension line, then the
dimension line is likely to be overlapped with text.
DIMSPACE command is also available for adjusting the space among paralleled linear or
angular dimensions or overlapped dimensions automatically in case that the original
space is not equal values.
It should be noticed when adjusting dimension space, the dimensions you select must be
of the same type, for example, either all of linear dimensions or angular dimensions.
Additionally, these dimensions must be paralleled, or share the same origin and placed at
the extension line of one another.
If you set the space value to 0 when adjusting space among dimensions, you can align
selected dimensions at the dimension line. If specify the space as Auto, dimension space
among them is default to twice of the text height. To modify the text height, you can set
from Text tab on Modify dimension style dialog box.

DIMENSION AND TOLERANCES
257
10.4.7. Dimension Break
Break the dimension or extension line, as it disappeared at the intersect point.
The break size can be set automatically or manually, and the and the options for adding breaks can
be set according to the number of intersecting object crossed the dimension and the extension line.
Dimensions for adding dimension breaks:
Linear (including align dimension and jogged dimension)
Angular(2-point or 3-point dimension)
Diameter and Radius
Ordinate
Arc Length
NOTE:Unsupported dimension including
Exceptions in Dimension Break:
Dimension break in block is not supported. That means the object in the block can not be
treated as dimension break ones.
Dimension breaks on arrowhead and text are not supported, that means the dimension break
can not place on dimension arrowhead or text.
Auto dimension breaks on trans-spatial dimension or object are unsupported, but the manual
ones are supported.
The following object can be treated as break object on adding dimension breaks:
Dimension
Leader
Line
Circle
Ellipse
Spline
Polyline
Text
Multiline Text
Block(Limited to the above mentioned object)
Dimension toolbar:
Command line: DIMBREAK
Auto dimension break
To create an auto dimension break, please select a dimension and use Auto in DIMBREAK
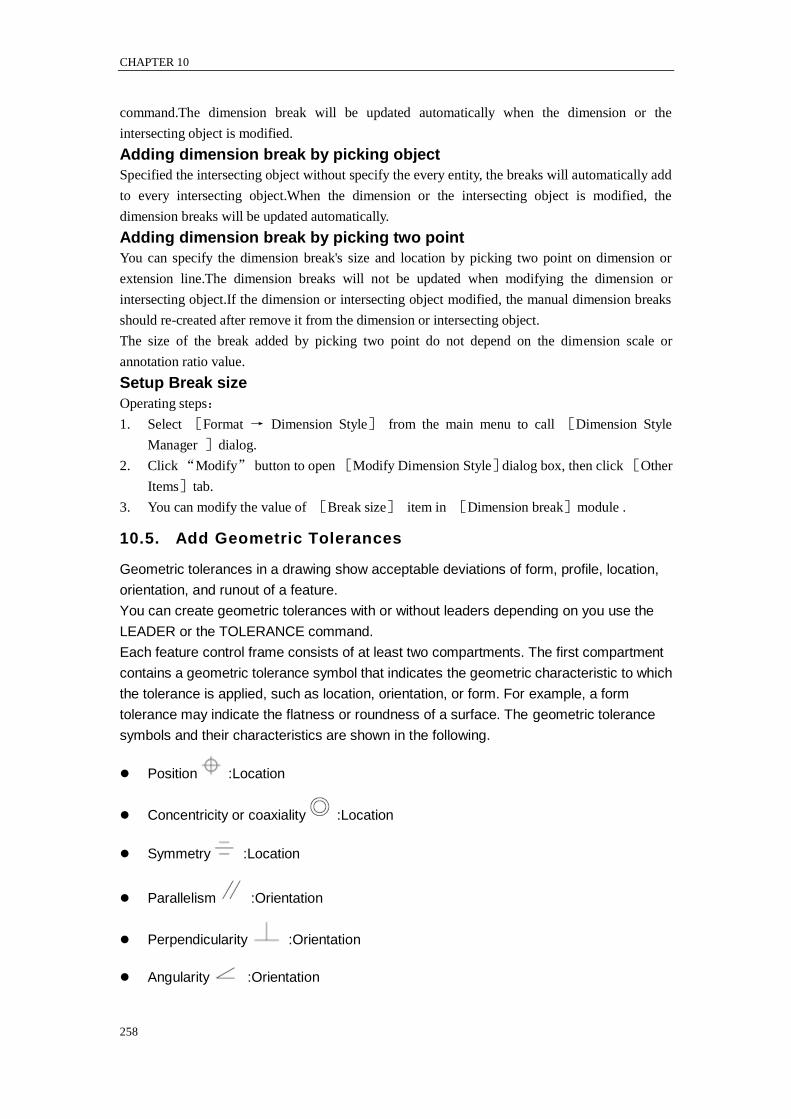
CHAPTER 10
258
command.The dimension break will be updated automatically when the dimension or the
intersecting object is modified.
Adding dimension break by picking object
Specified the intersecting object without specify the every entity, the breaks will automatically add
to every intersecting object.When the dimension or the intersecting object is modified, the
dimension breaks will be updated automatically.
Adding dimension break by picking two point
You can specify the dimension break's size and location by picking two point on dimension or
extension line.The dimension breaks will not be updated when modifying the dimension or
intersecting object.If the dimension or intersecting object modified, the manual dimension breaks
should re-created after remove it from the dimension or intersecting object.
The size of the break added by picking two point do not depend on the dimension scale or
annotation ratio value.
Setup Break size
Operating steps:
1. Select [Format → Dimension Style] from the main menu to call [Dimension Style
Manager ]dialog.
2. Click “Modify” button to open [Modify Dimension Style]dialog box, then click [Other
Items]tab.
3. You can modify the value of [Break size] item in [Dimension break]module .
10.5. Add Geometric Tolerances
Geometric tolerances in a drawing show acceptable deviations of form, profile, location,
orientation, and runout of a feature.
You can create geometric tolerances with or without leaders depending on you use the
LEADER or the TOLERANCE command.
Each feature control frame consists of at least two compartments. The first compartment
contains a geometric tolerance symbol that indicates the geometric characteristic to which
the tolerance is applied, such as location, orientation, or form. For example, a form
tolerance may indicate the flatness or roundness of a surface. The geometric tolerance
symbols and their characteristics are shown in the following.
Position :Location
Concentricity or coaxiality :Location
Symmetry :Location
Parallelism :Orientation
Perpendicularity :Orientation
Angularity :Orientation
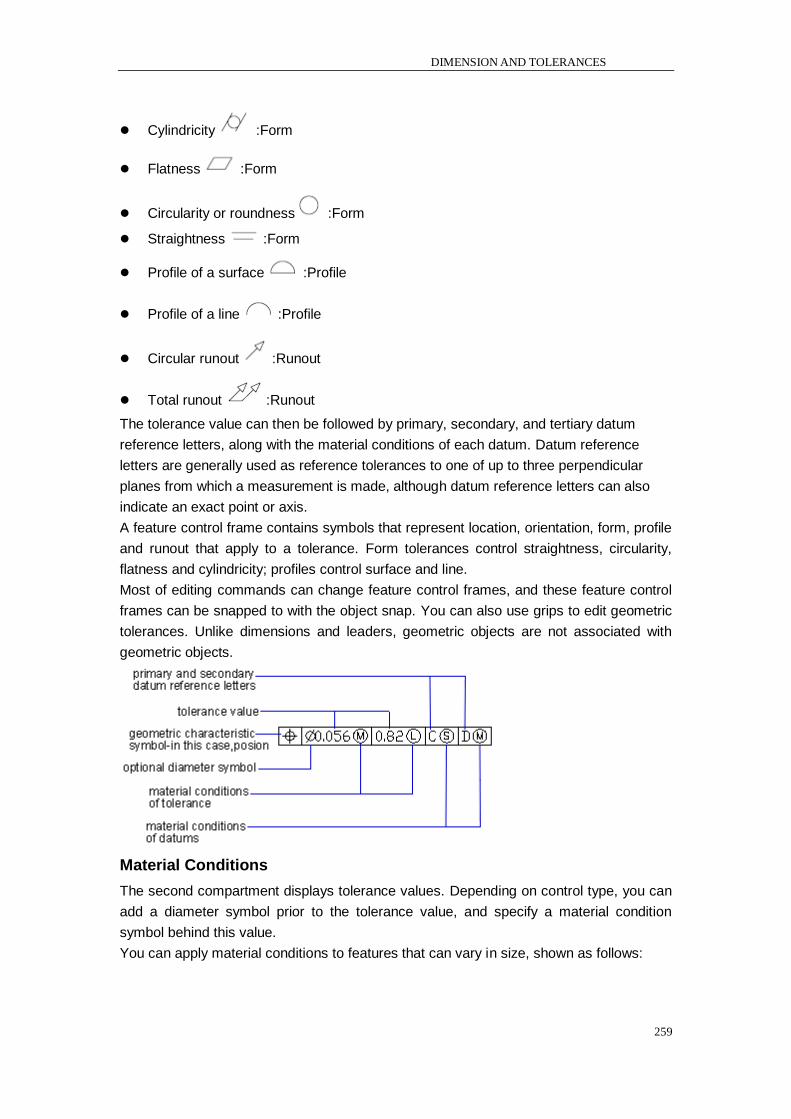
DIMENSION AND TOLERANCES
259
Cylindricity :Form
Flatness :Form
Circularity or roundness :Form
Straightness :Form
Profile of a surface :Profile
Profile of a line :Profile
Circular runout :Runout
Total runout :Runout
The tolerance value can then be followed by primary, secondary, and tertiary datum
reference letters, along with the material conditions of each datum. Datum reference
letters are generally used as reference tolerances to one of up to three perpendicular
planes from which a measurement is made, although datum reference letters can also
indicate an exact point or axis.
A feature control frame contains symbols that represent location, orientation, form, profile
and runout that apply to a tolerance. Form tolerances control straightness, circularity,
flatness and cylindricity; profiles control surface and line.
Most of editing commands can change feature control frames, and these feature control
frames can be snapped to with the object snap. You can also use grips to edit geometric
tolerances. Unlike dimensions and leaders, geometric objects are not associated with
geometric objects.
Material Conditions
The second compartment displays tolerance values. Depending on control type, you can
add a diameter symbol prior to the tolerance value, and specify a material condition
symbol behind this value.
You can apply material conditions to features that can vary in size, shown as follows:
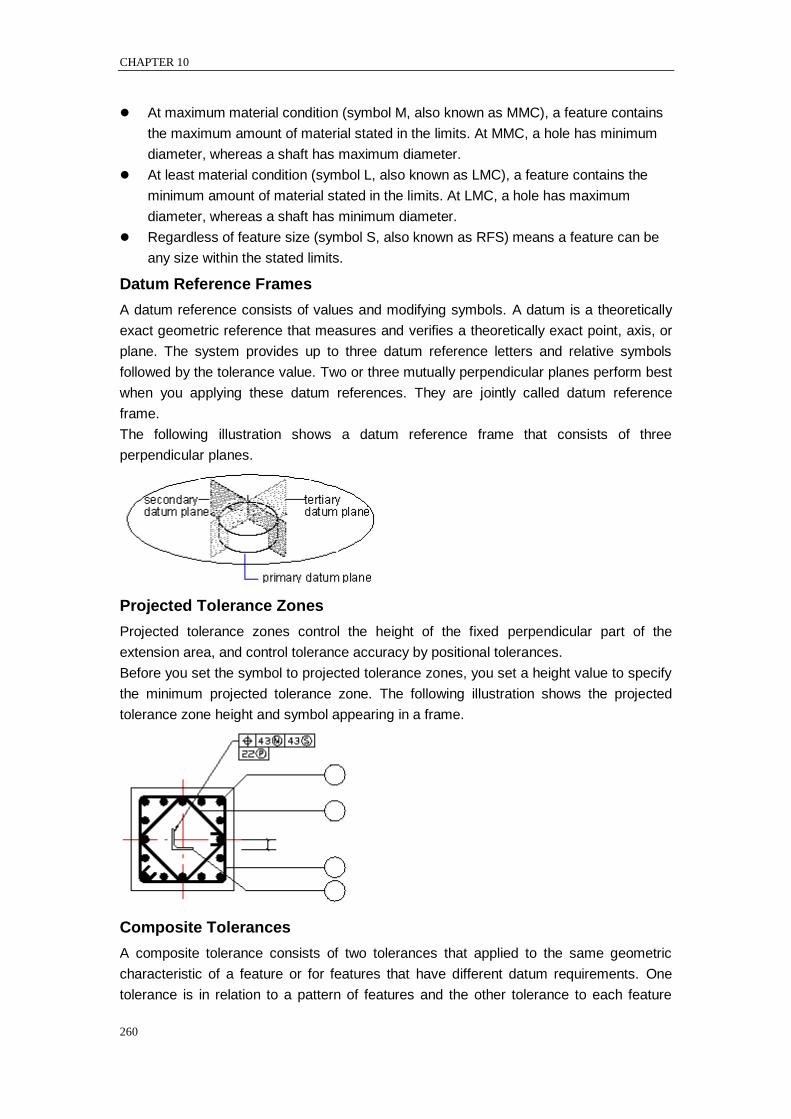
CHAPTER 10
260
At maximum material condition (symbol M, also known as MMC), a feature contains
the maximum amount of material stated in the limits. At MMC, a hole has minimum
diameter, whereas a shaft has maximum diameter.
At least material condition (symbol L, also known as LMC), a feature contains the
minimum amount of material stated in the limits. At LMC, a hole has maximum
diameter, whereas a shaft has minimum diameter.
Regardless of feature size (symbol S, also known as RFS) means a feature can be
any size within the stated limits.
Datum Reference Frames
A datum reference consists of values and modifying symbols. A datum is a theoretically
exact geometric reference that measures and verifies a theoretically exact point, axis, or
plane. The system provides up to three datum reference letters and relative symbols
followed by the tolerance value. Two or three mutually perpendicular planes perform best
when you applying these datum references. They are jointly called datum reference
frame.
The following illustration shows a datum reference frame that consists of three
perpendicular planes.
Projected Tolerance Zones
Projected tolerance zones control the height of the fixed perpendicular part of the
extension area, and control tolerance accuracy by positional tolerances.
Before you set the symbol to projected tolerance zones, you set a height value to specify
the minimum projected tolerance zone. The following illustration shows the projected
tolerance zone height and symbol appearing in a frame.
Composite Tolerances
A composite tolerance consists of two tolerances that applied to the same geometric
characteristic of a feature or for features that have different datum requirements. One
tolerance is in relation to a pattern of features and the other tolerance to each feature
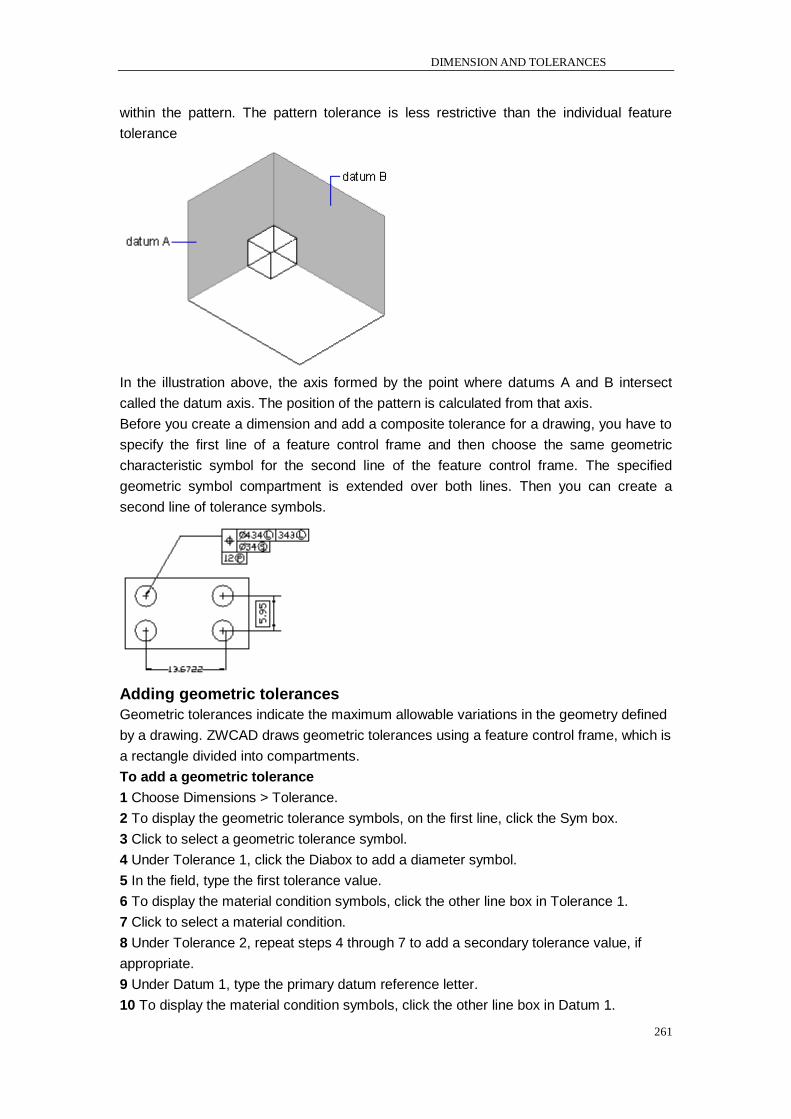
DIMENSION AND TOLERANCES
261
within the pattern. The pattern tolerance is less restrictive than the individual feature
tolerance
In the illustration above, the axis formed by the point where datums A and B intersect
called the datum axis. The position of the pattern is calculated from that axis.
Before you create a dimension and add a composite tolerance for a drawing, you have to
specify the first line of a feature control frame and then choose the same geometric
characteristic symbol for the second line of the feature control frame. The specified
geometric symbol compartment is extended over both lines. Then you can create a
second line of tolerance symbols.
Adding geometric tolerances
Geometric tolerances indicate the maximum allowable variations in the geometry defined
by a drawing. ZWCAD draws geometric tolerances using a feature control frame, which is
a rectangle divided into compartments.
To add a geometric tolerance
1 Choose Dimensions > Tolerance.
2 To display the geometric tolerance symbols, on the first line, click the Sym box.
3 Click to select a geometric tolerance symbol.
4 Under Tolerance 1, click the Diabox to add a diameter symbol.
5 In the field, type the first tolerance value.
6 To display the material condition symbols, click the other line box in Tolerance 1.
7 Click to select a material condition.
8 Under Tolerance 2, repeat steps 4 through 7 to add a secondary tolerance value, if
appropriate.
9 Under Datum 1, type the primary datum reference letter.
10 To display the material condition symbols, click the other line box in Datum 1.
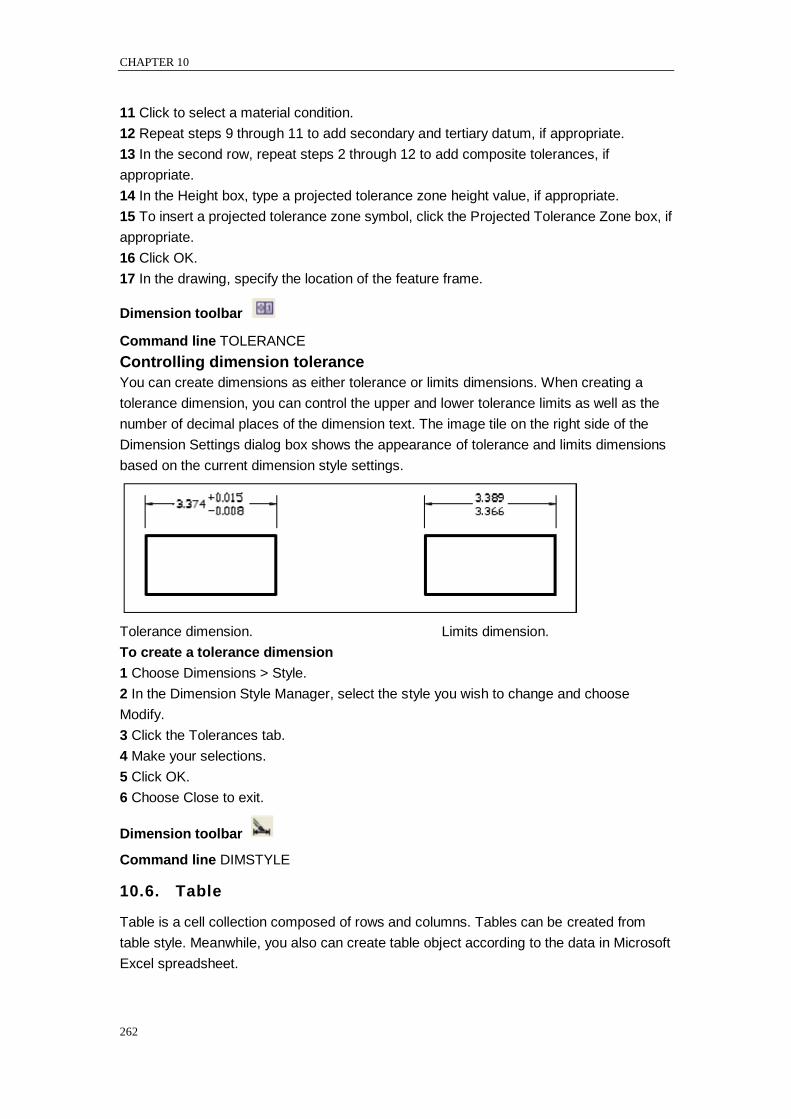
CHAPTER 10
262
11 Click to select a material condition.
12 Repeat steps 9 through 11 to add secondary and tertiary datum, if appropriate.
13 In the second row, repeat steps 2 through 12 to add composite tolerances, if
appropriate.
14 In the Height box, type a projected tolerance zone height value, if appropriate.
15 To insert a projected tolerance zone symbol, click the Projected Tolerance Zone box, if
appropriate.
16 Click OK.
17 In the drawing, specify the location of the feature frame.
Dimension toolbar
Command line TOLERANCE
Controlling dimension tolerance
You can create dimensions as either tolerance or limits dimensions. When creating a
tolerance dimension, you can control the upper and lower tolerance limits as well as the
number of decimal places of the dimension text. The image tile on the right side of the
Dimension Settings dialog box shows the appearance of tolerance and limits dimensions
based on the current dimension style settings.
Tolerance dimension. Limits dimension.
To create a tolerance dimension
1 Choose Dimensions > Style.
2 In the Dimension Style Manager, select the style you wish to change and choose
Modify.
3 Click the Tolerances tab.
4 Make your selections.
5 Click OK.
6 Choose Close to exit.
Dimension toolbar
Command line DIMSTYLE
10.6. Table
Table is a cell collection composed of rows and columns. Tables can be created from
table style. Meanwhile, you also can create table object according to the data in Microsoft
Excel spreadsheet.
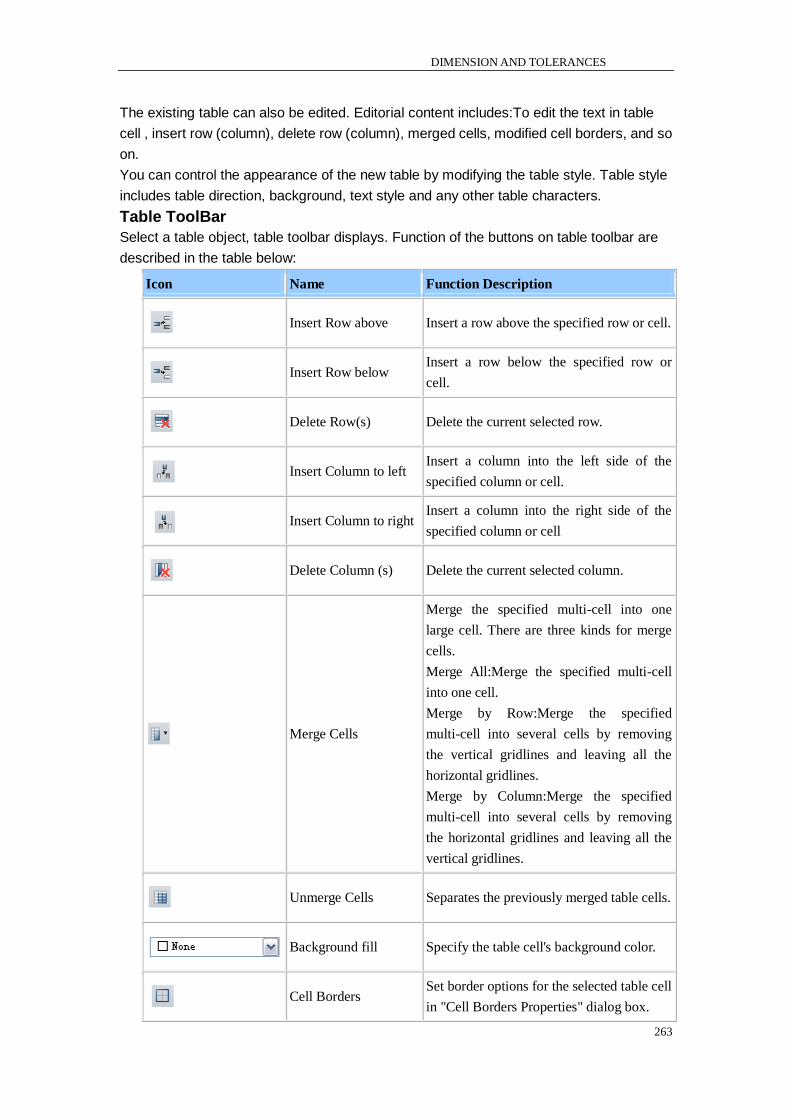
DIMENSION AND TOLERANCES
263
The existing table can also be edited. Editorial content includes:To edit the text in table
cell , insert row (column), delete row (column), merged cells, modified cell borders, and so
on.
You can control the appearance of the new table by modifying the table style. Table style
includes table direction, background, text style and any other table characters.
Table ToolBar
Select a table object, table toolbar displays. Function of the buttons on table toolbar are
described in the table below:
Icon Name Function Description
Insert Row above Insert a row above the specified row or cell.
Insert Row below Insert a row below the specified row or
cell.
Delete Row(s) Delete the current selected row.
Insert Column to left Insert a column into the left side of the
specified column or cell.
Insert Column to right Insert a column into the right side of the
specified column or cell
Delete Column (s) Delete the current selected column.
Merge Cells
Merge the specified multi-cell into one
large cell. There are three kinds for merge
cells.
Merge All:Merge the specified multi-cell
into one cell.
Merge by Row:Merge the specified
multi-cell into several cells by removing
the vertical gridlines and leaving all the
horizontal gridlines.
Merge by Column:Merge the specified
multi-cell into several cells by removing
the horizontal gridlines and leaving all the
vertical gridlines.
Unmerge Cells Separates the previously merged table cells.
Background fill Specify the table cell's background color.
Cell Borders Set border options for the selected table cell
in "Cell Borders Properties" dialog box.
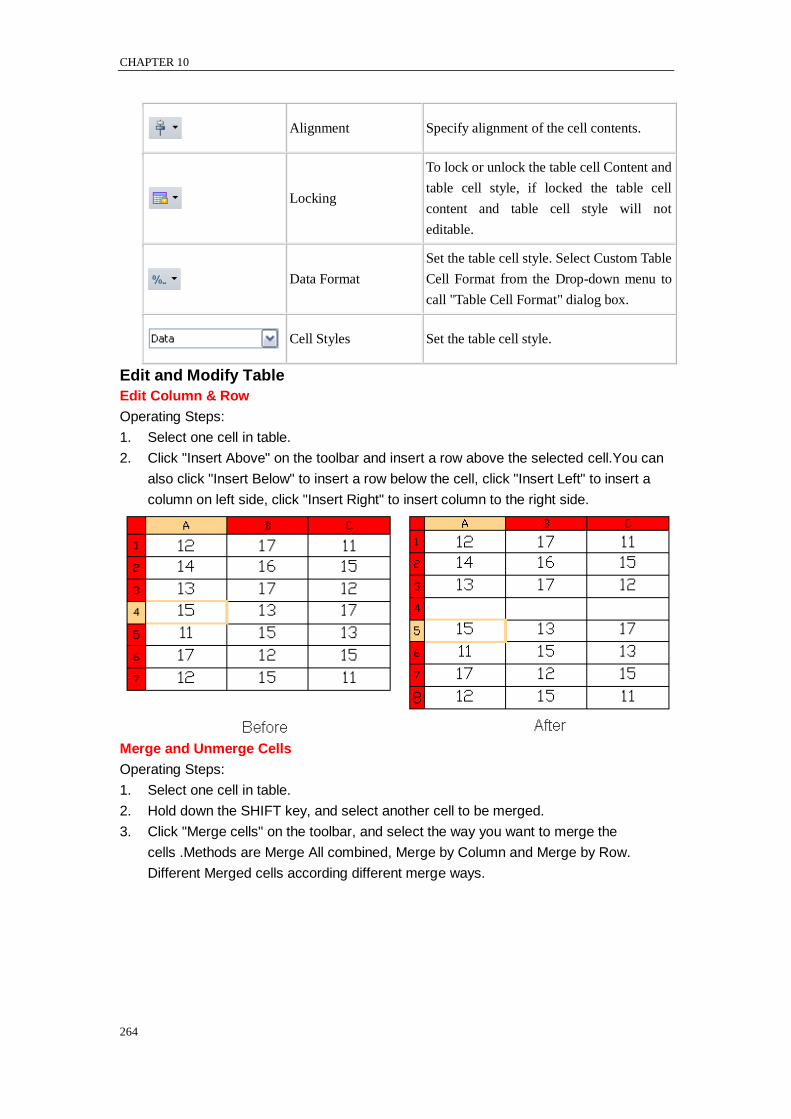
CHAPTER 10
264
Alignment Specify alignment of the cell contents.
Locking
To lock or unlock the table cell Content and
table cell style, if locked the table cell
content and table cell style will not
editable.
Data Format
Set the table cell style. Select Custom Table
Cell Format from the Drop-down menu to
call "Table Cell Format" dialog box.
Cell Styles Set the table cell style.
Edit and Modify Table
Edit Column & Row
Operating Steps:
1. Select one cell in table.
2. Click "Insert Above" on the toolbar and insert a row above the selected cell.You can
also click "Insert Below" to insert a row below the cell, click "Insert Left" to insert a
column on left side, click "Insert Right" to insert column to the right side.
Merge and Unmerge Cells
Operating Steps:
1. Select one cell in table.
2. Hold down the SHIFT key, and select another cell to be merged.
3. Click "Merge cells" on the toolbar, and select the way you want to merge the
cells .Methods are Merge All combined, Merge by Column and Merge by Row.
Different Merged cells according different merge ways.
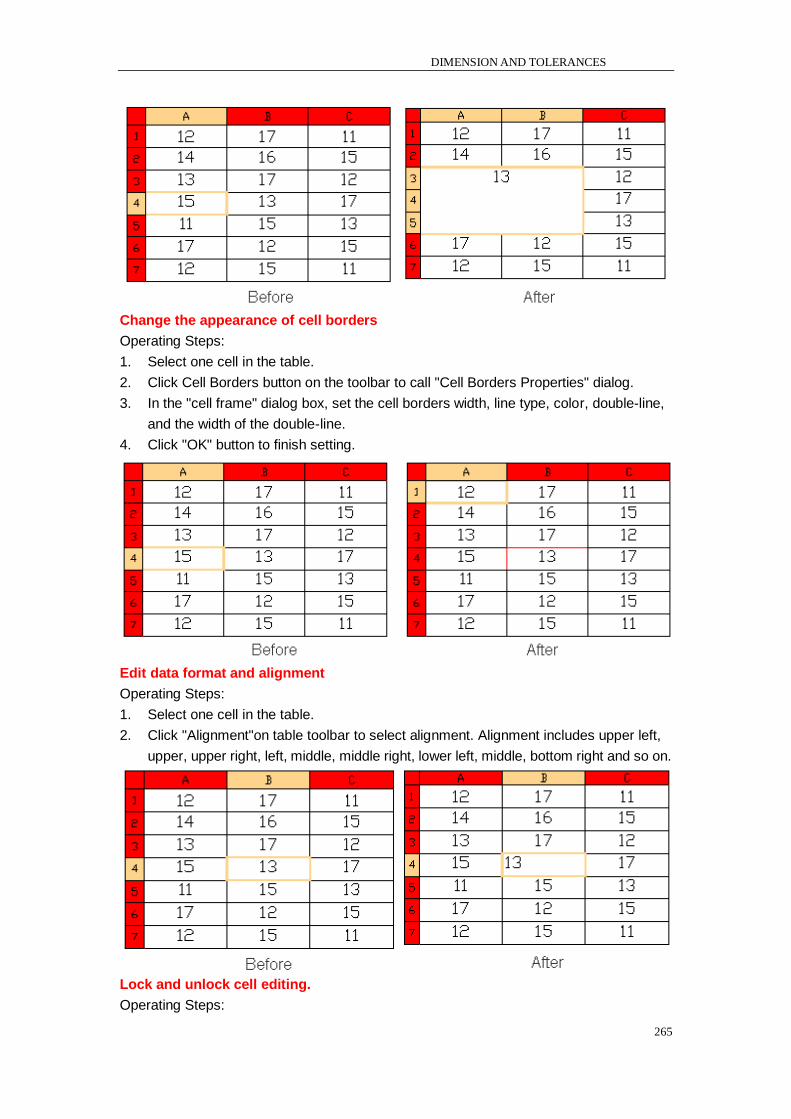
DIMENSION AND TOLERANCES
265
Change the appearance of cell borders
Operating Steps:
1. Select one cell in the table.
2. Click Cell Borders button on the toolbar to call "Cell Borders Properties" dialog.
3. In the "cell frame" dialog box, set the cell borders width, line type, color, double-line,
and the width of the double-line.
4. Click "OK" button to finish setting.
Edit data format and alignment
Operating Steps:
1. Select one cell in the table.
2. Click "Alignment"on table toolbar to select alignment. Alignment includes upper left,
upper, upper right, left, middle, middle right, lower left, middle, bottom right and so on.
Lock and unlock cell editing.
Operating Steps:
CHAPTER 10
266
1. Select one cell in the table.
2. Click "Lock" button on the toolbar and select the unlock or lock mode. Locking
methods includes Content Locked, Format Locked and Content and Format Locked.
Content can not be locked after the content, format, lock will not be edited on the
Format Cells.And the lock on the content or format, need to unlock before you can
edit.
Insert Field
Operating Steps:
1. Click the table in one cell.
2. Click the table toolbar "Insert Field" button,
3. In the "Field" dialog box, select the field types and field format, click "OK" button,
complete the fields inserted.
Create and Modify Table Styles
Operating Steps:
1. Click on the toolbar form the "cell style" drop-down list, select "Manage Cell Styles",
"Manage Cell Styles" dialog box displays.
2. Click the "snap style" dialog box "New" button, "Create New Cell Style" dialog box
displays.
3. Specify a name for the new cell style, and select an existing style to default the new
style. Create "Continue" to go on creating the cell style.
Table Toolbar:
Command Line: TABLE
BLOCKS ATTRIBUTE AND XREFS
267
11. Blocks, Attribute and Xrefs
11.1. Create and Insert Blocks
Usually, blocks are several objects combined into one that you can insert into a drawing
and manipulate as a single object. A block can consist of visible objects such as lines,
arcs, and circles, as well as visible or invisible data called attributes. Blocks are stored as
part of the drawing file.
Blocks can help you better organize your work, quickly create and revise drawings, and
reduce drawing file size. After you create a block from multiple objects, you save it once,
which also saves disk space. You can change the block definition to quickly revise a
drawing, and then update all instances of the block.
If you insert a block that contains objects originally drawn on layer 0 and assigned color
and linetype BYLAYER, it is placed on the current layer and assumes the color and
linetype of that layer. If you insert a block that contains objects originally drawn on other
layers or with explicitly specified colors or linetypes, the block retains the original settings.
If you insert a block that contains objects originally assigned color and linetype BYBLOCK,
and the block itself has the color and linetype BYLAYER, those objects adopt the color
and linetype of the layer onto which they are inserted. If the block is assigned an explicit
color or linetype, such as red or dashed, those objects adopt those qualities.
A procedure called nesting occurs when you include other blocks in a new block that you
are creating. Nesting is useful when you want to combine and include small components,
such as nuts and bolts, into a larger assembly and you need to insert multiple instances of
that assembly into an even larger drawing.
11.1.1. Create Blocks
ZWCAD provides various methods to create blocks, and insert the block into a drawing
more times as you need. With this method, you can create blocks as soon as
possible.You can use several methods to create blocks:
Combine objects to create a block definition in your current drawing.
Create a drawing file and later insert it as a block in other drawings.
Objects drawn on several layers with various colors, linetypes, and lineweight properties
can be combined into a block. Once a block is inserted into the drawing, the block
reference preserves information about the original layer, color, and linetype properties of
the objects that are contained in the block although it is always displayed on the current
layer. Whether to retain their original properties or inherit their properties such as color,
linetype, or lineweight settings from the current layer for objects is controllable. To remove
unused block definitions from a drawing, use PURGE command.
When defining blocks, you should define the block name, objects to be contained in the
block, the coordinate values of the base point to be used for inserting the block, and any
associated attribute data.
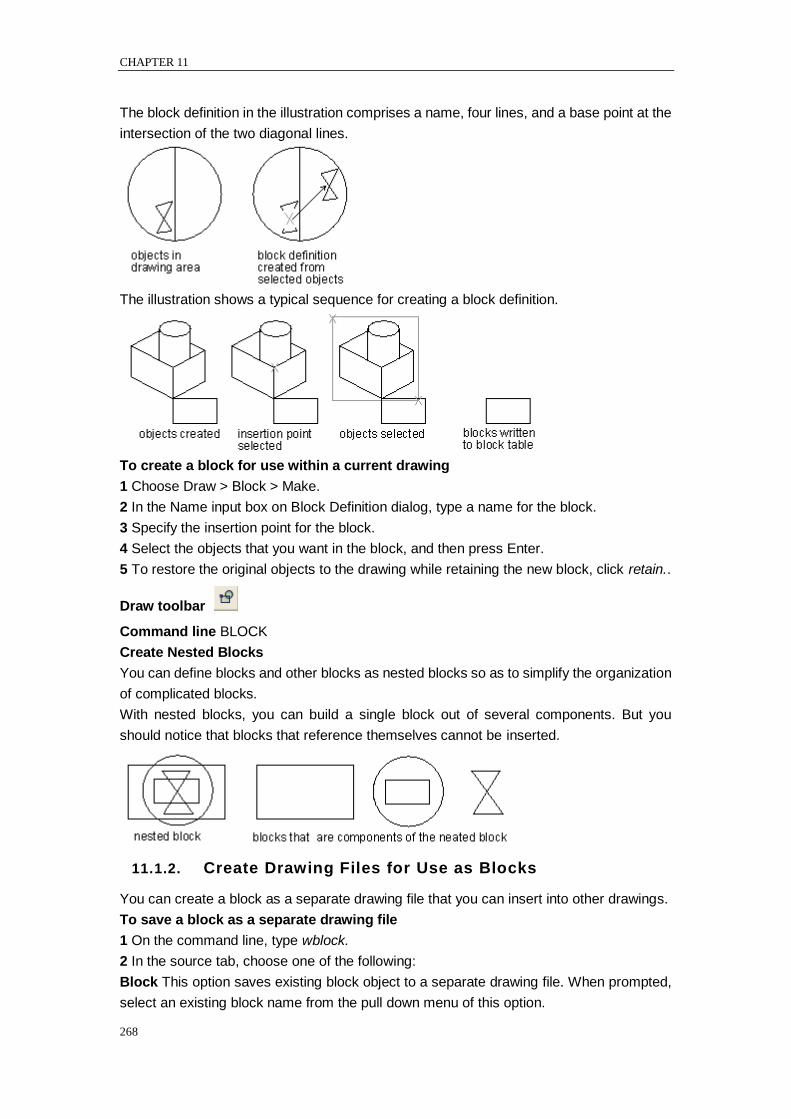
CHAPTER 11
268
The block definition in the illustration comprises a name, four lines, and a base point at the
intersection of the two diagonal lines.
The illustration shows a typical sequence for creating a block definition.
To create a block for use within a current drawing
1 Choose Draw > Block > Make.
2 In the Name input box on Block Definition dialog, type a name for the block.
3 Specify the insertion point for the block.
4 Select the objects that you want in the block, and then press Enter.
5 To restore the original objects to the drawing while retaining the new block, click retain..
Draw toolbar
Command line BLOCK
Create Nested Blocks
You can define blocks and other blocks as nested blocks so as to simplify the organization
of complicated blocks.
With nested blocks, you can build a single block out of several components. But you
should notice that blocks that reference themselves cannot be inserted.
11.1.2. Create Drawing Files for Use as Blocks
You can create a block as a separate drawing file that you can insert into other drawings.
To save a block as a separate drawing file
1 On the command line, type wblock.
2 In the source tab, choose one of the following:
Block This option saves existing block object to a separate drawing file. When prompted,
select an existing block name from the pull down menu of this option.
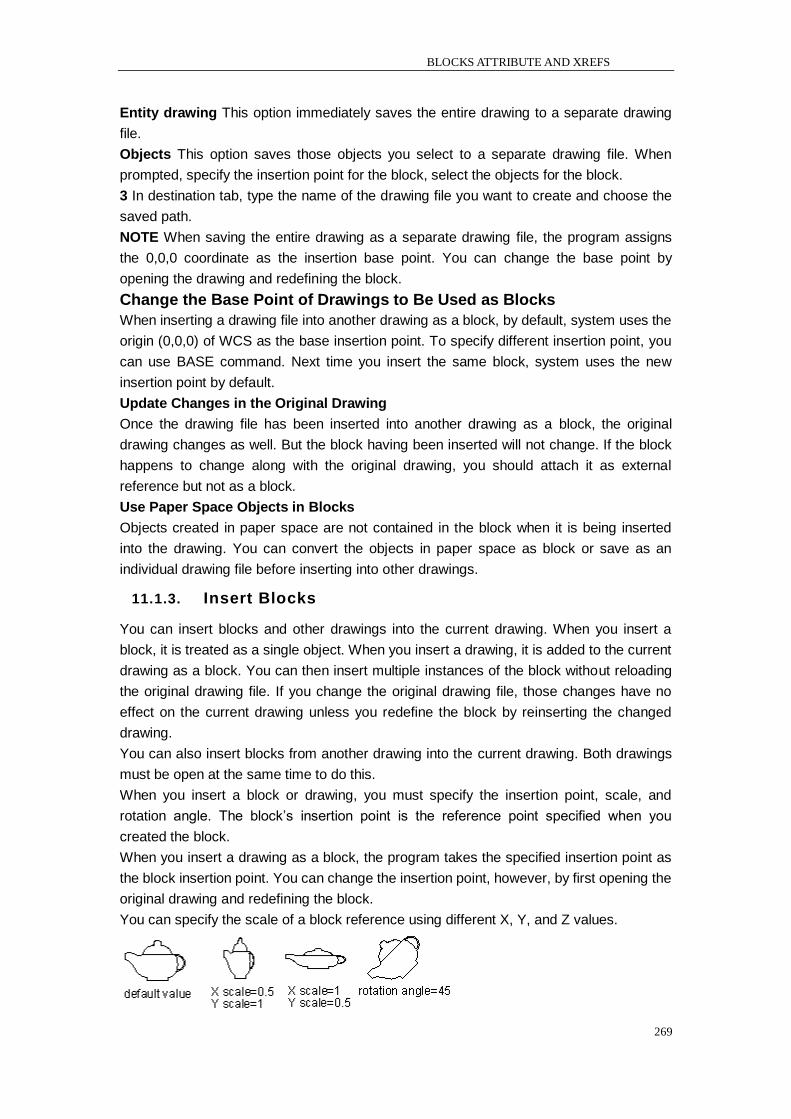
BLOCKS ATTRIBUTE AND XREFS
269
Entity drawing This option immediately saves the entire drawing to a separate drawing
file.
Objects This option saves those objects you select to a separate drawing file. When
prompted, specify the insertion point for the block, select the objects for the block.
3 In destination tab, type the name of the drawing file you want to create and choose the
saved path.
NOTE When saving the entire drawing as a separate drawing file, the program assigns
the 0,0,0 coordinate as the insertion base point. You can change the base point by
opening the drawing and redefining the block.
Change the Base Point of Drawings to Be Used as Blocks
When inserting a drawing file into another drawing as a block, by default, system uses the
origin (0,0,0) of WCS as the base insertion point. To specify different insertion point, you
can use BASE command. Next time you insert the same block, system uses the new
insertion point by default.
Update Changes in the Original Drawing
Once the drawing file has been inserted into another drawing as a block, the original
drawing changes as well. But the block having been inserted will not change. If the block
happens to change along with the original drawing, you should attach it as external
reference but not as a block.
Use Paper Space Objects in Blocks
Objects created in paper space are not contained in the block when it is being inserted
into the drawing. You can convert the objects in paper space as block or save as an
individual drawing file before inserting into other drawings.
11.1.3. Insert Blocks
You can insert blocks and other drawings into the current drawing. When you insert a
block, it is treated as a single object. When you insert a drawing, it is added to the current
drawing as a block. You can then insert multiple instances of the block without reloading
the original drawing file. If you change the original drawing file, those changes have no
effect on the current drawing unless you redefine the block by reinserting the changed
drawing.
You can also insert blocks from another drawing into the current drawing. Both drawings
must be open at the same time to do this.
When you insert a block or drawing, you must specify the insertion point, scale, and
rotation angle. The block‘s insertion point is the reference point specified when you
created the block.
When you insert a drawing as a block, the program takes the specified insertion point as
the block insertion point. You can change the insertion point, however, by first opening the
original drawing and redefining the block.
You can specify the scale of a block reference using different X, Y, and Z values.
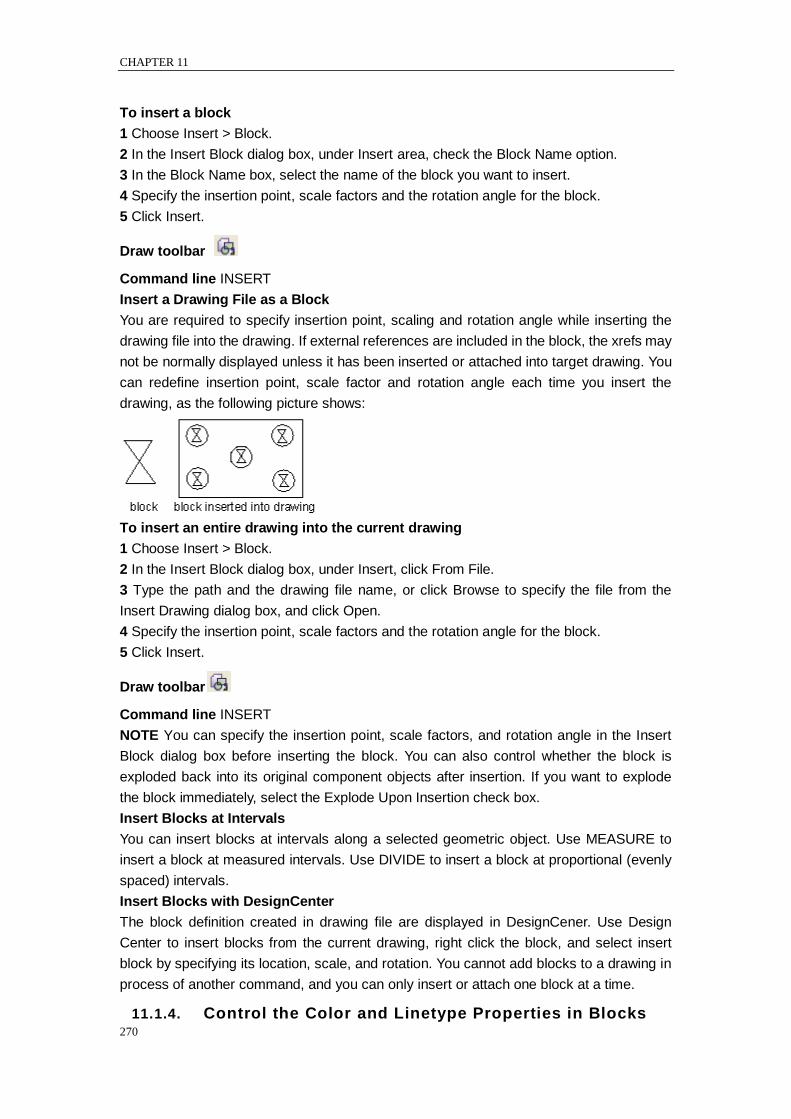
CHAPTER 11
270
To insert a block
1 Choose Insert > Block.
2 In the Insert Block dialog box, under Insert area, check the Block Name option.
3 In the Block Name box, select the name of the block you want to insert.
4 Specify the insertion point, scale factors and the rotation angle for the block.
5 Click Insert.
Draw toolbar
Command line INSERT
Insert a Drawing File as a Block
You are required to specify insertion point, scaling and rotation angle while inserting the
drawing file into the drawing. If external references are included in the block, the xrefs may
not be normally displayed unless it has been inserted or attached into target drawing. You
can redefine insertion point, scale factor and rotation angle each time you insert the
drawing, as the following picture shows:
To insert an entire drawing into the current drawing
1 Choose Insert > Block.
2 In the Insert Block dialog box, under Insert, click From File.
3 Type the path and the drawing file name, or click Browse to specify the file from the
Insert Drawing dialog box, and click Open.
4 Specify the insertion point, scale factors and the rotation angle for the block.
5 Click Insert.
Draw toolbar
Command line INSERT
NOTE You can specify the insertion point, scale factors, and rotation angle in the Insert
Block dialog box before inserting the block. You can also control whether the block is
exploded back into its original component objects after insertion. If you want to explode
the block immediately, select the Explode Upon Insertion check box.
Insert Blocks at Intervals
You can insert blocks at intervals along a selected geometric object. Use MEASURE to
insert a block at measured intervals. Use DIVIDE to insert a block at proportional (evenly
spaced) intervals.
Insert Blocks with DesignCenter
The block definition created in drawing file are displayed in DesignCener. Use Design
Center to insert blocks from the current drawing, right click the block, and select insert
block by specifying its location, scale, and rotation. You cannot add blocks to a drawing in
process of another command, and you can only insert or attach one block at a time.
11.1.4. Control the Color and Linetype Properties in Blocks
BLOCKS ATTRIBUTE AND XREFS
271
Through controlling properties like color and linetype for objects on the block, the objects
in an inserted block can retain their original properties, can inherit properties from the
layer on which they are inserted, or can inherit the properties set as current in the drawing.
When you insert a block, the color, linetype, and lineweight of objects in the block retain
their original settings regardless of the current settings in the drawing.
The following three choices are provided for you to determine how the color, linetype, and
lineweight properties of objects are treated when a block reference is inserted.
Objects in the block inherit their original color, linetype, and lineweight properties once
inserted into the drawing. The properties of objects in the block can‘t be changed until
redefined. For this choice, it is recommended that you set the color, linetype, and
lineweight properties individually for each object in the block definition: which are different
from BYBLOCK or BYLAYER color, linetype, and lineweight settings when creating these
objects.
Objects in the block inherit color, linetype, and lineweight properties that assigned to the
current layer only. For this choice, before you create objects to be included in the block
definition, set the current layer to 0, and set the current color, linetype, and lineweight to
BYLAYER.
Objects inherit color, linetype, and lineweight properties that have been definitely set, that
is, the properties you have set to override the color, linetype, or lineweight assigned to the
current layer. If undefinately specify layer properties for the objects, then use properties of
the current layer. For this choice, before you create objects to be included in the block
definition, set the current color or linetype to BYBLOCK.
11.1.5. Modify a Block Definition
You can redefine all instances of a block within the current drawing. To redefine a block
that was created in the current drawing, you create a new block using the same name.
You can update all the blocks in the current drawing by redefining the block. If the block
was inserted from a separate drawing file that was subsequently updated, reinsert that
block to update all other instances in the current drawing.
There are two methods of redefining block definitions, you can choose to modify block
definition in current drawing or in original drawing.
Modify the block definition in the current drawing.
Modify the block definition in the source drawing and insert it into the current drawing
again.
Modify a Block Definition in the Current Drawing
To modify a block definition already inserted into the drawing, you should first create a
new block definition with a new name to replace the existing block definition, and all the
references to that block in the drawing are immediately updated to reflect the new
definition.
To save time, you can insert and explode an instance of the original block and then use
the resulting objects while creating the new block definition.
To redefine a block in the current drawing
1 Choose Draw > Block > Make.
2 Type the name of the block you want to redefine, and then click OK.
CHAPTER 11
272
3 Specify the insertion point for the block.
4 Select the objects for the block, and then press Enter.
5 Click OK.
6 In the dialog box of ―The block already exists, Do you want to redefine it?‖, click YES.
Draw toolbar
Command line BLOCK
The block is immediately redefined, and all instances of the block in the drawing are
updated.
TIP To restore the original objects to the drawing while retaining the new block, click
Retain.
Update a Block Definition That Originated from a Drawing File
To modify the original drawing directly before inserted into the drawing, blocks inserted
into current drawing are not updated automatically unless the block definition from the
drawing file is updated using INSERT command.
Remove Block Definitions
Too many block definitions in a drawing file may affect the drawing size. To reduce the
size of a drawing, you can remove unused block definitions. Erasing a block reference
from a drawing may delete the block reference but retain the block definitions in the block
definition table. Using PURGE command can help removing unused block references
from your drawing in order to reduce the drawing size
You should erase all references from a block before you can purge the block definition.
Disassemble a Block Reference (Explode)
To modify one or more objects within a block separately, you can use explode tool from
Modify toolbar, and restore this block after you have modified these objects using one of
the following method:
Create a new block definition
Redefine the existing block definition
You can automatically explode block references as you insert them by selecting the
Explode option in the Insert dialog box. Thus, the block reference will be automatically
exploded with each object inserted into the drawing separately.
To explode a block
1 Choose Modify > Explode.
2 Select the block.
3 Press Enter.
Modify toolbar
Command line EXPLODE
11.2. Define and Use Block Attributes
An attribute is a particular object that you can save as part of a block definition. Attributes
consist of textbased data. You can use attributes to track such things as part numbers and
prices. Attributes have either fixed or variable values. When you insert a block containing
attributes, the program adds the fixed values to the drawing along with the block, and you
BLOCKS ATTRIBUTE AND XREFS
273
are prompted to supply any variable values.
After you insert blocks containing attributes, you can extract the attribute information to a
separate file and then use that information in a spreadsheet or database to produce a
parts list or bill of materials. You can also use attribute information to track the number of
times a particular block is inserted into a drawing.
Attributes can be visible or hidden. Hidden attributes are neither displayed nor printed, but
the information is still stored in the drawing and written to a file when you extract it.
Define Attributes
You add an attribute to a drawing by first defining it and then saving it as part of a block
definition. To define an attribute, you specify the characteristics of the attribute, including
its tag, prompt, and default text; insert coordinates and text formatting; and attribute flags
(hidden, fixed, validate, and defined).
To define an attribute
1 Choose Draw > Block > Define Attribute.
2 In the Define Attribute dialog box, type the tag, prompt, and default text.
3 Under Insert Coordinates, specify the location of the attribute, or click Select to select a
point in the drawing.
4 Under Attribute Flags, select the optional attribute modes.
5 Under Text, specify the text characteristics.
6 To add the attribute to the drawing, do one of the following:
Click Define to add the attribute and keep the dialog box active so you can define another
attribute.
Click Define And Exit to add the attribute and end the command.
Command line ATTDEF
Modify Attributes
You can edit an attribute definition before you associate it with a block and before it is
saved as part of a block definition.
To edit an attribute definition
1 On the command line, type ddedit.
2 Select the attribute definition text to edit.
3 Modify the attribute tag, prompt string, default text.
4 Click OK.
Define Block Attributes
Attributes can be attached to a block. When selecting objects to be included in the block,
you can select all the attributes and then choose the block to be attached.
The order you select attributes determines the prompts displaying when inserting blocks.
If you select attributes by crossing selection or window selection, the prompts for
attributes are displayed by the order of creating attributes.
Modify Block Attributes
You can use the Block Attribute Manager to modify attributes in block definitions. For
example, you can modify the following items:
Attributes of blocks can be displayed after modification
Text properties that define how attribute text is displayed in the drawing
Properties that define the layer that the attribute is on and the attribute line's color, weight,
CHAPTER 11
274
and type
By default, attribute changes you make are applied to all existing block references in the
current drawing. If constant attributes or nested attribute blocks are affected by your
changes, use REGEN to update the display of those blocks in the drawing area.
Redefine Block Attributes
When you modify the block definitions, system prompts to select objects that are included
in block definition, you can attach the attributes to the block by adding the desired attribute
to selection set. Once the attributes of block definition have been modified, the inserted
block reference may be affected by the following descriptions:
Constant attributes with fixed value, are lost and replaced by any new constant attributes.
Variable attributes remain unchanged, even if no attributes are included in the new block
definition.
New attributes do not appear in the existing block references.
To edit an attribute attached to a block
1 On the command line, type ddatte.
2 Select the block to edit.
The Edit Block Attributes dialog box displays all the attributes attached to the block you
select.
3 Edit the attribute values as necessary.
4 Click OK.
Extract Block Attribute Data
Enter EATTEXT to start Extract Attributes wizard if the blocks in the drawing contain
attributes. You can extract block information according to the wizard prompt and generate
list so as to overview the attributes information of the blocks. You can get guide
information from the wizard until you accomplish selecting drawings, blocks and block
attributes.
With the extract block attribute data function,You can easily create list using drawing data
through extrating attribute information and export to external files.
Export to exterior files
When you want to save the extracted information to exterior files, you can save the
exterior file as CSV, TXT, XLS and MDB format.
Unicode replaces characters such as period, comma or pound if written into Excel or
Access files.
11.3. Reference Other Drawing Files (Xrefs)
You can link entire drawings to the current drawing as external references. Unlike
inserting a drawing as a block, in which you add all the objects from the separate drawing
into the current drawing, external references attach a pointer to the external file. The
objects in the external reference appear in the current drawing, but the entities themselves
are not added to the drawing. Thus, attaching an external reference does not significantly
increase the size of the current drawing file.
External references provide additional capabilities not available when you insert a drawing
as a block. When you insert a drawing as a block, the objects are stored in the drawing.
Any changes you make to the original drawing are not reflected in the drawing in which
BLOCKS ATTRIBUTE AND XREFS
275
you inserted it. When you attach an external reference, however, any changes you make
to the original drawing file are reflected in the drawings that reference it. These changes
appear automatically each time you open the drawing containing the external reference. If
you know that the original drawing was modified, you can reload the external reference
anytime you‘re working on the drawing.
External references are useful for assembling master drawings from component drawings.
Use external references to coordinate your work with others in a group. External
references help reduce drawing file size and ensure that you are always working with the
most recent version of a drawing.
11.3.1. Attach External References
When a drawing is attached to current drawing as external reference, it will be linked to
the drawing, any changes to the referenced drawing may affect the external reference in
current drawing.
External references are inserted into the drawing as block definitions and used as single
objects, But you should distinguish the external references and blocks.
An xref can be attached to various drawing simultaneously. In the same way, you can
attach multiple xrefs to the same drawing using full path or relative path that are partly
defined. Even without saving path.
You should notice that, xref must be object created in model space, when inserting xrefs,
you can specify the insertion scale, position and rotation angle.
When you attach an external reference, its layers, linetypes, text styles, and other
elements are not added to the current drawing. Rather, these elements are also linked
from the referenced file.
There are two ways you can attach an external reference:
An attachment is an inserted drawing that contains a link to the original file. Attachments
can themselves contain other, nested reference files. When you attach an external
reference, any nested references contained in the file also appear in the current drawing.
An overlay is also an inserted drawing that contains a link to the original file. Overlays
allow you to lay a drawing on top of another drawing, similar to the way you work manually
with transparencies. When a drawing that contains overlaid external references is itself
attached or overlaid as an external reference in another drawing,the overlays do not
appear as part of the external reference. Use overlaying when you want to see reference
geometry in a drawing but you do not need to include that geometry in drawings that will
be used by others (nested external references).
To attach an external reference
1 Choose Insert > Xref Manager.
2 Click Attach.
3 Specify the drawing file to attach as an external reference, and then click Open.
4 In Reference Type, choose how you want to insert the drawing:
Attachment – inserts a copy of the drawing and includes any other drawings that are exter
nally referenced within the referenced drawing.
Overlay – lays a copy of a drawing over your original drawing; it does not include any
nested external references from the externally referenced drawing.

CHAPTER 11
276
5 Make any additional selections.
6 Click OK.
7 If you marked Specify On Screen for any items, follow the prompts to attach the external
reference.
Insert toolbar
Command line XREF
Notification of Attached Xrefs
After inserting external references into the drawing, a xref icon displays at the lower right
corner of status bar on ZWCAD application window. Click this icon shown below to display
External Reference manager:
If the original drawing to which the xref links has been changed and needs to reload, an
exclamation mark appears on the xref icon.
Attach External References
You can use the following methods to attach xrefs into a drawing:
Attach xrefs to current drawing using XATTACH command.
Starts xref manager using XREF command, and select xref to attached to the current
drawing.
Select xref drawing to insert into the drawing from DesignCenter, and right click the
drawing to select Attach as xref.
Viewing the list of external references
You can view a list of the external references that are linked to the current drawing two
different ways using the Xref Manager:
List View displays the external references in a list, which allows you to sort the list of
references by name, status, size, type, date, or saved path.
Tree View displays a hierarchical representation of the external references and the
relationships between them. The tree view shows the level of nesting relationships of the
attached external references.
To view a list of external references
1 Choose Insert > Xref Manager.
2 Click List View or Tree View.
Insert toolbar
Command line XREF
Visibility, Color, and Linetype
You can control visibility, color, linetype and other properties by setting the layer on which
the xref locates. You can also assign these changes as temporary or permanant.
If the system variable VISRETAIN is set to 0, layer table stores in the xref has
superiority,modifications based on layer made for xref of the current drawing are only
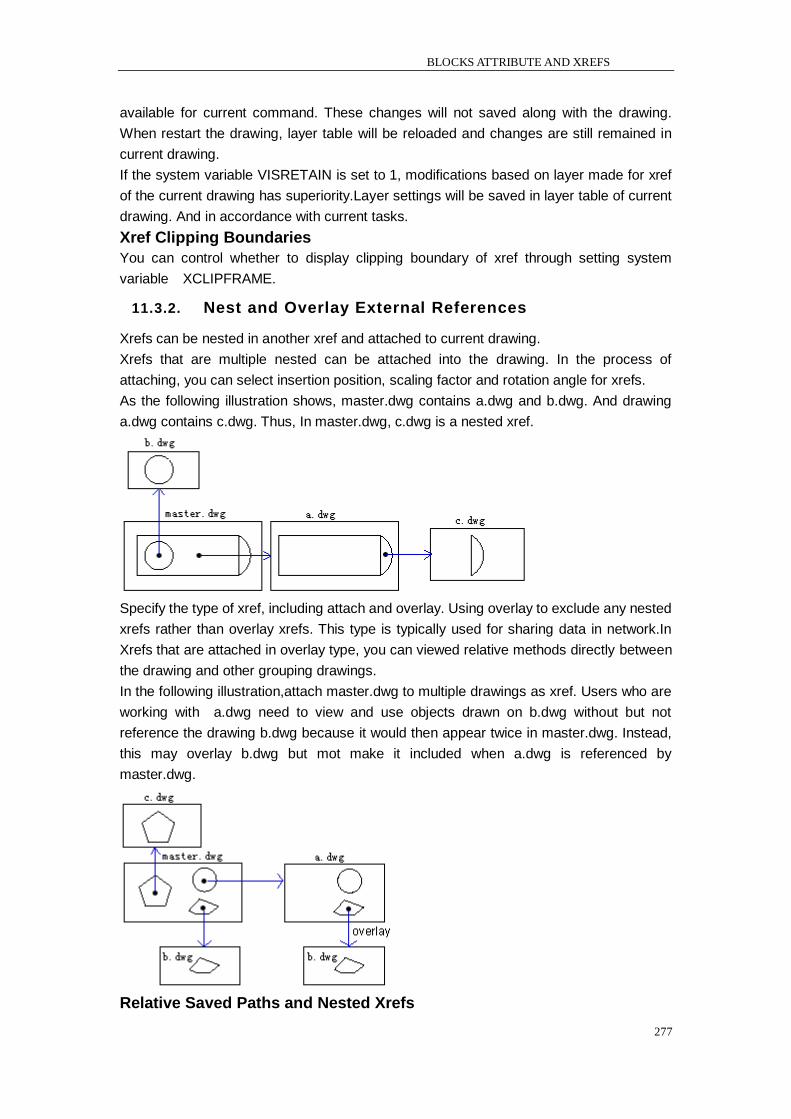
BLOCKS ATTRIBUTE AND XREFS
277
available for current command. These changes will not saved along with the drawing.
When restart the drawing, layer table will be reloaded and changes are still remained in
current drawing.
If the system variable VISRETAIN is set to 1, modifications based on layer made for xref
of the current drawing has superiority.Layer settings will be saved in layer table of current
drawing. And in accordance with current tasks.
Xref Clipping Boundaries
You can control whether to display clipping boundary of xref through setting system
variable XCLIPFRAME.
11.3.2. Nest and Overlay External References
Xrefs can be nested in another xref and attached to current drawing.
Xrefs that are multiple nested can be attached into the drawing. In the process of
attaching, you can select insertion position, scaling factor and rotation angle for xrefs.
As the following illustration shows, master.dwg contains a.dwg and b.dwg. And drawing
a.dwg contains c.dwg. Thus, In master.dwg, c.dwg is a nested xref.
Specify the type of xref, including attach and overlay. Using overlay to exclude any nested
xrefs rather than overlay xrefs. This type is typically used for sharing data in network.In
Xrefs that are attached in overlay type, you can viewed relative methods directly between
the drawing and other grouping drawings.
In the following illustration,attach master.dwg to multiple drawings as xref. Users who are
working with a.dwg need to view and use objects drawn on b.dwg without but not
reference the drawing b.dwg because it would then appear twice in master.dwg. Instead,
this may overlay b.dwg but mot make it included when a.dwg is referenced by
master.dwg.
Relative Saved Paths and Nested Xrefs
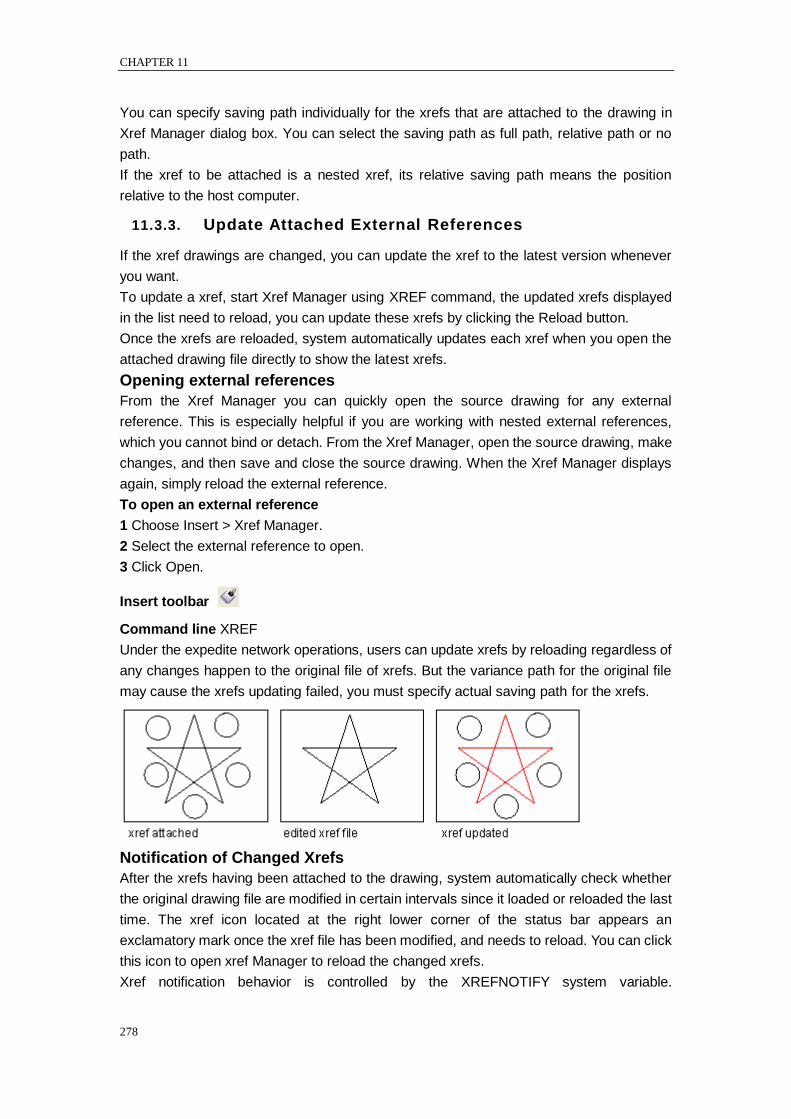
CHAPTER 11
278
You can specify saving path individually for the xrefs that are attached to the drawing in
Xref Manager dialog box. You can select the saving path as full path, relative path or no
path.
If the xref to be attached is a nested xref, its relative saving path means the position
relative to the host computer.
11.3.3. Update Attached External References
If the xref drawings are changed, you can update the xref to the latest version whenever
you want.
To update a xref, start Xref Manager using XREF command, the updated xrefs displayed
in the list need to reload, you can update these xrefs by clicking the Reload button.
Once the xrefs are reloaded, system automatically updates each xref when you open the
attached drawing file directly to show the latest xrefs.
Opening external references
From the Xref Manager you can quickly open the source drawing for any external
reference. This is especially helpful if you are working with nested external references,
which you cannot bind or detach. From the Xref Manager, open the source drawing, make
changes, and then save and close the source drawing. When the Xref Manager displays
again, simply reload the external reference.
To open an external reference
1 Choose Insert > Xref Manager.
2 Select the external reference to open.
3 Click Open.
Insert toolbar
Command line XREF
Under the expedite network operations, users can update xrefs by reloading regardless of
any changes happen to the original file of xrefs. But the variance path for the original file
may cause the xrefs updating failed, you must specify actual saving path for the xrefs.
Notification of Changed Xrefs
After the xrefs having been attached to the drawing, system automatically check whether
the original drawing file are modified in certain intervals since it loaded or reloaded the last
time. The xref icon located at the right lower corner of the status bar appears an
exclamatory mark once the xref file has been modified, and needs to reload. You can click
this icon to open xref Manager to reload the changed xrefs.
Xref notification behavior is controlled by the XREFNOTIFY system variable.
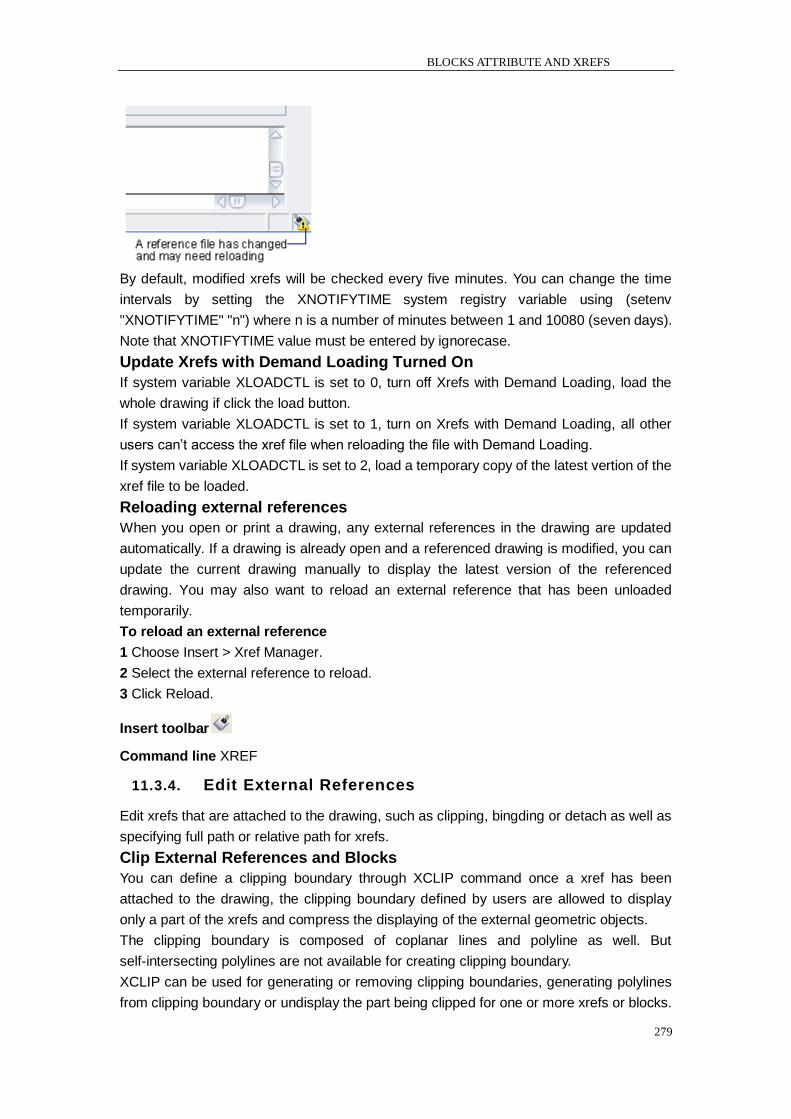
BLOCKS ATTRIBUTE AND XREFS
279
By default, modified xrefs will be checked every five minutes. You can change the time
intervals by setting the XNOTIFYTIME system registry variable using (setenv
"XNOTIFYTIME" "n") where n is a number of minutes between 1 and 10080 (seven days).
Note that XNOTIFYTIME value must be entered by ignorecase.
Update Xrefs with Demand Loading Turned On
If system variable XLOADCTL is set to 0, turn off Xrefs with Demand Loading, load the
whole drawing if click the load button.
If system variable XLOADCTL is set to 1, turn on Xrefs with Demand Loading, all other
users can‘t access the xref file when reloading the file with Demand Loading.
If system variable XLOADCTL is set to 2, load a temporary copy of the latest vertion of the
xref file to be loaded.
Reloading external references
When you open or print a drawing, any external references in the drawing are updated
automatically. If a drawing is already open and a referenced drawing is modified, you can
update the current drawing manually to display the latest version of the referenced
drawing. You may also want to reload an external reference that has been unloaded
temporarily.
To reload an external reference
1 Choose Insert > Xref Manager.
2 Select the external reference to reload.
3 Click Reload.
Insert toolbar
Command line XREF
11.3.4. Edit External References
Edit xrefs that are attached to the drawing, such as clipping, bingding or detach as well as
specifying full path or relative path for xrefs.
Clip External References and Blocks
You can define a clipping boundary through XCLIP command once a xref has been
attached to the drawing, the clipping boundary defined by users are allowed to display
only a part of the xrefs and compress the displaying of the external geometric objects.
The clipping boundary is composed of coplanar lines and polyline as well. But
self-intersecting polylines are not available for creating clipping boundary.
XCLIP can be used for generating or removing clipping boundaries, generating polylines
from clipping boundary or undisplay the part being clipped for one or more xrefs or blocks.
CHAPTER 11
280
XCLIP only affects the single object of xref, retain the xref definitions unchanged. The part
of xref or block inside the clipping boundary is still visible, while the remaining part are
invisible. The geometric drawing being referenced itself is unchanged, only its displaying
way is edited.
You can use XCLIP to do the following:
Create new clipping boundary
Remove existing boundary
Generate polyline objects that are concurrent with vertex of clipping boundary.
Turn on or off xref Clipping
If xclip is turned on, all the clipping boundaries will be started to display the clipped part of
a xref. If the xclip is turned off, the clipping boundaries will not displayed, only display the
drawings in xrefs containing contents both inside or outside the clipping boundary.The
clipping boundary can‘t be restored once removed. The xref having been clipped can be
modified, moved, or copied as those unclipped xrefs. While modifying the xrefs, the
clipping boundary moves together with the xrefs. If the xref attached to the drawing
contain nested clipped xrefs, these xrefs will be displayed as it was after clipping. The
nested xref is also clipped if superior xref has been clipped.
Turning clipping boundaries on and off
The clipping boundaries can be controlled whether to display or not through system
variable XCLIPFRAME . If set this system variable to 1, the clipping boundary can be
selected and plotted as a part of the object.
When a clipping boundary is turned off, the boundary does not display and the entire
external reference is visible, provided that the geometry is on a layer that is on and
thawed. However, deleting a clipping boundary is permanent.
To turn clipping boundaries on and off
1 Choose Modify > Clip > Xref.
2 Select the desired external references.
3 Press Enter.
4 To turn off clipping boundaries, choose Off. To turn on existing clipping bound aries,
choose On.
5 Press Enter.
Reference toolbar
Command line XCLIP
TIP When the XCLIPFRAME system variable is on (set to 1), you can select and print the
clipping boundary frame.
Clipping Boundary Options
When clipping boundaries, you can specify a rectanglar window or use polyline to define
clipping boundary through New boundary option. If the selected clipping boundary is
rectanglar window, only xrefs within the rectanglar window are displayed. The clipping
boundary is parallel to current UCS, and the clipping boundary will be applied to the
normal direction of its plane.
To define a rectangular clipping boundary
1 Choose Modify > Clip > Xref.
BLOCKS ATTRIBUTE AND XREFS
281
2 Select the external references to clip. If desired, you can also select blocks.
3 Press Enter.
4 Press Enter to create a new clipping boundary.
5 If prompted, press Enter to delete any existing boundaries.
6 Choose Rectangular.
7 Define the first corner of the clipping rectangle.
8 Define the second corner of the clipping rectangle.
The selected external references are clipped by the rectangle.
Reference toolbar
Command line XCLIP
TIP You can first select all external references, right click the selection, and then select
Xref Clip from the shortcut menu.
When using polyline to define clipping boundary, the clipping boundary is in accordance
with the polyline. If the selected clipping boundary is polyline, it can‘t be self intersected.
System takes the open polyline as closed polyline if the arcs contained in the polyline
have been smoothed. The clipping boundary created this way is located on the plane
parallel to the UCS that puts the polyline.
To define a clipping boundary using a polyline
1 Draw a polyline where you want to clip external references.
2 Choose Modify > Clip > Xref.
3 Select the external references to clip. If desired, you can also select blocks.
4 Press Enter.
5 Press Enter to create a new clipping boundary.
6 If prompted, press Enter to delete any existing boundaries.
7 Choose Select Polyline.
8 Select the polyline to use as clipping boundary.
Reference toolbar
Command line XCLIP
Clip Depth
The front and back clipping planes for xrefs can be set before clipping the xref. To specify
a clip depth, the xref must contain a clipping boundary. The clip depth is always calculated
normal to the clipping boundary. When setting clip depth, you are prompted to specify a
front and back point or distance relative to the clipped plane. Regardless of the current
UCS, the clip depth is only available at the direction parallel to the clipping boundary.

CHAPTER 11
282
Deleting a clipping boundary
If you no longer need a clipping boundary for an external reference, you can delete it.
To delete a clipping boundary
1 Choose Modify > Clip > Xref.
2 Select the desired external references.
3 Press Enter.
4 Choose Delete, and then press Enter.
5 Click the clipped portion of the external reference.
The previously hidden portion of the referenced drawing displays.
Reference toolbar
Command line XCLIP
Binding an xref to a drawing
External references are not part of the drawing. Rather, they are links to an externally
referenced file. To provide a copy of a drawing containing external references to someone
else, you must also provide all the external reference files. In addition, the user receiving
the drawings must either recreate the same paths you used when linking the external
references or change the paths for the external references.
To provide a copy of a drawing that contains external references, it is often easier to first
bind the external references to the drawing. Binding the external references makes them a
permanent part of the drawing, which is similar to inserting a separate drawing as a block.
You can bind external references that are attached directly to the current drawing; you
cannot bind nested external references.
Xrefs rely on the naming sentence of named objects from ―Block name|Definition
name‖to‖Block name$n$Definition name‖. Thus, you can create unique named objects for
relative definition tables that are bind to all the xref in current drawing.
If select Insert, the xref will be inserted to the drawing after converted to blocks as
inserting reference drawings. Xref relys on named object, using the xref name removed
from the names but not using the ―Block name|Definition name‖ sentence. If internal
named objects have the same name with binded xref names in the drawing to be inserted,
new names will not be added in symbol table, and the binded xrefs rely on named objects
adopts properties of named objects local defined.
To bind an existing external reference to a drawing
BLOCKS ATTRIBUTE AND XREFS
283
1 Choose Insert > Xref Manager.
2 Select the external reference to bind.
3 Click Bind.
4 Choose one of the following:
Bind Binds the external reference and creates a unique name for each named object,
such as a layer or block, that is located in the external reference. For example, a layer
named Electric in the external reference will be named Xref$0$Electric in the current
drawing. If the current drawing already has a layer or block with the same name, the name
is changed incrementally, for example, Xref$1$Electric.
Insert Binds the external reference, but does not change the names of any named objects
in the external reference. For example, a layer named Electric in the external reference
will have the same name, Electric, in the current drawing. If the current drawing has a
layer or block with the same name, the named object in the external reference takes on
the properties of the named object in the current drawing.
5 Click OK.
Insert toolbar
Command line XREF
Detach External References
To detach the xref from the drwing, the selected xrefs will be removed from the xref list.
Meanwhile, relative xref in current drawing will be removed as well. This can be also
applied to xrefs directly attached to current drawing, but the nested xrefs can‘t be treated
like this.
You should distinguash with detach and remove, which are totally different concepts,
removing a xref will not remove its relative layer definitions. Using Detach option to
remove all the associated information of the xref.
To detach an external reference
1 Choose Insert > Xref Manager.
2 Select the external reference to detach.
3 Click Detach.
Insert toolbar
Command line XREF
NOTE Only the external references that are attached directly to the current drawing can
be detached; nested external references cannot be detached.
Set Paths to Externally Referenced Drawings
You can set saving path for the xrefs that are changed after attached to the drawing, when
you selecting saving path for the xrefs, three types are provided for you: Full path,
Relative path and No path.
Full Path
Full path refers to the path that marked by locak disk or network server driver.By default,
the path for saving the xref files are Relative path, but this path lacks flexibility, once the
file is changed, the path becomes invalid.
Relative Path
CHAPTER 11
284
Relative path refers to path assigned by folders including current driver or original drawing
file. User can move the original files among multiple drivers within the folder at the same
hiberarchy without affecting updating xrefs.
You can‘t set the relative path in locak disk or network server driver. The relative path for
xref original files are assigned as follows:
\: Look in the root folder of the host drawing's drive
path: From the folder of the host drawing, follow the specified path
\path: From the root folder, follow the specified path
.\path: From the folder of the host drawing, follow the specified path
..\path: From the folder of the host drawing, move up one folder level and follow the
specified path
..\..\path: From the folder of the host drawing, move up two folder levels and follow the
specified path
If you have changed the path that include the xref drawings, such as moving the file or
save it to a different path or disk, then all the relative paths of the xref must be changed
individually so as to adapt to the new position of its parasitifer.
No Path
Specifies the path type of inserting xref as No path, the xref will not save the path
information, if you want to search the original file of xref, you can search through the
following ways:
Search for the current folder of original drawing
Search for the DWG file search path defined in File tab in Options dialog box.
Search for the start folder assigned by shortcut of Windows applications
No Path is useful when users want to move their drawings to another or an unkown folder
hibrearchy .
To change the path for a single external reference
1 Choose Insert > Xref Manager.
2 Select the external reference whose path you want to change.
3 In Xref Path, do one of the following:
Enter a new filename or location.
Click Browse to locate and select the referenced drawing. ZWCAD reloads the specified
external reference automatically.
Insert toolbar
Command line XREF
NOTE You cannot recursively reference a drawing from the same original drawing.
11.3.5. Edit External References in Place
Edit xrefs of current drawing without opening the xref drawings.
Edit Selected Objects in Xrefs and Blocks
You can edit or modify the visible text of xrefs attached to the drawing through edit in place.
Because block references and xrefs are different types of reference files, editing and
modifying the block references will be illustrated here.
Generally, one or more xrefs and block references are contained in each drawing, the
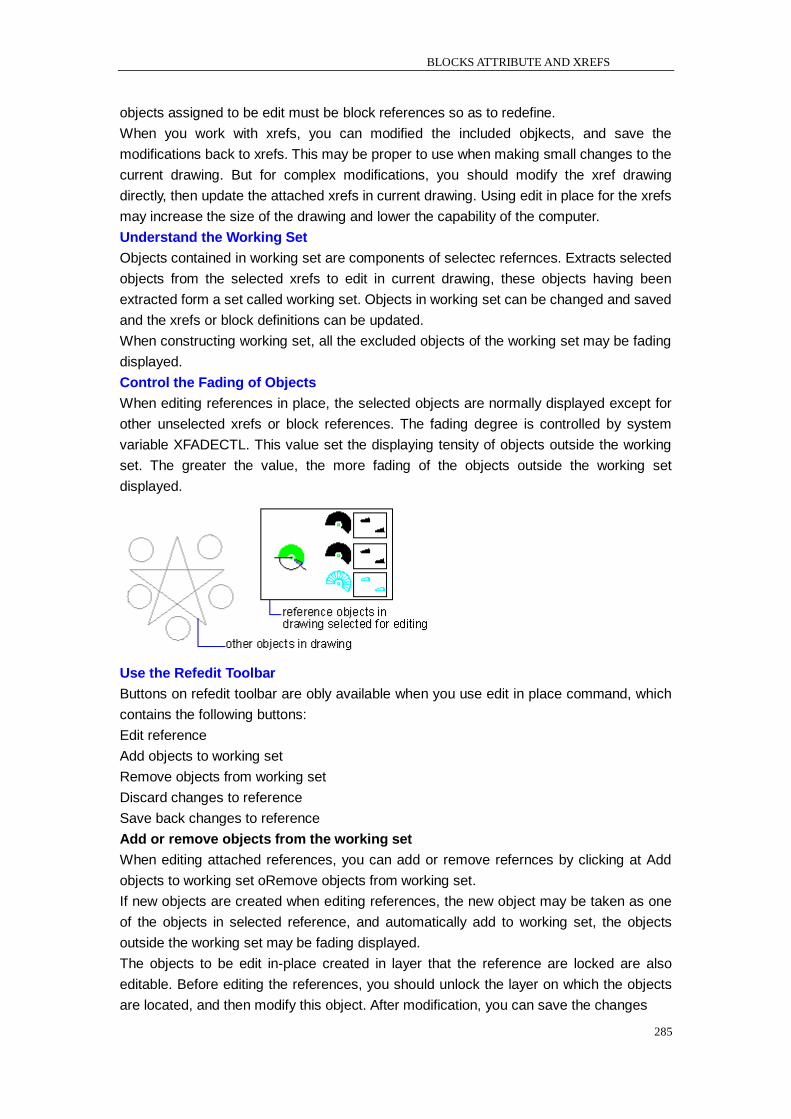
BLOCKS ATTRIBUTE AND XREFS
285
objects assigned to be edit must be block references so as to redefine.
When you work with xrefs, you can modified the included objkects, and save the
modifications back to xrefs. This may be proper to use when making small changes to the
current drawing. But for complex modifications, you should modify the xref drawing
directly, then update the attached xrefs in current drawing. Using edit in place for the xrefs
may increase the size of the drawing and lower the capability of the computer.
Understand the Working Set
Objects contained in working set are components of selectec refernces. Extracts selected
objects from the selected xrefs to edit in current drawing, these objects having been
extracted form a set called working set. Objects in working set can be changed and saved
and the xrefs or block definitions can be updated.
When constructing working set, all the excluded objects of the working set may be fading
displayed.
Control the Fading of Objects
When editing references in place, the selected objects are normally displayed except for
other unselected xrefs or block references. The fading degree is controlled by system
variable XFADECTL. This value set the displaying tensity of objects outside the working
set. The greater the value, the more fading of the objects outside the working set
displayed.
Use the Refedit Toolbar
Buttons on refedit toolbar are obly available when you use edit in place command, which
contains the following buttons:
Edit reference
Add objects to working set
Remove objects from working set
Discard changes to reference
Save back changes to reference
Add or remove objects from the working set
When editing attached references, you can add or remove refernces by clicking at Add
objects to working set oRemove objects from working set.
If new objects are created when editing references, the new object may be taken as one
of the objects in selected reference, and automatically add to working set, the objects
outside the working set may be fading displayed.
The objects to be edit in-place created in layer that the reference are locked are also
editable. Before editing the references, you should unlock the layer on which the objects
are located, and then modify this object. After modification, you can save the changes
CHAPTER 11
286
back to references. But the status of layer keeps unchanged regardless of lock.
When saving the changes for the references, all the objects in working set are saved to
references. Objects that are removed from the working set never contained in the
reference, subsequently become other parts of the drawing. Objects that are added to the
working set will be removed from its original position from the drawing. The objects being
created or removed will be added or removed into the working set automatically.
Save Back Edited Xrefs and Blocks
Changes to the references are optionally saved to the current drawing.
If you choose saving the changes, system automatically regenerate the drawing, in
addition, block definitions are redefined and all the blocks are regenerated as well. Thus,
changes to the xrefs can be saved also, if the objects in working set inherit its original
properties defined in external references, these objects retain new properties. If you
remove some objects from the working set, these objects will be added into current
drawing.
If you discard the changes, the working set removed as well and return the block
references to the original state. When editing references in-place, if objects excluded from
the working set are removed and you discard the changes to the xref, the objects having
been removed can‘t be restored.
If you have saved the changes for the xref, you can get back the reference file and discard
the changes, use UNDO command.
If objects in current drawing inherit properties defined in xref, these objects will be
displayed in new properties called binding properties. Additionally, you can specify how
the xref names are displayed through system variable BINDTYPE. If the BINDTYPE si set
to 0, the xref names will be added a prefix $#$, if the BINDTYPE si set to 1, keep the xref
names unchanged.
It should be noticed that you can‘t edit or change the referenced drawings when editing
in-place, which are only readable.
Edit Xrefs and Blocks with Nesting, OLE, or Attributes
Edit in-place set limits for those nested xrefs in current drawing. When you editing nested
xrefs, references together with their nested references are displayed in Reference Edit
dialog box, you can also change all the nested references. But changes are available for
one reference at a time.
OLE objects included in reference you are editing can be displayed but not edited.
If the block reference to be edited contain attributes, you can edit the attributes while
editing the references by selecting Display attribute definitions for editing in Refernce Edit
dialog box. Attributes are invisible, but attributes definitions and selected geometric
drawing can be edited together. The attributes of original references keep unchanged
after saving, and new attributes definitions only affects the block subsequently inserted
into ther drawing.
HATCHES AND REALISTIC IMAGES
287
12. Hatches and Realistic Images
12.1. Hatches
12.1.1. Overview of Hatch Patterns and Fills
Fills an enclosed area or selected objects with a hatch pattern or gradient fill.
Filling the specified area with different material so as to distinguish project parts. These
patterns are both predefined and user defined.
Entity bhatch includes three kinds of Bhatching using patterns, Solid, PLINE or DONUT.
Gradient hatch refers to a kind of hatch pattern among different gradations within one or
two colors. Which can be used to increase the drawing demonstration effects or use as
background.
To create a hatch, you should specify hatch area first which is so-called hatch boundary,
various methods of creating hatch boundaries are provided as well as creating associative
hatch for controlling the hatch pattern updated along with the boundary changes. If the
specified boundary is not a closed area, you can set maximum gap which is controlled by
system variable HPGAPTOL when using the object as pattern boundary, any gap within
this value range will be taken as closed boundary. But this gap is only available for lines
and arcs, they‘ll be joined if extended. When creating hatch patterns, you can specify the
draw order of the patterns to decide hatching before or after the boundaries, or set it in
front or at back of all objects.
Add Hatch Patterns and Solid Fills
You can use BHATCH command to add hatch pattern to the drawing. When defining hatch
patterns, you can specify the options in hatch dialog box: scale, angle, space, ISO pen
width, associativity and double hatch.
Create Associative Hatches
If you select associative hatch properties when hatching the area, the hatched pattern
updates automatically with the boundaries. By default, the hatch pattern created by
BHATCH is associative. The associativity of a hatch pattern can be removed whenever
you want.
The objects that are outside the specified boundary will be ignored when creating hatches.
If the text, properties or solid entities are connected to hatch patterns, only hatches the
boundaries of these objects with the center retained as blank in order to form islands.
Choose a Hatch Pattern
User can select hatch patterns to distinguish different parts of the object and represent the
object materials during hatching process. 14 ISO hatch patterns are provided, ISO pen
width can be specified while selecting ISO hatch patterns. Pen width option is set to
determine the pen width of the pattern.
CHAPTER 12
288
In Hatch dialog box, the Pattern area contains all the pattern names defined in icad.pat file.
You can define new hatch patterns in icad.pat, and apply them by restarting ZWCAD
platform.
Assign a Draw Order to a Hatch
The draw order of hatching and boundaries can be controlled so as to view and select
more easily. When creating hatch patterns, you can specify the draw order of the patterns
to decide hatching before or after the boundaries, or set it in front or at back of all objects.
The value will be stored in system variable HPDRAWORDER.
Other settings of hatch pattern may not be influenced regardless of changing the draw
order of hatch pattern.
Limit Hatch Pattern Density
System generates large amounts of dashes and dots to form hatch patterns. Although all
these dashes and dots are stored as smaller hatch patterns, the more disk space it
occupies and longer generating time it spent than storing normal objects.
You can limit the entity number created by HATCH or BHATCH to avoid this problem. If
the required amount of objects for specified hatch patterns over the preset boundaries,
system displays prompts automatically, querying on refusing the hatch for too small hatch
scale factor or too short dash length. In case of refusing hatches, you should check hatch
settings and adjust scale factor or the dash length.
The hatch entity density limit is set in MaxHatch in registry with default value of 10000. It
can be modified by setting MaxHatch system registry variable using setenv ―MaxHatch‖
―n‖, in which n is a number between 100 and 10000000.
Edit Hatch Boundaries
Hatch boundaries is capable of copy, move and stretch as well as other objects, but for
large amount of object combinations, the geometric drawings for editing hatches may
cause unpredictable results. It‘s suggest to abort hatch if necessary and remove the
hatched blocks to generate new ones.
Create Custom Hatch Patterns
You can define angle, space of current hatch by selecting User Define type from the Style
option Type and pattern in Hatch dialog box, so as to create customized pattern to hatch
selected objects.
12.1.2. Define Hatch Boundaries
To create a hatch, you should define hatch boundaries first by means of selecting objects
to be hatched or picking a point inside the desired object. A hatch boundary can be any
combination of objects, such as lines, arcs, circles, and polylines, that forms an enclosed
area.
To raise the speed of hatching a small area of a complex drawing, you can define a set of
objects in the drawing. HATCH does not analyze objects that are not included in the
boundary set.
Island is a concept representative to the closed area inside the hatched object. You can
hatch the island and also retain its original state.

HATCHES AND REALISTIC IMAGES
289
Objects can be hatched only if they are in a plane parallel to the XY plane of the current
UCS. For the internal area of polylines with width and solid hatching, hatches can‘t be
applied because of its unacceptable profiles.
Control the Hatching in Islands
You can specify methods of hatching objects in outermost boundary as normal, outer and
ignore. Normal is the default hatch pattern, besides, you can view hatching results of
different types in the Island detection option on Boundaries tab.
Normal
Hatch the pattern from the outer boundary to inside. Hatching process will be stopped
when encounter inner crossing points, and continue hatching until second inner crossing
point appears. So if counter from outer boundary of hatch area, the area separated by odd
number crossing points will be hatched, on contrary the area separated by even crossing
points will not be hatched.
Outer
Hatch the pattern from the outer boundary to inside. For the hatching starts from two
points of each hatch line, system will hatch from the outer most layer of configuration, and
keep the internal blank. Hatching process will be stopped when encounter inner crossing
points.
Ignore
Ignore internal objects, only hatches outer objects. The following example displays the
results of hatching a complex entity with Normal, Outer, Ignore pattern individually:
You can also remove any islands from the hatch area.
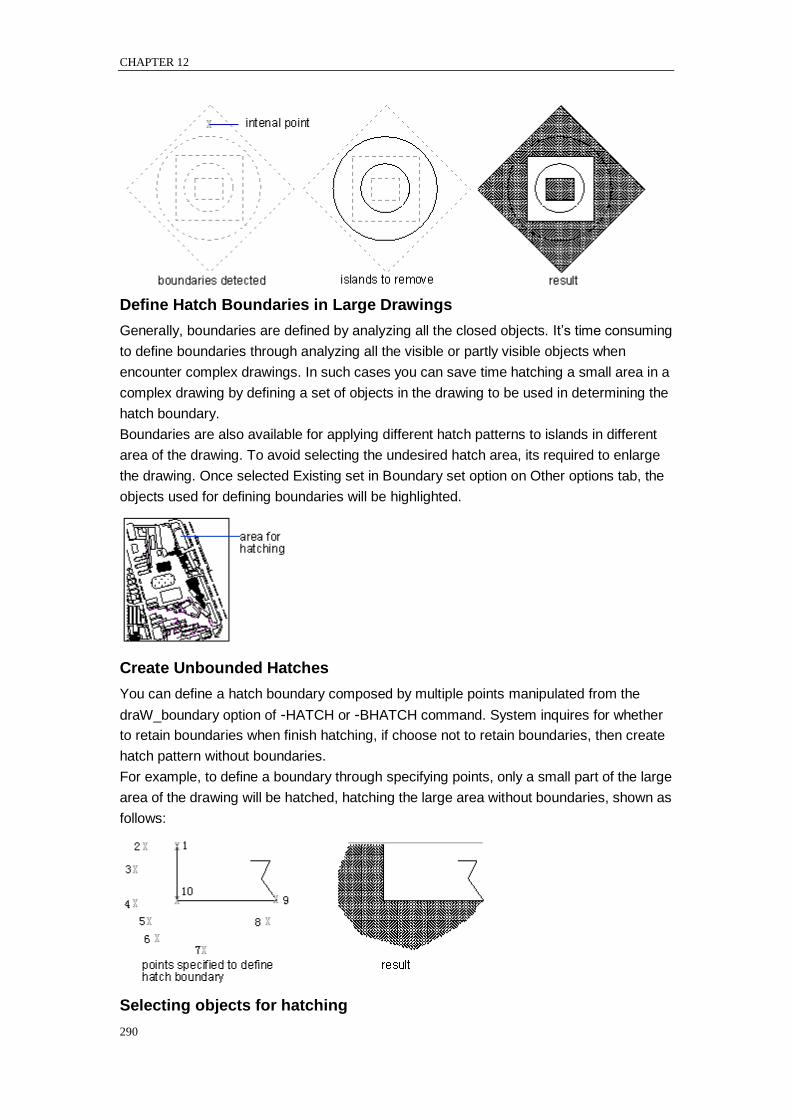
CHAPTER 12
290
Define Hatch Boundaries in Large Drawings
Generally, boundaries are defined by analyzing all the closed objects. It‘s time consuming
to define boundaries through analyzing all the visible or partly visible objects when
encounter complex drawings. In such cases you can save time hatching a small area in a
complex drawing by defining a set of objects in the drawing to be used in determining the
hatch boundary.
Boundaries are also available for applying different hatch patterns to islands in different
area of the drawing. To avoid selecting the undesired hatch area, its required to enlarge
the drawing. Once selected Existing set in Boundary set option on Other options tab, the
objects used for defining boundaries will be highlighted.
Create Unbounded Hatches
You can define a hatch boundary composed by multiple points manipulated from the
draW_boundary option of -HATCH or -BHATCH command. System inquires for whether
to retain boundaries when finish hatching, if choose not to retain boundaries, then create
hatch pattern without boundaries.
For example, to define a boundary through specifying points, only a small part of the large
area of the drawing will be hatched, hatching the large area without boundaries, shown as
follows:
Selecting objects for hatching
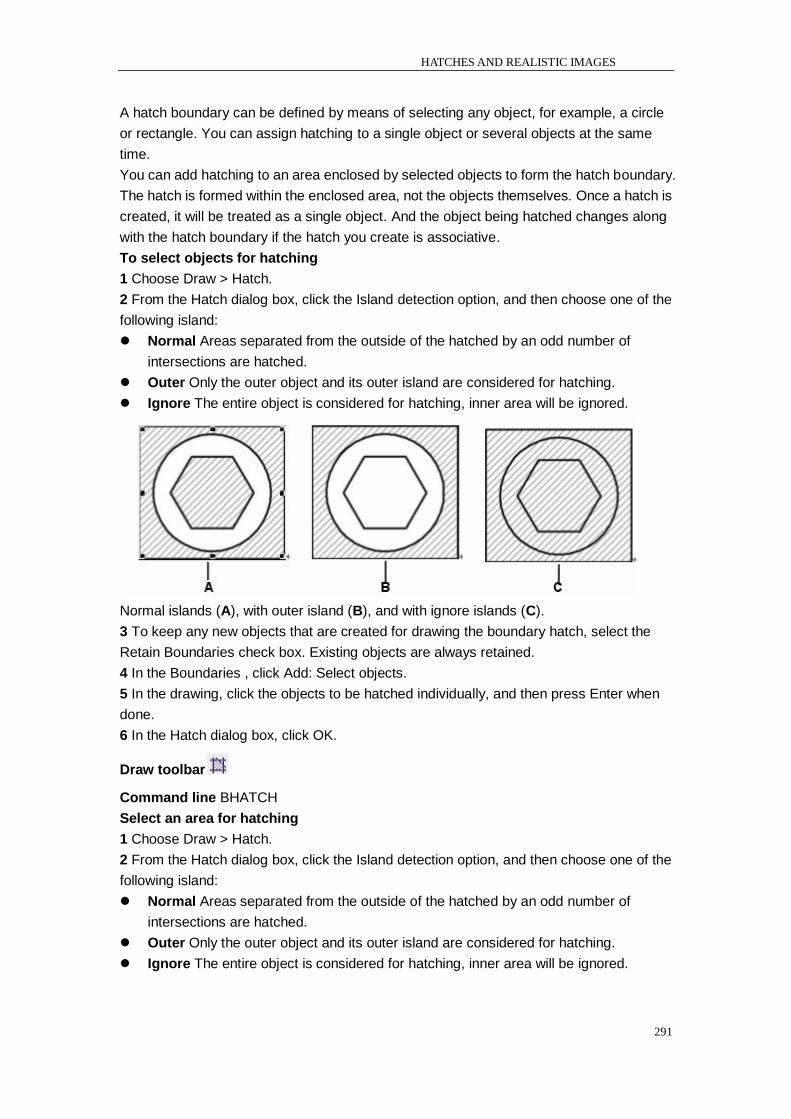
HATCHES AND REALISTIC IMAGES
291
A hatch boundary can be defined by means of selecting any object, for example, a circle
or rectangle. You can assign hatching to a single object or several objects at the same
time.
You can add hatching to an area enclosed by selected objects to form the hatch boundary.
The hatch is formed within the enclosed area, not the objects themselves. Once a hatch is
created, it will be treated as a single object. And the object being hatched changes along
with the hatch boundary if the hatch you create is associative.
To select objects for hatching
1 Choose Draw > Hatch.
2 From the Hatch dialog box, click the Island detection option, and then choose one of the
following island:
Normal Areas separated from the outside of the hatched by an odd number of
intersections are hatched.
Outer Only the outer object and its outer island are considered for hatching.
Ignore The entire object is considered for hatching, inner area will be ignored.
Normal islands (A), with outer island (B), and with ignore islands (C).
3 To keep any new objects that are created for drawing the boundary hatch, select the
Retain Boundaries check box. Existing objects are always retained.
4 In the Boundaries , click Add: Select objects.
5 In the drawing, click the objects to be hatched individually, and then press Enter when
done.
6 In the Hatch dialog box, click OK.
Draw toolbar
Command line BHATCH
Select an area for hatching
1 Choose Draw > Hatch.
2 From the Hatch dialog box, click the Island detection option, and then choose one of the
following island:
Normal Areas separated from the outside of the hatched by an odd number of
intersections are hatched.
Outer Only the outer object and its outer island are considered for hatching.
Ignore The entire object is considered for hatching, inner area will be ignored.
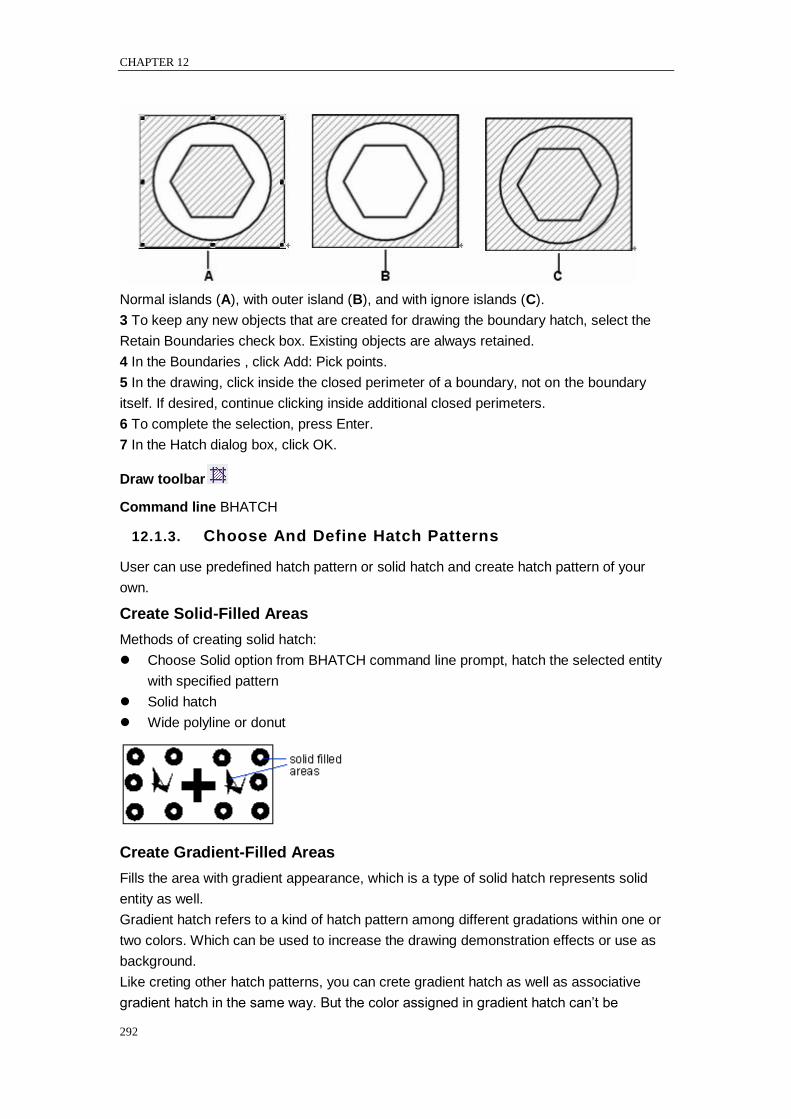
CHAPTER 12
292
Normal islands (A), with outer island (B), and with ignore islands (C).
3 To keep any new objects that are created for drawing the boundary hatch, select the
Retain Boundaries check box. Existing objects are always retained.
4 In the Boundaries , click Add: Pick points.
5 In the drawing, click inside the closed perimeter of a boundary, not on the boundary
itself. If desired, continue clicking inside additional closed perimeters.
6 To complete the selection, press Enter.
7 In the Hatch dialog box, click OK.
Draw toolbar
Command line BHATCH
12.1.3. Choose And Define Hatch Patterns
User can use predefined hatch pattern or solid hatch and create hatch pattern of your
own.
Create Solid-Filled Areas
Methods of creating solid hatch:
Choose Solid option from BHATCH command line prompt, hatch the selected entity
with specified pattern
Solid hatch
Wide polyline or donut
Create Gradient-Filled Areas
Fills the area with gradient appearance, which is a type of solid hatch represents solid
entity as well.
Gradient hatch refers to a kind of hatch pattern among different gradations within one or
two colors. Which can be used to increase the drawing demonstration effects or use as
background.
Like creting other hatch patterns, you can crete gradient hatch as well as associative
gradient hatch in the same way. But the color assigned in gradient hatch can‘t be

HATCHES AND REALISTIC IMAGES
293
controlled by print style.
Use Predefined Hatch Patterns
Fills the specified area with different material so as to distinguish project parts. User can
select hatch patterns to distinguish different parts of the object and represent the object
materials during hatching process. 14 ISO hatch patterns are provided, ISO pen width can
be specified while selecting ISO hatch patterns. Pen width option is set to determine the
pen width of the pattern.
Create User-Defined Hatch Patterns
When selecting hatch patterns, you can define simple patterns by changing angle and
space of pattern lines based on current linetype. This is so-called User define.
Specifying a hatch pattern
A hatch pattern consists of a repeating pattern of lines, dashes, and dots. You can select
a hatch pattern from a set of predefined patterns, or you can define a pattern of your own.
The hatch pattern you used most recently is the default pattern the next time you add
hatching. The program supplies predefined standard hatch patterns, which are stored in
the ICAD.pat and ICADISO.pat hatch pattern library files.
NOTE The ICAD.pat hatch pattern library files are ANSI (American National Standards
Institute) compliant patterns; the ICADISO.pat hatch pattern library files are ISO
(International Standards Organization) compliant.
To specify a predefined hatch pattern
1 Choose Draw > Hatch.
2 From the Hatch dialog box, click the Style Options tab.
3 Under the Hatch – Type and pattern, in the Type list, click Predefined.
With Predefined, you can apply a scale factor to make the pattern larger or smaller than
the default size.
4 For Scale, enter the scale factor as a percentage of the default.
5 For Angle, enter the angle of the pattern in degrees (1-360).
The default angle is clockwise, you can change the angle of any hatch pattern by entering
a numerical value.
6 For ISO Pen Width, enter the pen width.
This option is only available if you select existing ISO hatch pattern in in Pattern option.
7 To copy the pattern properties from an existing hatch, choose Inherit Properties.
8 To associate the hatch pattern to its boundary objects, under Other options, select the
Associative check box. An associative hatch updates automatically if you move any of its
boundaries.
9 To continue, add a hatch by doing one of the following:
In the Boundaries , click Add: Select objects to select the objects you want to add a
hatch.Repeate the procedures following step 2.
In the Boundaries , click Add: Pick points to select an area or boundary you want to
add a hatch. Repeate the procedures following step 2.
Draw toolbar
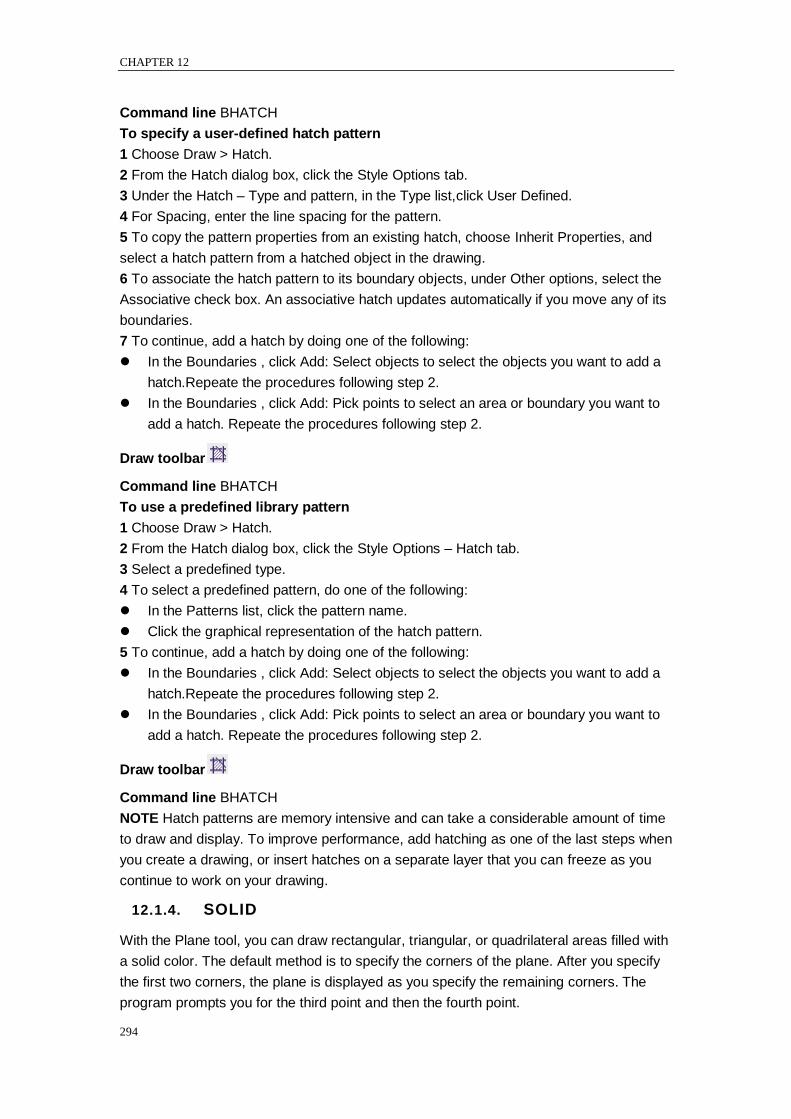
CHAPTER 12
294
Command line BHATCH
To specify a user-defined hatch pattern
1 Choose Draw > Hatch.
2 From the Hatch dialog box, click the Style Options tab.
3 Under the Hatch – Type and pattern, in the Type list,click User Defined.
4 For Spacing, enter the line spacing for the pattern.
5 To copy the pattern properties from an existing hatch, choose Inherit Properties, and
select a hatch pattern from a hatched object in the drawing.
6 To associate the hatch pattern to its boundary objects, under Other options, select the
Associative check box. An associative hatch updates automatically if you move any of its
boundaries.
7 To continue, add a hatch by doing one of the following:
In the Boundaries , click Add: Select objects to select the objects you want to add a
hatch.Repeate the procedures following step 2.
In the Boundaries , click Add: Pick points to select an area or boundary you want to
add a hatch. Repeate the procedures following step 2.
Draw toolbar
Command line BHATCH
To use a predefined library pattern
1 Choose Draw > Hatch.
2 From the Hatch dialog box, click the Style Options – Hatch tab.
3 Select a predefined type.
4 To select a predefined pattern, do one of the following:
In the Patterns list, click the pattern name.
Click the graphical representation of the hatch pattern.
5 To continue, add a hatch by doing one of the following:
In the Boundaries , click Add: Select objects to select the objects you want to add a
hatch.Repeate the procedures following step 2.
In the Boundaries , click Add: Pick points to select an area or boundary you want to
add a hatch. Repeate the procedures following step 2.
Draw toolbar
Command line BHATCH
NOTE Hatch patterns are memory intensive and can take a considerable amount of time
to draw and display. To improve performance, add hatching as one of the last steps when
you create a drawing, or insert hatches on a separate layer that you can freeze as you
continue to work on your drawing.
12.1.4. SOLID
With the Plane tool, you can draw rectangular, triangular, or quadrilateral areas filled with
a solid color. The default method is to specify the corners of the plane. After you specify
the first two corners, the plane is displayed as you specify the remaining corners. The
program prompts you for the third point and then the fourth point.
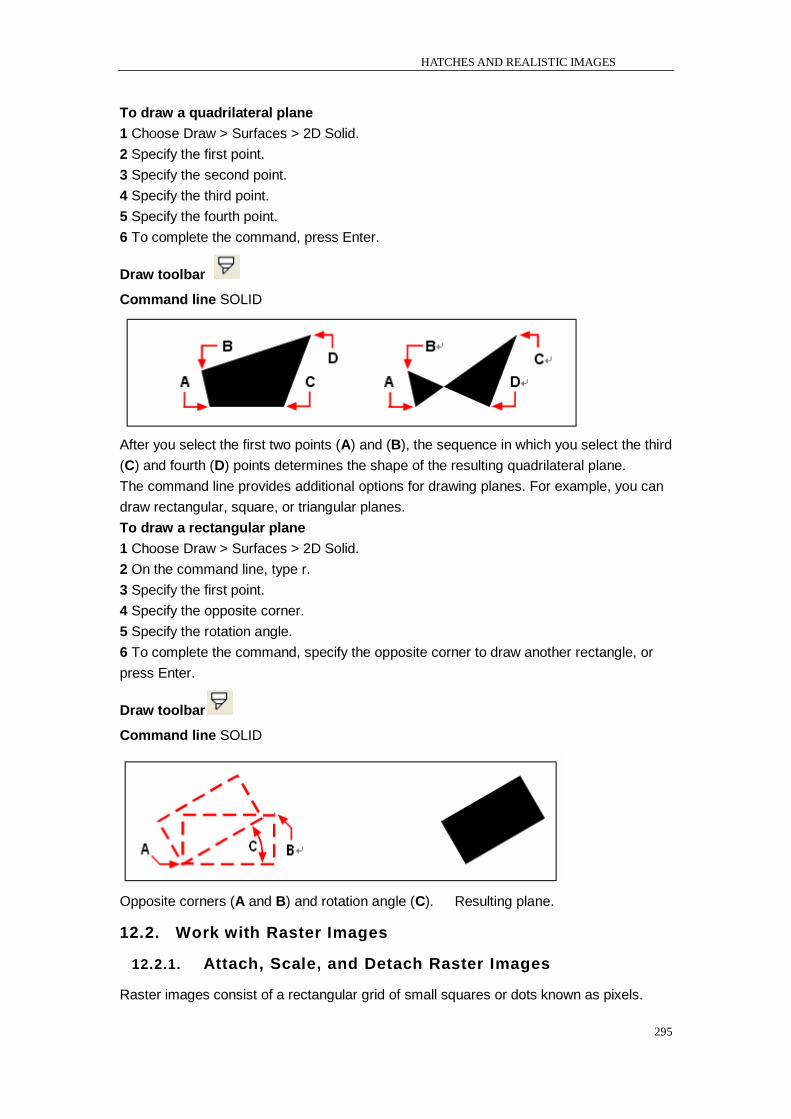
HATCHES AND REALISTIC IMAGES
295
To draw a quadrilateral plane
1 Choose Draw > Surfaces > 2D Solid.
2 Specify the first point.
3 Specify the second point.
4 Specify the third point.
5 Specify the fourth point.
6 To complete the command, press Enter.
Draw toolbar
Command line SOLID
After you select the first two points (A) and (B), the sequence in which you select the third
(C) and fourth (D) points determines the shape of the resulting quadrilateral plane.
The command line provides additional options for drawing planes. For example, you can
draw rectangular, square, or triangular planes.
To draw a rectangular plane
1 Choose Draw > Surfaces > 2D Solid.
2 On the command line, type r.
3 Specify the first point.
4 Specify the opposite corner.
5 Specify the rotation angle.
6 To complete the command, specify the opposite corner to draw another rectangle, or
press Enter.
Draw toolbar
Command line SOLID
Opposite corners (A and B) and rotation angle (C). Resulting plane.
12.2. Work with Raster Images
12.2.1. Attach, Scale, and Detach Raster Images
Raster images consist of a rectangular grid of small squares or dots known as pixels.
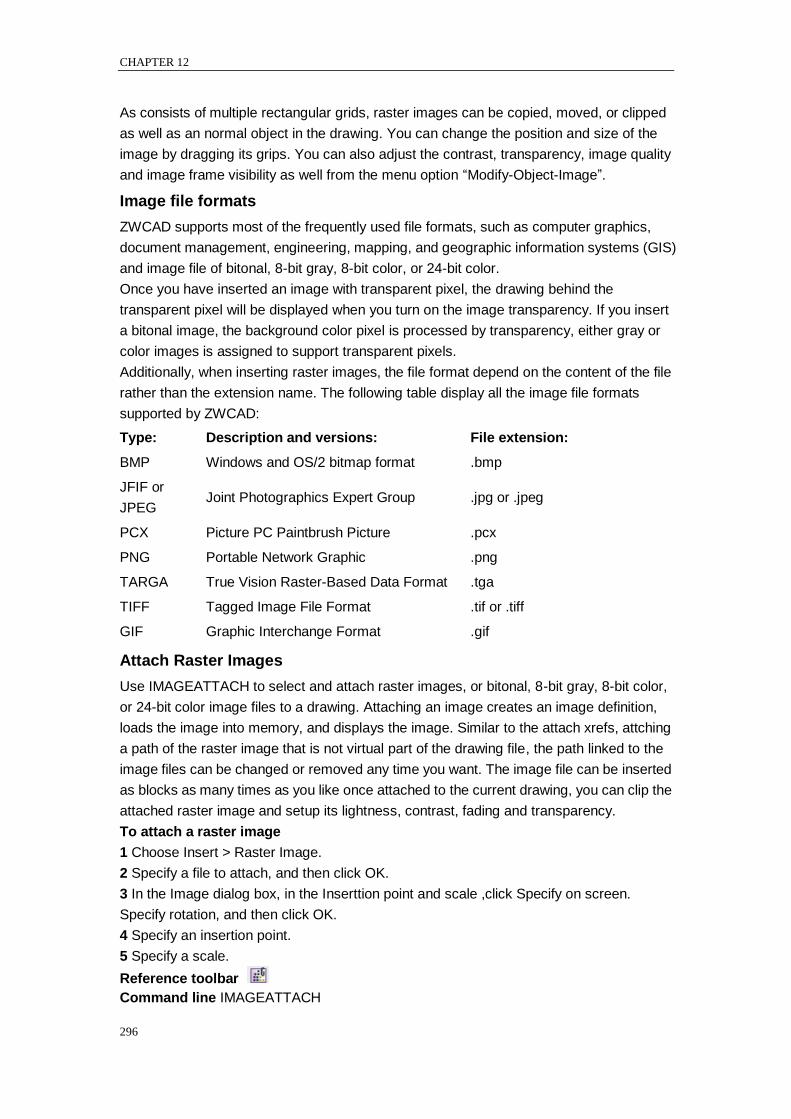
CHAPTER 12
296
As consists of multiple rectangular grids, raster images can be copied, moved, or clipped
as well as an normal object in the drawing. You can change the position and size of the
image by dragging its grips. You can also adjust the contrast, transparency, image quality
and image frame visibility as well from the menu option ―Modify-Object-Image‖.
Image file formats
ZWCAD supports most of the frequently used file formats, such as computer graphics,
document management, engineering, mapping, and geographic information systems (GIS)
and image file of bitonal, 8-bit gray, 8-bit color, or 24-bit color.
Once you have inserted an image with transparent pixel, the drawing behind the
transparent pixel will be displayed when you turn on the image transparency. If you insert
a bitonal image, the background color pixel is processed by transparency, either gray or
color images is assigned to support transparent pixels.
Additionally, when inserting raster images, the file format depend on the content of the file
rather than the extension name. The following table display all the image file formats
supported by ZWCAD:
Type: Description and versions: File extension:
BMP Windows and OS/2 bitmap format .bmp
JFIF or
JPEG Joint Photographics Expert Group .jpg or .jpeg
PCX Picture PC Paintbrush Picture .pcx
PNG Portable Network Graphic .png
TARGA True Vision Raster-Based Data Format .tga
TIFF Tagged Image File Format .tif or .tiff
GIF Graphic Interchange Format .gif
Attach Raster Images
Use IMAGEATTACH to select and attach raster images, or bitonal, 8-bit gray, 8-bit color,
or 24-bit color image files to a drawing. Attaching an image creates an image definition,
loads the image into memory, and displays the image. Similar to the attach xrefs, attching
a path of the raster image that is not virtual part of the drawing file, the path linked to the
image files can be changed or removed any time you want. The image file can be inserted
as blocks as many times as you like once attached to the current drawing, you can clip the
attached raster image and setup its lightness, contrast, fading and transparency.
To attach a raster image
1 Choose Insert > Raster Image.
2 Specify a file to attach, and then click OK.
3 In the Image dialog box, in the Inserttion point and scale ,click Specify on screen.
Specify rotation, and then click OK.
4 Specify an insertion point.
5 Specify a scale.
Reference toolbar
Command line IMAGEATTACH
HATCHES AND REALISTIC IMAGES
297
Positioning File
Tfw file is a .txt about TIFF image coordinates information, this file defines the affine
relation between image pixel coordinates and actual geographical coordinates, its basic
theory are shown as follows:
x'=Ax+By+C
y'=Dx+Ey+F
in which :
x'=geographical X coordinate corresponding to pixel
y'=geographical Y coordinate corresponding to pixel
x=pixel coordinate 【Colume number】
y=pixel coordinate 【Line number】
A=Pixel resolution at X direction
D、B=rotation system
E=Pixel resolution at Y direction
C=X coordinate of pixel center at left upper corner of grid map
F=Y coordinate of pixel center at left upper corner of grid map
Click Using Positioning file option, you can specify insertion point of tif iamge and its scale
using twf file.
Find button is available as soon as you check the "Using Positioning file" option, and click
on this button, you can select proper TFW file.
Scale Raster Images
To attach a raster image to current drawing, you can specify scale factor in the Image
dialog box, otherwise to attach it by its original size. The raster image will be scaled by the
specified factor, the scale factor is used without unit by default.
If the attached image contains resolution information for defining DPI, the specified scale
factor will be united with measure to scale attached raster image. If resolution information
is not included, then the original width of the image will be taken as unit for the scale factor
when attaching the image.
Detach Raster Images
Raster images can be detached if it no longer needs to use in the drawing, a specified
image detached from the drawing together with its multiple copies, links and definitions,
but the original image file will not be influenced.
Unlike detaching an image file, removing the image directly from the drawing retains the
image in Image manager. Only can detaching the image remove the links of the image
that connecting the drawing.
12.2.2. Modify and manage Raster Images
Controls the properties such as displaying and clipping boundary of raster images. You
can view and manipulate attached raster image and change its saving path in Image
Manager.
Show and Hide Raster Image Boundaries
Controls whether to display image boundary in current view using IMAGEFRAME
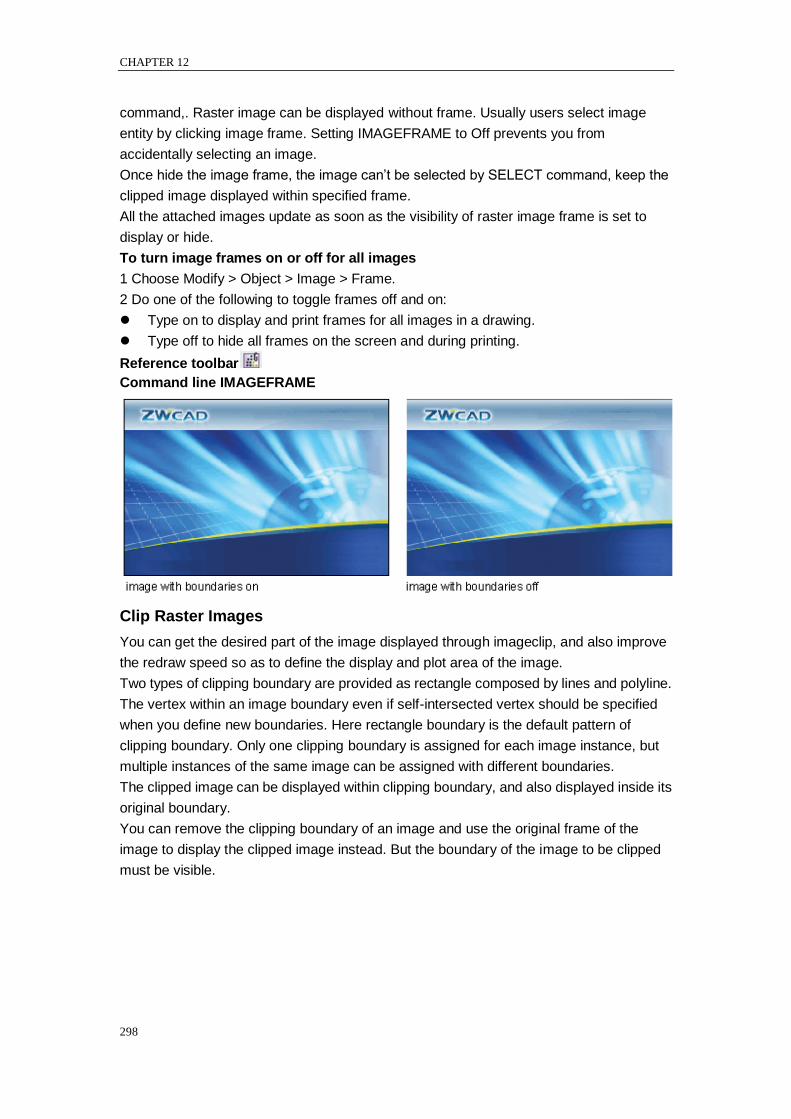
CHAPTER 12
298
command,. Raster image can be displayed without frame. Usually users select image
entity by clicking image frame. Setting IMAGEFRAME to Off prevents you from
accidentally selecting an image.
Once hide the image frame, the image can‘t be selected by SELECT command, keep the
clipped image displayed within specified frame.
All the attached images update as soon as the visibility of raster image frame is set to
display or hide.
To turn image frames on or off for all images
1 Choose Modify > Object > Image > Frame.
2 Do one of the following to toggle frames off and on:
Type on to display and print frames for all images in a drawing.
Type off to hide all frames on the screen and during printing.
Reference toolbar
Command line IMAGEFRAME
Clip Raster Images
You can get the desired part of the image displayed through imageclip, and also improve
the redraw speed so as to define the display and plot area of the image.
Two types of clipping boundary are provided as rectangle composed by lines and polyline.
The vertex within an image boundary even if self-intersected vertex should be specified
when you define new boundaries. Here rectangle boundary is the default pattern of
clipping boundary. Only one clipping boundary is assigned for each image instance, but
multiple instances of the same image can be assigned with different boundaries.
The clipped image can be displayed within clipping boundary, and also displayed inside its
original boundary.
You can remove the clipping boundary of an image and use the original frame of the
image to display the clipped image instead. But the boundary of the image to be clipped
must be visible.
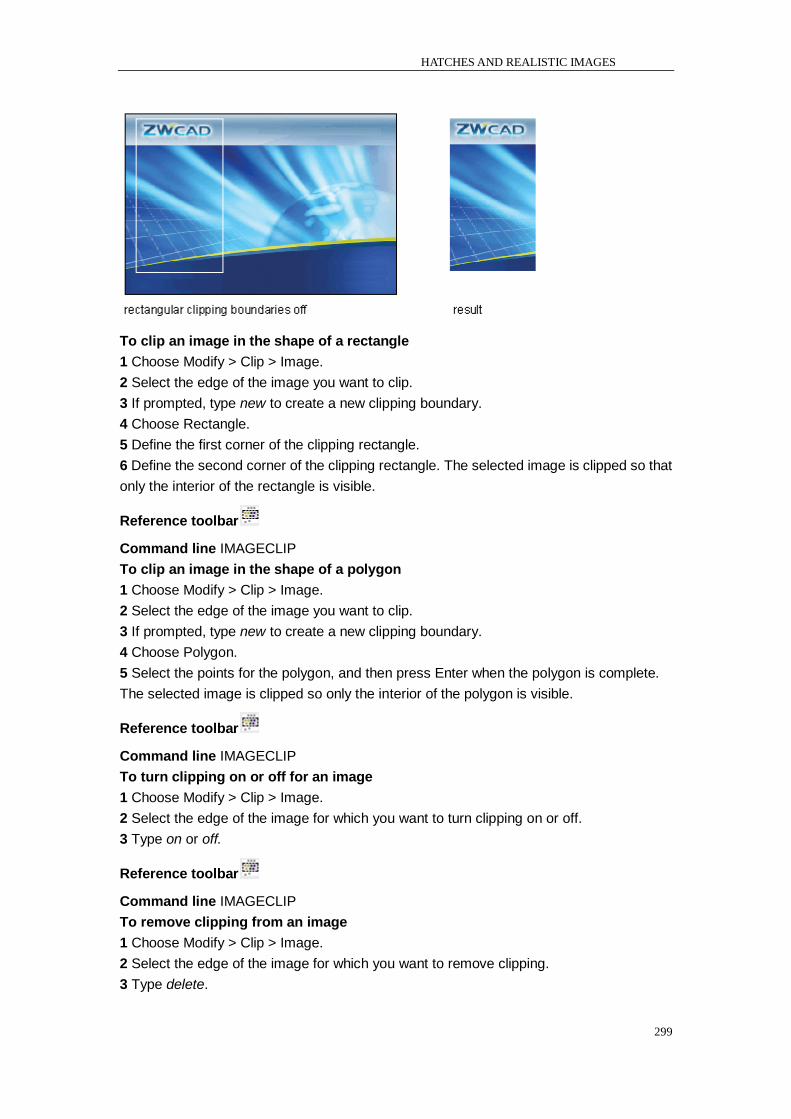
HATCHES AND REALISTIC IMAGES
299
To clip an image in the shape of a rectangle
1 Choose Modify > Clip > Image.
2 Select the edge of the image you want to clip.
3 If prompted, type new to create a new clipping boundary.
4 Choose Rectangle.
5 Define the first corner of the clipping rectangle.
6 Define the second corner of the clipping rectangle. The selected image is clipped so that
only the interior of the rectangle is visible.
Reference toolbar
Command line IMAGECLIP
To clip an image in the shape of a polygon
1 Choose Modify > Clip > Image.
2 Select the edge of the image you want to clip.
3 If prompted, type new to create a new clipping boundary.
4 Choose Polygon.
5 Select the points for the polygon, and then press Enter when the polygon is complete.
The selected image is clipped so only the interior of the polygon is visible.
Reference toolbar
Command line IMAGECLIP
To turn clipping on or off for an image
1 Choose Modify > Clip > Image.
2 Select the edge of the image for which you want to turn clipping on or off.
3 Type on or off.
Reference toolbar
Command line IMAGECLIP
To remove clipping from an image
1 Choose Modify > Clip > Image.
2 Select the edge of the image for which you want to remove clipping.
3 Type delete.
CHAPTER 12
300
Reference toolbar
Command line IMAGECLIP
Change Raster Image Brightness, Contrast, and Fade
Use IMAGEADJUST to adjust displaying result and lightness, contrast and fade that are
related to the display and plot effect when plotting drawings, IMAGEADJUST does not
affect the original raster image as well as other instances of the image.
You can set lightness and contrast to better preview images of lower quality.
To change the fade of the image, geometric lines will be clearly viewed and add
watermark effects when plotting the image.
If you attach a bitonal image into the drawing, you can‘t set the lightness, contrast, and
fade. Bitonal images are displayed as background color of current screen, and plotted as
white.
Modify Color and Transparency for Bitonal Raster Images
Bitonal raster Image contain a foreground color and a background color, so that the
current color settings determine the foreground color of the bitonal image as attached into
the drawing. Although the lightness, contrast, and fade are not adjustable for bitonal
images, you can modify the foreground color of the image and control its transparency
from the Properties palette.
NOTE: Bitonal images and their boundaries are always the same color.
View Raster Image Information
The raster images already attached to the drawing are displayed in list or tree view in
Image manager. You can click Details button to view the relevant information of the raster
image.
List View
System defaults to use List view for displaying the name, status(load, unload or not found),
size, type, last save date and time as well as saving path of the image file.
Click on the column title to rank the images. If the original file of the inserted image is
missing, the image status is displayed as ―Not found‖. Images that are unloaded or not
found in the image manager will not be displayed in the drawing.
Tree View
Sorts the raster images in tree view and display the hierarchy of the images nested in
xrefs and blocks.
View Image File Details
Click DETAIL button to preview a selected image and view image file details, including
image name, saved path, active path (where the image is found), file creation date, file
size, file type, color, color depth, image size (pixel width and height, resolution and default
size).
Assign Descriptive Names to Raster Images
You can change the name of an image by double click the file listed on the image
manager. You can assign the image name different from the its file name, the image is
attached into the drawing without extension name.
HATCHES AND REALISTIC IMAGES
301
To rename an image, any name within 255 characters including letters, numbers, spaces
and all the special characters Microsoft® Windows® or ZWCAD can be used.
If two raster images of the same name originated from different paths are attached to the
drawing, system automatically distinguish them by adding numbers after the image name.
Change File Paths of Raster Images
The raster images already attached to the drawing are displayed in Image manager and
its saving path is displayed in ―Image found at‖ option at the bottom of Image manager.
Where the saving path is the virtual path for searching the image file.
If the original image attached to the drawing is not exist in the saving path or any defined
searching path, the status of the image is displayed as Not found and the ―Image found at‖
box is blank.
The Drawing File Search Path can be set or modified at the Files tab in Options dialog box,
so that the raster image of the drawing file can be located. If the raster image having been
attached to the drawing is moved to another folder, its relative path or absolute path
information will be removed from its file name (for example, to turn \images\tree.tga or
c:\my project\images\tree.tga into tree.tga), and search for the path defined at Drawing
File Search Path the Files tab in Options dialog box.
If the specified extension name of the drawing is not found at the saving path, system
searches for all the image file extension names.
The path of the image can be removed, or directly edit the path in Image found at box and
then select Save path to specify its relative path. This may be different from the path in
Image found at box. Changing the path in Image Manager does not affect settings in
―Drawing File Search Path‖.
To change the path for a raster image
1 Choose Insert > Image Manage.
2 Select the desired file.
3 Click the Browse button.
4 Select the file with its new name or in its new location, and then click Open.
5 Click Save Path.
Insert toolbar
Command line IMAGE
Load and Unload Raster Images
If excessive raster images exist in current drawing, you can unload the undesired images
so as to raise the capability of your computer. Once the raster image is unloaded from the
drawing, it‘ll be displayed as image boundary disabled of plotting. And the links of the
image does not change after unloaded. If too much images attached to the drawing cause
memory lacking in process of opening the drawing, system automatically unload part of
image files.
Once unloaded, you can reload the images already unloaded from the drawing. If you
close the unloaded drawing after saving it, this drawing file is only available by reloading it
next time you open the drawing.
To unload and reload a raster image
CHAPTER 12
302
1 Choose Insert > Image Manage.
2 Select the file you want to unload or reload.
3 Do one of the following:
To unload the image so only its outer edge displays, click Unload.
To reload the image so its contents display and print, click Reload.
Insert toolbar
Command line IMAGE
Improve the Display Speed of Raster Images
The display quality of images may affect its properties directly, the higher the quality, the
longer it displayed. Any changes to the image display speed will be updated immediately
rather than redraw the drawing. System plots the drawing at its high quality.
You can adjust the display speed by setting the raster image quality. The image quality is
sorted into high and draft levels, If the quality is set to draft, the image will be displayed
with some granular materials, however with faster display speed.
If the attached raster image uses true color ( 24 or 32 bit each pixel), you can adjust
relevant options in Display tab on Options dialog box so as to improve the image quality.
System takes a long time to redraw the drawing when it displayed at high quality. To
improve the capability, it‘s suggested to reduce the color number set at the display option.
In purpose of improve the redraw speed, you can hide the undesired images in current
drawing operations through Show image option on the Properties palette. The hidden
image will be neither displayed on the screen nor plotted, only displayed as a boundary.
To hide an image, you may ignore the UCS of current viewport.
To change the quality of all images in a drawing
1 Choose Modify > Object > Image > Quality.
2 Do one of the following:
Type high to use high quality images.
Type draft to use draft quality images, which require smaller amounts of system
resources.
Reference toolbar
Command line IMAGEQUALITY
Use Tiled Images
Tiled image is a series of small parts of large images. Loading tiled images is faster than
loading those untiled images due to the tiled images redraws its modified parts to save
time in loading images. ZWCAD supports TIFF for tiled image file format which is also
available for bitonal gray ( 1 bit per pixel) and index color ( 8 bit per pixel), true color( 24 or
32 bit per pixel).
Tiled TIFF images can be saved by image scanners. But you must limit the pixel within the
range 64 × 64 to 512 × 512 when tiling images. You can get programs that support other
tiled file formats from third party program developer.
Suppress Highlighting When Selecting Images

HATCHES AND REALISTIC IMAGES
303
Generally, the image will be highlighted once selected. Set the ―Highlight raster image
frame only‖ option in ―Display‖ tab on ―Options‖ dialog box to turn on or off the highlight
mode for the specified raster image. Besides, system variable IMAGEHLT is also
available for controlling the highlight mode of the image frame. Set the IMAGEHLT to 0,
only highlight the frame of the raster image. You should turn off highlight mode for the
whole drawing so as to improve the capabilities of your computer.
Change the Temporary Swap File Location of Raster Images
Temporary swap file is useful when you want to reduce the memory space that image file
occupies. Windows Temp folder is the default saving path provided by system, you can
also specify new Temp file search path in Files tab on Options dialog box.
CHAPTER 13
304
13. Layout , Plot and Publish
Drawings
13.1. Create Multiple-View Drawing Layouts
You can print your drawing directly from the Model tab where you created it, or you can
create custom layouts for printing on Layout tabs.
When printing from the Model tab, you can print your drawing exactly the way it appears,
or you can modify the drawing before printing by adding dimensions, a legend, or a title
block.
You typically use the Layout tabs for printing if you require multiple print layouts. You may
also want to use a Layout tab for printing even if you want your drawing printed only one
way.For example, if you want to include large amounts of text on your printed drawing,
you can add the text to a Layout tab so it does not clutter your drawing while you work on
the Model tab.
13.1.1. Overview of Layout
A layout represents a plotted page on which one or more model views are displayed.
ZWCAD provides two collateral working environments as Model tab and Layout tab. You
can create thematic models on Model tab. Multiple snapshots of the model can be set in
Layout tab.
Enable unlimited drawing area on Model tab. You can draw a picture at the scale of
1:1, and define which unit to be used as the measurement units of the drawing (here
Inch is for brackets and metric is for bridges).
Virtual drawing paper is accessible in Layout tab. When setting layouts, the drawing
can be displayed as the paper size. A layout represents a plotted page which is
so-called paper space.
You can get the objects created in model space displayed on paper space by creating
multiple viewports. And you can create dimensions as well as other geometric objects in
layouts. Each viewport are capable of displaying objects in model space in specified
proportion.
System provides two layouts by default, called layout 1 and layout 2. You can create as
many layouts as you want, with various page setup and size for each layout. If you are
working with a template file, default layout configuration may be different.
When you create a drawing, you do most of your work on the Model tab. Each drawing
that you create can contain numerous layouts that simulate the paper on which you will
print a copy of the drawing. Each of these layouts is created on a Layout tab. You can
prepare a separate layout for each way you want to print your drawing. The layout allows
you to organize different views to control which portion of your drawing prints and at what
scale.
LAYOUT, PLOT AND PUBLISH DRAWINGS
305
Use these general steps to prepare your drawing for printing multiple layouts:
1 On the Model tab, create your drawing.
2 Create a new layout. You can use an existing Layout1 or Layout2 tab, or you can create
a new Layout tab.
3 Create at least one layout viewport on the Layout tab. Use each viewport to help control
which portion of the drawing prints and at what scale.
4 Specify additional settings for the layout, such as the scale of the drawing, print area,
print style tables, and more.
5 Print or plot your drawing.
You can right click on Layout tab and select New to create new layout, and also import
layout from template.
Options on Shortcut menu are listed as follows:
New: Creates new layouts
Delete: Removes specified layouts
Rename: Renames a layout
Copy and Move: Creates copies of the selected layout and rearrange the layouts on
layout tab.
From Template: Imports layout from template file.
Work with Model Space and Paper Space
Model space is generally used for designing drawings, creating and editing drawings.
Preparations for plotting is usually working on paper space for the drawings on layouts is
close to the plotting effects.
When you start a drawing session, your initial working area is called model space. Model
space is an area in which you create two dimensional and three dimensional objects
based on either the World Coordinate System (WCS) or a user coordinate system (UCS).
You view and work in model space while using the Model tab.
Your view of this area is a single viewport that fills the screen. You can create additional
views on the Model tab, called viewports, which can show the same or different two
dimensional or three dimensional views, all of which are displayed in a tiled manner. You
can work in only one of these viewports at a time on the Model tab, and you can print only
the current viewport.
ZWCAD provides an additional work area, called paper space. The contents of paper
space represent the paper layout of your drawing. In this work area, you cancreate and
arrange different views of your model similar to the way you arrange detail drawings or
orthogonal views of a model on a sheet of paper.
You view and work in paper space while using a Layout tab. Each view, or layout viewport,
that you create in paper space provides a window of your drawing in model space. You
can create one layout viewport or several. You can place layout viewports anywhere on
the screen; their edges can be touching or not; and you can print them all at the same
time.
You do not need to use paper space to print your drawing, but it offers several
advantages:
Print the same drawing with different print settings that you save with each layout, for
example, printer configuration files, print style tables, lineweight settings, drawing scale,
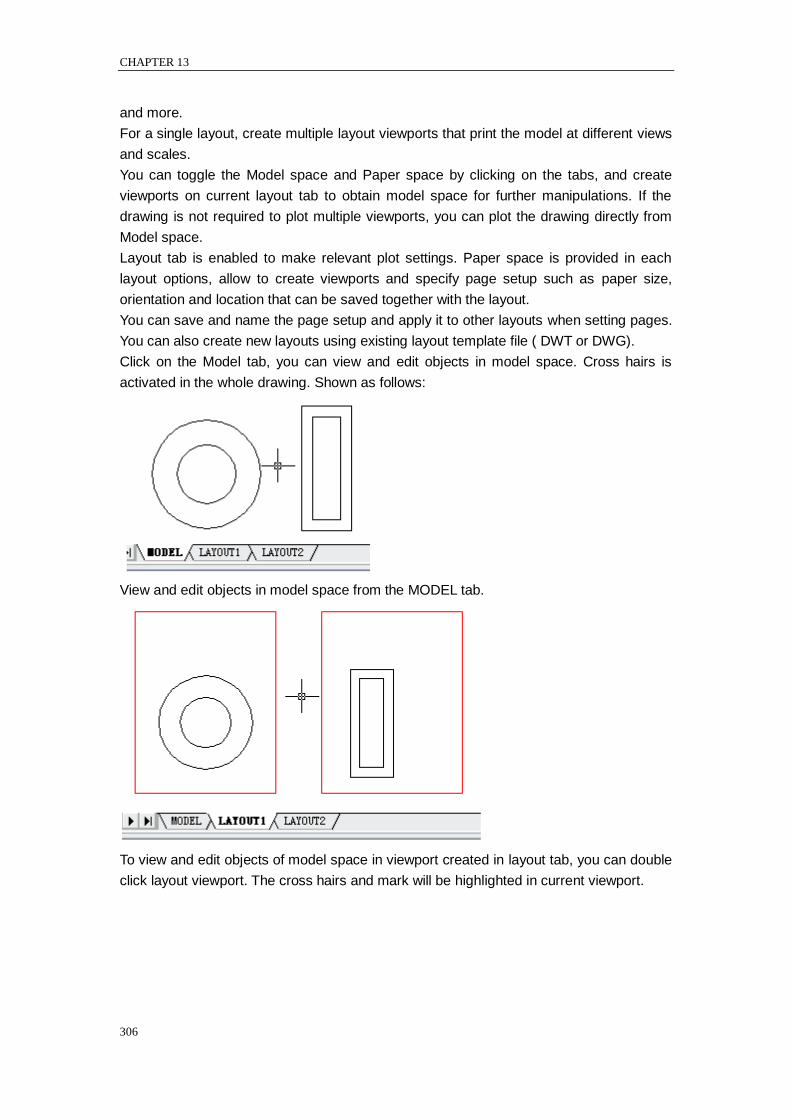
CHAPTER 13
306
and more.
For a single layout, create multiple layout viewports that print the model at different views
and scales.
You can toggle the Model space and Paper space by clicking on the tabs, and create
viewports on current layout tab to obtain model space for further manipulations. If the
drawing is not required to plot multiple viewports, you can plot the drawing directly from
Model space.
Layout tab is enabled to make relevant plot settings. Paper space is provided in each
layout options, allow to create viewports and specify page setup such as paper size,
orientation and location that can be saved together with the layout.
You can save and name the page setup and apply it to other layouts when setting pages.
You can also create new layouts using existing layout template file ( DWT or DWG).
Click on the Model tab, you can view and edit objects in model space. Cross hairs is
activated in the whole drawing. Shown as follows:
View and edit objects in model space from the MODEL tab.
To view and edit objects of model space in viewport created in layout tab, you can double
click layout viewport. The cross hairs and mark will be highlighted in current viewport.
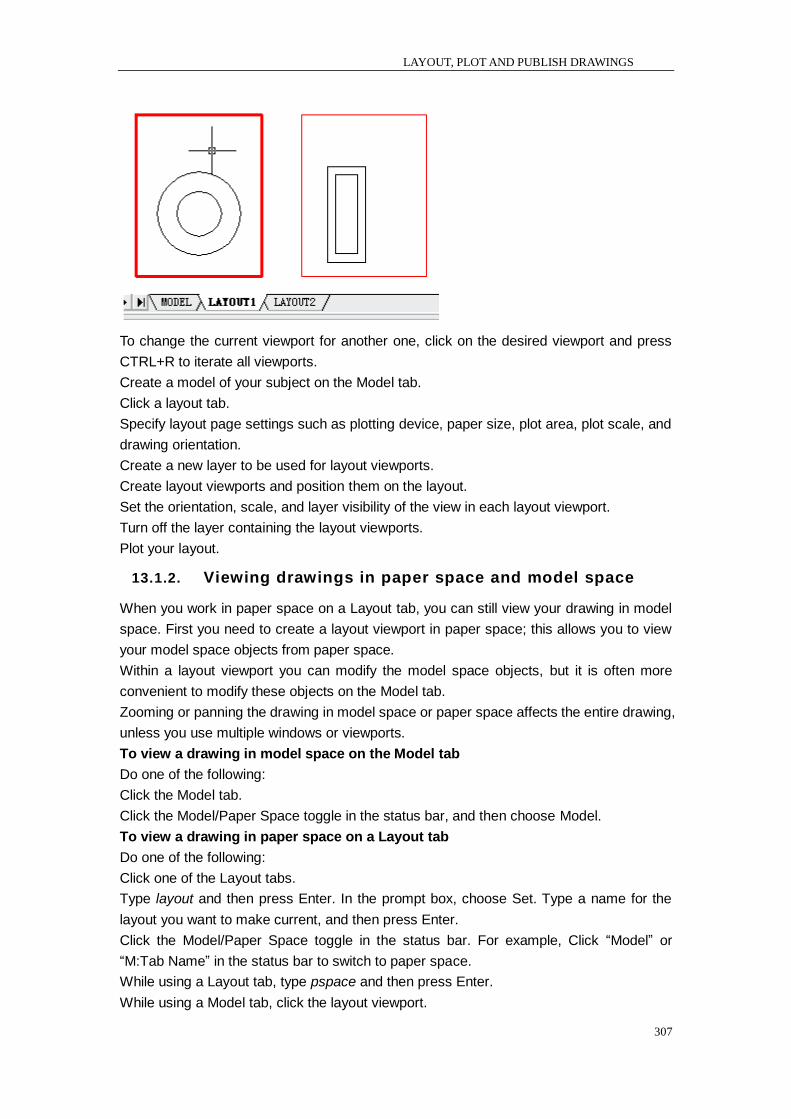
LAYOUT, PLOT AND PUBLISH DRAWINGS
307
To change the current viewport for another one, click on the desired viewport and press
CTRL+R to iterate all viewports.
Create a model of your subject on the Model tab.
Click a layout tab.
Specify layout page settings such as plotting device, paper size, plot area, plot scale, and
drawing orientation.
Create a new layer to be used for layout viewports.
Create layout viewports and position them on the layout.
Set the orientation, scale, and layer visibility of the view in each layout viewport.
Turn off the layer containing the layout viewports.
Plot your layout.
13.1.2. Viewing drawings in paper space and model space
When you work in paper space on a Layout tab, you can still view your drawing in model
space. First you need to create a layout viewport in paper space; this allows you to view
your model space objects from paper space.
Within a layout viewport you can modify the model space objects, but it is often more
convenient to modify these objects on the Model tab.
Zooming or panning the drawing in model space or paper space affects the entire drawing,
unless you use multiple windows or viewports.
To view a drawing in model space on the Model tab
Do one of the following:
Click the Model tab.
Click the Model/Paper Space toggle in the status bar, and then choose Model.
To view a drawing in paper space on a Layout tab
Do one of the following:
Click one of the Layout tabs.
Type layout and then press Enter. In the prompt box, choose Set. Type a name for the
layout you want to make current, and then press Enter.
Click the Model/Paper Space toggle in the status bar. For example, Click ―Model‖ or
―M:Tab Name‖ in the status bar to switch to paper space.
While using a Layout tab, type pspace and then press Enter.
While using a Model tab, click the layout viewport.
CHAPTER 13
308
The first time you switch to a Layout tab, your drawing seems to disappear. This is
normal.You must create at least one layout viewport to see your model.
To view a drawing in model space on a Layout tab
Do one of the following:
Click the desired Layout tab, and then create and view a layout viewport.
Click the Model/Paper Space toggle in the status bar.
While using a Layout tab, double click inside of the layout viewport.
13.1.3. Specify Layout Settings
Once created a drawing in Model tab, you can toggle to Layout tab and setup the layout
for plotting such as paper size, drawing orientation.
You can right click on the Layout tab to create new layouts or import from template files,
and then click Modify button on the Page Setup dialog box to set the page.
Select a Paper Size for a Layout
The paper size here refers to the size of the drawing. When you start Plot dialog box in
Layout tab, you can assign the paper type from pull down list of the Paper text box. The
Paper size is directly previewed from the sketch with its size and units. The available
paper types provided in the pull down list are decided by current configuration. If you want
to configure plotters to export raster images, you must specify output size by pixels. The
paper size can be customized in the Virtual EPs Driver 1.0 Advanced Document Settings.
If you specified a system plotter, the paper size is decided by the default paper settings
provided in the Windows control panel. If any changes have been set to the paper size in
Plot dialog box, the new size will be saved in the layout to be used instead of the size in
PCP.
Determine the Drawing Orientation of a Layout
The drawing orientation is sorted into Landscape and Portrait, which decide the plotting
orientation of the drawing to be seen on a paper. If you select Landscape, plots the
drawing using the length edge as horizontal. While selecting Portrait to plot the drawing
using its minor edge as horizontal Changing the drawing orientation just like rotating the
paper under the drawing.
Once specified the drawing orientation, you can control whether to plot the top or the
bottom of the drawing by selecting Plot Upsize-down option.
The changes setup in Page Setup dialog box are still saved in layouts. A certain page
settings can be replaced by customized plot settings, but the settings will not be saved in
the layout. Unless you click Apply to layout check box.
Additionally, changing the drawing orientation will not affect the position of plot origin
which is located at left lower corner on the page once rotated.
Adjust the Plot Offset of a Layout
You can offset the geometry on the paper by entering a positive or negative value in the X
and Y Offset boxes. Changing the plotting origin may change the position of drawing on
papers.
The plot origin locates at the left lower corner of plotting area with offset value of 0 relative
to X and Y direction. The drawing will be moved relative to the left lower corner of the
paper once you assigned positive or negative value to the plot offset. While a negative

LAYOUT, PLOT AND PUBLISH DRAWINGS
309
offset assigns the drawing plotted under the left lower corner of the paper and results in
the plot area being clipped.
Select Center on Paper if the specified plot area is part of the drawing rather than the
whole layout, which changes the position of plot origin.
Set the Plot Area of a Layout
You can set the area to be plotted in Plot dialog box. When creating new layouts, default
plot option is drawing limits that is to plot all the objects within the drawing paper. With the
plot origin of (0,0), located at the left lower corner of the page.
ZWCAD provides the following methods to select plot area:
Current View. Plots the contents in current view.
Save View. Plots a view saved previously with the VIEW command. You can select a
named view from the list provided. This option is unavailable if there are no saved views in
the drawing.
Extents. Plots the portion of the current space of the drawing that contains objects.
Limits. When plotting a layout, plots everything within the printable area.
Window. Plots any portion of the drawing you specify within the rectangle window. Click
the Window button to use a pointing device to specify opposite corners of the area to be
plotted, and then return to the Plot dialog box.
Set the Plot Scale for a Layout
When you specify a scale to output your drawing, you can choose from a list of real-world
scales, enter your own scale, or choose Fit to Paper to scale the drawing to fit onto the
selected paper size.
Usually, the objects in model space are displayed at the scale set in layout viewports. To
plot the objects in model space with the scale specified in layouts, you assign the scale to
1:1.
Set the Lineweight Scale for a Layout
Even if plot scale of layouts is assigned, it‘s enabled to scale the lineweight at a certain
scale. Scaling the lineweight is nothing to do with the plot scale when plotting drawings,
which is mainly used for the lines included in the objects to be plotted.
In most cases, you choose to plot layouts with default plotting scale of 1:1. However, to
plot the layout scaled by paper size A on another paper size E, you should scale
lineweights to fit the new plot scale.
Copy and Move Layouts
You can right click on the Layout tab to select Copy and Move option, on the Copy and
Move dialog box, select the target moving position and the place to put the copy of the
layout, click Create a copy to copy the selected layout, otherwise only moves the layout
CHAPTER 13
310
position. You should notice that Model tab can‘t be copied or moved.
If multiple layouts are created in the drawing or too long a layout name to be displayed at
the bottom of the drawing area, you can display the tab according to the arrowhead. The
arrowhead with a vertical line represents the first and last tab individually. The current tab
may not be displayed when moving the tabs.
Save time by reusing layouts that you have already created. Within the same drawing, you
may want to make a copy of a layout that contains most of the settings you want, and then
make changes to the new copy. If you created layouts that you want to use again when
you create new drawings, you can save the layouts as a drawing template.
To make a copy of a layout
1 Type layout and then press Enter.
2 On the command line, type Copy.
3 Type the name of the layout you want to copy, and then press Enter.
4 Type a name for the new layout, and then press Enter.
Creating a new layout
In ZWCAD, you can create multiple layouts for a single drawing. Each layout represents a
sheet of paper. For each layout you can specify the print area, print styles, print scale,
lineweight scale, pen mappings, and add viewports, dimensions, a title block, and other
geometry specific to the layout. The objects you add to a layout in paper space do not
appear in model space.
When you create a new drawing, the drawing automatically contains two default
layouts:Layout1 and Layout2. You can start by using one of the default layouts, you can
create your own, or your can create a new layout from another template (.dwt) file,
drawing (.dwg) file, or drawing interchange (.dxf) file.Each drawing can contain up to 255
layouts.
To create a new layout using the Layout1 or Layout2 tab
1 Right click the Layout1 or Layout2 tab,select NEW.
2 Set up at least one layout viewport.
3 If desired, rename the layout.
To create a new layout using a new Layout tab
1 Choose Insert > Layout > New Layout.
2 Type a unique name for your layout and then press Enter.
The name can be up to 255 characters in length and can contain letters, numbers, the
dollar sign ($), hyphen (-), and underscore (_), or any combination.
3 Set up at least one layout viewport.
Layout toolbar
Command line LAYOUT
Create Layout from Template
Right click on the Layout tab to select From template option to import DWG or DWT file
directly, using information of existing template to create new layouts.
Template layout instances are provides for designing new layouts including viewport
objects. Objects of paper space and page setup of existing template are used by new
layouts. Thus, layout objects will be displayed in paper space as well as viewport objects.
LAYOUT, PLOT AND PUBLISH DRAWINGS
311
User can retain existing objects imported from template and also delete objects. Any
object from model space can‘t be imported while creating layout from template.
System provides template file with extension name as .dwt. Layout templates from any
drawing templates can be imported into the current drawing.
To create a new layout from an existing file
1 Choose Insert > Layout > Layout from Template.
2 Select the desired template, drawing, or drawing interchange file that contains the layout
you want, and then click Open.
3 Select the layout(s) from the template file, and then click OK. You can choose multiple
layouts by holding down Ctrl while selecting layout names.
Layout toolbar
Command line LAYOUT
Save layouts
Any drawing created in ZWCAD can be saved as template drawing file ( .dwt) together
with all the objects and layout settings. Using save option of LAYOUT command to save
the layout as new DWT file. By default, template files are saved in the template file
searching path located under the corresponding position in Files tab of Options dialog box.
Like drawing template file, Layout template file go with the same extension name that
contain some irrelevant information to the layouts.
When saving a drawing containing new layouts as template file, all the named objects
used in the layout ( such as blocks, layers and dimension styles) will be saved as well.
The defined table options are imported as part of the layout settings together with
template file. Once a template file is saved using Save option of LAYOUT command, the
define table options will not be inserted together with the layout.
Use PURGE command to clear the undesired define table options.
To save a layout as a drawing template
1 Type layout and then press Enter.
2 On the command line, type Save.
3 Type the name of the layout that you want to save, and then press Enter.
4 Specify the file name and location for the template, and then click Save.
After you save a layout as a template, you can use the template when you create new
drawings.
You can also import the template‘s layouts into another drawing.
Create and Use Named Page Setups
Once you have set plot device, plot style table and relevant page setup in the plot dialog,
you can save the page as named page setup which is usually used for updating current
setting of Plot dialog box. Applying different page setups to the same layout may obtain
specific plot result. For example, you can create named page setups listed below to
control scale factor and drawing size.
Page setup name Description
NoScaling Plot at scale 1:1, E-size sheet
Scale 1 to 2 Plot at scale 1:2, C-size sheet
CHAPTER 13
312
Draft Plot to the draft-quality plotter
Final Plot to the high-quality plotter
Fit-to-Paper Fit to Paper, A-size sheet
Page setup is saved together with the drawing file, for the convenience of plotting without
setting the page each time. If you want to plot the same layout for several times or specify
output options for multiple layouts, you can use named page settings.
Managing layouts in a drawing
You can rename layouts, delete layouts, and view a list of all layouts available in a drawing.
You can also change the order in which the Layout tabs appear; the Model tab is always
stationary.
If you want to rename, delete, or reorder a layout when the Layout tabs are hidden, you
can type layout to make your changes or choose Screen Menu > Tabs to display the tabs.
To rename a layout
1 Right click the Layout tab to rename.
2 Type a new name for the layout.
3 Click OK.
The name can be up to 255 characters in length and can contain letters, numbers, the
dollar sign ($), hyphen (-), and underscore (_), or any combination.
To delete a layout
1 Right click the Layout tab to delete.
2 Click OK to confirm the deletion.
NOTE You cannot delete the Model tab or the last remaining Layout tab. To delete all
geometry from the Model tab or a Layout tab, first select all geometry and then use the
Erase command.
To view a list of all layouts
1 Type layout and then press Enter.
2 On the command line, type ? to list all layouts.
3 Type s or press Enter to scroll through the layouts.
13.1.4. Create and Modify Layout Viewports
When you begin working in a drawing on the Model tab, it consists of a single view of your
model. You may have created additional views by dividing the drawing space into multiple
windows; each window is a separate viewport on the Model tab.
On a Layout tab, you must create at least one layout viewport to see your model. However,
you can create multiple layout viewports that display unique views of your model located
in model space.Each layout viewport is created as a separate entity that you can move,
copy, or delete.
Click any layout viewport to make it the current viewport, and then add or modify model
space objects in that viewport. Any changes you make in one layout viewport are
immediately visible in the other viewports (if the other layout viewports are displaying that
portion of the drawing). Zooming or panning in the current viewport affects only that
viewport.
Create layout viewports
The first time you switch to a Layout tab, all of your model space objects disappear. You
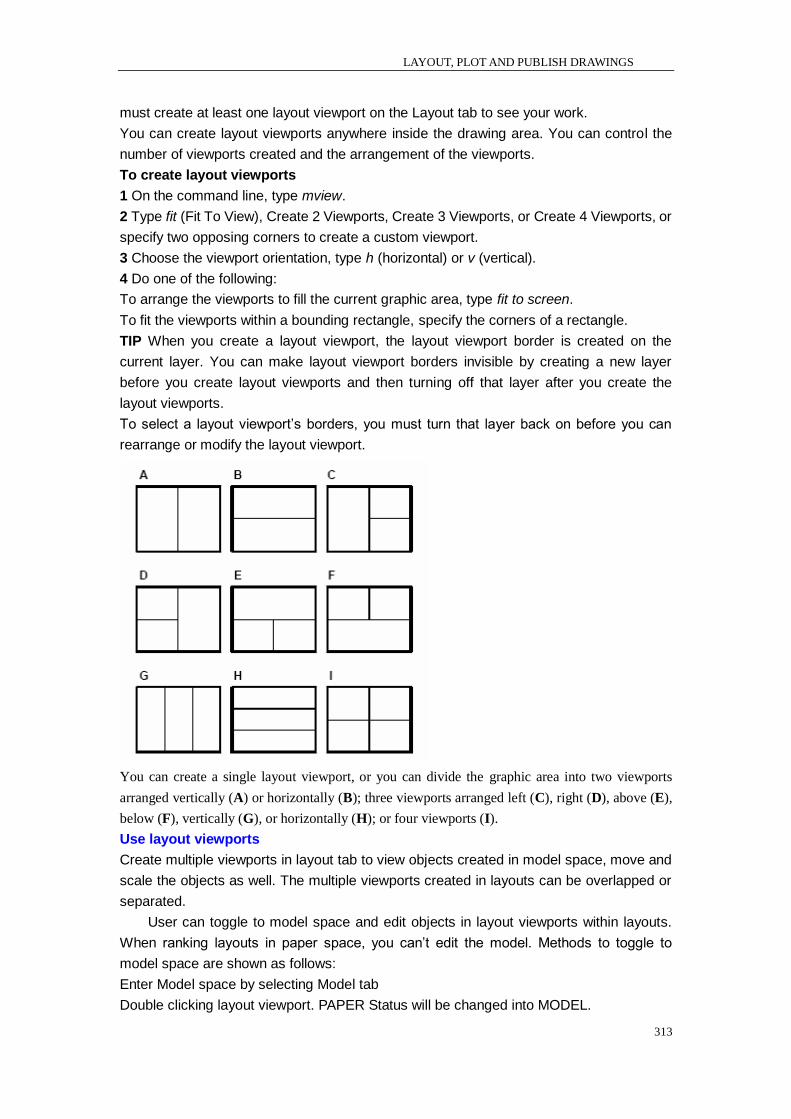
LAYOUT, PLOT AND PUBLISH DRAWINGS
313
must create at least one layout viewport on the Layout tab to see your work.
You can create layout viewports anywhere inside the drawing area. You can control the
number of viewports created and the arrangement of the viewports.
To create layout viewports
1 On the command line, type mview.
2 Type fit (Fit To View), Create 2 Viewports, Create 3 Viewports, or Create 4 Viewports, or
specify two opposing corners to create a custom viewport.
3 Choose the viewport orientation, type h (horizontal) or v (vertical).
4 Do one of the following:
To arrange the viewports to fill the current graphic area, type fit to screen.
To fit the viewports within a bounding rectangle, specify the corners of a rectangle.
TIP When you create a layout viewport, the layout viewport border is created on the
current layer. You can make layout viewport borders invisible by creating a new layer
before you create layout viewports and then turning off that layer after you create the
layout viewports.
To select a layout viewport‘s borders, you must turn that layer back on before you can
rearrange or modify the layout viewport.
You can create a single layout viewport, or you can divide the graphic area into two viewports
arranged vertically (A) or horizontally (B); three viewports arranged left (C), right (D), above (E),
below (F), vertically (G), or horizontally (H); or four viewports (I).
Use layout viewports
Create multiple viewports in layout tab to view objects created in model space, move and
scale the objects as well. The multiple viewports created in layouts can be overlapped or
separated.
User can toggle to model space and edit objects in layout viewports within layouts.
When ranking layouts in paper space, you can‘t edit the model. Methods to toggle to
model space are shown as follows:
Enter Model space by selecting Model tab
Double clicking layout viewport. PAPER Status will be changed into MODEL.
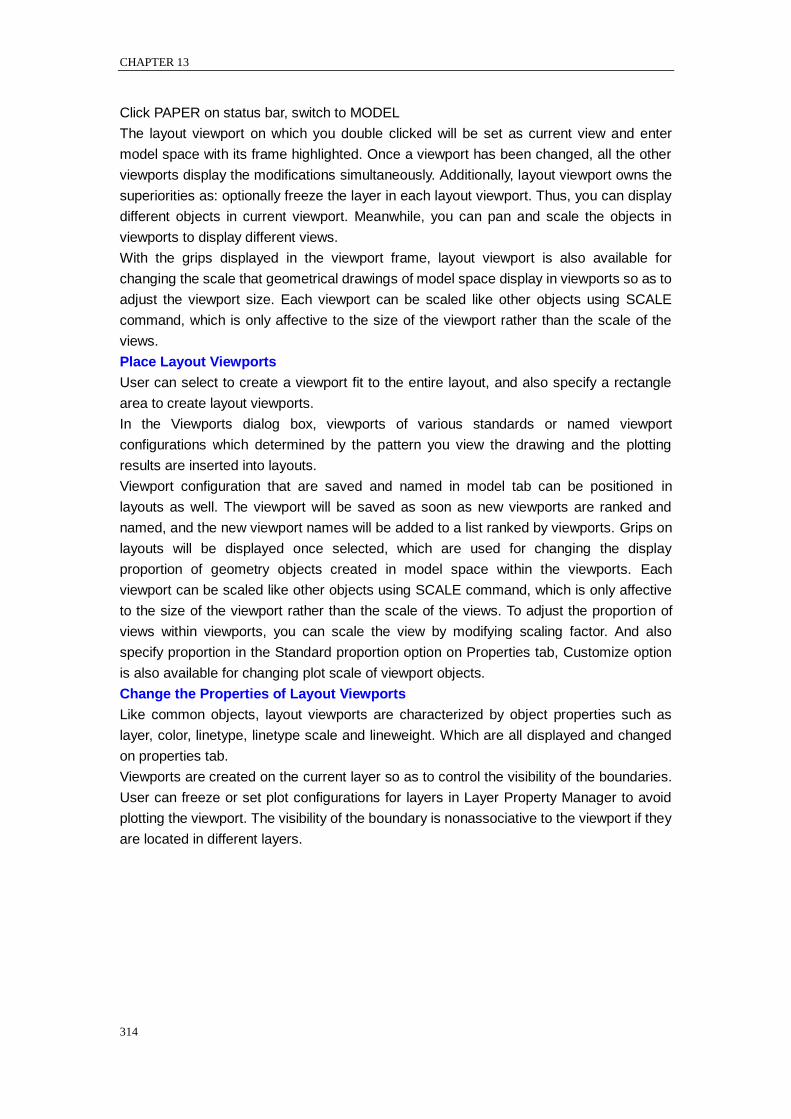
CHAPTER 13
314
Click PAPER on status bar, switch to MODEL
The layout viewport on which you double clicked will be set as current view and enter
model space with its frame highlighted. Once a viewport has been changed, all the other
viewports display the modifications simultaneously. Additionally, layout viewport owns the
superiorities as: optionally freeze the layer in each layout viewport. Thus, you can display
different objects in current viewport. Meanwhile, you can pan and scale the objects in
viewports to display different views.
With the grips displayed in the viewport frame, layout viewport is also available for
changing the scale that geometrical drawings of model space display in viewports so as to
adjust the viewport size. Each viewport can be scaled like other objects using SCALE
command, which is only affective to the size of the viewport rather than the scale of the
views.
Place Layout Viewports
User can select to create a viewport fit to the entire layout, and also specify a rectangle
area to create layout viewports.
In the Viewports dialog box, viewports of various standards or named viewport
configurations which determined by the pattern you view the drawing and the plotting
results are inserted into layouts.
Viewport configuration that are saved and named in model tab can be positioned in
layouts as well. The viewport will be saved as soon as new viewports are ranked and
named, and the new viewport names will be added to a list ranked by viewports. Grips on
layouts will be displayed once selected, which are used for changing the display
proportion of geometry objects created in model space within the viewports. Each
viewport can be scaled like other objects using SCALE command, which is only affective
to the size of the viewport rather than the scale of the views. To adjust the proportion of
views within viewports, you can scale the view by modifying scaling factor. And also
specify proportion in the Standard proportion option on Properties tab, Customize option
is also available for changing plot scale of viewport objects.
Change the Properties of Layout Viewports
Like common objects, layout viewports are characterized by object properties such as
layer, color, linetype, linetype scale and lineweight. Which are all displayed and changed
on properties tab.
Viewports are created on the current layer so as to control the visibility of the boundaries.
User can freeze or set plot configurations for layers in Layer Property Manager to avoid
plotting the viewport. The visibility of the boundary is nonassociative to the viewport if they
are located in different layers.
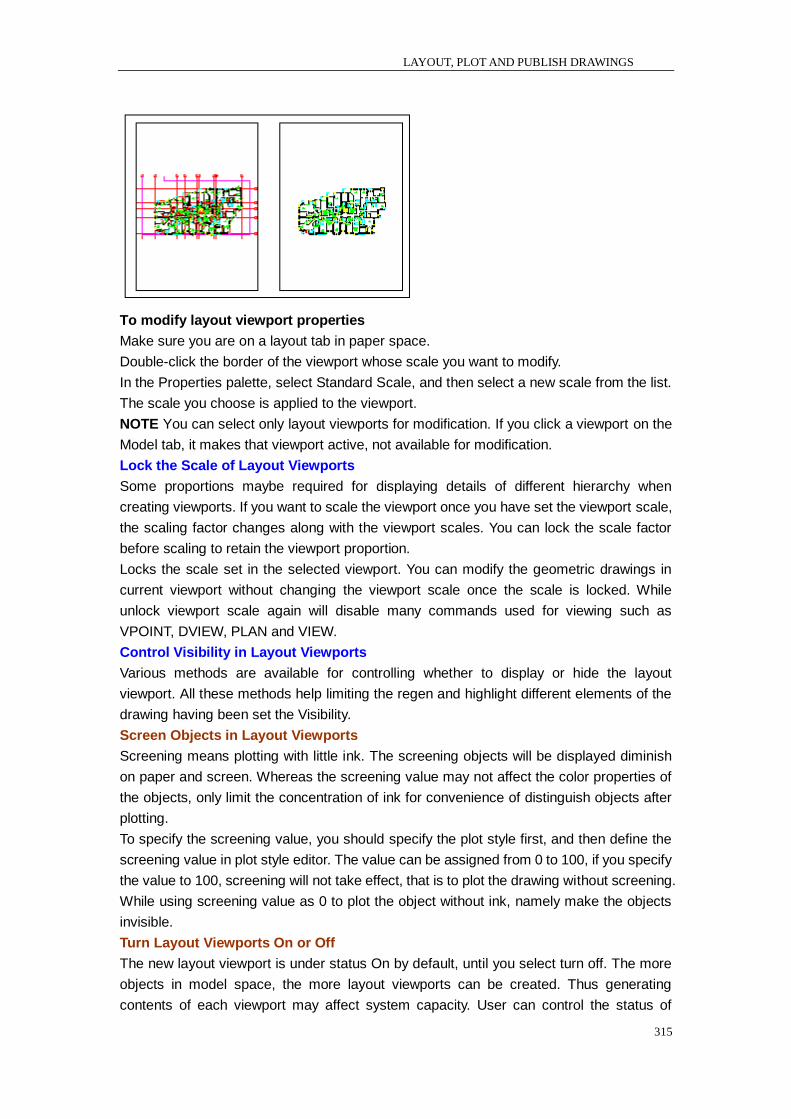
LAYOUT, PLOT AND PUBLISH DRAWINGS
315
To modify layout viewport properties
Make sure you are on a layout tab in paper space.
Double-click the border of the viewport whose scale you want to modify.
In the Properties palette, select Standard Scale, and then select a new scale from the list.
The scale you choose is applied to the viewport.
NOTE You can select only layout viewports for modification. If you click a viewport on the
Model tab, it makes that viewport active, not available for modification.
Lock the Scale of Layout Viewports
Some proportions maybe required for displaying details of different hierarchy when
creating viewports. If you want to scale the viewport once you have set the viewport scale,
the scaling factor changes along with the viewport scales. You can lock the scale factor
before scaling to retain the viewport proportion.
Locks the scale set in the selected viewport. You can modify the geometric drawings in
current viewport without changing the viewport scale once the scale is locked. While
unlock viewport scale again will disable many commands used for viewing such as
VPOINT, DVIEW, PLAN and VIEW.
Control Visibility in Layout Viewports
Various methods are available for controlling whether to display or hide the layout
viewport. All these methods help limiting the regen and highlight different elements of the
drawing having been set the Visibility.
Screen Objects in Layout Viewports
Screening means plotting with little ink. The screening objects will be displayed diminish
on paper and screen. Whereas the screening value may not affect the color properties of
the objects, only limit the concentration of ink for convenience of distinguish objects after
plotting.
To specify the screening value, you should specify the plot style first, and then define the
screening value in plot style editor. The value can be assigned from 0 to 100, if you specify
the value to 100, screening will not take effect, that is to plot the drawing without screening.
While using screening value as 0 to plot the object without ink, namely make the objects
invisible.
Turn Layout Viewports On or Off
The new layout viewport is under status On by default, until you select turn off. The more
objects in model space, the more layout viewports can be created. Thus generating
contents of each viewport may affect system capacity. User can control the status of
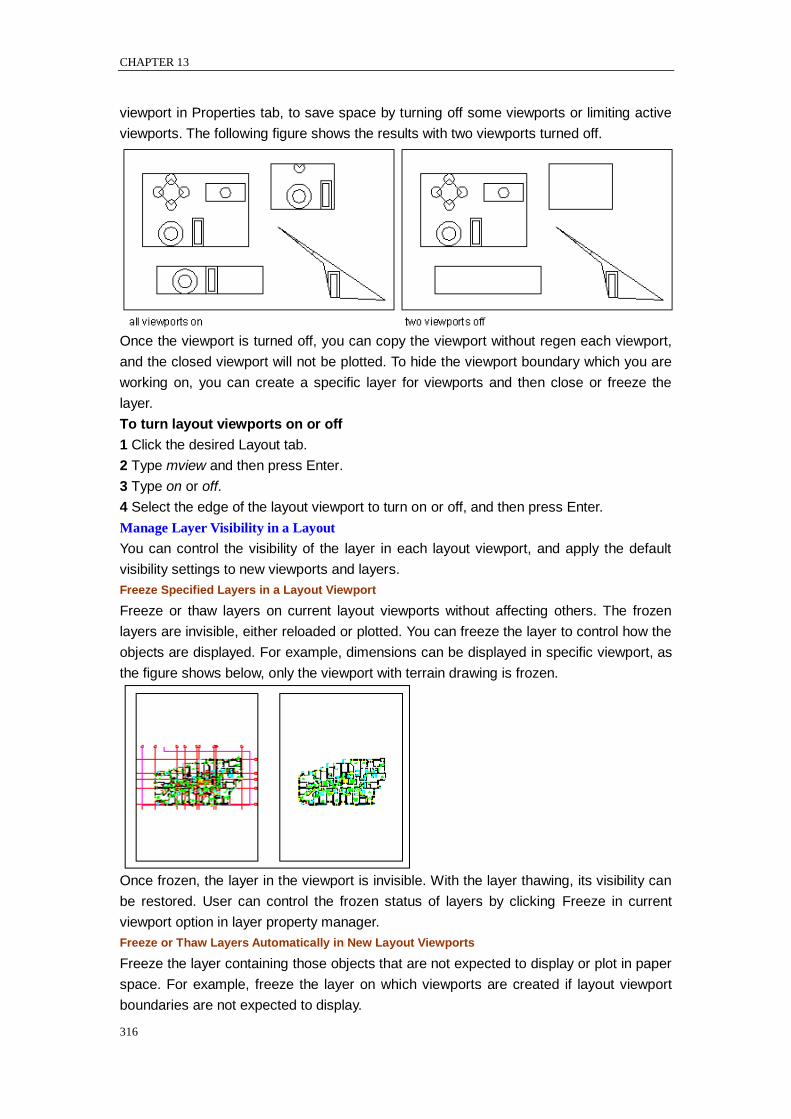
CHAPTER 13
316
viewport in Properties tab, to save space by turning off some viewports or limiting active
viewports. The following figure shows the results with two viewports turned off.
Once the viewport is turned off, you can copy the viewport without regen each viewport,
and the closed viewport will not be plotted. To hide the viewport boundary which you are
working on, you can create a specific layer for viewports and then close or freeze the
layer.
To turn layout viewports on or off
1 Click the desired Layout tab.
2 Type mview and then press Enter.
3 Type on or off.
4 Select the edge of the layout viewport to turn on or off, and then press Enter.
Manage Layer Visibility in a Layout
You can control the visibility of the layer in each layout viewport, and apply the default
visibility settings to new viewports and layers.
Freeze Specified Layers in a Layout Viewport
Freeze or thaw layers on current layout viewports without affecting others. The frozen
layers are invisible, either reloaded or plotted. You can freeze the layer to control how the
objects are displayed. For example, dimensions can be displayed in specific viewport, as
the figure shows below, only the viewport with terrain drawing is frozen.
Once frozen, the layer in the viewport is invisible. With the layer thawing, its visibility can
be restored. User can control the frozen status of layers by clicking Freeze in current
viewport option in layer property manager.
Freeze or Thaw Layers Automatically in New Layout Viewports
Freeze the layer containing those objects that are not expected to display or plot in paper
space. For example, freeze the layer on which viewports are created if layout viewport
boundaries are not expected to display.
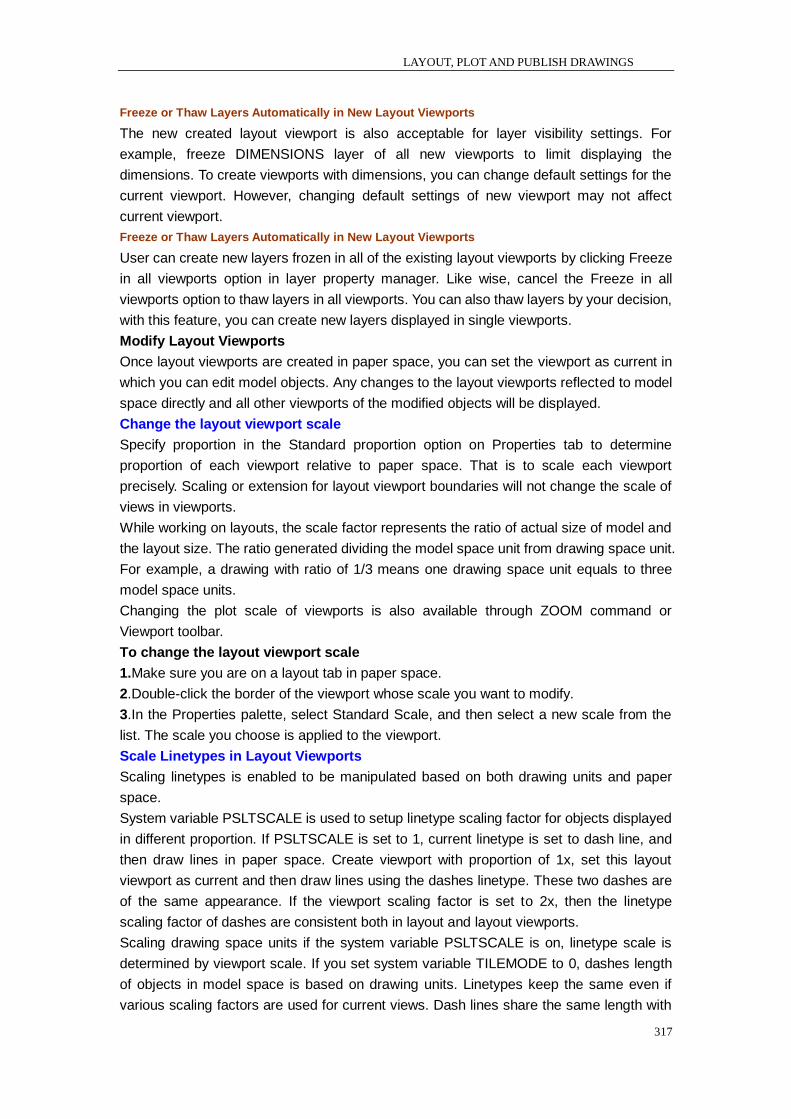
LAYOUT, PLOT AND PUBLISH DRAWINGS
317
Freeze or Thaw Layers Automatically in New Layout Viewports
The new created layout viewport is also acceptable for layer visibility settings. For
example, freeze DIMENSIONS layer of all new viewports to limit displaying the
dimensions. To create viewports with dimensions, you can change default settings for the
current viewport. However, changing default settings of new viewport may not affect
current viewport.
Freeze or Thaw Layers Automatically in New Layout Viewports
User can create new layers frozen in all of the existing layout viewports by clicking Freeze
in all viewports option in layer property manager. Like wise, cancel the Freeze in all
viewports option to thaw layers in all viewports. You can also thaw layers by your decision,
with this feature, you can create new layers displayed in single viewports.
Modify Layout Viewports
Once layout viewports are created in paper space, you can set the viewport as current in
which you can edit model objects. Any changes to the layout viewports reflected to model
space directly and all other viewports of the modified objects will be displayed.
Change the layout viewport scale
Specify proportion in the Standard proportion option on Properties tab to determine
proportion of each viewport relative to paper space. That is to scale each viewport
precisely. Scaling or extension for layout viewport boundaries will not change the scale of
views in viewports.
While working on layouts, the scale factor represents the ratio of actual size of model and
the layout size. The ratio generated dividing the model space unit from drawing space unit.
For example, a drawing with ratio of 1/3 means one drawing space unit equals to three
model space units.
Changing the plot scale of viewports is also available through ZOOM command or
Viewport toolbar.
To change the layout viewport scale
1.Make sure you are on a layout tab in paper space.
2.Double-click the border of the viewport whose scale you want to modify.
3.In the Properties palette, select Standard Scale, and then select a new scale from the
list. The scale you choose is applied to the viewport.
Scale Linetypes in Layout Viewports
Scaling linetypes is enabled to be manipulated based on both drawing units and paper
space.
System variable PSLTSCALE is used to setup linetype scaling factor for objects displayed
in different proportion. If PSLTSCALE is set to 1, current linetype is set to dash line, and
then draw lines in paper space. Create viewport with proportion of 1x, set this layout
viewport as current and then draw lines using the dashes linetype. These two dashes are
of the same appearance. If the viewport scaling factor is set to 2x, then the linetype
scaling factor of dashes are consistent both in layout and layout viewports.
Scaling drawing space units if the system variable PSLTSCALE is on, linetype scale is
determined by viewport scale. If you set system variable TILEMODE to 0, dashes length
of objects in model space is based on drawing units. Linetypes keep the same even if
various scaling factors are used for current views. Dash lines share the same length with
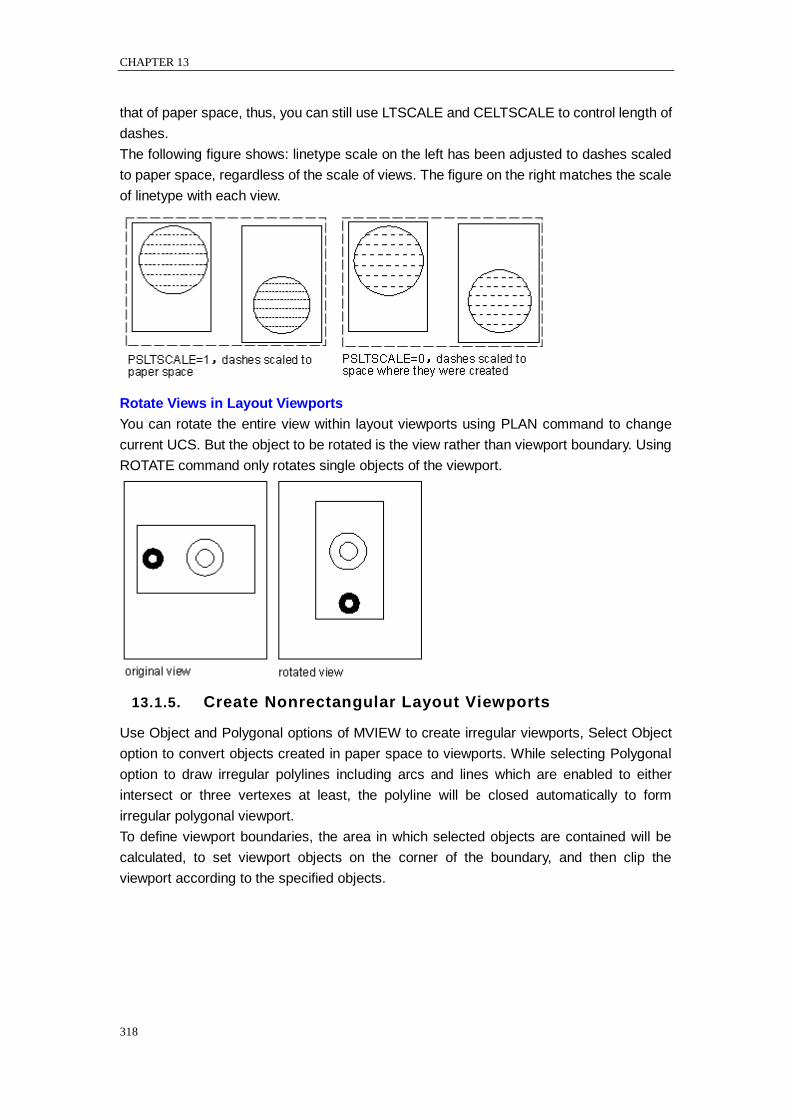
CHAPTER 13
318
that of paper space, thus, you can still use LTSCALE and CELTSCALE to control length of
dashes.
The following figure shows: linetype scale on the left has been adjusted to dashes scaled
to paper space, regardless of the scale of views. The figure on the right matches the scale
of linetype with each view.
Rotate Views in Layout Viewports
You can rotate the entire view within layout viewports using PLAN command to change
current UCS. But the object to be rotated is the view rather than viewport boundary. Using
ROTATE command only rotates single objects of the viewport.
13.1.5. Create Nonrectangular Layout Viewports
Use Object and Polygonal options of MVIEW to create irregular viewports, Select Object
option to convert objects created in paper space to viewports. While selecting Polygonal
option to draw irregular polylines including arcs and lines which are enabled to either
intersect or three vertexes at least, the polyline will be closed automatically to form
irregular polygonal viewport.
To define viewport boundaries, the area in which selected objects are contained will be
calculated, to set viewport objects on the corner of the boundary, and then clip the
viewport according to the specified objects.
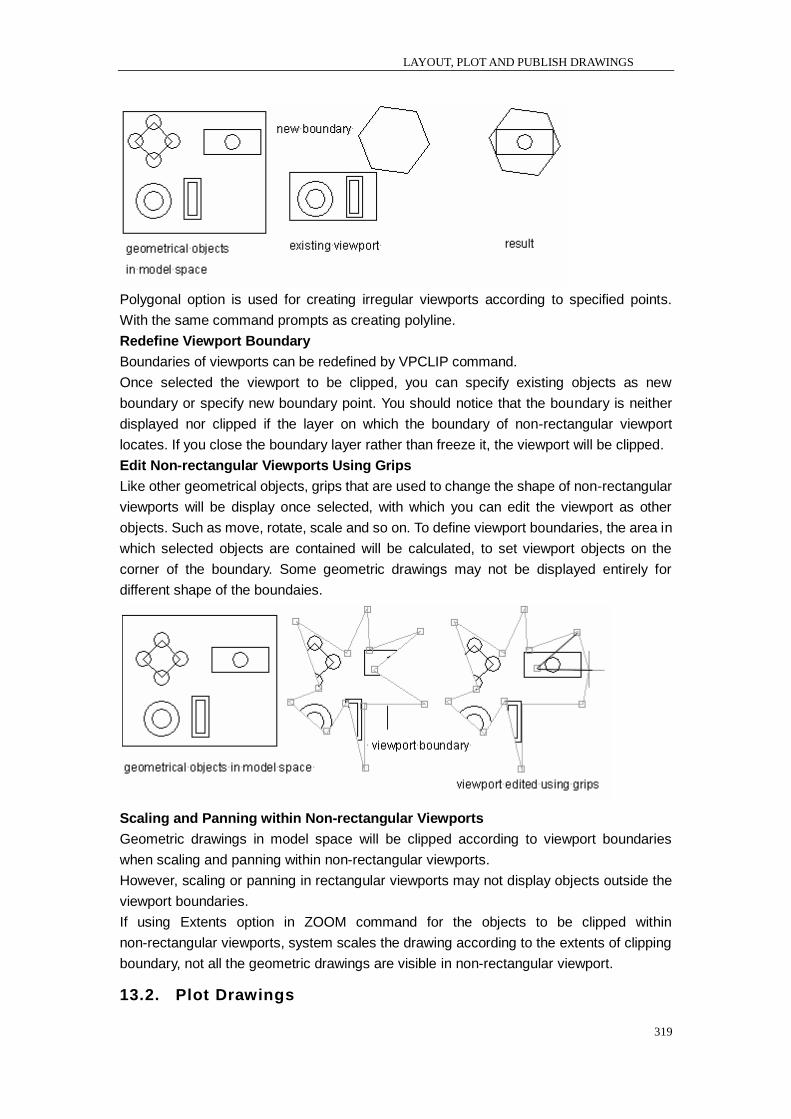
LAYOUT, PLOT AND PUBLISH DRAWINGS
319
Polygonal option is used for creating irregular viewports according to specified points.
With the same command prompts as creating polyline.
Redefine Viewport Boundary
Boundaries of viewports can be redefined by VPCLIP command.
Once selected the viewport to be clipped, you can specify existing objects as new
boundary or specify new boundary point. You should notice that the boundary is neither
displayed nor clipped if the layer on which the boundary of non-rectangular viewport
locates. If you close the boundary layer rather than freeze it, the viewport will be clipped.
Edit Non-rectangular Viewports Using Grips
Like other geometrical objects, grips that are used to change the shape of non-rectangular
viewports will be display once selected, with which you can edit the viewport as other
objects. Such as move, rotate, scale and so on. To define viewport boundaries, the area in
which selected objects are contained will be calculated, to set viewport objects on the
corner of the boundary. Some geometric drawings may not be displayed entirely for
different shape of the boundaies.
Scaling and Panning within Non-rectangular Viewports
Geometric drawings in model space will be clipped according to viewport boundaries
when scaling and panning within non-rectangular viewports.
However, scaling or panning in rectangular viewports may not display objects outside the
viewport boundaries.
If using Extents option in ZOOM command for the objects to be clipped within
non-rectangular viewports, system scales the drawing according to the extents of clipping
boundary, not all the geometric drawings are visible in non-rectangular viewport.
13.2. Plot Drawings

CHAPTER 13
320
13.2.1. Overview of Plotting
To understand relevant concept to facilitate users setting properties for plooting.
Plotter Manager
Plotter Manager is a window in which all the plotter configuration (PC5) files of user
installation are listed. If you want to use ZWCAD default plotting properties other than that
of Windows system configured, you can also create a new plotter configuration files for
Windows system plotter. Plotter configuration settings contain port information, quality of
raster images and vector drawings, drawing size and customized properties based on
plotter type.
User can start an Add Plotter-Introduction Page dialog box by selecting Add-A-Plotter
Wizard option from the Name pulldown box in Printer/Plotter area on plot dialog box,
which is available for creating plotter configuration using relevant information that are
imported as this wizard required.
Layouts
Layout displays the results on a plotted page. You can create as many layouts as you
need. Each layout is saved on its own layout tab and can be associated with a different
page setup.
All the elements to be displayed on a plotted page, such as title blocks and notes, are
drawn in paper space in a layout. The objects in the drawing are created in model space.
To view these objects in the layout, you should create layout viewports.
Page Setups
Specify page settings for the layout you create through Page Setup and Plot Setup dialog
box, controls whether to display layout tab or Model tab. Page setup can be applied to
other layouts once it‘s saved with a given name.
Plot Styles
A plot style includes properties such as lineweight, color, hatch pattern, which controls
how an object or layer is plotted. The Plot Style Manager shows all the plot style tables
available in ZWCAD.
There are two plot style types: color-dependent and named. Use only one type of plot
style table for plotting a drawing each time.
For color-dependent plot style tables, an object's color determines how it is plotted. With
an extension of .ctb, these plot style table files are disabled of assigning color-dependent
plot styles directly to objects. Instead, to control how an object is plotted, you should
change its color. For example, all objects assigned the color red in a drawing are plotted
the same way.
Named plot style tables use plot styles that are assigned directly to objects and layers.
With an extension of .ctb, these plot style table files enable each object in a drawing to be
plotted differently, independent of its color.
Additional Information
Addition here refers to the page header and footer that appended to the plot settings. You
can specify information about page header and footer in the Addition area on Plot dialog
box, e.g. your name, company name, drawing name as well as date and time. You can
also assign text contents to the drawing to be plotted by any devices through the Header
LAYOUT, PLOT AND PUBLISH DRAWINGS
321
and Footer text box.
13.2.2. Plot settings
When you create a drawing, you do most of your work on the Model tab. At any time you
can print your drawing to see how it looks on paper. It‘s easy to startup printing, and then
later create layouts and custom print settings to enhance your printed output.
To start printing
1 Choose File > Plot.
2 Click OK.
Standard toolbar
Command line PLOT
There are many options that you can set before printing, such as the scale of the drawing,
print area, print style tables, and more.
Before you print, you can set up many aspects of printing:
Select and configure plotting device.
Specify paper size and orientation.
Specify size of the paper used for plotting, including which portion of a drawing to print
and the origin of the print area.
Choose whether to print and scale lineweights.
Choose whether to implement print style tables to control colors, pen widths, line types,
and lineweights.
Set Paper Size
The paper size here refers to the size of the drawing, needs to be set before plotting
regardless of which working space you select. You can assign the paper type from pull
down list of the Paper text box. The available paper types provided in the pull down list are
decided by current configuration. If you want to setup paper size, you should configure
plotters first, all the available plotters are both system plotters of Windows configured and
non-system driven.
You can specify a printer or plotter to be used when printing any drawing. You can print
your drawing on any printer or plotter that is compatible with Windows, including raster
printers.
To select a printer or plotter
1 Choose File > Plot.
2 From the Printer Name list, select a printer or plotter, and then click OK.
Standard toolbar
Command line PLOT
Default paper size used for creating new layouts through editing PC5 files associative to
plotters can be assigned to the paper. With this technique, you can assign different paper
size for Windows and ZWCAD separately.
If you set a system variable PAPERUPDATE to 1, prompts display if the selected plotter
doesn‘t support the paper size. So that the paper size will be updated automatically to
default paper size that plotters provide.

CHAPTER 13
322
To select the paper size and orientation
1 Choose File > Plot
2 Select the paper size and paper orientation by specifying paper type, and then click OK.
Standard toolbar
Command line PLOT
You can also adjust the orientation by printing a drawing upside down on the paper. Each
layout in your drawing can specify whether to print upside down.
Use a Custom Paper Size
You can also add customized paper size to non-system plotters through plotter
configuration editor. Usually customized paper size is not able to add to Windows system
plotter, but you can modify the plotted area according to the paper size associated to
system plotters.
Position the Drawing on the Paper
You can adjust the position of the drawing to be plotted on a paper before plotting.
Specify the Printable Area
The selected plotter and paper size determines the paper size.
Set the Origin of Print Area
You can specify the position of the drawing to be plotted on a paper by entering a positive
or negative value in the X and Y Offset boxes. Select Center on Paper to locate the
drawing at the center of the paper.
The offset value makes a compensation to the page pitch by aligning the left lower corner
of the title bar with that of the drawing paper. The offset are usually negative, determined
by measuring the distance between the page edge and plot information.
To specify the print area origin
1 If necessary, click the desired Layout tab or the Model tab.
2 Choose File > Plot.
3 Click the Origin of Print Area tab. Do one of the following:
To center the specified print area on the printed page, select the Center on Page check
box.
To specify an origin for the print area, type the x- and y-coordinates.
4 Select Save Changes to Layout, and then click Apply to Layout.
Standard toolbar
Command line PLOT
Set Drawing Orientation
The drawing orientation determines whether to plot a drawing portrait or landscape.
If you select Landscape, plots the drawing using the length edge as horizontal. While
selecting Portrait to plot the drawing using its minor edge as horizontal Changing the
drawing orientation just like rotating the paper under the drawing. Meanwhile, selecting
Plot upsize-down to control whether to locate the drawing upsize-down on paper.
Set Plot Scale
Plot scale of the drawing can be specified directly from the scale pulldown list, and also
customize plot scale of your desire, or choose Fit to Paper to scale the drawing to fit onto

LAYOUT, PLOT AND PUBLISH DRAWINGS
323
the selected paper size.
Generally, you draw objects at their actual size. That is, you decide which unit to be
applied to the size (an inch, a millimeter, a meter) and draw objects at a 1:1 scale. For
example, if you select the measurement unit as millimeters, then every unit in your
drawing represents a millimeter. When you plot the drawing, you either specify a precise
scale or fit the image to the paper. Plotting is usually working under precise proportion.
The plot scale set here represents the ratio of plot unit and actual unit used for drawing
models.
Set a Specific Scale
The plot scale together with plot unit and drawing unit must be specified before plotting.
For example, if you select the paper size to mm, entering 1 under mm and 10 under Units
blank produces a plotted drawing with each plotted unit represents 10 actual millimeters.
The following figure shows an instance of plotting objects at three different scales.
To automatically scale the drawing for printing
1 If necessary, click the desired Layout tab or the Model tab.
2 Choose File > Plot.
3 To scale the drawing to fit on one printed page, in Print Scale, click Fit to paper.
4 Select Save Changes to Layout, and then click Apply to Layout.
Standard toolbar
Command line PLOT
To specify the scale factor yourself
1 If necessary, click the desired Layout tab or the Model tab.
2 Choose File > Plot.
3 In Print Scale, do one of the following:
Select a predefined scale. For example, choose 1:2 if you want 1 printed unit (inch or
millimeter) to equal 2 drawing units.
Select Custom, and then under User Defined Scale, type the ratio of printed units of
measure (inches or millimeters) to drawing units.
4 To specify the printed units of measure, click Inches or Millimeters.
5 Select Save Changes to Layout, and then click Apply to Layout.
Standard toolbar
Command line PLOT
Scale the Drawing to Fit the Page
To plot the view at the largest possible size that fits the paper. The height and width of the
drawing will be adjusted according to the paper size.
CHAPTER 13
324
Any changes to the ratio of plotted units, drawing size, plotters, plot origin, plot orientation
and plot area will be reflected to plot scale.
Set Options for Plotted Objects
The following options show plot patterns with instructions on how to plot objects.
Plot Object Lineweights. Specifies that lineweights assigned to objects and layers are
plotted.
Plot with Plot Styles. Plots a drawing with specified plot styles. Plots lineweights
automatically once selecting this option automatically. If you do not select this option,
objects are plotted with their assigned properties and not with the plot style overrides.
Hidden Plot. Suppresses the plotting of objects that are located behind other objects
regardless of how it‘s displayed on screen.
Save Changes to Layout. All the changes you make in the Plot dialog box will be saved to
the layout if you click OK.
To set lineweight options
1 If necessary, click the desired Layout tab or the Model tab.
2 Choose File > Plot.
3 Choose Plot Object Lineweights:
Plot Object Lineweights – Specifies whether the lineweights assigned to objects and
layers are plotted.
Scale Lineweights – prints lineweights in proportion to the scale you set on the Plot scale.
If not selected, lineweights print at their assigned size without adjustments for the print
scale. (A Layout tab must be active to scale lineweights.)
4 Select Save Changes to Layout, and then click Apply to Layout.
Standard toolbar
Command line PLOT
NOTE Print styles can also affect how lineweights print.
Specify the Area to Plot
To determine where to plot the drawing , you must specify an area for the drawing. The
following options under Plot Area are provided in The Plot dialog box.
Current View. Plots the contents in current view.
Save View. Plots a view saved previously with the VIEW command. You can select a
named view from the list provided. This option is unavailable if there are no saved views in
the drawing.
Extents. Plots current space together with all the objects of the drawing.
Limits. When plotting a layout, plots everything within the printable area.
Window. Plots any portion of the drawing you specify within the rectangle window. Click
the Window button to use a pointing device to specify opposite corners of the area to be
plotted, and then return to the Plot dialog box.
To specify a portion of the drawing to print
1 If necessary, click the desired Layout tab or the Model tab.
2 Choose File > Plot.
3 Under Print Area, click one of the following:
Current View – prints the view on the screen.

LAYOUT, PLOT AND PUBLISH DRAWINGS
325
Saved View – prints the selected saved view.
Extents – prints the displaying area for all of the drawings.
Limits – prints to the limits defined for the layout or drawing.
Window – prints the portion of the drawing contained in the specified window, maintaining
the aspect ratio of the windowed area to the drawing.If you clicked Window, you must
specify the window. Under Windowed Print Area, specify the area on the screen by
picking corners of the window.
4 Select Save Changes to Layout, and then click Apply to Layout.
Standard toolbar
Command line PLOT
Preview a Plot
Viewing a drawing before printing gives you a preview of what your drawing will look like
when it is printed. This helps you see if there are any changes you want to make before
actually printing the drawing.If you are using print style tables, the preview shows how
your drawing will print with the assigned print styles.
System automatically generates preview results as soon as you setup relevant plotting
properties.
To preview a drawing before printing
1 If necessary, click the desired Layout tab or the Model tab.
2 Choose File > Plot Preview.
3 Do one of the following:
To print the drawing, click Plot .
To return to the drawing, click Exit.
Standard toolbar
Command line PREVIEW
Printing a drawing
The print setting options available under each tab on the Print dialog box were described
in the previous sections.
NOTE You cannot print a rendered image directly to a printer. To print a rendered image,
you must first save the drawing to a different format and then print it from another graphics
program.
To print a drawing
1 If necessary, click the desired Layout tab or the Model tab.
2 Choose File > Plot.
3 From the Print dialog box, make any adjustments to the settings.
4 Click OK.
Standard toolbar
Command line PLOT
NOTE Instead of using the print settings you saved with your layout, you can select
Previous form the Page setup pull down list.
13.2.3. Use Plot Styles
CHAPTER 13
326
ZWCAD uses print styles to change the appearance of your printed drawing without
modifying the actual objects in your drawing. Assigning print styles allows you to
customize the Color, GrayScale, Screening, and Lineweight that are used to print your
drawing. Print styles help you control what your drawing looks like when it is printed.
Because print styles are saved in print style tables, which are files located on your
computer, disk, or server, you can reuse them to help eliminate the need to reconfigure
your print settings each time you print a drawing. You can save print styles in a named file
for each of your clients. You can even share the file with coworkers, or store the files on a
network to ensure that everyone in your office uses the same standards.
Understanding print style tables
A print style table is a collection of print styles that allows you to change the appearance of
your printed drawing without modifying the actual objects in your drawing. Each print style
table is saved in a file that can be located on your computer, disk, or server.
A drawing can use one type of print style table at a time. There are two types of print style
tables:
Color dependent print style tables (CTB) contain a collection of print styles based on
each of the 255 index colors available in a drawing. True colors and color books are not
applicable to colordependent print style tables.
Named print style tables (STB) contain a collection of print styles that you define. They
can vary regardless of color.
With color independent print style tables, you cannot assign print styles to individual
objects or layers. To use these print styles, you assign a specific color to an entity or layer.
When you specify a color dependent print style table at printing time, the entity colors and
layer colors map to color based print styles in the print style table that you specify. If you
specify a print style for a specific entity, that print style overrides any print style assigned
to the layer on which the entity resides.
Sometimes a named print style assigned to an entity or layer is not located in the print
style table that is assigned to a layout or drawing. This can happen if the print style has
been deleted from the named print style table or if you assign a different named print style
table to the drawing that does not contain the named print style. In this case, the entity is
printed using its default properties. If you plan on interchanging named print style tables
within the same drawing, it‘s a good idea to coordinate the tables to use the same print
style names.
If a new drawing is based on a template, the new drawing uses the same type of print
style table as the template. If a new drawing is created without a template, the type of print
style table is specified in the New Drawing Wizard; Every drawing is designed to use print
style tables, but you decide whether to implement them.
Setup plot styles to determine how a drawing is plotted.
Like color and linetype, plot style is also a kind of object property that reflected on the
plotted objects or layer once you plot the object with the plot style assigned. A plot style
controls an object's plotted properties, including color, grayscale, screening, lineweight.
If the plot styles conflict with the settings created for objects, use the plot style settings for
plotting other than the settings created for objects. You can close these substitute settings
on demand.
LAYOUT, PLOT AND PUBLISH DRAWINGS
327
Choose a Type of Plot Style Table
A plot style table is a collection of plot styles assigned to a layout or the Model tab. There
are two types of plot style tables: color-dependent plot style tables and named plot style
tables.
Color-dependent plot style tables (CTB)
Color-dependent plot style table determines plotting characteristics such as lineweight
using an object's color. This plot style plots objects with the same color in the same style.
For example, every blue object in a drawing is plotted the same way. While
color-dependent plot style table is provided for editing rather than adding or deleting plot
styles. There are 256 plot styles in a color-dependent plot style table, one for each color.
Once a color-dependent plot style table is assigned to the drawing, you cannot assign a
plot style to individual objects or layers. Instead, to assign plot style properties to an object,
you should change the color of the object or layer.
You can assign color-dependent plot style tables to layouts. You can use several
predefined color-dependent plot style tables, edit existing plot style tables, or create your
own.
Color-dependent plot style tables are stored in the Plot Styles folder with extensions
named as .ctb.
Note that assigning the color-dependent plot style table to a layout is only available when
the drawing has been set to use color-dependent plot style tables.
Named plot style tables (STB)
Named plot style tables contain user-defined plot styles. This plot style plots objects
based on the plot style assigned to the object rather than the color. The named plot style
tables can be assigned to objects or layouts as assigning other properties.
Named plot styles can be assigned to objects or layers with the same way as any other
properties.
Assign Plot Style Tables to Layouts
Controls the plotting style for objects in layouts using different plot styles assigned to each
layout. The specified plot style tables affect both model space and paper space objects.
If you specified named plot style for a drawing, each object in the drawing either is
assigned a plot style directly or inherits a plot style from its layer.
If a xref has been inserted into your current drawing, all defined plot style tables will be
inserted as well.
You can assign print style tables globally for all layouts (including the Model tab), or
individually for the Model tab or a Layout tab. Assigning a print style table to an individual
layout allows you to further customize the layouts you use to print a drawing.
However, assigning different named print style tables to various layouts may result in
mismatched print style names. In this case, objects are printed using their default
properties.
To assign print style tables
1 If necessary, click the desired Layout tab, or click the Model tab.
2 Choose File > Plot.
3 Click the Plot style table tab.From the pull down list, select a print style table in the one
of the following:
CHAPTER 13
328
None — Applies no print style table. Objects print according to their own properties.
Icad — Uses the default print style table and its color assignments.
Monochrome — Prints all colors as black.
4 Select Save Changes to Layout, and then click Apply to Layout.
Standard toolbar
Command line PLOT
NOTE When your drawing was first created it was set up to use either color dependent or
named print style tables.
Manage Plot Style Tables
Color-dependent (CTB) and named (STB) plot style tables are stored in the Plot Styles
folder by default. This folder is also known as the Plot Style Manager.
Plot Style Manager is available to add, delete, rename, copy, and edit plot style tables.
Creating new print style tables
ZWCAD offers several print style tables to help you get started. If you want to customize
your print output further, you can create your own print style table. You can customize plot
exporting pattern by import printer configuration file (PCP file).
To create new print style tables
1 Choose File > Print Styles Manager.
2 Double click Create a Print Style Table.
3 Complete the setup wizard.
On the last wizard page, you can click Print Style Table Editor to set up the print styles for
the table.
Standard toolbar
Command line PLOT
Change Plot Style Settings
Double-clicking a CTB or STB file in the Plotter Manager to open the Plot Style Table
Editor. The Plot Style Table Editor displays the plot styles contained in the specified plot
style table.
The General tab lists general information about the table. The Properties tab provides
options for modifying colors or relevant properties of plot styles.
If you are using a color-dependent plot style table, the color-dependent properties ( e.g.
color, grayscale, screening, lineweight ) are available from the right side of the dialog box.
While all these plot style properties ( e.g. color, grayscale, screening, lineweight).are
changed for each plot style from the Properties when using a named plot style table.
In a named plot style table, the NORMAL plot style represents an object's default
properties (no plot style applied). The NORMAL style can‘t be modified or deleted by your
self.
Colors
The plot style color default to Use Entity Color. With this setting, the object retains its layer
or individually set color. The color overrides the object's color at plot time if you assign a
plot style color for this plot style.
System provides 255 Color Index (ACI) colors, a true color, or a color book color in the
LAYOUT, PLOT AND PUBLISH DRAWINGS
329
plot style options. While the True color plot styles should be synchronized with the same
color setting for the plotter configurations. However, system take the latest color index as
substitute color once the plotter is unable to update configuration to True color.
Convert to Grayscale
In case that the plotter supports grayscale, system converts the object's colors to
grayscale when you select Convert to Grayscale. Light colors, such as yellow, are plotted
with light gray values. Dark colors are plotted with dark gray values.
If you set the Grayscale off, system uses the RGB values for the entity‘s colors.
The grayscale is available for the entity color or a plot style color.
Use Screening
A color intensity setting determines the amount of ink ZWCAD places on the paper while
plotting.
Using valid values from 0 to 100. If set the value to 0, the color will be reduced to white.
While assigning it to 100 , the color will be displayed at its full intensity.
Screening is effective only if the plotter is configured to plot colors or grayscale, with
dithering enabled as well.
Assign and Display Lineweights
Use Object Lineweight is the default setting for plot style lineweight. All the lineweight
samples together with values are provided in the lineweight dropdown list. You can also
modify an existing lineweight if the one you need is not available in the dropdown list.
Click Edit lineweights button to modify the existing lineweights.
To modify print style tables
1 Choose File > Plot.
2 In the Plot dialog box, click the print style table you want to modify,and the click Modify.
3 Click the General tab on Print Style Table Editor, and then do any of the following:
Enter a new table description.
Select Apply Global Scale Factor to Non ISO Linetypes to apply the scale factor to non
ISO linetypes used for any print style in the current print style table.
Enter a scale factor to apply to non ISO linetypes used for any print style in the current
print style table.
4 Click the Properties tab, and then do any of the following:
Make changes to a color dependent print style by selecting it in the Print Styles list, then
make color, linetype, or lineweight changes for the print style. Your changes are saved
automatically for the selected print style.
Make changes to a named print style by selecting it in the Print Styles list, then make color,
linetype, or lineweight changes for the print style. Your changes are saved automatically
for the selected print style.
Add a new print style by clicking Add Style. Enter a new name, and then click OK. Select
the options for the print style. (Available for named print styles only.)
Delete a print style by selecting it in the Print Styles list. Click Delete Style. (Available for
named print styles only.)
5 Click OK.
Standard toolbar
CHAPTER 13
330
Command line PLOT
Changing a drawing’s print style table type
When your drawing was created, it was set up to use color-dependent print style tables
(.ctb files) or named print style tables (.stb files). A drawing can use one type of print style
table at a time. If necessary, after a drawing is created you can convert the drawing to use
the other type of print style table.
If you can‘t remember what type of print style table is assigned to your drawing, use the
PSTYLEMODE system variable to determine the print style table type.
To change a drawing to use named print style tables
1 Open the drawing that uses color dependent print style tables (.ctb files).
2 Type convertpstyles, and then press Enter.
3 If you have already converted your individual color dependent print style tables to
named tables, click OK in the prompt that displays.
4 Select a named print style table (.stb file) that you want to use with the drawing.
5 Click Open.
To change a drawing to use color-dependent print style tables
1 Open the drawing that uses named print style tables (.stb files).
2 Type convertpstyles, and then press Enter.
3 If you are sure you want to convert the drawing and lose all print style assignments, click
OK in the prompt that displays.
NOTE Converting a drawing to use color-dependent print style tables will remove all of the
named print style information from objects and layers. However, the named print style
tables are not deleted from your computer.
Converting print style tables
You can convert a color dependent print style table to a named print style table. You
cannot convert a named print style table to a color dependent print style table because
color dependent tables contain only print styles that are named after the 255 colors to
which they map.
Converting a color dependent print style table to a named print style table can be helpful in
the following situations:
You don‘t want to create a named print style table from scratch.
You want to create a named print style table that has the same settings as a color
dependent print style table, but with some new print styles or other custom settings.
You want to convert a drawing to use named print style tables and you want to reuse most
of print styles already defined in a color dependent print style table.
To convert a color dependent print style table to a named print style table
1 Type convertctb, and then press Enter.
2 Select the color dependent print style table (.ctb file) that you want to convert.
3 Click Open.
4 Enter a name for the new named print style table (.stb file).
5 Click Save.
The print styles in the new table are named Style 1, Style 2, and so on. If want to use
different print style names, rename the print styles before you assign them to objects and
layers in your drawing. If you rename the print styles after assigning them, they will not
LAYOUT, PLOT AND PUBLISH DRAWINGS
331
match when you print your drawing.
Turning off print style tables
When you turn off print style tables, objects print according to their own properties.
However, all of the print style information is saved so you can easily turn on print styles
again. Actual print style table files are not deleted, and for drawings that use named print
style tables, objects and layers retain their assigned print styles.
To turn off print style tables
1 If necessary, click the desired Layout tab, or click the Model tab.
2 Choose File > Plot.
3 Under Print Style Table, select None.
4 Select Save Changes to Layout, and then click Apply to Layout.
Standard toolbar
Command line PLOT
13.2.4. Plot Files to Other Formats
Plots files of various formats, including DXF and Windows entity files, you can output
drawings in any image formats with unique plotter driver. In such cases, non-system
plotter driver will be configured as output file format. Users are capable of controlling
customized properties of each non-system plotter driver in plotter configure editor. You
can also obtain specific help for each driver from the Help topic in plotter configuration
editor.
Plot to Raster File Formats
Several raster file formats, including Windows BMP, CALS, TIFF, PNG, TGA, PCX, and
JPEG are supported by the non-system raster driver. The raster driver is most commonly
used when plot to files for desktop publishing.
Nearly all the formats supported by this driver produce "dimensionless" raster files with
size in pixels other than size in inches or millimeters. Plotters that can accept CALS files
use the Dimensional CALS format. If your plotter accepts CALS files, a real paper size
and resolution is required.
The type, size, and color depth of the raster file determine its final file size. Raster files are
capable of enlarging within the specified pixel dimensions and color depth.
Configure the background color for raster plots in the custom Properties dialog box in the
Plotter Configuration Editor. If you change the background color, any objects plotted in
that color are invisible.
Plot Adobe PDF File
Adobe PDF file can be created from drawing using PDF driver.
Portable Document Format (PDF) is a standard of electronic file change. PDF file can be
used on any system operation like Windows, Unix and so on. More and more document
are using PDF now,such as e-books, product introduction, network information, e-mails.
PDF has become a standard for digitized information.
The maximum output resolution should be set on PDF printing. The Maximal output DPI
can be set on Custom options of PDF printer which is called from Plotter Configuration
Editor. Meanwhile, the properties for PC5 configuration file including the Title, Author,
CHAPTER 13
332
Subject and Keyword , can also be set on Custom options of PDF printer dialog.
Note: The Adobe Reader R7 or higher version is needed on view the published PDF file.
The version 9.3 is needed on Microsoft Windows 7.
Steps for PDF printing
1.Choose Plot from the File menu.
2.Choose PDF.pc5 for the Name option from the Printer/plotter tab on the Plot dialog.
3.Click OK.
4.Specify the location and the name for the PDF file in Save As dialog.
5.Click Save.
Standard Toolbar:
Command:PLOT
Steps for adding PDF plotter
The drawing can be published as PDF file format if you adding PDF plotter though Add
plotter wizard. Steps for adding PDF plotter as follow:
1.Select Plotter Manager from File menu to open the plotter's folder.
2.Double click "Add-A-Plotter Wizard" to open Add plotter dialog.
3.Select "Next" after you read the introduction in Add Plotter - Introduction Page.
4.Select My Computer from the Add Plotter - Begin page, and click Next.
5.In Add Plotter - Plotter Model page, select PDF File Format from Manufactures option,
and select PDF from Models option. Click Next to continue.
6.Activate the Plot to File check box from Add Plotter - Ports page, and click Next.
7.In Add Plotter - Plotter Name page, input your configuration file name, or use the default
name and click Next.
8.Click Finish in Add Plotter - Finish page to finish your adding.
The new Plot Configuration file (PC5) is setup.
Command: PLOTTERMANAGER
Customize the PDF Printer
Specify the selected Adobe PDF file options:
Maximal output DPI
Set the resolution of the output PDF file by the unit DPI. The lager the DPI is, the more
precise the files, but slower the print speed is, and the lager memory and file size is
needed.
The Maximal output resolution is between 72 to 4800 DPI, and default to 72 DPI. You can
set this value according to your needs. There're 8 selections in the Maximal output DPI
drop-down list, and this value can also be customized by select Custom from the
drop-down list.
Instruction to PDF printer configuration file
The options of the PDF printer can be customized from Custom option of PDF printer
called from Plotter Configuration Editor.
Properties for PDF printer are : Title, Author, Subject and Keyword.

LAYOUT, PLOT AND PUBLISH DRAWINGS
333
DPI
Set the resolution for the PDF printer.
Maximal output DPI:Set the maximal resolution for the PDF printer, and the value is
among 72 to 4800, default to 72 DPI.
Customize output DPI:Customize the maximal resolution. The value can be set to 72 ~
4800 DPI.
Properties
Configure PDF File.
Title: Specify the title for PDF file.
Author: Specify the author for PDF file.
Subject: Specify the subject for the PDF file.
Keyword: Specify the keyword for the PDF file.
13.2.5. Batch plot
Specify a printer to print the multiple PLT, PRN and list file (.TXT) files at one time.
You should set the file to be plotted by selecting desired plt files or prn files from the Open
button on Pltplot dialog box. It‘s also available to save the files listed on current plot file list
as a ―.TXT‖ file using the Save list button on Pltplot dialog box, and then add all the files
included in the list into current list whenever you use this file at your desire.
The plot list displays name and path of the file, the .plt file or .prn file will be displayed
together with its saving path. While the TXT file will be displayed with file path.
Before batch plotting, you can set all the files in the plot list, and also selective plot part of
the files from the plot list.
13.3. Publish Drawings
Publish multiple files to a single multipage DWF file or a printer in order to save and plot
files. The paper name and page setup will be displayed as soon as you select files to the
CHAPTER 13
334
file list . Here, paper name refers to the name of the drawing to be plotted, with a dash
joining the drawing name and layout name, page setup column displays the named page
setup of layouts. You can click the page setup to select other page setup from the
dropdown list. The model tab and layout tab are only applied to the corresponding tab.
You can optionally click on model tab and layout tab in Add drawings include option in the
course of importing files into the drawing list. And assemble a collection of drawings to
publish and save the list as a Drawing Set Descriptions (DSD) file. A DSD file is created
for illustrating these drawing files list and selected layout list.
In the Publish dialog box, user define the way to publish file list.You can choose to publish
to Printer or DWF.
Publish to Printer
Plots all the drawing files on the pblish list, you can set plot copies after publishing
drawings to specified plotter.
Publish to DWF
Generates the drawing files that are published to the file list and save them as a single,
multisheet DWF file, or multiple single-sheet DWF files, and specify the saving path for the
output DWF file.
SHARE DATA BETWEEN DRAWINGS AND APPLICATIONS
335
14. Share Data Between Drawings
and Applications
14.1. Saving and viewing snapshots
You can save snapshots of a drawing to view later. A snapshot saves the current drawing
in either *.emf, *.wmf, or *.sld format exactly as it appears on the screen. A snapshot is not
a drawing file. You cannot edit or print the snapshot; you can only view it.
You can use snapshots in the following ways:
Make presentations by showing snapshots of your drawings.
Reference a snapshot of a drawing while working on a different drawing.
Present a number of snapshots as a slide show by using scripts.
When you view a snapshot, it temporarily replaces the current drawing. When you refresh
the display of the current drawing (by redrawing, panning, zooming, minimizing,
maximizing, or tiling), the snapshot image disappears, and you are returned to the current
drawing.
A snapshot does not include any invisible entities on layers.
To create a snapshot
1 Choose Tools > Make Snapshot.
2 In the Create Snapshot dialog box, specify the name of the snapshot file you want to
create.
3 From the Files Of Types list, choose either *.emf, *.wmf, or *.sld.
4 Click Save.
Command line MSLIDE
The current drawing remains on the screen, and the snapshot is saved to the directory
that you specify.
To view a snapshot
1 Choose Tools > View Snapshot.
2 In the View Snapshot dialog box, specify the name of the snapshot file you want to view.
3 Click Open.
ZWCAD displays the snapshot in the current drawing window.
Command line VSLIDE
You can view previously saved snapshots, and you can also view snapshots created
using other CAD software.
14.2. Link and Embed Data
You can include data from other programs in ZWCAD drawings by using either
embedding or linking. The method you choose depends on the type of object or file you
want to include in your ZWCAD drawing and what you want to do with it after it is there.
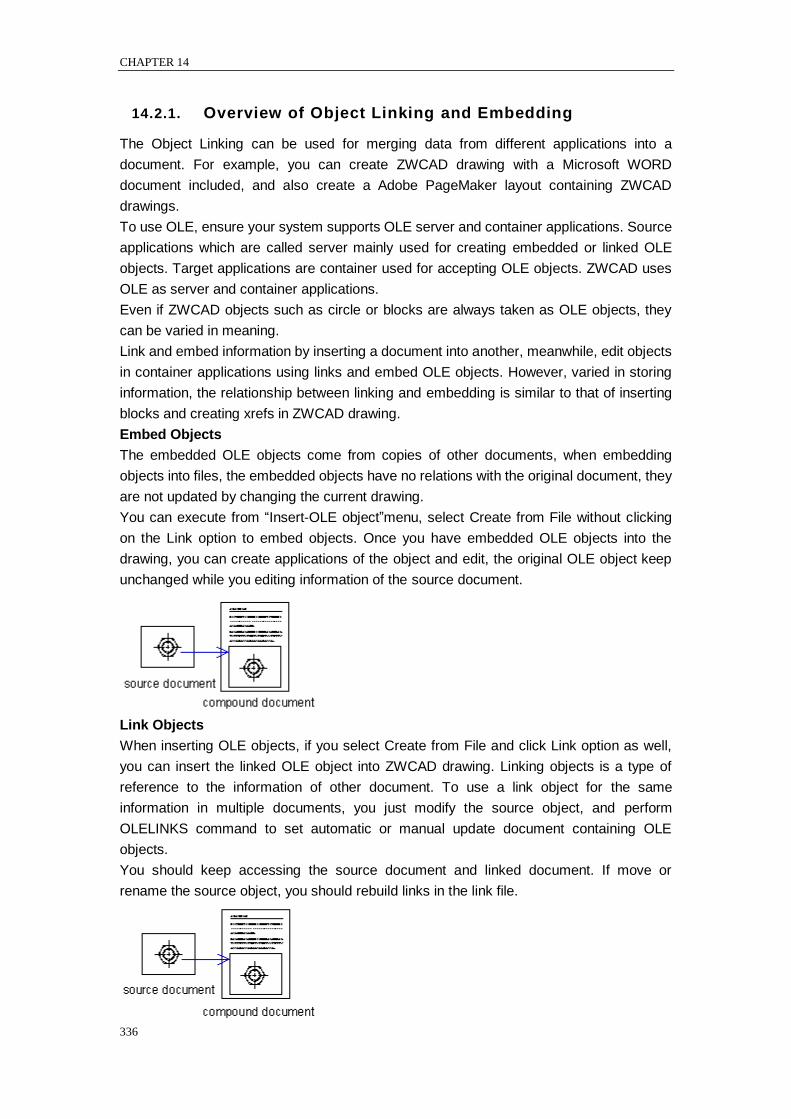
CHAPTER 14
336
14.2.1. Overview of Object Linking and Embedding
The Object Linking can be used for merging data from different applications into a
document. For example, you can create ZWCAD drawing with a Microsoft WORD
document included, and also create a Adobe PageMaker layout containing ZWCAD
drawings.
To use OLE, ensure your system supports OLE server and container applications. Source
applications which are called server mainly used for creating embedded or linked OLE
objects. Target applications are container used for accepting OLE objects. ZWCAD uses
OLE as server and container applications.
Even if ZWCAD objects such as circle or blocks are always taken as OLE objects, they
can be varied in meaning.
Link and embed information by inserting a document into another, meanwhile, edit objects
in container applications using links and embed OLE objects. However, varied in storing
information, the relationship between linking and embedding is similar to that of inserting
blocks and creating xrefs in ZWCAD drawing.
Embed Objects
The embedded OLE objects come from copies of other documents, when embedding
objects into files, the embedded objects have no relations with the original document, they
are not updated by changing the current drawing.
You can execute from ―Insert-OLE object‖menu, select Create from File without clicking
on the Link option to embed objects. Once you have embedded OLE objects into the
drawing, you can create applications of the object and edit, the original OLE object keep
unchanged while you editing information of the source document.
Link Objects
When inserting OLE objects, if you select Create from File and click Link option as well,
you can insert the linked OLE object into ZWCAD drawing. Linking objects is a type of
reference to the information of other document. To use a link object for the same
information in multiple documents, you just modify the source object, and perform
OLELINKS command to set automatic or manual update document containing OLE
objects.
You should keep accessing the source document and linked document. If move or
rename the source object, you should rebuild links in the link file.
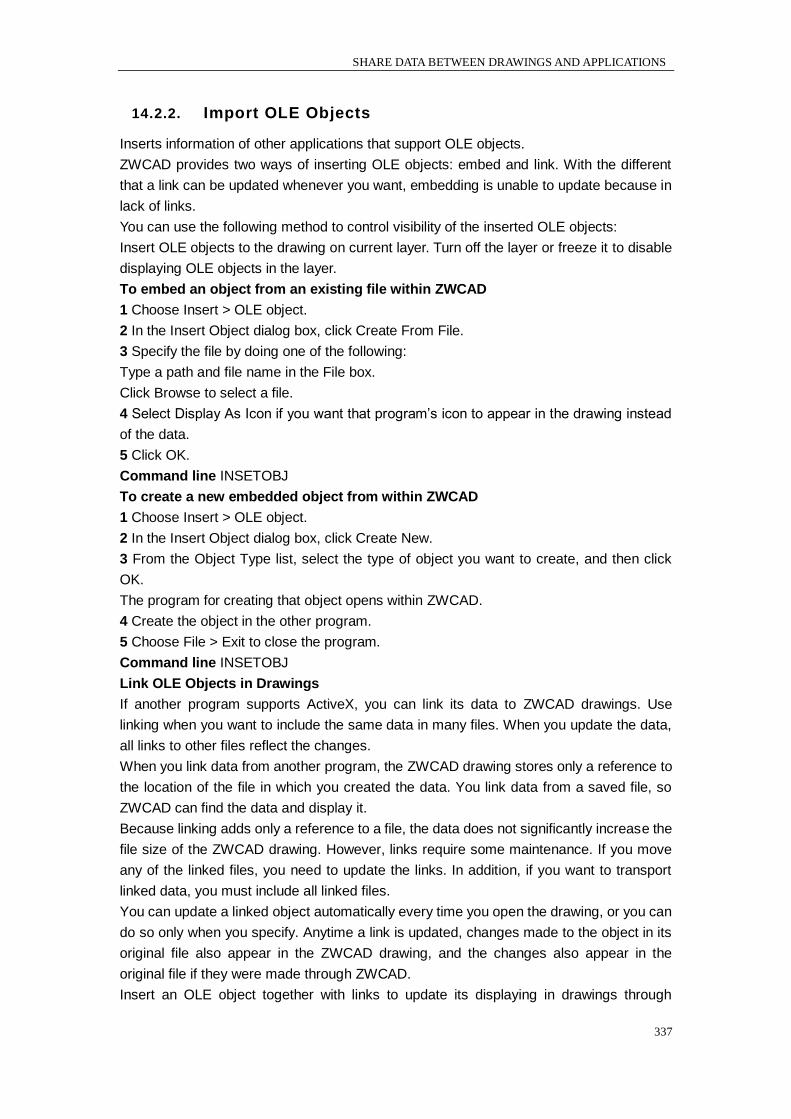
SHARE DATA BETWEEN DRAWINGS AND APPLICATIONS
337
14.2.2. Import OLE Objects
Inserts information of other applications that support OLE objects.
ZWCAD provides two ways of inserting OLE objects: embed and link. With the different
that a link can be updated whenever you want, embedding is unable to update because in
lack of links.
You can use the following method to control visibility of the inserted OLE objects:
Insert OLE objects to the drawing on current layer. Turn off the layer or freeze it to disable
displaying OLE objects in the layer.
To embed an object from an existing file within ZWCAD
1 Choose Insert > OLE object.
2 In the Insert Object dialog box, click Create From File.
3 Specify the file by doing one of the following:
Type a path and file name in the File box.
Click Browse to select a file.
4 Select Display As Icon if you want that program‘s icon to appear in the drawing instead
of the data.
5 Click OK.
Command line INSETOBJ
To create a new embedded object from within ZWCAD
1 Choose Insert > OLE object.
2 In the Insert Object dialog box, click Create New.
3 From the Object Type list, select the type of object you want to create, and then click
OK.
The program for creating that object opens within ZWCAD.
4 Create the object in the other program.
5 Choose File > Exit to close the program.
Command line INSETOBJ
Link OLE Objects in Drawings
If another program supports ActiveX, you can link its data to ZWCAD drawings. Use
linking when you want to include the same data in many files. When you update the data,
all links to other files reflect the changes.
When you link data from another program, the ZWCAD drawing stores only a reference to
the location of the file in which you created the data. You link data from a saved file, so
ZWCAD can find the data and display it.
Because linking adds only a reference to a file, the data does not significantly increase the
file size of the ZWCAD drawing. However, links require some maintenance. If you move
any of the linked files, you need to update the links. In addition, if you want to transport
linked data, you must include all linked files.
You can update a linked object automatically every time you open the drawing, or you can
do so only when you specify. Anytime a link is updated, changes made to the object in its
original file also appear in the ZWCAD drawing, and the changes also appear in the
original file if they were made through ZWCAD.
Insert an OLE object together with links to update its displaying in drawings through
CHAPTER 14
338
changing source objects. For example, you may be required to insert a time table into an
automatic update drawing.
When inserting OLE objects, you can display the object as icon, thus you can activate
applications which are supportive to this object by double clicking this icon.
To create a linked object from within ZWCAD
1 Choose Insert > OLE object.
2 In the Insert Object dialog box, click Create From File.
3 Specify the file by doing one of the following:
Type a path and file name in the File box.
Click Browse to select the file using a file dialog box.
4 Select the Link check box.
5 Select Display As Icon if you want that program‘s icon to appear in the drawing instead
of the data.
6 Click OK.
Command line INSETOBJ
Update Links
Display the links contained in current drawing in the Links dialog performed from
OLELINKS command. With this command, you can setup methods to update links for
each settings used for linking information, either automatic or manual.
By default, the OLE links created in ZWCAD drawing are automatic update.
Reconnect Links
Source refers to the position where the linked documents are located. Once the position of
document is changed or renamed, the link source must be changed as well. When
replacing information or objects with links contained, the link source should be changed
also.
Break Links
Select Break links option in Links dialog box, OLE objects in ZWCAD drawing will not be
removed rather than its links. Thus, the OLE object never updates when changing its
source.
To link a file to an ZWCAD drawing
1 Save the original file.
Because a link consists of a reference to the original file, you must save the file before you
can link to it.
2 In the original file, select the data you want in the ZWCAD drawing.
3 Choose that program‘s command to place data on the Clipboard. Usually, you choose
Edit > Copy.
4 Display the ZWCAD drawing to which you want to link the file.
5 In ZWCAD, choose Edit > Paste Special.
6 In the Paste Special dialog box, select Paste Link.
7 Click OK.
Embed OLE Objects in Drawings
Embed an object into your ZWCAD drawing when you want to keep all the data you work
with in one file or if you want to transfer the file to other computers. You can embed data
from programs that support object linking and embedding.
SHARE DATA BETWEEN DRAWINGS AND APPLICATIONS
339
When you embed data from another program, ZWCAD becomes the container for that
data.The object embedded in the ZWCAD drawing becomes part of the ZWCAD file.
When you edit the data, you open its program from within the ZWCAD drawing.
Any changes you make to the embedded data exist only in the ZWCAD drawing, so it is
not necessary to keep that data in a separate file. If the data does exist in a separate file,
the original file does not change when you modify the embedded object in ZWCAD. Also,
changes to the original file do not affect the embedded object in the ZWCAD drawing.
To embed another program’s object into an ZWCAD drawing
1 Open the file that contains the data you want.
2 In the file, select the data you want to embed in the ZWCAD drawing.
3 Choose that program‘s command to place data on the Clipboard. Usually, you choose
Edit > Copy.
4 In the ZWCAD window, display the drawing in which you want to embed the object.
5 Choose Edit > Paste, or click the Paste tool ( ) on the Standard toolbar.
The data on the Clipboard is pasted into the drawing as an embedded object. The object
appears in the center of the view, but you can select and move it by moving the cursor.
The OLE objects that are surpportive to other applications will not be updated along with
the objects in source document when embedding into ZWCAD drawings.
ZWCAD provides various methods to embed drawings: such as copy the object to
clipboard, paste it to ZWCAD drawing files, and then embed it to ZWCAD drawing. You
can embed a company icon created by other applications into ZWCAD drawings.
With the embedding feature, you can also embed OLE objects into ZWCAD drawings
without specifying links. A .txt file will be changed into mtext once embedded into the
drawing, with its file name displayed together.
Once embedded into current drawing, you can adjust the object‘s size according to the
proportion of drawing unit. And also scaling text that is included in OLE objects by
specifying point size.
Drag Objects into a Drawing
If you want to link data and drawings to ZWCAD drawings from other applications, besides
inserting OLE objects, you can drag the selected data or drawings into ZWCAD. Both
applications must be running and visible on your screen. To drag information between
applications, the other applications must support ActiveX. Objects dragged into a drawing
are embedded, not linked.
As manipulating for cutting and pasting, you do the dragging in the same way. The
information is removed from one document and pasted into the other document when you
do the dragging. Holding down CTRL while dragging creates a copy of the information
without affecting the original document, as you do copying and pasting in the same way.
Control Objects’ Quality
Default quality level of the OLE objects is determined by system variable OLEQUALITY.
To illustrate plotting effects, the quality here is divided into five grades: line quality, text
quality, graphics quality, photo quality and high photo quality.
In which line quality is the lowest grade, plots the drawing in the shortest way and
occupies the least memory. While high photo quality plots the drawing in a longer way and
occupies more memory.

CHAPTER 14
340
Limits for Inserting OLE Objects
ZWCAD set some limits when linking or embedding the OLE objects. All these inherent
limits are used for designing OLE objects.
OLE objects are not displayed or plotted on xrefs or block references.
Modifications made for plotting rotation are not reflected on OLE objects when using
Microsoft Windows system plotter. Change plot orientation in Windows Plotting system
configuration dialog box.
ZWCAD limits the size of spreadsheet that is imported as OLE object. If import too large a
spreadsheet, you can reduce the column width and row height, and reduce font size or
partly paste the spreadsheet so as to divide the OLE objects into several objects in
smaller size.
Before importing OLE objects into other applications, use Windows copyclip viewer to
preview OLE object.
14.2.3. Export OLE Objects from Drawings
Export ZWCAD drawings into other applications that are supportive to OLE objects, and
then embed the objects of the drawing into other documents.
Select objects in ZWCAD drawing, and hold CTRL+C or use other copy commands to
copy selected objects, paste or selective paste the copies using copy commands of other
applications to embed them from the ZWCAD into other documents.
Embedding places a copy of the selected objects in the destination document. The object
in the original drawing will not update when you edit the OLE object from within the
destination document in a ZWCAD drawing.
Dragging ZWCAD drawings into other programs
If the other program in which you want to include ZWCAD drawings is compatible with
ActiveX, an alternative to pasting drawings with menu commands is to drag drawing file
icons from Windows Explorer into the other document. Dragging and dropping drawings
does not use the Clipboard, so data on the Clipboard is not affected.
When you drag an ZWCAD drawing file from Windows Explorer, you link or embed the
entire drawing in the other document. When you drag the file, the cursor changes in
response to the action you take.
TIP Before you drag a drawing, position the Windows Explorer window and the other
program‘s window so you can see the file icon and the document in which you want to
drop it.
To drag and embed drawings into another document
Select the icon for the drawing file, and then drag the drawing into the document.
Edit OLE Objects in Drawings
You can modify an embedded or linked object in its original program from within
ZWCAD.When you modify an embedded object, you change the object only in ZWCAD,
not its original file (if you pasted the object from an existing file). When you modify a linked
file, however, you open and change the original file.
Double-click the OLE object to start server applications in which you can edit the OLE
objects.
ZWCAD provides two ways to edit OLE objects: one is to link or embed OLE objects
SHARE DATA BETWEEN DRAWINGS AND APPLICATIONS
341
which are supportive of other applications into ZWCAD drawings, or you can embed
ZWCAD drawings into other applications.
Embed ZWCAD drawings into Other Applications
When you want to embed ZWCAD drawings into other applications, you use ZWCAD
objects as the OLE objects while ZWCAD applications are taken as server applications. In
the target application, which is so-called container applications,double clicking the
inserted OLE objects to start ZWCAD application and modify OLE objects. Once you have
changed OLE object, only the target application displays its change, the source OLE
object is not changed.
Link or Embed OLE Objects supportive of other Applications into ZWCAD
When you link or embed OLE objects that are supportive of other applications into
ZWCAD, ZWCAD applications are used as container applications.
If you select objects of ZWCAD using frame selection, the inserted OLE object overlapped
with ZWCAD objects. But the objects to be selected are only provided in ZWCAD, not
OLE objects.
Additionally, the edit and snap mode take no effect on OLE objects. To adjust and scale
the size of the OLE objects, you should edit these objects using grips displayed on them.
When you right click on the OLE object, a shortcut menu will be displayed with some
editing properties such as: Cut, Copy, Delete object and On.
Embedding drawings
When you embed an ZWCAD drawing, it becomes part of the other program‘s document
file.When you edit the drawing, you edit only the version that is embedded in the other
document.
Embedding is useful when you don‘t want to maintain a link to the ZWCAD drawing for the
data you include in the other document. Edits made to the new drawing do not affect the
original drawing. To transfer the file to other computers, you can transfer all the data in
one file, but embedded objects increase the file size.
From within a document in a program that supports ActiveX, such as Microsoft® Word,
you can either create a new embedded ZWCAD drawing or embed an existing ZWCAD
drawing.
To create an ZWCAD drawing in another document
1 In the document, choose Insert > OLE Object.
2 In the dialog box, click the options for creating a new file.
3 Under Object Type, choose ZWCAD Drawing, and then click OK.
4 Create the ZWCAD drawing.
5 Choose File > Exit in ZWCAD.
6 To edit the ZWCAD drawing from within the document, double-click the drawing.
TIP You can also embed an existing ZWCAD drawing from within another document.
To embed selected ZWCAD entities
1 In ZWCAD, select the entities you want to embed.
2 Choose Edit > Copy (or press Ctrl+C).
3 Open the document in which you want to embed the entities.
4 Choose Edit > Paste (or the equivalent command).
To embed an entire ZWCAD drawing

CHAPTER 14
342
1 Open the document in which you want to embed the drawing.
2 Choose Insert > OLE Object.
3 Click Create From File.
4 Click Browse, and then choose the file you want to embed.
5 Click Insert, and then click OK.
Linking drawings
When you link an ZWCAD drawing to another document, the other document contains
only a reference to the ZWCAD drawing file, rather than the actual drawing. You link data
in a saved ZWCAD file so that the other program can find the data and display it.
Linking works well when you want to include the same ZWCAD data in more than one
document.When you update the data, you need update it in only one location. The
versions that are linked to other documents reflect the changes automatically.
Linking an ZWCAD file to another document does not increase the file size the way
embedding an ZWCAD object does. However, links require more maintenance. To
transport the data, you must make sure to transfer all linked files to the other computer.
To link an ZWCAD file to another document
1 Open the drawing you want to link.
NOTE Because a link is a reference to a file, you can link only files that are saved to a
location on a disk.
2 In the other program, open the document in which you want to include the ZWCAD
drawing.
3 Choose that program‘s command for inserting objects.
In Microsoft® Office programs, choose Insert > Object. In the Object dialog box, click the
Create From File tab. Specify the name of the drawing file you want to link. Select the Link
To File check box, and then click OK. The drawing appears in the document, with a link to
the original ZWCAD file.
Work with Data in Other Formats
Import Files Created in Other Formats
To open and use drawings or graphics generated with other applications in specified
format. ZWCAD supports mutual conversion between DXF and WMF format. Use the
commands relative to each file types to convert formats among them. You can also
convert formats by opening or importing files.
ZWCAD surports the output file format containing: WMF, DXF, BMP, DWG, DWT, EMF,
SVG, PDF, EPS, DWF, SAT. In which, DWG, DXF, DWT, DWF are imported using Open
command. DXF refers to drawing exchange format, DWG refers to standard drawing file,
DWT refers to template drawing file, and DWF refers to network design format. The
additional SAT and WMF file should be imported by relevant command.
Import DXF Files
As a drawing exchange file, DXF file contains text file of drawing information, which is also
an expression of ASCII or binary system of drawing file. Mainly used for sharing drawing
data among applications.
Select DXF file from the file type dropdown list to import this file into applications when
performing Open function in ZWCAD. You can import it into other drawing file and explode
it.
SHARE DATA BETWEEN DRAWINGS AND APPLICATIONS
343
To import a DXF, DWF, or DWT file
1 Choose File > Open.
2 Choose the folder that contains the drawing.
3 In Files of Type, choose the type of drawing you want to import.
4 Choose the file you want to open.
5 Click Open.
Stardard Toolbar
Command line OPEN
Import ACIS SAT Files
You can import geometry objects stored in SAT (ASCII) files using ACISIN or IMPORT
commands. SAT (ASCII) files stores entities as solids, region or ACIS. ZWCAD converts
the model to a body object or to solids and regions if the body is a true solid or a true
region. After the conversion, ZWCAD creates new objects using its ShapeManager
modeler and performs 3D operations and solids editing.
To import an ACIS file
1 Choose Insert > ACIS file.
2 Choose the directory containing the SAT file.
3 Choose the SAT file you want to open.
4 Click Open.
Command line ACISIN
Import WMF Files
As a Windows metafile format, WMF files are frequently used to produce clip art and other
nontechnical images that you need for drawings. Use WMFIN or IMPORT command to
insert a WMF file into a drawing file as a block.
To be different from bitmaps, WMF files contain vector information that can be resized and
printed without losing resolution. If 2D solids or wide lines are contained in the WMF file,
turn off their display so as to increase drawing speed.
Both vector and raster information can be contained in WMF files. However, ZWCAD uses
only the vector information from a WMF file. ZWCAD ignores the raster information if
using a WMF file containing raster information.
Export Drawings to Other File Formats
Export and convert ZWCAD drawings as other file formats. ZWCAD surports the output
file format containing: WMF, DXF, BMP, DWG, DWT, EMF, SVG, PDF, EPS, DWF, SAT.
WMF
Exports drawing files as element files (.wmf) using WMFOUT or EXPORT command. As a
Windows metafile format, WMF file includes lots of vector drawings or raster images.
Generally, ZWCAD creates WMF files in vector drawings which are easy to pan or scale.
DXF
As a drawing exchange file, DXF file contains text file of drawing information that are
accessible for all the other CAD systems. If someone else is using CAD applications
capable of identify DXF files, you can share the drawing by saving drawing as DXF file.
User can export files as DXF format using Save or Save As command, select DXF file
format from the Tools button of the Export dialog box, when saving the drawing as DXF
CHAPTER 14
344
format. DXF files are also saved as ASCII or binary format.
Specify precise decimal digits as you saving drawing as DXF file, controls floting-precision
up to 16 digits for DXF files. You can also click Select Object option to save some objects
as DXF file.
BMP
As bitmap file format, BMP is a kind of raster image format. The object displayed on
screen together with colored viewport and objects in rendered viewport will be displayed in
raster images as well.
Export the entire drawing or partly export the drawing to device-independent raster
images using EXPORT command.
DWG
DWG is standard drawing file format generally supported by CAD software.
DWT
You can export drawings as DWT template file using Save or Save As command.
EMF
EMF is fortified Windows relay file.
SVG
SVG is upgradable vector graphics.
To export a drawing to a BMP, EMF, WMF, or SVG file
1 Choose File > Export.
2 In the Export Drawing As File dialog box, under Save As Type, choose the file format.
3 Specify the name of the file you want to create.
4 Click Save.
5 If the selection prompt box displays, choose the entity-selection method, and then
create the selection set.
6 When you have finished selecting entities, press Enter.
Command line EXPORT
The EXPORT command is available for exporting the drawing as a PDF file.
PDF files allow you to distribute your drawing to others for viewing in Adobe® Acrobat ®
Reader®, which is free software that users can download. PDF files can also be viewed,
reviewed, and edited in Adobe® Acrobat.
To export a drawing to a PDF file
1 Choose File > Export.
2 In Save As Type, choose Portable Document Format (pdf).
3 Specify the name of the file you want to create.
4 Click Save.
5 Choose the entity-selection method, and then create a selection set that contains the
entities you want to export.
6 When you have finished selecting entities, press Enter.
Command line EXPORT
EPS
EPS format is housed PostScripe file, a drawing file can be exported as EPS file using
EXPORT command.
SHARE DATA BETWEEN DRAWINGS AND APPLICATIONS
345
PostScript file formats are most available for desktop publishing applications. With plotting
capability of high resolution, this file format is suited for raster images, such as GIF, PCX
and TIFF. Once you have converted the drawing into PostScript format, you can use
PostScript font.
To export files as EPS from layout tab, you should execute from File-Plot, to start Plotting
dialog box, select plotter as ZWCAD Virtual EPS Plotter, and click Plot to File option, and
then click OK to close Plot dialog box. And next, start PLT dialog box, in which user can
specify saving path and file name, save the file with extensions .eps.
Controllable Properties of PostScript
When exporting drawing as EPS files in PostScript format, some objects will be rendered.
Affects the following properties:
Text, attribute definitions and attributes. If replace the font supportive of PostScript with
the font with specified conversion text object, text will be plotted in specified PostScript
font. Or else, render the text with frame character.
Bold font and text control code. If the text with thickness over 0 or contain control
code( such as %%O or %%D). But rendered text will not plotted as PostScript font.
International symbol and special symbol exported as PostScript font.
ISO 8859 Latin/1 character set, if use character value among 127 to 255 for text, explain
this text according to ISO 8859 Latin/1. If this character appears in the text reflected to
PostScript, re-mapping a version of generating code vector to display ISO character set.
The text generated from re-mapping will be exported in PostScript compatible format.
Circle, arc, ellipse, elliptic arc. Arcs and circles will be converted into corresponding
PostScript path object if they have thickness.
Fill solids. Plot the Fill solids in PostScript path.
2D polyline. Exports the 2D (planar) polyline with unify width, PostScript restricts system
settings as proximate lines combination with end seal and mitre.
DWF
Export ZWCAD drawings as Web DWF formats, As a two dimension vector file, DWF
publish ZWCAD drawings on Web or Intranet network.
DWF file supports realtime panning or scaling and controls how the layers and named
views are displayed.
SAT
Exports solids, region, ACIS entities as SAT format using ACISOUT command.
Additionally, trimmed ShapeManager objects of the NURBS face, region and 3D solids
are also exported as SAT file.
To export an ACIS file
1 Choose File > Export.
2 Select the ACIS entities you want to save.
3 Specify the name of the file you want to create.
4 Click Save.
Command line EXPORT
14.2.4. Work with Proxy Objects
When the Runtime Extension application that created the custom object is not available to

CHAPTER 14
346
ZWCAD or other host applications, a proxy object is used as a substitute for a custom
object. Later, the custom object replaces the proxy object if the application is available to
ZWCAD.
As compared to corresponding custom objects, Proxy objects are endowed with
significantly reduced capabilities. The extent to which proxy objects can be edited is
determined by the parent Runtime Extension application. For example, to determine
whether to erase and move an object, or change object properties, may or may not be
possible on a proxy object, depending on the application that created it.
A Proxy Information dialog box will be displayed when you open a drawing. Which shows
the total number of proxy objects in the drawing (both graphical and nongraphical) and the
name of the missing application and provides additional information about the proxy
object type and display state. You can control the display of proxy objects with the dialog
box.
Edit Proxy Objects
Proxy objects are enabled to be access, display, and also to perform the following
manipulations:
Erase proxy objects
Quick select proxy objects
Define block reference with proxy objects, insert drawings and block references with proxy
objects, and explode.
Export, plot preview proxy objects
Edit operations such as MOVE, COPY, MIRROR .etc
14.3. Package a Set of Files for Internet Transmission
With the application of etransmit, you can accomplish transmitting drawing files together
with their associative files through Internet in forms of transmittal packages. The
associative files included in the transmittal package are xrefs, fonts, raster images .etc.
Generally, all of the included files such as xrefs, raster images and fonts will be ignored
when you sending drawings to others. The receiver may not be able to display the
transmitted drawing because of lacking these associative files. Using etransmit can help
preventing such circumstances and decrease the error probability to a certain extent.
Select files to pack
Starts Create Transmittal dialog box, which provides two tabs for viewing and selecting
files to be packed.
Files Tree: Displays drawing files in a tree structure together with their associative files
(xrefs, fonts, raster images). You can expand or collapse these structure to display or hide
the included dependent files. By default, drawing files and dependent files are included in
the transmittal package automatically. Unless you deselect it by clicking at the check mark
in front of each file.
Files Table: Displays drawing files in forms of a list together with their associative files
(xrefs, fonts, raster images). In which the detail information of each file such as file name,
saving path, type, version size and date are listed. Transmittal package includes all these
files automatically. You can deselect it by clicking at the check mark in front of each file in
order to control the included contents of each transmittal package.
SHARE DATA BETWEEN DRAWINGS AND APPLICATIONS
347
Once you have performed eTransmit function for a drawing file, the common file types you
can automatically add to the transmittal package are:
*.dwg ( root drawing file and all of its attached xrefs)
Various image file types (raster image files that attach to root drawing or xref externally)
*.fmp (font mapping files)
User select or deselect files having been added into the transmittal package by clicking at
the check box in front of the file or manually select files you want to include in the
transmittal package by clicking at the Add File button on Files Tree or Files Table.
The common file types that are not automatically added to a transmittal package are:
*.shx ( Compiled shape files used for text styles or complex linetypes)
*.ttf ( True Type font files used for text styles )
All these files generally contain information about the object in initially formatted drawings
or some specific information of applications run with the product, the receiver can still
normally view the transmitted drawing in spite of lacking these files.
Include notes in transmittal package
Report file is automatically generated while generating transmittal package, and saved in
the transmittal package together with the files list of the transmittal package as well.
Meanwhile, this report includes dependent files associative to the drawing file (such as
xrefs, fonts) as well as instructions about how to process these files so as to enable using
for included drawing files. The information that user input in the Enter notes to include with
this transmittal are also included in the report file.
Select Transmittal Setups
Once created a transmittal package, you can create new or modify existing transmittal
setup and save it, so that you select it properly from the transmittal setup list on Create
transmittal dialog box as you need when next time you create transmittal package.
System default transmittal setup is named as STANDARD, for which you can change its
default settings, but unable to perform rename or delete operation.
Choose Transmittal Options
You can specify the following transmittal setups when creating transmittal package, which
greatly facilitate using the etransmit function.
Specify transmittal package type to be created as: ZIP file, self-extracting EXE file and
folder( a specified folder position where the drawing will be packaged or copied)
Choose options among Use organized folder structure, Place all files in one folder, Keep
files and folders as is, to organize folder structure of transmitted files in logical structure.
Add password protection for transmittal package of ZIP file and self-extracted EXE.
Select Include fonts option to get all the font files associative to transmittal package ( TTF
and SHX), which facilitate receiver to view the drawing file.
Send the transmittal package and transmittal report in form of e-mail attachment to
relevant users.
It should be noticed that, regardless of file structure included in the created transmittal
package, absolute path of dependent files that are relative to the drawing file will be
converted to relative path or not include path, so that you can easily find them while
opening or editing drawing files.
Create transmittal package in specified folder
CHAPTER 14
348
Select File - eTransmit menu option.
In the Create Transmittal Dialog Box, Files Tree or Files Table area, click Add file button.
In the Open folder, select the file to be added to the transmittal package, click Open. User
can optionally repeat this procedure to add more files into transmittal package.
To clear the selection for files being added into the transmittal package, click the check
box marks beside any files on the Files Tree or Files Table.
Click on Transmittal Setup button, select a transmittal setup from the Transmittal Setups
dialog box, and then click Modify button.
On the Modify Transmittal Setup dialog box, set the transmittal package type as Folder
(set of files).
Under Transmittal File Folder, click Browse to specify the folder where the transmittal
package to be created. A standard file selection dialog box is displayed.
Select folder where the transmittal package will be created, click OK.
On the Modify Transmittal Setup dialog box, click OK to close dialog box.
On the Transmittal Setups dialog box, click Close.
(Optional) Specify any additional comments to include with the report file from the text box
for Enter notes to include with this transmittal in Create Transmittal dialog box.
Click OK to create the transmittal package in the folder you specified.
Command line: ETRANSMIT
Create transmittal package for self-extracting executable or ZIP file
Select File - eTransmit menu option
On the Create Transmittal" dialog box, Files Tree or Files Table area, click Add File button.
Select file to add to transmittal package from Open folder, click Open. You can repeat this
procedure to add more files into transmittal package as you need.
To deselect the file having been added into the transmittal package, click the check mark
beside the file listed in Files Tree or Files Table.
Click Transmittal Setups button, select a setup and then click Modify button.
In Modify Transmittal Setup dialog box, set the transmittal package type as ZIP (*.zip) or
Self-extracting executable (*.exe).
Under Transmittal file folder, click Browse to specify folder where the transmittal package
is created. And displays standard select file dialog box.
Select folder where the transmittal package will be created, click OK.
On the Modify Transmittal Setup dialog box, click OK to close dialog box.
On the Transmittal Setups dialog box, click Close.
(Optional) Specify any additional comments to include with the report file from the text box
for Enter notes to include with this transmittal in Create Transmittal dialog box.
Click OK to create the transmittal package in your specified folder.
Command line: ETRANSMIT
Unpack a self-extracting executable transmittal package
Double-click the transmittal package file in Windows Explorer.
In Extractor dialog box, Select Browse to specify the folder where you want to unpack the
transmittal files.
Click OK.
If the transmittal package is password protected, system prompt for entering the

SHARE DATA BETWEEN DRAWINGS AND APPLICATIONS
349
password.
Click OK to close each dialog box.
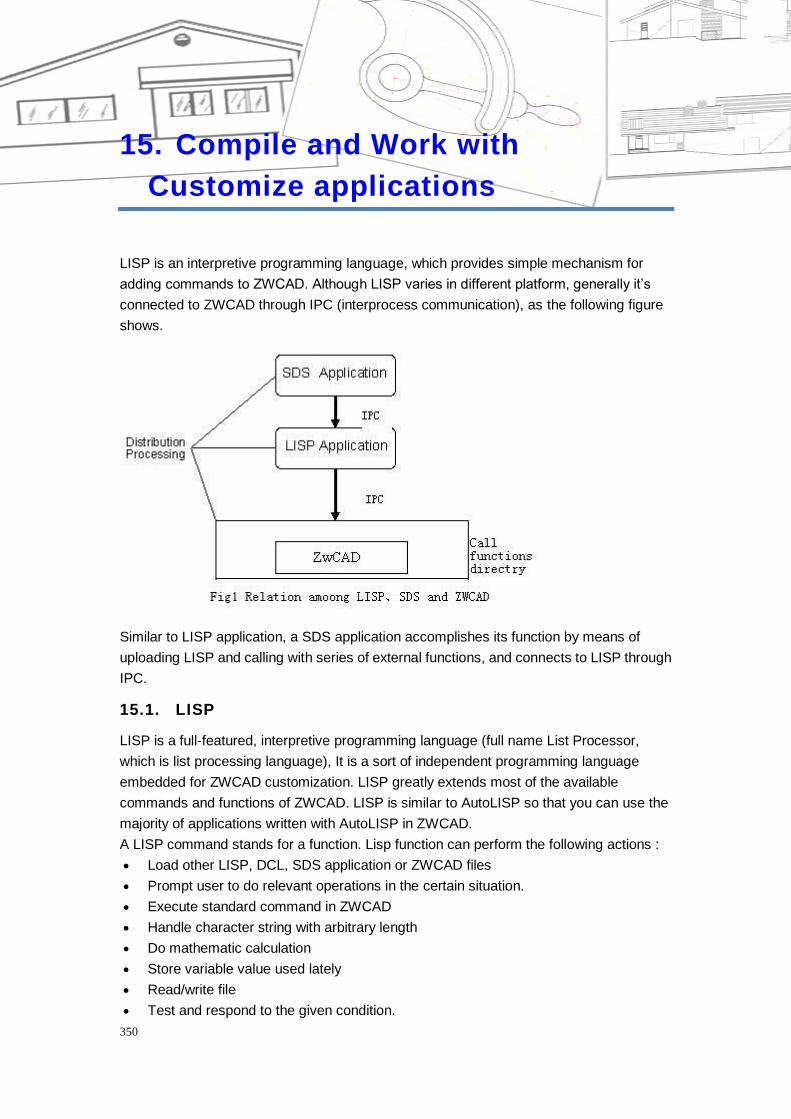
CHAPTER 15
350
15. Compile and Work with
Customize applications
LISP is an interpretive programming language, which provides simple mechanism for
adding commands to ZWCAD. Although LISP varies in different platform, generally it‘s
connected to ZWCAD through IPC (interprocess communication), as the following figure
shows.
Similar to LISP application, a SDS application accomplishes its function by means of
uploading LISP and calling with series of external functions, and connects to LISP through
IPC.
15.1. LISP
LISP is a full-featured, interpretive programming language (full name List Processor,
which is list processing language), It is a sort of independent programming language
embedded for ZWCAD customization. LISP greatly extends most of the available
commands and functions of ZWCAD. LISP is similar to AutoLISP so that you can use the
majority of applications written with AutoLISP in ZWCAD.
A LISP command stands for a function. Lisp function can perform the following actions :
Load other LISP, DCL, SDS application or ZWCAD files
Prompt user to do relevant operations in the certain situation.
Execute standard command in ZWCAD
Handle character string with arbitrary length
Do mathematic calculation
Store variable value used lately
Read/write file
Test and respond to the given condition.
GLOSSARY
351
Select entity in drawing session.
Modify the selected entity in drawing session.
Export relevant information into screen or a file.
You can produce customize resolution with application comprised of compound variant
LISP functions. You can automate your job by extending CAD tools in ZWCAD or apply
other applications into ZWCAD. LISP can be used to produce any application you need in
the special industries to intensify the CAD platform.
Application of LISP expressions
LISP has its particular functions and syntax. LISP codes are capable of tested directly
without preparing extra procedure. Two syntaxes are provided in LISP, the first one
putting the operator in front of the operating number, in which operators can be taken as
functions with specific features, the operating number is process by functions. Each
statement is separated by a blank.
The second syntax divides the statement into two items within each bracket: function
name as the first item and the parameters or variables of the function is second item.
Create a LISP program
Steps to write application using LISP:
1. Open a text edited window such as NOTEBOOK.
2. Write code in the text edited window.
3. Saves the new code file with the desired path and file name from File-Save As
menu option, extension name as 1st.
4. Verify the code input.
The following properties are contained in LISP functions:
1. The codes are displayed in indent mode as other program languages do, but
take no effects on performing programs.
2. Newline is used to facilitate understanding and reading, and place multi-row
codes in one line, which does not effect performing the program.
3. All LISP statements are contained in the brackets which always appear in pairs.
4. If multiple brackets pairs are contained in a statement, execute from the interior
bracket.
5. Text in codes appears behind the semicolon is a kind of annotation. Any text
with semicolon in front will be ignored by programs.
All LISP functions return value to the other function that invoke them. By default, the value
is calculated by the last expression. Generally the function princ without character string
parameter follows the function that its name precede with a prefix "c:". This function is
aimed at exiting program without returning any value.
Load and Run LISP Program
LISP program is available only after loading, while how to apply a LISP program relies on
the program itself, if functions are created in programs, it can be performed just like
executing commands in ZWCAD. Most of the LISP functions are provided with prompts
instructing how to use them. You can load LISP program to ZWCAD before executing this
program as performing APPLOAD command. In addition to input from command line,
CHAPTER 15
352
ZWCAD provides another direct way of performing commands: customize menu which is
used for running LISP program. No more descriptions for the specific procedures here.
Sample of LISP program
The following LISP program explains how to create a green TEST layer, and draw a
closed polyline on that layer.
(defun C:testlisp (/)
(setvar "cmdecho" 0)
(command "-layer" "t" "test" "m" "test" "c" "green" "test" "l" "continuous"
"test" "lw" "0.5" "test" "")
(command "pline" "-2,-3,0" "6, 4, 0" "1, -10, 0" "-11, -9, 0" "-12, -1, 0" "-6, 2, 0" "-1, 7, 0"
"c")
(command "regen")
(command "zoom" "e" "")
(setvar "cmdecho" 1)
(princ)
)
Remarks
User can reference ―LISP document‖ from Developer‘s help, to view LISP functions as
well as relative tutorials that ZWCAD supports.
15.2. VBA
VBA is a kind of programming language including variety of Microsoft applications
program environment (such as WORD, EXCEL .etc)
Microsoft VBA is a type of program environment for objects, capable of providing
developing function as Visual Basic 6 (VB). The main difference between VBA and VB is
that VBA runs together with ZWCAD in the same process space, and provides intellective
and frequent program environment.
VBA provides application integration for those application programs supportive of VBA.
That is to say, ZWCAD (using other applications database) can be Automation controlling
program such as Microsoft Word or Excel and other applications.
You should purchase independent developed version of Visual Basic 6,providing ZWCAD
VBA with extra components, such as external database engine and report forms
compiling function.
Four advantages of realizing VBA in ZWCAD:
VBA and its environment are prone to study and apply.
VBA is capable of running together with ZWCAD in the same process space and
facilitate the program operating.
Rapid and effective construction of dialog box, which enables developers construct
prototype applications and receive design feedback quickly.
The project is both independent and embedded supported. Which provides
developers with flexible ways to release their applications.
VBA applications are saved in Projects files, ZWCAD® VBA project is a combination of
code module, class module and window, all these modules and windows run together to
GLOSSARY
353
execute specified function. The project can be stored in both ZWCAD drawings and also
can be stored as independent file.
You can open VBA manager through ZWCAD menu Tools-Macro-VBA Manager to view
VBA project in which you are allowed to create, load and close projects.
ZWCAD VBA project is incompatible with independent Visual Basic 6 project binary
system. However, you can use IMPORT File and EXPORT File from File menu option to
import and export forms, modules and classes while working in VBA IDE.
Open VBA environment
VBA has its own interface environment, execute from ―Tools-Macro-VisualBasic editor, to
open Visual Basic program and display VBA environment window which is short for IDE,
i.e. Integrated Development Environment.
ZWCAD VBA project is a collection of code modules, classes and forms, here module is
self-include program code segment, a project is capable of containing multiple modules.
These modules and forms run together to perform given functions.
You can add new modules by selecting ―Insert – Module‖ menu option from the Visual
Basic project window. And next to open module file editor window, in which you can write
codes. Meanwhile, a new module icon will be added in the module list in ―Project‖ window
with default name as Modual1.
ZWCAD is running while opening VBA environment, you can toggle to ZWCAD platform
from the last option on ―View‖ menu in VBA IDE.
VBA program samples
The following VBA program draws a donut with inside diameter as 10, and outside
diameter as 15:
Sub DrawDonut()
Dim CenterPt(0 To 2) As Double
Dim OutRad As Double
Dim InRad As Double
CenterPt(0) = 10: CenterPt(1) = 10: CenterPt(2) = 0
OutRad = 15
InRad = 10
Dim pts(0 To 3) As Double
pts(0) = CenterPt(0) - InRad - Abs(OutRad - InRad) / 2
pts(1) = CenterPt(1)
pts(2) = CenterPt(0) + InRad + Abs(OutRad - InRad) / 2
pts(3) = CenterPt(1)
Dim PolyObj As ZwcadLWPolyline
Set PolyObj = ThisDocument.ModelSpace.AddLightWeightPolyline(pts)
PolyObj.Closed = True
CHAPTER 15
354
For i = 0 To 1
PolyObj.SetBulge i, 1
PolyObj.SetWidth i, Abs(OutRad - InRad), Abs(OutRad - InRad)
Next i
PolyObj.Update
ThisDocument.Regen
End Sub
Remarks
See ―VBA Develop and Migrate Guide‖ and ―VBA Reference‖ in ―Developer‘s help‖ to view
the VBA functions as well as relevant tutorials provided in ZWCAD platform (it‘s
recommended to reference specific instructions from ―Help‖-‖Developer‘s help‖).
15.3. SDS
SDS is an acronym for Solutions Development System, a C/C++ language interface
compatible with the ADS® (AutoCAD® Development System) interface found in other
CAD systems. SDS provides hooks into ZWCAD® , allowing you to create custom
applications.
Remarks
User can reference ―SDS Programming Language Reference‖ in ―Developer‘s help‖, in
which SDS functions as well as instructions for SDS function are provided (it‘s
recommended to reference specific instructions from ―Help‖-‖Developer‘s help‖).
15.4. DCL
DCL is an acronym for Dialog Control Language, a separate programming language that
you can use with ZWCAD® to create custom dialog boxes. In creating dialog boxes with
DCL, you work with elements called tiles, cluster tiles (or clusters), and attributes.
Remarks
User can reference ―DCL Programming Reference‖ in ―Developer‘s help‖ (it‘s
recommended to reference specific instructions from ―Help‖-‖Developer‘s help‖).
GLOSSARY
355
16. Glossary
absolute coordinates
Coordinate values measured from a coordinate system's origin point.
acquired point
In the tracking or object snap tracking method of locating a point, an intermediate location
used as a reference.
acquisition marker
During tracking or object snap tracking, the temporary plus sign displayed at the location
of an acquired point.
aliasing
The effect of discrete picture elements, or pixels, aligned as a straight or curved edge on a
fixed grid appearing to be jagged or stepped.
aligned dimension
A dimension that measures the distance between two points at any angle. The dimension
line is parallel to the line connecting the dimension's definition points. (DIMALIGNED)
ambient color
A color produced only by ambient light.
ambient light
Light that illuminates all surfaces of a model with equal intensity. Ambient light has no
single source or direction and does not diminish in intensity over distance.
angular dimension
A dimension that measures angles or arc segments and consists of text, extension lines,
and leaders. (DIMANGULAR)
angular unit
The unit of measurement for an angle. Angular units can be measured in decimal degrees,
degrees/minutes/seconds, grads, and radians.
annotations
Text, dimensions, tolerances, symbols, or notes.
ANSI
For American National Standards Institute. Coordinator of voluntary standards
development for both private and public sectors in the United States. Standards pertain to
programming languages, Electronic Data Interchange (EDI), telecommunications, and the
physical properties of diskettes, cartridges, and magnetic tapes.
anti-aliasing
A method that reduces aliasing by shading the pixels adjacent to the main pixels that
define a line or boundary.
approximation points
Point locations that a B-spline must pass near, within a fit tolerance.
CHAPTER 16
356
array
Multiple copies of selected objects in a rectangular or polar (radial) pattern. (ARRAY).
arrowhead
A terminator, such as an arrowhead, slash, or dot, at the end of a dimension line showing
where a dimension begins and ends.
ASCII
For American Standard Code for Information Interchange. A common numeric code used
in computer data communications. The code assigns meaning to 128 numbers, using
seven bits per character with the eighth bit used for parity checking. Nonstandard versions
of ASCII assign meaning to 255 numbers.
aspect ratio
Ratio of display width to height.
associative hatch
Hatching that conforms to its bounding objects such that modifying the bounding objects
automatically adjusts the hatch. (BHATCH)
attenuation
The diminishing of light intensity over distance.
attribute definition
An object that is included in a block definition to store alphanumeric data. Attribute values
can be predefined or specified when the block is inserted. Attribute data can be extracted
from a drawing and inserted into external files. (ATTDEF)
attribute extraction file
An ASCII text file to which extracted attribute data is written. The contents and format are
determined by the attribute extraction template file.
attribute extraction template file
An ASCII text file that determines which attributes are extracted and how they are
formatted when written to an attribute extraction file.
attribute prompt
The text string displayed when you insert a block with an attribute whose value is
undefined.
attribute tag
A text string associated with an attribute that identifies a particular attribute during
extraction from the drawing database.
attribute value
The alphanumeric information associated with an attribute tag.
ZWCAD window
The drawing area, its surrounding menus, and the command line.
axis tripod
Icon with X, Y, and Z coordinates that is used to visualize the viewpoint (view direction) of
a drawing without displaying the drawing. (VPOINT)
back face
The opposite side of a front face. Back faces are not visible in a rendered image.
baseline
An imaginary line on which text characters appear to rest. Individual characters can have
GLOSSARY
357
descenders that drop below the baseline.
baseline dimension
Multiple dimensions measured from the same baseline. Also called parallel dimensions.
base point
1. In the context of editing grips, the grip that changes to a solid color when selected to
specify the focus of the subsequent editing operation. 2. A point for relative distance and
angle when copying, moving, and rotating objects. 3. The insertion base point of the
current drawing. (BASE) 4. The insertion base point for a block definition. (BLOCK)
Bezier curve
A polynomial curve defined by a set of control points, representing an equation of an order
one less than the number of points being considered. A Bezier curve is a special case of a
B-spline curve.
bitmap
The digital representation of an image having bits referenced to pixels. In color graphics, a
different value represents each red, green, and blue component of a pixel.
blips
Temporary screen markers displayed in the drawing area when you specify a point or
select objects. (BLIPMODE)
block
A generic term for one or more objects that are combined to create a single object.
Commonly used for either block definition or block reference.(BLOCK)
block definition
The name, base point, and set of objects that are combined and stored in the symbol table
of a drawing.
block reference
A compound object that is inserted in a drawing and displays the data stored in a block
definition. Also called instance.(INSERT)
B-spline curve
A blended piecewise polynomial curve passing near a given set of control
points.(SPLINE)
BYBLOCK
A special object property used to specify that the object inherits the color or linetype of any
block containing it.
BYLAYER
A special object property used to specify that the object inherits the color or linetype
associated with its layer.
clipping planes
The boundaries that define or clip the field of view. (DVIEW)
color map
A table defining the intensity of red, green, and blue (RGB) for each displayed color.
command line
A text area reserved for keyboard input, prompts, and messages.
construction plane
A plane on which planar geometry is constructed. The XY plane of the current UCS
CHAPTER 16
358
represents the construction plane.
continued dimension
A type of linear dimension that uses the second extension line origin of a selected
dimension as its first extension line origin, breaking one long dimension into shorter
segments that add up to the total measurement. Also called chain dimension.
(DIMCONTINUE)
control frame
A series of point locations used as a mechanism to control the shape of a B-spline. These
points are connected by a series of line segments for visual clarity and to distinguish the
control frame from fit points. The SPLFRAME system variable must be turned on to
display control frames.
coordinate filters
Functions that extract individual X, Y, and Z coordinate values from different points to
create a new, composite point. Also called X,Y,Z point filters.
Coons patch
In 3D surface meshes, the bicubic surface (one curved in the M direction and another in
the N direction) interpolated between four edges.
crosshairs
A type of cursor consisting of two lines that intersect.
crossing selection
A rectangular area drawn to select objects fully or partly within its borders.
CTB file
SA color-dependent plot style table.
default
A predefined value for a program input or parameter. Default values and options for
ZWCAD commands are denoted by angle brackets (<>).
definition points
Points for creating a dimension. ZWCAD refers to the points to modify the appearance
and value of a nonassociative dimension when the dimensioned object is modified. Also
called defpoints and stored on the special layer DEFPOINTS.
dependent named objects (in xrefs)
Named objects brought into a drawing by an external reference.
DIESEL
For Direct Interpretively Evaluated String Expression Language. A macro language for
altering the status line with the MODEMACRO system variable and for customizing menu
items.
dimension line arc
An arc (usually with arrows at each end) spanning the angle formed by the extension lines
of an angle being measured. The dimension text near this arc sometimes divides it into
two arcs.
dimension style
A named group of dimension settings that determines the appearance of the dimension
and simplifies the setting of dimension system variables. (DIMSTYLE)
dimension text
GLOSSARY
359
The measurement value of dimensioned objects.
dimension variables
A set of numeric values, text strings, and settings that control dimensioning features.
(DIMSTYLE)
direct distance entry
A method to specify a second point by first moving the cursor to indicate direction and
then entering a distance.
drawing area
The area in which your drawings are displayed and modified. The size of the drawing area
varies, depending on the size of the window and on how many toolbars and other
elements are displayed.
drawing extents
The smallest rectangle that contains all objects in a drawing, positioned on the screen to
display the largest possible view of all objects. (ZOOM)
drawing limits
The user-defined rectangular boundary of the drawing area covered by dots when the grid
is turned on. Also called drawing limits. (LIMITS)
DWF
For Design Web Format. A highly compressed file format that is created from a DWG file.
DWF files are easy to publish and view on the Web.
DWG
Standard file format for saving vector graphics from within ZWCAD.
DXF
For drawing interchange format.
edge
The boundary of a face.
elevation
The default Z value above or below the XY plane of the current user coordinate system,
which is used for entering coordinates and digitizing locations. (ELEV)
embed
To use object linking and embedding (OLE) information from a source document in a
destination document. An embedded object is a copy of the information from a source
document that is placed in the destination document and has no link to the source
document.
environment variable
A setting stored in the operating system that controls the operation of a program.
explode
To disassemble a complex object, such as a block, dimension, solid, or polyline, into
simpler objects. In the case of a block, the block definition is unchanged. The block
reference is replaced by the components of the block. (EXPLODE)
external reference (xref)
A drawing file referenced by another drawing. (XREF)
extrusion
A 3D solid created by sweeping an object that encloses an area along a linear path.
CHAPTER 16
360
face
A triangular or quadrilateral portion of a surface object.
feature control frame
The tolerance that applies to specific features or patterns of features. Feature control
frames always contain at least a geometric characteristic symbol to indicate the type of
control and a tolerance value to indicate the amount of acceptable variation.
fence
A multisegmented line specified to select objects it passes through.
fill
A solid color covering an area bounded by lines or curves. (FILL)
fit points
Locations that a B-spline must pass through exactly or within a fit tolerance.
fit tolerance
The setting for the maximum distance that a B-spline can pass for each of the fit points
that define it.
font
A character set, comprising letters, numbers, punctuation marks, and symbols of a
distinctive proportion and design.
freeze
A setting that suppresses the display of objects on selected layers. Objects on frozen
layers are not displayed, regenerated, or plotted. Freezing layers shortens regenerating
time. (LAYER)
front faces
Faces with their normals pointed outward.
geometry
All graphical objects such as lines, circles, arcs, polylines, and dimensions. Nongraphical
objects, such as linetypes, lineweights, text styles, and layers are not considered
geometry.
grid
An area covered with regularly spaced dots to aid drawing. The spacing between grid dots
is adjustable. Grid dots are not plotted. (GRID)
grid limits
The user-defined rectangular boundary of the drawing area covered by dots when the grid
is turned on. Also called drawing limits. (LIMITS)
grip modes
The editing capabilities activated when grips are displayed on an object: stretching,
moving, rotating, scaling, and mirroring.
grips
Small squares that appear on objects you select. After selecting the grip, you edit the
object by dragging it with the pointing device instead of entering commands.
HLS
For hue, lightness, and saturation. A system of defining color by specifying the amount of
hue, lightness, and saturation.
initial environment
GLOSSARY
361
The variables and settings for new drawings as defined by the default template drawing,
such as zwcad.dwg or zwcadiso.dwg.
interpolation points
Defining points that a B-spline passes through.
island
An enclosed area within another enclosed area. Islands may be detected as part of the
process of creating hatches, polylines, and regions. (BHATCH, BOUNDARY)
ISO
For International Standards Organization. The organization that sets international
standards in all fields except electrical and electronics. Headquarters are in Geneva,
Switzerland.
isometric snap style
A drafting option that aligns the cursor with two of three isometric axes and displays grid
points, making isometric drawings easier to create.
layer
A logical grouping of data that are like transparent acetate overlays on a drawing. You can
view layers individually or in combination. (LAYER)
layer index
A list showing the objects on each layer. Uses a layer index to locate what portion of the
drawing is read when you partially open a drawing. Saving a layer index with a drawing
also enhances performance when you work with external references. The INDEXCTL
system variable controls whether layer and spatial indexes are saved with a drawing.
layer translation mappings
Assignments of a set of layers to another set of layers that defines standards. These
standards include layer names and layer properties. Also called layer mappings.
layout
The tabbed environment in which you create and design paper space layout viewports to
be plotted. Multiple layouts can be created for each drawing.
layout viewports
Objects that are created in paper space that display views.(VPORTS)
linetype
How a line or type of curve is displayed. For example, a continuous line has a different
linetype than a dashed line. Also called line font. (LINETYPE)
lineweight
A width value that can be assigned to all graphical objects except TrueType® fonts and
raster images.
link
To use object linking and embedding (OLE) to reference data in another file. When data is
linked, any changes to it in the source document are automatically updated in any
destination document.
mirror
To create a new version of an existing object by reflecting it symmetrically with respect to
a prescribed line or plane. (MIRROR)
mode
CHAPTER 16
362
A software setting or operating state.
model
A two- or three-dimensional representation of an object.
model viewports
A type of display that splits the drawing area into one or more adjacent rectangular
viewing areas. (VPORTS)
model space
One of the two primary spaces in which CAD objects reside. Typically, a geometric model
is placed in a three-dimensional coordinate space called model space. A final layout of
specific views and annotations of this model is placed in paper space. (MSPACE)
multi-sheet DWF
A DWF file that contains multiple sheets.
named object
Describes the various types of nongraphical information, such as styles and definitions,
stored with an ZWCAD drawing. Named objects include linetypes, layers, dimension
styles, text styles, block definitions, layouts, views, and viewport configurations. Named
objects are stored in definition (symbol) tables.
named view
A view saved for restoration later. (VIEW)
node
An object snap specification to locate points, dimension definition points, and dimension
text origins.
normal
A vector that is perpendicular to a face.
noun-verb selection
Selecting an object first and then performing an operation on it rather than entering a
command first and then selecting the object.
NURBS
For nonuniform rational B-spline curve. A B-spline curve or surface defined by a series of
weighted control points and one or more knot vectors.
object
One or more graphical elements, such as text, dimensions, lines, circles, or polylines,
treated as a single element for creation, manipulation, and modification. Formerly called
entity.
Object Snap mode
Methods for selecting commonly needed points on an object while you create or edit a
drawing.
object snap override
Turning off or changing a running Object Snap mode for input of a single point.
OLE
For object linking and embedding. An information-sharing method in which data from a
source document can be linked to or embedded in a destination document. Selecting the
data in the destination document opens the source application so that the data can be
edited.
GLOSSARY
363
origin
The point where coordinate axes intersect. For example, the origin of a Cartesian
coordinate system is where the X, Y, and Z axes meet at 0,0,0.
orthogonal
Having perpendicular slopes or tangents at the point of intersection.
Ortho mode
A setting that limits pointing device input to horizontal or vertical (relative to the current
snap angle and the user coordinate system).
page setup
A collection of plot device and other settings that affect the appearance and format of the
final output. These settings can be modified and applied to other layouts.
pan
To shift the view of a drawing without changing magnification.(PAN)
paper space
One of two primary spaces in which ZWCAD objects reside. Paper space is used for
creating a finished layout for printing or plotting, as opposed to doing drafting or design
work. You design your paper space viewports using a layout tab. Model space is used for
creating the drawing. You design your model using the Model tab.(PSPACE)
PCP file
Partial plotter configuration file.Plot settings that are stored in a PCP file include pen
assignments, plotting units, paper size, plot rotation, plot origin, scale factor, and pen
optimization level.
perspective view
Objects in 3D seen by an observer positioned at the viewpoint looking at the view center.
Objects appear smaller when the distance from the observer (at the view point) to the view
center increases. Although a perspective view appears realistic, it does not preserve the
shapes of objects. Parallel lines seemingly converge in the view, so measurements
cannot be made to scale from perspective views. When you are looking at a viewport with
a perspective view, the UCS icon has a different appearance.
photorealistic rendering
Rendering that resembles a photograph.
pick button
The button on a pointing device that is used to select objects or specify points on the
screen. For example, on a two-button mouse, it is the left button.
planar projection
Mapping of objects or images onto a plane.
plan view
A view orientation from a point on the positive Z axis toward the origin (0,0,0). (PLAN)
PMP file
Plot Model Parameter. File containing custom plotter calibration and custom paper size
information associated with plotter configuration file.
point
1. A location in three-dimensional space specified by X, Y, and Z coordinate values. 2. A
ZWCAD object consisting of a single coordinate location. (POINT)
CHAPTER 16
364
pointer
A cursor on a video display screen that can be moved around to place textual or graphical
information.
polar array
Objects copied around a specified center point a specified number of times. (ARRAY)
Polar Snap
A precision drawing tool used to snap to incremental distances along the polar tracking
alignment path.
polar tracking
A precision drawing tool that displays temporary alignment paths defined by
user-specified polar angles.
polygon window selection
A multisided area specified to select objects in groups.
polyline
An object composed of one or more connected line segments or circular arcs treated as a
single object. Also called pline. (PLINE, PEDIT)
plot style
An object property that specifies a set of overrides for color, dithering, gray scale, pen
assignments, screening, linetype, lineweight, endstyles, joinstyles, and fill styles. Plot
styles are applied at plot time.
plot style table
A set of plot styles. Plot styles are defined in plot style tables and apply to objects only
when the plot style table is attached to a layout or viewport.
procedural materials
Materials that generate a 3D pattern in two or more colors, and apply it to an object. These
include marble, granite, and wood. Also called template materials.
prompt
A message on the command line that asks for information or requests action such as
specifying a point.
redraw
To quickly refresh or clean up blip marks in the current viewport without updating the
drawing's database.(REDRAW)
reference
A definition, known as an external reference or block reference, that is used and stored in
the drawing.(XREF)
reflection color
The color of a highlight on shiny material. Also called specular color.
reflection mapping
Creates the effect of a scene reflected on the surface of a shiny object.
regenerate
To update a drawing's screen display by recomputing the screen coordinates from the
database. (REGEN)
relative coordinates
Coordinates specified in relation to previous coordinates.
GLOSSARY
365
return button
The button on a pointing device used to accept an entry. For example, on a two-button
mouse, it is the right button.
RGB
For red, green, and blue. A system of defining colors by specifying percentages of red,
green, and blue.
rubber-band line
A line that stretches dynamically on the screen with the movement of the cursor. One
endpoint of the line is attached to a point in your drawing, and the other is attached to the
moving cursor.
running object snap
Setting an Object Snap mode so it continues for subsequent selections.(OSNAP)
save back
To update the objects in the original reference (external or block reference) with changes
made to objects in a working set during in-place reference editing.
script file
A set of ZWCAD commands executed sequentially with a single SCRIPT command.
Script files are created outside ZWCAD using a text editor, saved in text format, and
stored in an external file with the file extension .scr.
selection set
One or more selected objects that a command can act upon at the same time.
ShapeManager
The technology used to produce 3D solids in ZWCAD.
shortcut keys
Keys and key combinations that start commands; for example, CTRL+S saves a file. The
function keys (F1, F2, and so on) are also shortcut keys. Also known as accelerator keys.
shortcut menu
The menu displayed at your cursor location when you right-click your pointing device. The
shortcut menu and the options it provides depend on the pointer location and other
conditions, such as whether an object is selected or a command is in progress.
slide file
A file that contains a raster image or snapshot of the objects displayed in the drawing area.
Slide files have the file extension .sld. (MSLIDE, VSLIDE)
smooth shading
Smoothing of the edges between polygon faces.
snap angle
The angle that the snap grid is rotated.
snap grid
The invisible grid that locks the pointer into alignment with the grid points according to the
spacing set by Snap. Snap grid does not necessarily correspond to the visible grid, which
is controlled separately by GRID. (SNAP)
Snap mode
A mode for locking a pointing device into alignment with an invisible rectangular grid.
When Snap mode is on, the screen crosshairs and all input coordinates are snapped to

CHAPTER 16
366
the nearest point on the grid. The snap resolution defines the spacing of this grid.(SNAP)
snap resolution
The spacing between points of the snap grid.
specular reflection
The light in a narrow cone where the angle of the incoming beam equals the angle of the
reflected beam.
STB file
For plot style table file. Contains plot styles and their characteristics.
system variable
A name that ZWCAD recognizes as a mode, size, or limit. Read-only system variables,
such as DWGNAME, cannot be modified directly by the user.
template drawing
A drawing file with preestablished settings for new drawings such as zwcad.dwt and
zwcadiso.dwt; however, any drawing can be used as a template.
temporary files
Data files created during an ZWCAD session. ZWCAD deletes the files by the time you
end the session. If the session ends abnormally, such as during a power outage,
temporary files might be left on the disk.
text style
A named, saved collection of settings that determines the appearance of text
characters—for example, stretched, compressed, oblique, mirrored, or set in a vertical
column.
texture map
The projection of an image (such as a tile pattern) onto an object (such as a chair).
thaw
A setting that displays previously frozen layers.(LAYER)
thickness
The distance certain objects are extruded to give them a 3D appearance. (PROPERTIES,
CHPROP, ELEV, THICKNESS)
TILEMODE
A system variable that controls whether viewports can be created as movable, resizable
objects (layout viewports), or as nonoverlapping display elements that appear
side-by-side (model viewports).
toolbar
Part of the ZWCAD interface containing icons that represent commands.
tracking
A way to locate a point relative to other points on the drawing.
transparent command
A command started while another is in progress. Precede transparent commands with an
apostrophe.
UCS icon
An icon that indicates the orientation of the UCS axes. (UCSICON)
user coordinate system (UCS)
A user-defined coordinate system that defines the orientation of the X, Y, and Z axes in
GLOSSARY
367
3D space. The UCS determines the default placement of geometry in a drawing.
vector
A mathematical object with precise direction and length but without specific location.
vertex
A location where edges or polyline segments meet.
view
A graphical representation of a model from a specific location (viewpoint) in
space.(VPOINT, DVIEW, VIEW)
viewpoint
The location in 3D model space from which you are viewing a model.(DVIEW, VPOINT)
viewport
A bounded area that displays some portion of the model space of a drawing. The
TILEMODE system variable determines the type of viewport created. 1. When TILEMODE
is off (0), viewports are objects that can be moved and resized on a layout. (MVIEW) 2.
When TILEMODE is on (1), the entire drawing area is divided into nonoverlapping model
viewports.(VPORTS)
viewport configuration
A named collection of model viewports that can be saved and restored. (VPORTS)
window selection
A rectangular area specified in the drawing area to select multiple objects at the same
time.
wipeout object
A polygonal area that masks underlying objects with the current background color. This
area is bounded by the wipeout frame, which you can turn on for editing and turn off for
plotting.
wireframe model
The representation of an object using lines and curves to represent its boundaries.
working drawing
A drawing for manufacturing or building purposes.
working set
A group of objects selected for in-place reference editing.
world coordinates
Coordinates expressed in relation to the world coordinate system (WCS).
world coordinate system (WCS)
A coordinate system used as the basis for defining all objects and other coordinate
systems.
zoom
To reduce or increase the apparent magnification of the drawing area. (ZOOM)


