88
User’s manual FLIR ETS3xx series
User’s manualFLIR ETS3xx series


User’s manualFLIR ETS3xx series
#T810252; r. AD/43675/43696; en-US iii

Table of contents
1 Disclaimers ......................................................................................11.1 Legal disclaimer .......................................................................11.2 Usage statistics ........................................................................11.3 Changes to registry ...................................................................11.4 U.S. Government Regulations......................................................11.5 Copyright ................................................................................11.6 Quality assurance .....................................................................11.7 Patents ...................................................................................11.8 EULATerms ............................................................................11.9 EULATerms ............................................................................1
2 Safety information .............................................................................23 Notice to user ...................................................................................4
3.1 User-to-user forums ..................................................................43.2 Calibration...............................................................................43.3 Accuracy ................................................................................43.4 Disposal of electronic waste ........................................................43.5 Training ..................................................................................43.6 Documentation updates .............................................................43.7 Important note about this manual..................................................43.8 Note about authoritative versions..................................................5
4 Customer help ..................................................................................64.1 General ..................................................................................64.2 Submitting a question ................................................................64.3 Downloads ..............................................................................6
5 Introduction......................................................................................85.1 General description ...................................................................85.2 Benefits ..................................................................................85.3 Key features ............................................................................8
6 Quick start guide ...............................................................................96.1 Procedure ...............................................................................9
7 Description..................................................................................... 107.1 View from the front .................................................................. 10
7.1.1 Figure........................................................................ 107.1.2 Explanation................................................................. 10
7.2 View from the rear................................................................... 117.2.1 Figure........................................................................ 117.2.2 Explanation................................................................. 11
7.3 USB connector....................................................................... 117.4 Screen elements .................................................................... 12
7.4.1 Figure........................................................................ 127.4.2 Explanation................................................................. 12
8 Handling the camera unit.................................................................. 138.1 Charging the battery ................................................................ 13
8.1.1 Charging the battery using the FLIR power supply ............... 138.1.2 Charging the battery using a USB cable connected to a
computer.................................................................... 138.2 Turning on and turning off the camera.......................................... 138.3 Adjusting the position of the camera unit ...................................... 14
8.3.1 Figure........................................................................ 148.3.2 Explanation................................................................. 148.3.3 Procedure .................................................................. 14
8.4 Removing the stand mount from the camera unit............................ 148.4.1 Procedure .................................................................. 15
#T810252; r. AD/43675/43696; en-US v
Table of contents
9 Operation ....................................................................................... 169.1 Saving an image..................................................................... 16
9.1.1 General...................................................................... 169.1.2 Image capacity ............................................................ 169.1.3 Naming convention....................................................... 169.1.4 Procedure .................................................................. 16
9.2 Recalling an image.................................................................. 169.2.1 General...................................................................... 169.2.2 Procedure .................................................................. 16
9.3 Deleting an image ................................................................... 169.3.1 General...................................................................... 169.3.2 Procedure .................................................................. 16
9.4 Deleting all images.................................................................. 179.4.1 General...................................................................... 179.4.2 Procedure .................................................................. 17
9.5 Measuring a temperature using a spotmeter ................................. 179.5.1 General...................................................................... 179.5.2 Procedure .................................................................. 17
9.6 Measuring the hottest temperature within an area .......................... 179.6.1 General...................................................................... 179.6.2 Procedure .................................................................. 17
9.7 Measuring the coldest temperature within an area.......................... 179.7.1 General...................................................................... 179.7.2 Procedure .................................................................. 18
9.8 Hiding measurement tools ........................................................ 189.8.1 Procedure .................................................................. 18
9.9 Changing the color palette ........................................................ 189.9.1 General...................................................................... 189.9.2 Procedure .................................................................. 18
9.10 Working with color alarms ......................................................... 189.10.1 General...................................................................... 189.10.2 Image examples .......................................................... 189.10.3 Procedure .................................................................. 19
9.11 Changing the temperature scale mode ........................................ 199.11.1 General...................................................................... 199.11.2 When to useManual mode............................................. 199.11.3 Procedure .................................................................. 20
9.12 Setting the emissivity as a surface property .................................. 209.12.1 General...................................................................... 209.12.2 Procedure .................................................................. 20
9.13 Setting the emissivity as a custom material ................................... 219.13.1 General...................................................................... 219.13.2 Procedure .................................................................. 21
9.14 Changing the emissivity as a custom value ................................... 219.14.1 General...................................................................... 219.14.2 Procedure .................................................................. 21
9.15 Changing the reflected apparent temperature ............................... 219.15.1 General...................................................................... 219.15.2 Procedure .................................................................. 22
9.16 Performing a non-uniformity correction (NUC) ............................... 229.16.1 General...................................................................... 229.16.2 Procedure .................................................................. 22
9.17 Changing the settings .............................................................. 229.17.1 General...................................................................... 229.17.2 Procedure .................................................................. 23
#T810252; r. AD/43675/43696; en-US vi
Table of contents
9.18 Updating the camera ............................................................... 239.18.1 General...................................................................... 239.18.2 Procedure .................................................................. 23
10 Technical data................................................................................. 2410.1 Online field-of-view calculator .................................................... 2410.2 Note about technical data ......................................................... 2410.3 Note about authoritative versions................................................ 2410.4 FLIR ETS320 ......................................................................... 25
11 Mechanical drawings ....................................................................... 2812 Cleaning the camera ........................................................................ 33
12.1 Camera housing, cables, and other items..................................... 3312.1.1 Liquids....................................................................... 3312.1.2 Equipment .................................................................. 3312.1.3 Procedure .................................................................. 33
12.2 Infrared lens .......................................................................... 3312.2.1 Liquids....................................................................... 3312.2.2 Equipment .................................................................. 3312.2.3 Procedure .................................................................. 33
13 About FLIR Systems ........................................................................ 3413.1 More than just an infrared camera .............................................. 3513.2 Sharing our knowledge ............................................................ 3513.3 Supporting our customers......................................................... 36
14 Terms, laws, and definitions.............................................................. 3715 Thermographic measurement techniques .......................................... 39
15.1 Introduction .......................................................................... 3915.2 Emissivity.............................................................................. 39
15.2.1 Finding the emissivity of a sample.................................... 3915.3 Reflected apparent temperature................................................. 4315.4 Distance ............................................................................... 4315.5 Relative humidity .................................................................... 4315.6 Other parameters.................................................................... 43
16 The secret to a good thermal image ................................................... 4416.1 Introduction ........................................................................... 4416.2 Background........................................................................... 4416.3 A good image ........................................................................ 4416.4 The three unchangeables—the basis for a good image ................... 45
16.4.1 Focus ........................................................................ 4516.4.2 Temperature range ....................................................... 4616.4.3 Image detail and distance from the object .......................... 46
16.5 The changeables—image optimization and temperaturemeasurement......................................................................... 4716.5.1 Level and span ............................................................ 4716.5.2 Palettes and isotherms .................................................. 4816.5.3 Object parameters........................................................ 48
16.6 Taking images—practical tips .................................................... 4916.7 Conclusion ............................................................................ 49
17 About calibration............................................................................. 5017.1 Introduction ........................................................................... 5017.2 Definition—what is calibration? .................................................. 5017.3 Camera calibration at FLIR Systems ........................................... 5017.4 The differences between a calibration performed by a user and
that performed directly at FLIR Systems....................................... 5117.5 Calibration, verification and adjustment........................................ 5117.6 Non-uniformity correction.......................................................... 52
#T810252; r. AD/43675/43696; en-US vii
Table of contents
17.7 Thermal image adjustment (thermal tuning) .................................. 5218 History of infrared technology........................................................... 5319 Theory of thermography................................................................... 56
19.1 Introduction ........................................................................... 5619.2 The electromagnetic spectrum................................................... 5619.3 Blackbody radiation................................................................. 56
19.3.1 Planck’s law ................................................................ 5719.3.2 Wien’s displacement law................................................ 5819.3.3 Stefan-Boltzmann's law ................................................. 5919.3.4 Non-blackbody emitters................................................. 60
19.4 Infrared semi-transparent materials............................................. 6220 The measurement formula................................................................ 6321 Emissivity tables ............................................................................. 67
21.1 References............................................................................ 6721.2 Tables .................................................................................. 67
#T810252; r. AD/43675/43696; en-US viii
Disclaimers1
1.1 Legal disclaimerAll products manufactured by FLIR Systems are warranted against defectivematerials and workmanship for a period of one (1) year from the delivery dateof the original purchase, provided such products have been under normalstorage, use and service, and in accordance with FLIR Systems instruction.
Uncooled handheld infrared cameras manufactured by FLIR Systems arewarranted against defective materials and workmanship for a period of two(2) years from the delivery date of the original purchase, provided such prod-ucts have been under normal storage, use and service, and in accordancewith FLIR Systems instruction, and provided that the camera has been regis-tered within 60 days of original purchase.
Detectors for uncooled handheld infrared cameras manufactured by FLIRSystems are warranted against defective materials and workmanship for aperiod of ten (10) years from the delivery date of the original purchase, pro-vided such products have been under normal storage, use and service, andin accordance with FLIR Systems instruction, and provided that the camerahas been registered within 60 days of original purchase.
Products which are not manufactured by FLIR Systems but included in sys-tems delivered by FLIR Systems to the original purchaser, carry the warranty,if any, of the particular supplier only. FLIR Systems has no responsibilitywhatsoever for such products.
The warranty extends only to the original purchaser and is not transferable. Itis not applicable to any product which has been subjected to misuse, neglect,accident or abnormal conditions of operation. Expendable parts are excludedfrom the warranty.
In the case of a defect in a product covered by this warranty the product mustnot be further used in order to prevent additional damage. The purchasershall promptly report any defect to FLIR Systems or this warranty will notapply.
FLIR Systems will, at its option, repair or replace any such defective productfree of charge if, upon inspection, it proves to be defective in material or work-manship and provided that it is returned to FLIR Systems within the said one-year period.
FLIR Systems has no other obligation or liability for defects than those setforth above.
No other warranty is expressed or implied. FLIR Systems specifically dis-claims the implied warranties of merchantability and fitness for a particularpurpose.
FLIR Systems shall not be liable for any direct, indirect, special, incidental orconsequential loss or damage, whether based on contract, tort or any otherlegal theory.
This warranty shall be governed by Swedish law.
Any dispute, controversy or claim arising out of or in connection with this war-ranty, shall be finally settled by arbitration in accordance with the Rules of theArbitration Institute of the Stockholm Chamber of Commerce. The place of ar-bitration shall be Stockholm. The language to be used in the arbitral proceed-ings shall be English.
1.2 Usage statisticsFLIR Systems reserves the right to gather anonymous usage statistics to helpmaintain and improve the quality of our software and services.
1.3 Changes to registryThe registry entry HKEY_LOCAL_MACHINE\SYSTEM\CurrentControlSet\Control\Lsa\LmCompatibilityLevel will be automatically changed to level 2 ifthe FLIR Camera Monitor service detects a FLIR camera connected to thecomputer with a USB cable. The modification will only be executed if thecamera device implements a remote network service that supports networklogons.
1.4 U.S. Government RegulationsThis product may be subject to U.S. Export Regulations. Please send any in-quiries to [email protected].
1.5 Copyright© 2016, FLIR Systems, Inc. All rights reserved worldwide. No parts of thesoftware including source code may be reproduced, transmitted, transcribedor translated into any language or computer language in any form or by anymeans, electronic, magnetic, optical, manual or otherwise, without the priorwritten permission of FLIR Systems.
The documentation must not, in whole or part, be copied, photocopied, re-produced, translated or transmitted to any electronic medium or machinereadable form without prior consent, in writing, from FLIR Systems.
Names and marks appearing on the products herein are either registeredtrademarks or trademarks of FLIR Systems and/or its subsidiaries. All othertrademarks, trade names or company names referenced herein are used foridentification only and are the property of their respective owners.
1.6 Quality assuranceThe Quality Management System under which these products are developedand manufactured has been certified in accordance with the ISO 9001standard.
FLIR Systems is committed to a policy of continuous development; thereforewe reserve the right to make changes and improvements on any of the prod-ucts without prior notice.
1.7 Patents000439161; 000653423; 000726344; 000859020; 001707738; 001707746;001707787; 001776519; 001954074; 002021543; 002021543-0002;002058180; 002249953; 002531178; 002816785; 002816793; 011200326;014347553; 057692; 061609; 07002405; 100414275; 101796816;101796817; 101796818; 102334141; 1062100; 11063060001; 11517895;1226865; 12300216; 12300224; 1285345; 1299699; 1325808; 1336775;1391114; 1402918; 1404291; 1411581; 1415075; 1421497; 1458284;1678485; 1732314; 17399650; 1880950; 1886650; 2007301511414;2007303395047; 2008301285812; 2009301900619; 20100060357;2010301761271; 2010301761303; 2010301761572; 2010305959313;2011304423549; 2012304717443; 2012306207318; 2013302676195;2015202354035; 2015304259171; 204465713; 204967995; 2106017;2107799; 2115696; 2172004; 2315433; 2381417; 2794760001; 3006596;3006597; 303330211; 4358936; 483782; 484155; 4889913; 4937897;4995790001; 5177595; 540838; 579475; 584755; 599392; 60122153;6020040116815; 602006006500.0; 6020080347796; 6020110003453;615113; 615116; 664580; 664581; 665004; 665440; 67023029; 6707044;677298; 68657; 69036179; 70022216; 70028915; 70028923; 70057990;7034300; 710424; 7110035; 7154093; 7157705; 718801; 723605; 7237946;7312822; 7332716; 7336823; 734803; 7544944; 7606484; 7634157;7667198; 7809258; 7826736; 8018649; 8153971; 8212210; 8289372;8340414; 8354639; 8384783; 8520970; 8565547; 8595689; 8599262;8654239; 8680468; 8803093; 8823803; 8853631; 8933403; 9171361;9191583; 9279728; 9280812; 9338352; 9423940; 9471970; 9595087;D549758.
1.8 EULATerms• You have acquired a device (“INFRARED CAMERA”) that includes soft-
ware licensed by FLIR Systems AB from Microsoft Licensing, GP or itsaffiliates (“MS”). Those installed software products of MS origin, as wellas associated media, printed materials, and “online” or electronic docu-mentation (“SOFTWARE”) are protected by international intellectualproperty laws and treaties. The SOFTWARE is licensed, not sold. Allrights reserved.
• IF YOU DO NOTAGREE TO THIS END USER LICENSE AGREEMENT(“EULA”), DO NOT USE THE DEVICE OR COPY THE SOFTWARE. IN-STEAD, PROMPTLYCONTACT FLIR Systems AB FOR INSTRUC-TIONS ON RETURN OF THE UNUSED DEVICE(S) FOR A REFUND.ANY USE OF THE SOFTWARE, INCLUDING BUT NOT LIMITED TOUSE ON THE DEVICE, WILL CONSTITUTE YOUR AGREEMENT TOTHIS EULA (OR RATIFICATION OFANY PREVIOUS CONSENT).
• GRANTOF SOFTWARE LICENSE. This EULA grants you the followinglicense:
◦ You may use the SOFTWARE only on the DEVICE.◦ NOT FAULT TOLERANT. THE SOFTWARE IS NOT FAULT TOL-
ERANT. FLIR Systems AB HAS INDEPENDENTLY DETERMINEDHOW TO USE THE SOFTWARE IN THE DEVICE, AND MS HASRELIED UPON FLIR Systems AB TO CONDUCT SUFFICIENTTESTING TO DETERMINE THAT THE SOFTWARE IS SUITABLEFOR SUCH USE.
◦ NOWARRANTIES FOR THE SOFTWARE. THE SOFTWARE isprovided “AS IS” and with all faults. THE ENTIRE RISK AS TOSATISFACTORYQUALITY, PERFORMANCE, ACCURACY, ANDEFFORT (INCLUDING LACKOF NEGLIGENCE) IS WITH YOU.ALSO, THERE IS NOWARRANTYAGAINST INTERFERENCEWITH YOUR ENJOYMENTOF THE SOFTWARE OR AGAINSTINFRINGEMENT. IF YOU HAVE RECEIVED ANY WARRANTIESREGARDING THE DEVICE OR THE SOFTWARE, THOSE WAR-RANTIES DO NOTORIGINATE FROM, AND ARE NOT BINDINGON, MS.
◦ No Liability for Certain Damages. EXCEPTAS PROHIBITED BYLAW, MS SHALL HAVE NO LIABILITY FOR ANY INDIRECT,SPECIAL, CONSEQUENTIAL OR INCIDENTAL DAMAGESARISING FROM OR IN CONNECTIONWITH THE USE OR PER-FORMANCE OF THE SOFTWARE. THIS LIMITATION SHALLAPPLY EVEN IFANY REMEDY FAILS OF ITS ESSENTIAL PUR-POSE. IN NO EVENT SHALL MS BE LIABLE FOR ANYAMOUNT IN EXCESS OF U.S. TWO HUNDRED FIFTY DOL-LARS (U.S.$250.00).
◦ Limitations on Reverse Engineering, Decompilation, and Dis-assembly. You may not reverse engineer, decompile, or disas-semble the SOFTWARE, except and only to the extent that suchactivity is expressly permitted by applicable law notwithstandingthis limitation.
◦ SOFTWARE TRANSFER ALLOWED BUT WITH RESTRIC-TIONS. You may permanently transfer rights under this EULA onlyas part of a permanent sale or transfer of the Device, and only ifthe recipient agrees to this EULA. If the SOFTWARE is an upgrade,any transfer must also include all prior versions of the SOFTWARE.
◦ EXPORT RESTRICTIONS. You acknowledge that SOFTWARE issubject to U.S. export jurisdiction. You agree to comply with all ap-plicable international and national laws that apply to the SOFT-WARE, including the U.S. Export Administration Regulations, aswell as end-user, end-use and destination restrictions issued by U.S. and other governments. For additional information see http://www.microsoft.com/exporting/.
1.9 EULATermsQt4 Core and Qt4 GUI, Copyright ©2013 Nokia Corporation and FLIR Sys-tems AB. This Qt library is a free software; you can redistribute it and/or mod-ify it under the terms of the GNU Lesser General Public License as publishedby the Free Software Foundation; either version 2.1 of the License, or (at youroption) any later version. This library is distributed in the hope that it will beuseful, but WITHOUTANY WARRANTY; without even the implied warranty ofMERCHANTABILITYor FITNESS FOR A PARTICULAR PURPOSE. See theGNU Lesser General Public License, http://www.gnu.org/licenses/lgpl-2.1.html. The source code for the libraries Qt4 Core and Qt4 GUI may be re-quested from FLIR Systems AB.
#T810252; r. AD/43675/43696; en-US 1
Safety information2
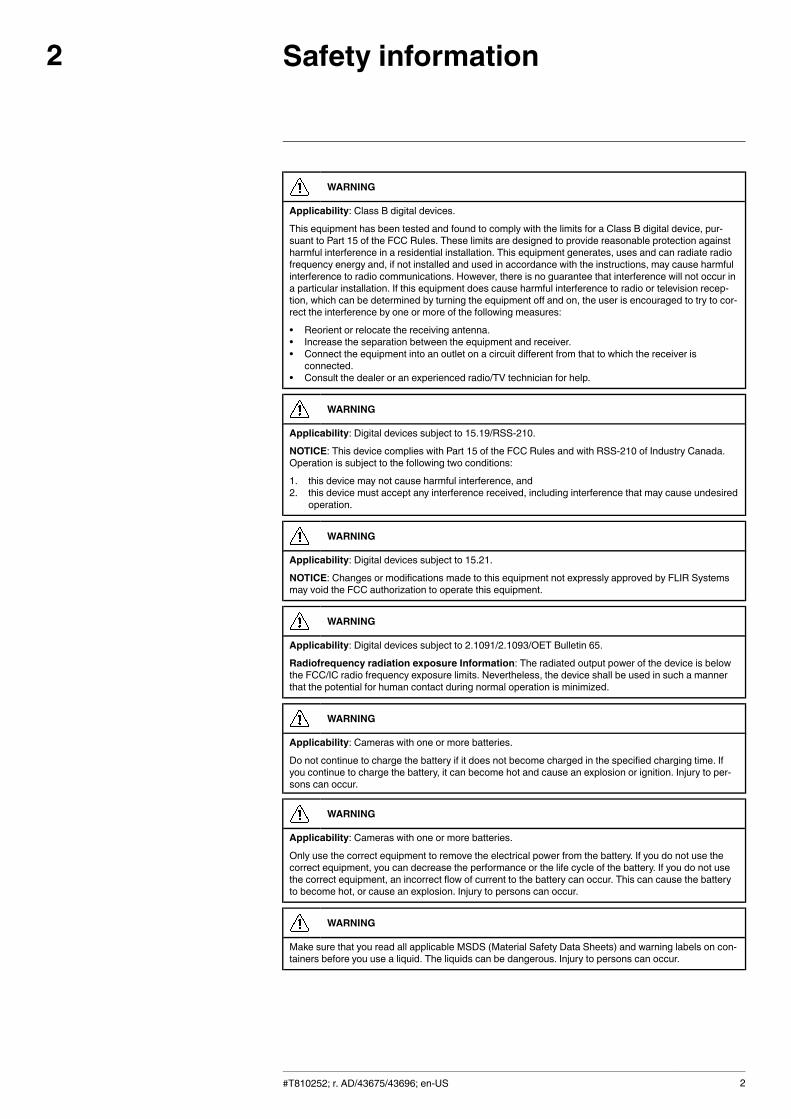
WARNING
Applicability: Class B digital devices.
This equipment has been tested and found to comply with the limits for a Class B digital device, pur-suant to Part 15 of the FCC Rules. These limits are designed to provide reasonable protection againstharmful interference in a residential installation. This equipment generates, uses and can radiate radiofrequency energy and, if not installed and used in accordance with the instructions, may cause harmfulinterference to radio communications. However, there is no guarantee that interference will not occur ina particular installation. If this equipment does cause harmful interference to radio or television recep-tion, which can be determined by turning the equipment off and on, the user is encouraged to try to cor-rect the interference by one or more of the following measures:
• Reorient or relocate the receiving antenna.• Increase the separation between the equipment and receiver.• Connect the equipment into an outlet on a circuit different from that to which the receiver is
connected.• Consult the dealer or an experienced radio/TV technician for help.
WARNING
Applicability: Digital devices subject to 15.19/RSS-210.
NOTICE: This device complies with Part 15 of the FCC Rules and with RSS-210 of Industry Canada.Operation is subject to the following two conditions:
1. this device may not cause harmful interference, and2. this device must accept any interference received, including interference that may cause undesired
operation.
WARNING
Applicability: Digital devices subject to 15.21.
NOTICE: Changes or modifications made to this equipment not expressly approved by FLIR Systemsmay void the FCC authorization to operate this equipment.
WARNING
Applicability: Digital devices subject to 2.1091/2.1093/OET Bulletin 65.
Radiofrequency radiation exposure Information: The radiated output power of the device is belowthe FCC/IC radio frequency exposure limits. Nevertheless, the device shall be used in such a mannerthat the potential for human contact during normal operation is minimized.
WARNING
Applicability: Cameras with one or more batteries.
Do not continue to charge the battery if it does not become charged in the specified charging time. Ifyou continue to charge the battery, it can become hot and cause an explosion or ignition. Injury to per-sons can occur.
WARNING
Applicability: Cameras with one or more batteries.
Only use the correct equipment to remove the electrical power from the battery. If you do not use thecorrect equipment, you can decrease the performance or the life cycle of the battery. If you do not usethe correct equipment, an incorrect flow of current to the battery can occur. This can cause the batteryto become hot, or cause an explosion. Injury to persons can occur.
WARNING
Make sure that you read all applicable MSDS (Material Safety Data Sheets) and warning labels on con-tainers before you use a liquid. The liquids can be dangerous. Injury to persons can occur.
#T810252; r. AD/43675/43696; en-US 2
Safety information2
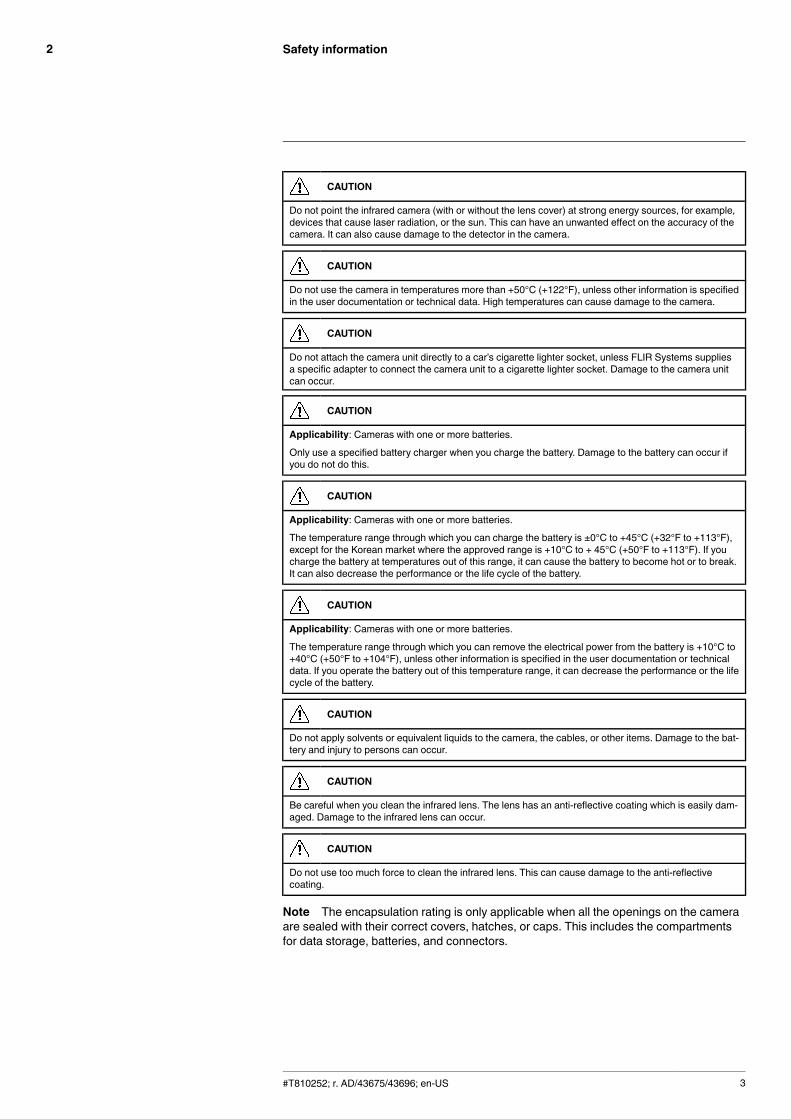
CAUTION
Do not point the infrared camera (with or without the lens cover) at strong energy sources, for example,devices that cause laser radiation, or the sun. This can have an unwanted effect on the accuracy of thecamera. It can also cause damage to the detector in the camera.
CAUTION
Do not use the camera in temperatures more than +50°C (+122°F), unless other information is specifiedin the user documentation or technical data. High temperatures can cause damage to the camera.
CAUTION
Do not attach the camera unit directly to a car’s cigarette lighter socket, unless FLIR Systems suppliesa specific adapter to connect the camera unit to a cigarette lighter socket. Damage to the camera unitcan occur.
CAUTION
Applicability: Cameras with one or more batteries.
Only use a specified battery charger when you charge the battery. Damage to the battery can occur ifyou do not do this.
CAUTION
Applicability: Cameras with one or more batteries.
The temperature range through which you can charge the battery is ±0°C to +45°C (+32°F to +113°F),except for the Korean market where the approved range is +10°C to + 45°C (+50°F to +113°F). If youcharge the battery at temperatures out of this range, it can cause the battery to become hot or to break.It can also decrease the performance or the life cycle of the battery.
CAUTION
Applicability: Cameras with one or more batteries.
The temperature range through which you can remove the electrical power from the battery is +10°C to+40°C (+50°F to +104°F), unless other information is specified in the user documentation or technicaldata. If you operate the battery out of this temperature range, it can decrease the performance or the lifecycle of the battery.
CAUTION
Do not apply solvents or equivalent liquids to the camera, the cables, or other items. Damage to the bat-tery and injury to persons can occur.
CAUTION
Be careful when you clean the infrared lens. The lens has an anti-reflective coating which is easily dam-aged. Damage to the infrared lens can occur.
CAUTION
Do not use too much force to clean the infrared lens. This can cause damage to the anti-reflectivecoating.
Note The encapsulation rating is only applicable when all the openings on the cameraare sealed with their correct covers, hatches, or caps. This includes the compartmentsfor data storage, batteries, and connectors.
#T810252; r. AD/43675/43696; en-US 3
Notice to user3
3.1 User-to-user forumsExchange ideas, problems, and infrared solutions with fellow thermographers around theworld in our user-to-user forums. To go to the forums, visit:
http://forum.infraredtraining.com/
3.2 CalibrationWe recommend that you send in the camera for calibration once a year. Contact your lo-cal sales office for instructions on where to send the camera.
3.3 AccuracyFor very accurate results, we recommend that you wait 5 minutes after you have startedthe camera before measuring a temperature.
3.4 Disposal of electronic waste
As with most electronic products, this equipment must be disposed of in an environmen-tally friendly way, and in accordance with existing regulations for electronic waste.
Please contact your FLIR Systems representative for more details.
3.5 TrainingTo read about infrared training, visit:
• http://www.infraredtraining.com• http://www.irtraining.com• http://www.irtraining.eu
3.6 Documentation updatesOur manuals are updated several times per year, and we also issue product-critical notifi-cations of changes on a regular basis.
To access the latest manuals, translations of manuals, and notifications, go to the Down-load tab at:
http://support.flir.com
It only takes a few minutes to register online. In the download area you will also find thelatest releases of manuals for our other products, as well as manuals for our historicaland obsolete products.
3.7 Important note about this manualFLIR Systems issues generic manuals that cover several cameras within a model line.
#T810252; r. AD/43675/43696; en-US 4

Notice to user3
This means that this manual may contain descriptions and explanations that do not applyto your particular camera model.
3.8 Note about authoritative versionsThe authoritative version of this publication is English. In the event of divergences due totranslation errors, the English text has precedence.
Any late changes are first implemented in English.
#T810252; r. AD/43675/43696; en-US 5
Customer help4
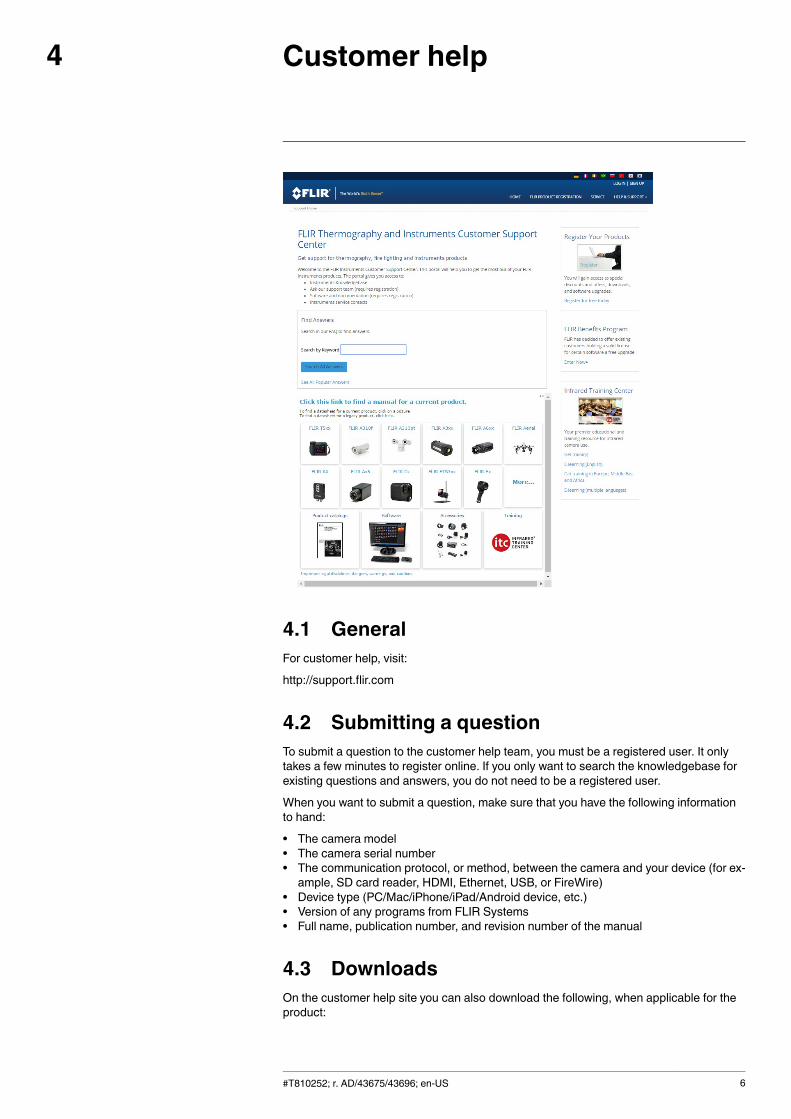
4.1 GeneralFor customer help, visit:
http://support.flir.com
4.2 Submitting a questionTo submit a question to the customer help team, you must be a registered user. It onlytakes a few minutes to register online. If you only want to search the knowledgebase forexisting questions and answers, you do not need to be a registered user.
When you want to submit a question, make sure that you have the following informationto hand:
• The camera model• The camera serial number• The communication protocol, or method, between the camera and your device (for ex-ample, SD card reader, HDMI, Ethernet, USB, or FireWire)
• Device type (PC/Mac/iPhone/iPad/Android device, etc.)• Version of any programs from FLIR Systems• Full name, publication number, and revision number of the manual
4.3 DownloadsOn the customer help site you can also download the following, when applicable for theproduct:
#T810252; r. AD/43675/43696; en-US 6

Customer help4
• Firmware updates for your infrared camera.• Program updates for your PC/Mac software.• Freeware and evaluation versions of PC/Mac software.• User documentation for current, obsolete, and historical products.• Mechanical drawings (in *.dxf and *.pdf format).• Cad data models (in *.stp format).• Application stories.• Technical datasheets.• Product catalogs.
#T810252; r. AD/43675/43696; en-US 7
Introduction5
5.1 General descriptionThe FLIR ETS3xx is FLIR’s first electronic test bench camera, designed for a quick tem-perature check of PCB boards and electronic devices. The FLIR ETS3xx is sensitiveenough to detect subtle temperature difference with an accuracy of ±3°C (±5.4°F), soyou can quickly find hot spots and potential points of failure. The 320 × 240 pixel infrareddetector offers more than 76 000 points of temperature measurement, eliminating theguesswork of legacy measurement tools. Designed specifically for bench-top work, thebattery-powered FLIR ETS3xx connects to your PC for immediate analysis and sharingof thermal data.
5.2 Benefits• Reduces test times: Quickly identify hot spots, thermal gradients, and potential pointsof failure.
• Improves product design: Know where and when to add fans and heatsinks, and en-sure products are operating within specification for their maximum lifetime.
• Saves money: Improve rapid prototyping and reduce product development cycles.• Optimizes lab time: Battery powered and hands-free, and offers complete measure-ment and analysis in the camera.
5.3 Key features• >76 000 points of non-contact temperature measurement at the push of a button.• 320 × 240 pixel detector provides crisp thermal imagery.• Time versus temperature measurement with FLIR Tools+.• Small-component measurement, down to 170 µm per pixel spot size.• Lens offers a 45° thermal view of the target for the quick detection of hot spots.• Records radiometric imagery in standard JPEG format for easy sharing.• ±3% accuracy promotes quality assurance and factory acceptance of PCBs.• Quickly mounts on the supplied stand for immediate use.• Crisp 3 in. LCD display provides immediate thermal feedback.• World-class software provided for advanced measurement corrections/capabilities.
#T810252; r. AD/43675/43696; en-US 8
Quick start guide6
6.1 ProcedureFollow this procedure:
1. Charge the battery. You can do this in different ways:
• Charge the battery using the FLIR power supply.• Charge the battery using a USB cable connected to a computer.Note Charging the camera using a USB cable connected to a computer takesconsiderably longer than using the FLIR power supply or the FLIR stand-alonebattery charger.
2. Connect a ground cord to the ground stud on the ESD mat of the camera stand.3. Push the On/off button to turn on the camera.4. Adjust the position of the camera unit.5. Push the Save button to save an image.
(Optional steps)
6. Go to the following website to download FLIR Tools/Tools+1:
http://support.flir.com/tools7. Install FLIR Tools/Tools+ on your computer.8. Start FLIR Tools/Tools+.9. Connect the camera to your computer, using the USB cable.10. Import the images into FLIR Tools/Tools+.
#T810252; r. AD/43675/43696; en-US 9
1. For online documentation about FLIR Tools/Tools+, go to http://support.flir.com/resources/f22s/. FLIR Tools+ islicensed software.
Description7
7.1 View from the front7.1.1 Figure
7.1.2 Explanation
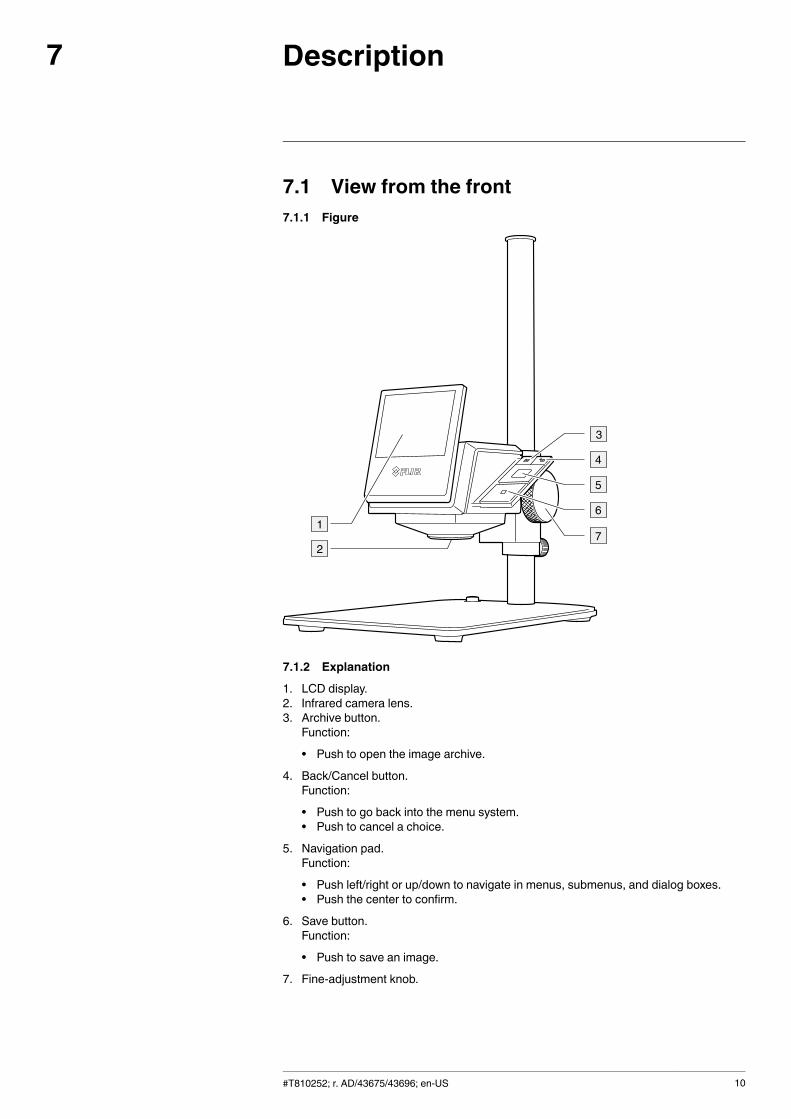
1. LCD display.2. Infrared camera lens.3. Archive button.
Function:
• Push to open the image archive.
4. Back/Cancel button.Function:
• Push to go back into the menu system.• Push to cancel a choice.
5. Navigation pad.Function:
• Push left/right or up/down to navigate in menus, submenus, and dialog boxes.• Push the center to confirm.
6. Save button.Function:
• Push to save an image.
7. Fine-adjustment knob.
#T810252; r. AD/43675/43696; en-US 10
Description7
7.2 View from the rear7.2.1 Figure
7.2.2 Explanation
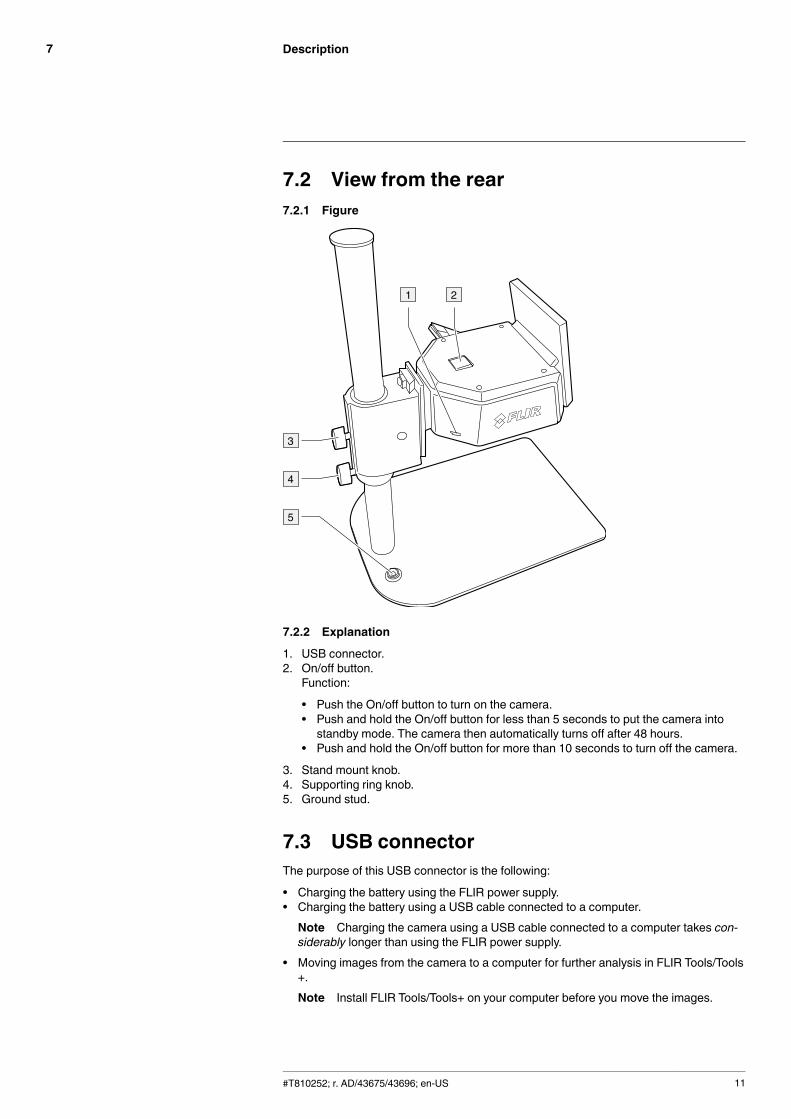
1. USB connector.2. On/off button.
Function:
• Push the On/off button to turn on the camera.• Push and hold the On/off button for less than 5 seconds to put the camera intostandby mode. The camera then automatically turns off after 48 hours.
• Push and hold the On/off button for more than 10 seconds to turn off the camera.
3. Stand mount knob.4. Supporting ring knob.5. Ground stud.
7.3 USB connectorThe purpose of this USB connector is the following:
• Charging the battery using the FLIR power supply.• Charging the battery using a USB cable connected to a computer.Note Charging the camera using a USB cable connected to a computer takes con-siderably longer than using the FLIR power supply.
• Moving images from the camera to a computer for further analysis in FLIR Tools/Tools+.Note Install FLIR Tools/Tools+ on your computer before you move the images.
#T810252; r. AD/43675/43696; en-US 11
Description7
7.4 Screen elements7.4.1 Figure
7.4.2 Explanation
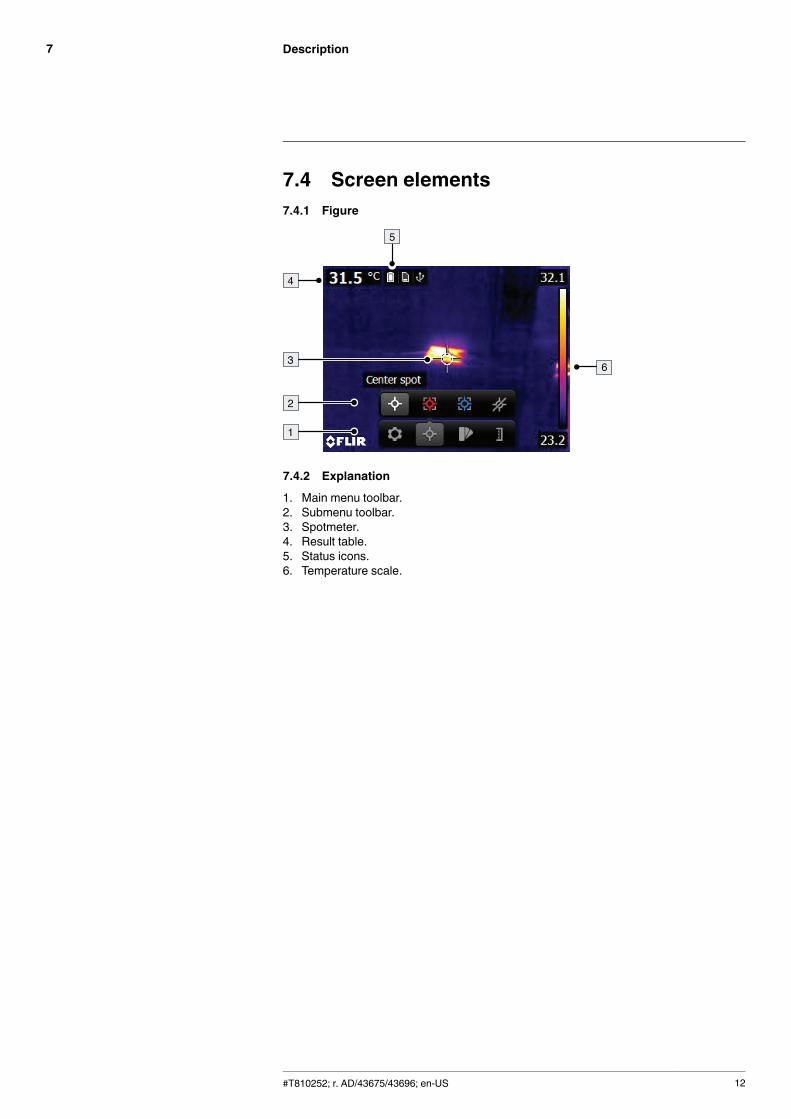
1. Main menu toolbar.2. Submenu toolbar.3. Spotmeter.4. Result table.5. Status icons.6. Temperature scale.
#T810252; r. AD/43675/43696; en-US 12
Handling the camera unit8
8.1 Charging the batteryWARNING
Make sure that you install the socket-outlet near the equipment and that it is easy to get access to.
8.1.1 Charging the battery using the FLIR power supply
Follow this procedure:
1. Connect the power supply to a mains socket.2. Connect the power supply cable to the USB connector on the camera unit.3. It is good practice to disconnect the power supply from the mains socket when the
battery is fully charged.
Note The charging time for a fully depleted battery is 2 hours.
8.1.2 Charging the battery using a USB cable connected to a computer
Follow this procedure:
1. Connect the camera unit to a computer using a USB cable.
Note
• To charge the camera, the computer must be turned on.• Charging the camera using a USB cable connected to a computer takes considerablylonger than using the FLIR power supply.
8.2 Turning on and turning off the camera• Push the On/off button to turn on the camera.• Push and hold the On/off button for less than 5 seconds to put the camera in standbymode. The camera then automatically turns off after 48 hours.
• Push and hold the On/off button for more than 10 seconds to turn off the camera.
#T810252; r. AD/43675/43696; en-US 13
Handling the camera unit8
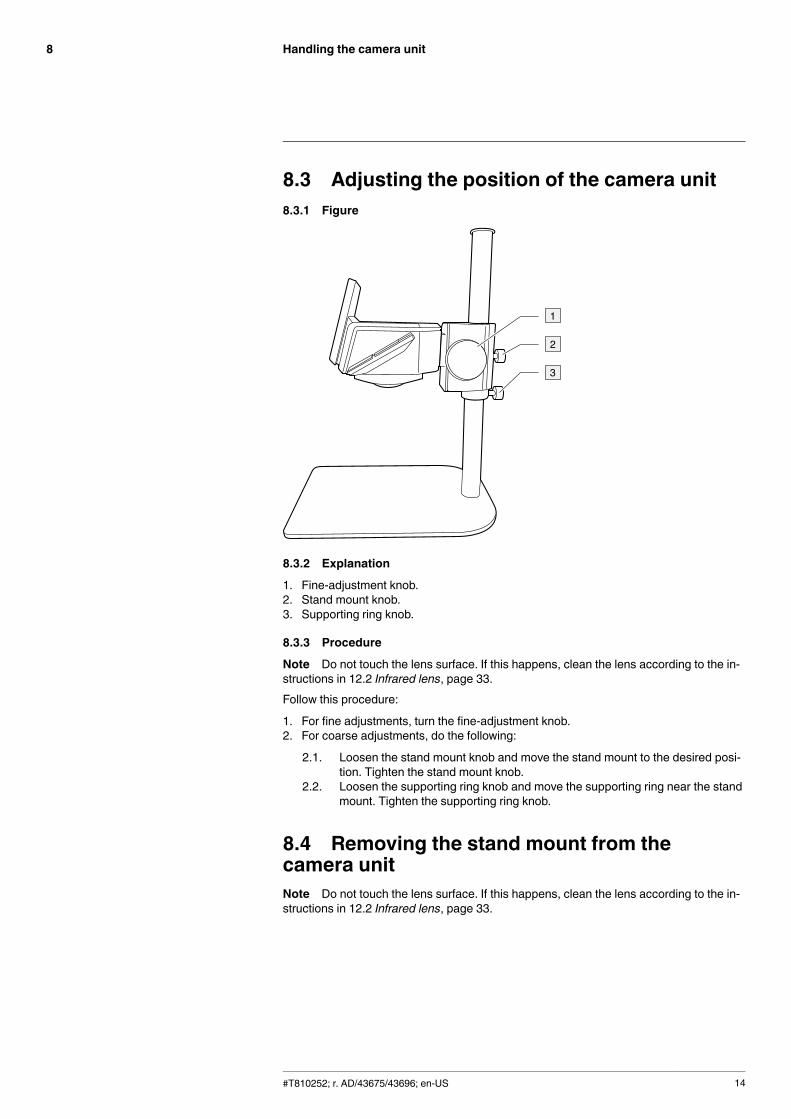
8.3 Adjusting the position of the camera unit8.3.1 Figure
8.3.2 Explanation
1. Fine-adjustment knob.2. Stand mount knob.3. Supporting ring knob.
8.3.3 Procedure
Note Do not touch the lens surface. If this happens, clean the lens according to the in-structions in 12.2 Infrared lens, page 33.Follow this procedure:
1. For fine adjustments, turn the fine-adjustment knob.2. For coarse adjustments, do the following:
2.1. Loosen the stand mount knob and move the stand mount to the desired posi-tion. Tighten the stand mount knob.
2.2. Loosen the supporting ring knob and move the supporting ring near the standmount. Tighten the supporting ring knob.
8.4 Removing the stand mount from thecamera unitNote Do not touch the lens surface. If this happens, clean the lens according to the in-structions in 12.2 Infrared lens, page 33.
#T810252; r. AD/43675/43696; en-US 14
Handling the camera unit8
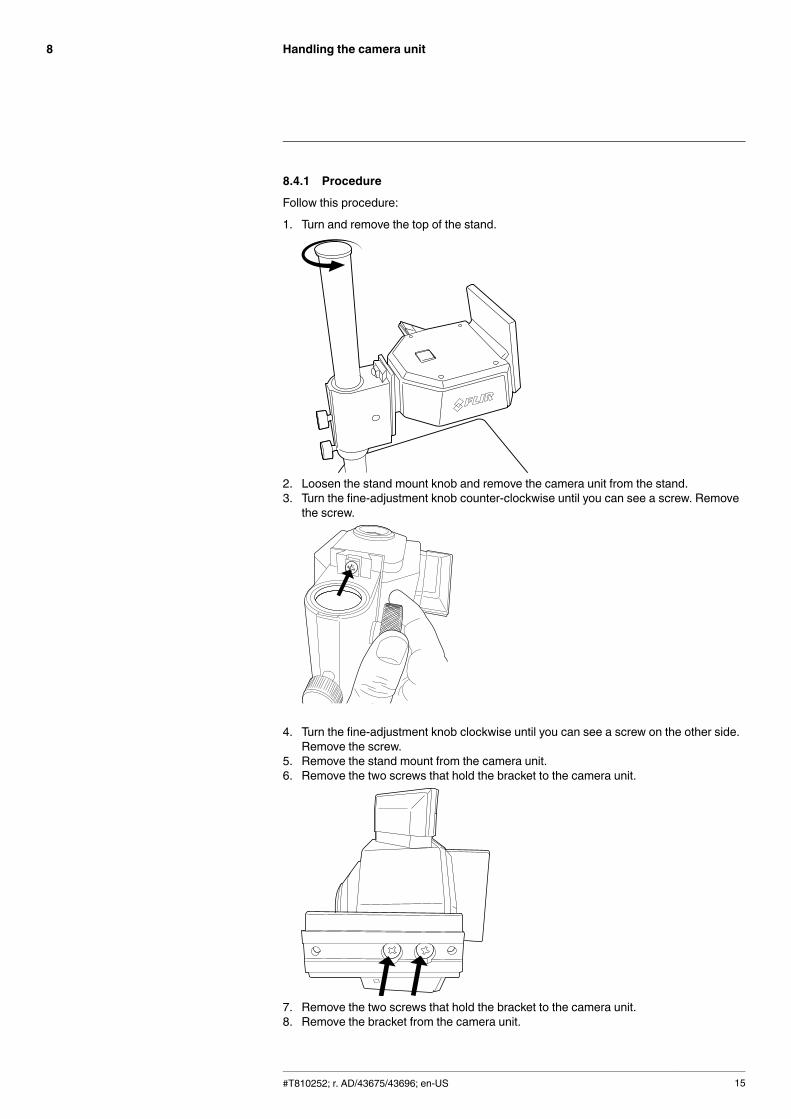
8.4.1 Procedure
Follow this procedure:
1. Turn and remove the top of the stand.
2. Loosen the stand mount knob and remove the camera unit from the stand.3. Turn the fine-adjustment knob counter-clockwise until you can see a screw. Remove
the screw.
4. Turn the fine-adjustment knob clockwise until you can see a screw on the other side.Remove the screw.
5. Remove the stand mount from the camera unit.6. Remove the two screws that hold the bracket to the camera unit.
7. Remove the two screws that hold the bracket to the camera unit.8. Remove the bracket from the camera unit.
#T810252; r. AD/43675/43696; en-US 15
Operation9
9.1 Saving an image9.1.1 General
You can save multiple images to the internal camera memory.
9.1.2 Image capacity
Approximately 1500 images can be saved to the internal camera memory.
9.1.3 Naming convention
The naming convention for images is FLIRxxxx.jpg, where xxxx is a unique counter.
9.1.4 Procedure
Follow this procedure:
1. To save an image, push the Save button.
9.2 Recalling an image9.2.1 General
When you save an image, it is stored in the internal camera memory. To display the im-age again, you can recall it from the internal camera memory.
9.2.2 Procedure
Follow this procedure:
1. Push the Archive button.2. Push the navigation pad left/right or up/down to select the image you want to view.3. Push the center of the navigation pad. This displays the selected image.4. Do one or more of the following:
• To view the image in full screen, display image information, or delete the image,push the center of the navigation pad. This displays a toolbar.
• To view the previous/next image, push the navigation pad left/right.
5. To return to live mode, push the Back button repeatedly or push the Archive button.
9.3 Deleting an image9.3.1 General
You can delete one or more images from the internal camera memory.
9.3.2 Procedure
Follow this procedure:
1. Push the Archive button.2. Push the navigation pad left/right or up/down to select the image you want to delete.3. Push the center of the navigation pad. This displays the selected image.4. Push the center of the navigation pad. This displays a toolbar.5. On the toolbar, select Delete . This displays a dialog box where you can choose to
delete the image or to cancel the delete action.
#T810252; r. AD/43675/43696; en-US 16
Operation9
9.4 Deleting all images9.4.1 General
You can delete all images from the internal camera memory.
9.4.2 Procedure
Follow this procedure:
1. Push the center of the navigation pad. This displays a toolbar.2. On the toolbar, select Settings . This displays a dialog box.3. In the dialog box, select Device settings. This displays a dialog box.4. In the dialog box, select Reset options. This displays a dialog box.5. In the dialog box, select Delete all saved images. This displays a dialog box where
you can choose to permanently delete all the saved images or to cancel the deleteaction.
9.5 Measuring a temperature using aspotmeter9.5.1 General
You can measure a temperature using a spotmeter. This will display the temperature atthe position of the spotmeter on the screen.
9.5.2 Procedure
Follow this procedure:
1. Push the center of the navigation pad. This displays a toolbar.2. On the toolbar, selectMeasurement . This displays a toolbar.3. On the toolbar, select Center spot .
The temperature at the position of the spotmeter will now be displayed in the top leftcorner of the screen.
9.6 Measuring the hottest temperature withinan area9.6.1 General
You can measure the hottest temperature within an area. This displays a moving spot-meter that indicates the hottest temperature.
9.6.2 Procedure
Follow this procedure:
1. Push the center of the navigation pad. This displays a toolbar.2. On the toolbar, selectMeasurement . This displays a toolbar.3. On the toolbar, select Hot spot .
9.7 Measuring the coldest temperature withinan area9.7.1 General
You can measure the coldest temperature within an area. This displays a moving spot-meter that indicates the coldest temperature.
#T810252; r. AD/43675/43696; en-US 17

Operation9
9.7.2 Procedure
Follow this procedure:
1. Push the center of the navigation pad. This displays a toolbar.2. On the toolbar, selectMeasurement . This displays a toolbar.3. On the toolbar, select Cold spot .
9.8 Hiding measurement tools9.8.1 Procedure
Follow this procedure:
1. Push the center of the navigation pad. This displays a toolbar.2. On the toolbar, selectMeasurement . This displays a toolbar.3. On the toolbar, select No measurements .
9.9 Changing the color palette9.9.1 General
You can change the color palette that the camera uses to display different temperatures.A different palette can make it easier to analyze an image.
9.9.2 Procedure
Follow this procedure:
1. Push the center of the navigation pad. This displays a toolbar.2. On the toolbar, select Color . This displays a toolbar.3. On the toolbar, select a new color palette.
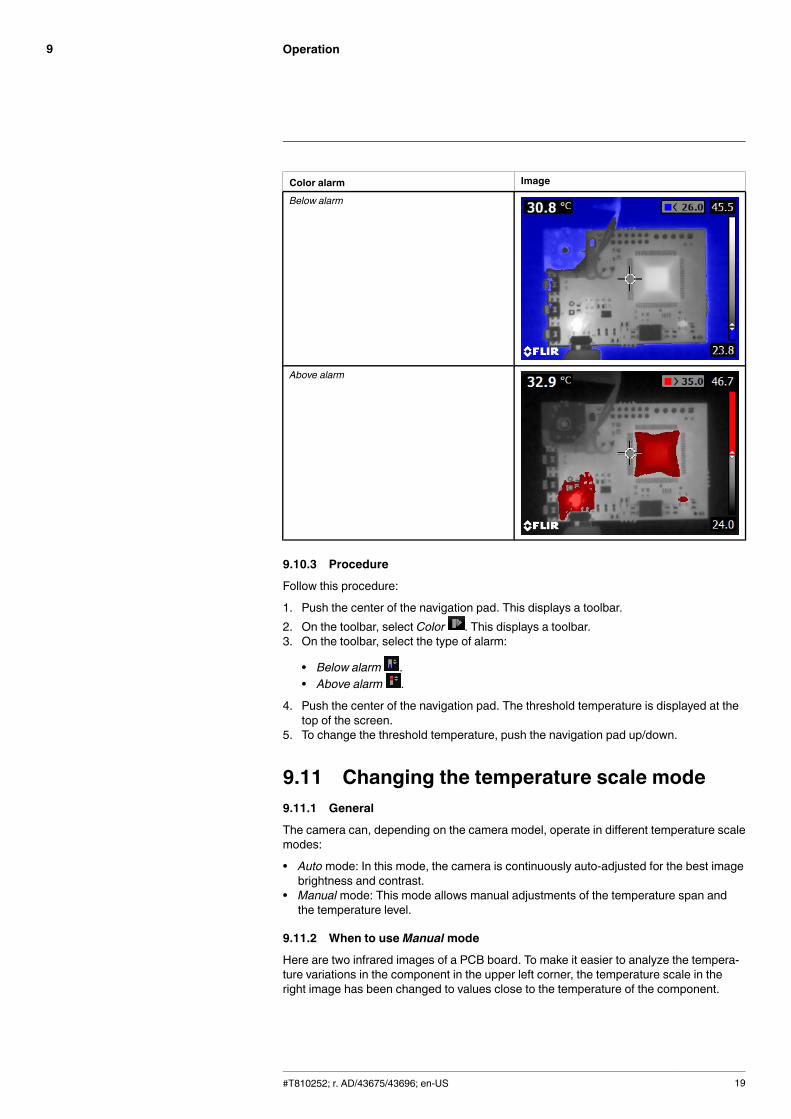
9.10 Working with color alarms9.10.1 General
By using color alarms (isotherms), anomalies can easily be discovered in an infrared im-age. The isotherm command applies a contrasting color to all pixels with a temperatureabove or below the specified temperature level.
9.10.2 Image examples
This table explains the different color alarms (isotherms).
#T810252; r. AD/43675/43696; en-US 18
Operation9
Color alarm Image
Below alarm
Above alarm
9.10.3 Procedure
Follow this procedure:
1. Push the center of the navigation pad. This displays a toolbar.2. On the toolbar, select Color . This displays a toolbar.3. On the toolbar, select the type of alarm:
• Below alarm .• Above alarm .
4. Push the center of the navigation pad. The threshold temperature is displayed at thetop of the screen.
5. To change the threshold temperature, push the navigation pad up/down.
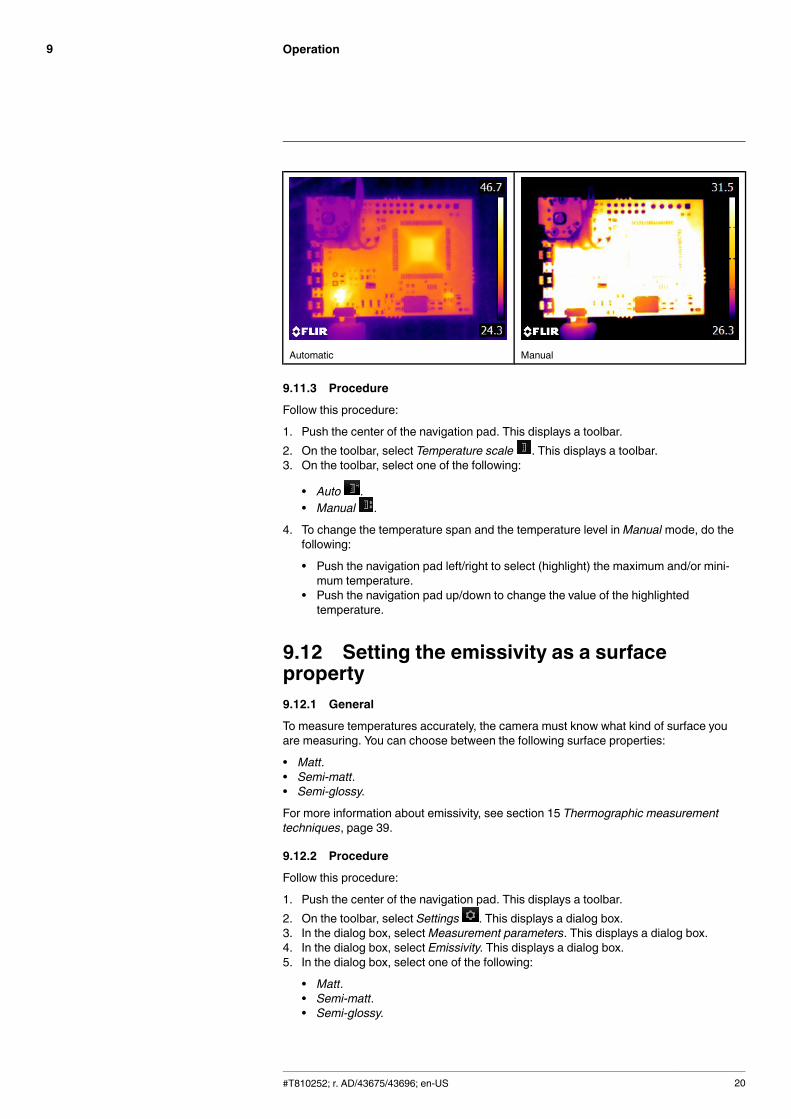
9.11 Changing the temperature scale mode9.11.1 General
The camera can, depending on the camera model, operate in different temperature scalemodes:
• Auto mode: In this mode, the camera is continuously auto-adjusted for the best imagebrightness and contrast.
• Manualmode: This mode allows manual adjustments of the temperature span andthe temperature level.
9.11.2 When to useManualmode
Here are two infrared images of a PCB board. To make it easier to analyze the tempera-ture variations in the component in the upper left corner, the temperature scale in theright image has been changed to values close to the temperature of the component.
#T810252; r. AD/43675/43696; en-US 19
Operation9
Automatic Manual
9.11.3 Procedure
Follow this procedure:
1. Push the center of the navigation pad. This displays a toolbar.2. On the toolbar, select Temperature scale . This displays a toolbar.3. On the toolbar, select one of the following:
• Auto .• Manual .
4. To change the temperature span and the temperature level inManual mode, do thefollowing:
• Push the navigation pad left/right to select (highlight) the maximum and/or mini-mum temperature.
• Push the navigation pad up/down to change the value of the highlightedtemperature.
9.12 Setting the emissivity as a surfaceproperty9.12.1 General
To measure temperatures accurately, the camera must know what kind of surface youare measuring. You can choose between the following surface properties:
• Matt.• Semi-matt.• Semi-glossy.
For more information about emissivity, see section 15 Thermographic measurementtechniques, page 39.
9.12.2 Procedure
Follow this procedure:
1. Push the center of the navigation pad. This displays a toolbar.2. On the toolbar, select Settings . This displays a dialog box.3. In the dialog box, selectMeasurement parameters. This displays a dialog box.4. In the dialog box, select Emissivity. This displays a dialog box.5. In the dialog box, select one of the following:
• Matt.• Semi-matt.• Semi-glossy.
#T810252; r. AD/43675/43696; en-US 20
Operation9
9.13 Setting the emissivity as a custommaterial9.13.1 General
Instead of specifying a surface property as matt, semi-matt or semi-glossy, you can spec-ify a custom material from a list of materials.
For more information about emissivity, see section 15 Thermographic measurementtechniques, page 39.
9.13.2 Procedure
Follow this procedure:
1. Push the center of the navigation pad. This displays a toolbar.2. On the toolbar, select Settings . This displays a dialog box.3. In the dialog box, selectMeasurement parameters. This displays a dialog box.4. In the dialog box, select Emissivity. This displays a dialog box.5. In the dialog box, select Custom material. This displays a list of materials with known
emissivities.6. In the list, select the material.
9.14 Changing the emissivity as a customvalue9.14.1 General
For very precise measurements, you may need to set the emissivity, instead of selectinga surface property or a custom material. You also need to understand how emissivity andreflectivity affect measurements, rather than just simply selecting a surface property.
Emissivity is a property that indicates how much radiation originates from an object asopposed to being reflected by it. A lower value indicates that a larger proportion is beingreflected, while a high value indicates that a lower proportion is being reflected.
Polished stainless steel, for example, has an emissivity of 0.14, while a structured PVCfloor typically has an emissivity of 0.93.
For more information about emissivity, see section 15 Thermographic measurementtechniques, page 39.
9.14.2 Procedure
Follow this procedure:
1. Push the center of the navigation pad. This displays a toolbar.2. On the toolbar, select Settings . This displays a dialog box.3. In the dialog box, selectMeasurement parameters. This displays a dialog box.4. In the dialog box, select Emissivity. This displays a dialog box.5. In the dialog box, select Custom value. This displays a dialog box where you can set
a custom value.
9.15 Changing the reflected apparenttemperature9.15.1 General
This parameter is used to compensate for the radiation reflected by the object. If theemissivity is low and the object temperature significantly different from that of the
#T810252; r. AD/43675/43696; en-US 21
Operation9
reflected temperature, it will be important to set and compensate for the reflected appa-rent temperature correctly.
For more information about reflected apparent temperature, see section 15 Thermo-graphic measurement techniques, page 39.
9.15.2 Procedure
Follow this procedure:
1. Push the center of the navigation pad. This displays a toolbar.2. On the toolbar, select Settings . This displays a dialog box.3. In the dialog box, selectMeasurement parameters. This displays a dialog box.4. In the dialog box, select Reflected apparent temperature. This displays a dialog box
where you can set a value.
9.16 Performing a non-uniformity correction(NUC)9.16.1 General
When the thermal camera displays Calibrating... it is performing what in thermography iscalled a ”non-uniformity correction” (NUC). An NUC is an image correction carried out bythe camera software to compensate for different sensitivities of detector elements andother optical and geometrical disturbances2. For more information, see section 17 Aboutcalibration, page 50.
An NUC is performed automatically, for example at start-up or when the environmenttemperature changes.
You can also perform an NUC manually. This is useful when you have to perform a criticalmeasurement with as little image disturbance as possible.
9.16.2 Procedure
Follow this procedure:
1. To perform a manual NUC, push and hold down the Archive button for more than 2seconds.
9.17 Changing the settings9.17.1 General
You can change a variety of settings for the camera.
The Settings menu includes the following:
• Measurement parameters.• Device settings.
9.17.1.1 Measurement parameters
• Emissivity: Default value: 0.95.• Reflected temperature: Default value: 20°C (69°F).• Distance: Default value: 1.0 m (3.3 ft.).
#T810252; r. AD/43675/43696; en-US 22
2. Definition from the European standard EN 16714-3:2016, Non-destructive Testing—Thermographic Testing—Part 3: Terms and Definitions.
Operation9
Note During normal operation there is typically no need to change the default meas-urement parameters. For very accurate measurements, you may need to set the Emissiv-ity and/or the Reflected temperature. For more information, see sections 9.12 Setting theemissivity as a surface property, 9.13 Setting the emissivity as a custom material, 9.14Changing the emissivity as a custom value, and 9.15 Changing the reflected apparenttemperature.
9.17.1.2 Device settings
• Language, time & units:
◦ Language.◦ Temperature unit.◦ Distance unit.◦ Date & time.◦ Date & time format.
• Reset options:
◦ Reset default camera mode.◦ Reset device settings to factory default.◦ Delete all saved images.
• Auto power off.• Display intensity.• Camera information: This menu command displays various items of information aboutthe camera, such as the model, serial number, and software version.
9.17.2 Procedure
Follow this procedure:
1. Push the center of the navigation pad. This displays a toolbar.2. On the toolbar, select Settings . This displays a dialog box.3. In the dialog box, select the setting that you want to change and use the navigation
pad to display additional dialog boxes.
9.18 Updating the camera9.18.1 General
To take advantage of our latest camera firmware, it is important that you keep your cam-era updated. You update your camera using FLIR Tools/Tools+.
9.18.2 Procedure
Follow this procedure:
1. Start FLIR Tools/Tools+.2. Start the camera.3. Connect the camera to the computer using the USB cable.4. On the Help menu in FLIR Tools/Tools+, click Check for updates.5. Follow the on-screen instructions.
#T810252; r. AD/43675/43696; en-US 23
Technical data10
10.1 Online field-of-view calculatorPlease visit http://support.flir.com and click the photo of the camera series for field-of-view tables for all lens–camera combinations.
10.2 Note about technical dataFLIR Systems reserves the right to change specifications at any time without prior notice.Please check http://support.flir.com for latest changes.
10.3 Note about authoritative versionsThe authoritative version of this publication is English. In the event of divergences due totranslation errors, the English text has precedence.
Any late changes are first implemented in English.
#T810252; r. AD/43675/43696; en-US 24
Technical data10
10.4 FLIR ETS320
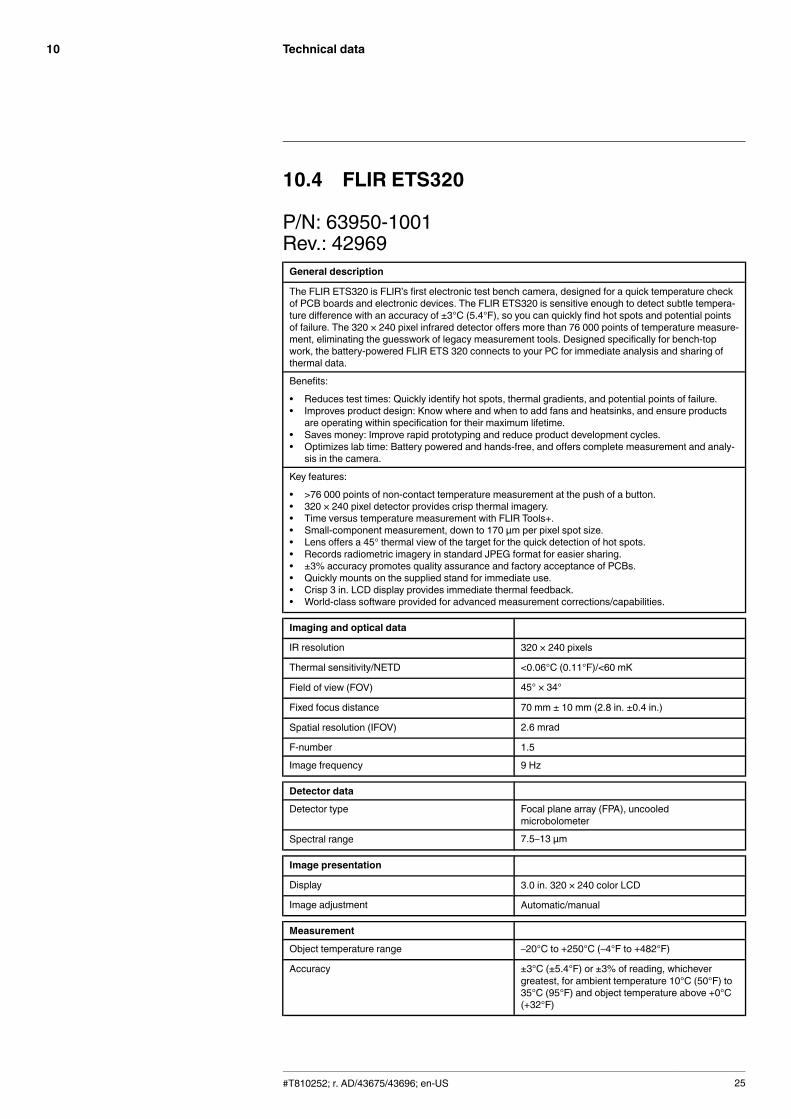
P/N: 63950-1001Rev.: 42969General description
The FLIR ETS320 is FLIR’s first electronic test bench camera, designed for a quick temperature checkof PCB boards and electronic devices. The FLIR ETS320 is sensitive enough to detect subtle tempera-ture difference with an accuracy of ±3°C (5.4°F), so you can quickly find hot spots and potential pointsof failure. The 320 × 240 pixel infrared detector offers more than 76 000 points of temperature measure-ment, eliminating the guesswork of legacy measurement tools. Designed specifically for bench-topwork, the battery-powered FLIR ETS 320 connects to your PC for immediate analysis and sharing ofthermal data.
Benefits:
• Reduces test times: Quickly identify hot spots, thermal gradients, and potential points of failure.• Improves product design: Know where and when to add fans and heatsinks, and ensure products
are operating within specification for their maximum lifetime.• Saves money: Improve rapid prototyping and reduce product development cycles.• Optimizes lab time: Battery powered and hands-free, and offers complete measurement and analy-
sis in the camera.
Key features:
• >76 000 points of non-contact temperature measurement at the push of a button.• 320 × 240 pixel detector provides crisp thermal imagery.• Time versus temperature measurement with FLIR Tools+.• Small-component measurement, down to 170 µm per pixel spot size.• Lens offers a 45° thermal view of the target for the quick detection of hot spots.• Records radiometric imagery in standard JPEG format for easier sharing.• ±3% accuracy promotes quality assurance and factory acceptance of PCBs.• Quickly mounts on the supplied stand for immediate use.• Crisp 3 in. LCD display provides immediate thermal feedback.• World-class software provided for advanced measurement corrections/capabilities.
Imaging and optical data
IR resolution 320 × 240 pixels
Thermal sensitivity/NETD <0.06°C (0.11°F)/<60 mK
Field of view (FOV) 45° × 34°
Fixed focus distance 70 mm ± 10 mm (2.8 in. ±0.4 in.)
Spatial resolution (IFOV) 2.6 mrad
F-number 1.5
Image frequency 9 Hz
Detector data
Detector type Focal plane array (FPA), uncooledmicrobolometer
Spectral range 7.5–13 µm
Image presentation
Display 3.0 in. 320 × 240 color LCD
Image adjustment Automatic/manual
Measurement
Object temperature range –20°C to +250°C (–4°F to +482°F)
Accuracy ±3°C (±5.4°F) or ±3% of reading, whichevergreatest, for ambient temperature 10°C (50°F) to35°C (95°F) and object temperature above +0°C(+32°F)
#T810252; r. AD/43675/43696; en-US 25
Technical data10
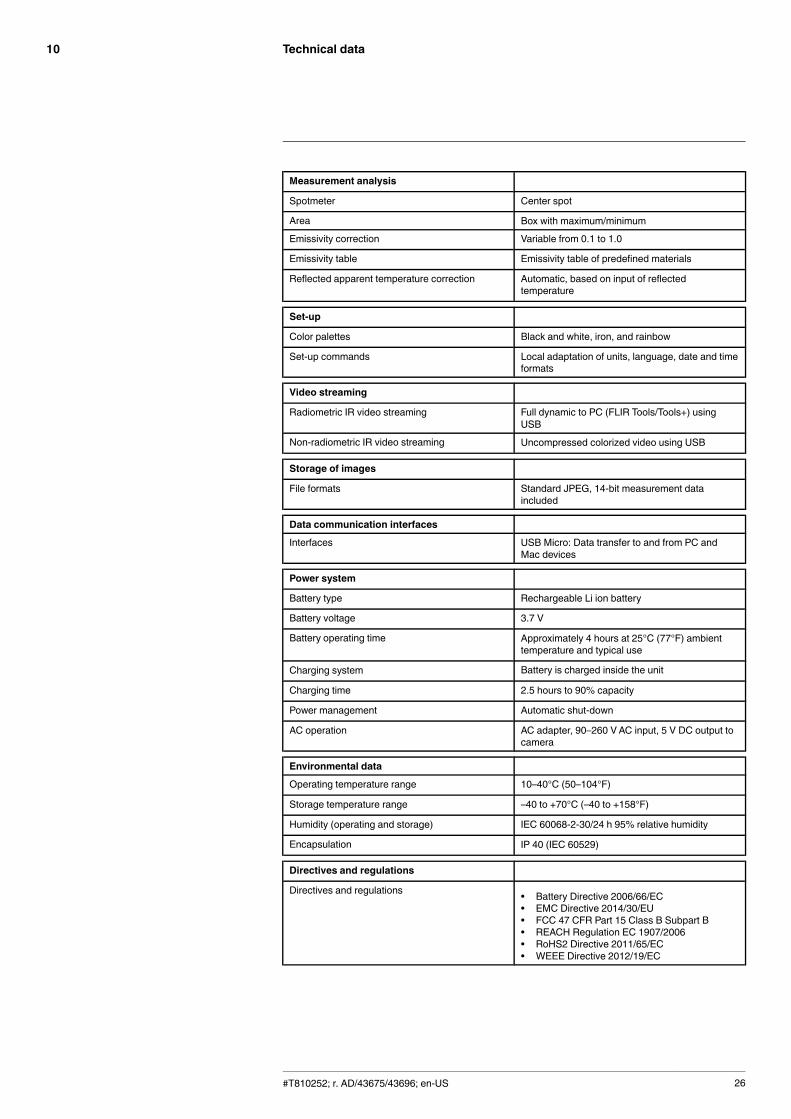
Measurement analysis
Spotmeter Center spot
Area Box with maximum/minimum
Emissivity correction Variable from 0.1 to 1.0
Emissivity table Emissivity table of predefined materials
Reflected apparent temperature correction Automatic, based on input of reflectedtemperature
Set-up
Color palettes Black and white, iron, and rainbow
Set-up commands Local adaptation of units, language, date and timeformats
Video streaming
Radiometric IR video streaming Full dynamic to PC (FLIR Tools/Tools+) usingUSB
Non-radiometric IR video streaming Uncompressed colorized video using USB
Storage of images
File formats Standard JPEG, 14-bit measurement dataincluded
Data communication interfaces
Interfaces USB Micro: Data transfer to and from PC andMac devices
Power system
Battery type Rechargeable Li ion battery
Battery voltage 3.7 V
Battery operating time Approximately 4 hours at 25°C (77°F) ambienttemperature and typical use
Charging system Battery is charged inside the unit
Charging time 2.5 hours to 90% capacity
Power management Automatic shut-down
AC operation AC adapter, 90–260 VAC input, 5 V DC output tocamera
Environmental data
Operating temperature range 10–40°C (50–104°F)
Storage temperature range –40 to +70°C (–40 to +158°F)
Humidity (operating and storage) IEC 60068-2-30/24 h 95% relative humidity
Encapsulation IP 40 (IEC 60529)
Directives and regulations
Directives and regulations • Battery Directive 2006/66/EC• EMC Directive 2014/30/EU• FCC 47 CFR Part 15 Class B Subpart B• REACH Regulation EC 1907/2006• RoHS2 Directive 2011/65/EC• WEEE Directive 2012/19/EC
#T810252; r. AD/43675/43696; en-US 26
Technical data10
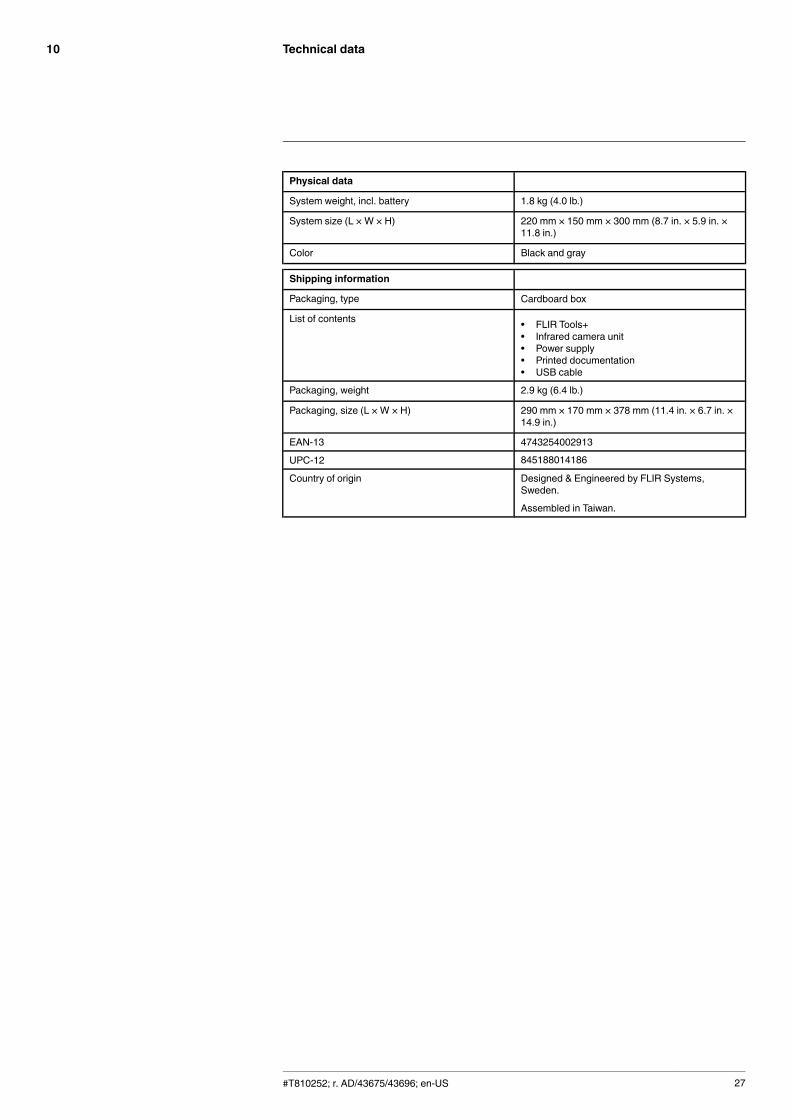
Physical data
System weight, incl. battery 1.8 kg (4.0 lb.)
System size (L × W × H) 220 mm × 150 mm × 300 mm (8.7 in. × 5.9 in. ×11.8 in.)
Color Black and gray
Shipping information
Packaging, type Cardboard box
List of contents • FLIR Tools+• Infrared camera unit• Power supply• Printed documentation• USB cable
Packaging, weight 2.9 kg (6.4 lb.)
Packaging, size (L × W × H) 290 mm × 170 mm × 378 mm (11.4 in. × 6.7 in. ×14.9 in.)
EAN-13 4743254002913
UPC-12 845188014186
Country of origin Designed & Engineered by FLIR Systems,Sweden.
Assembled in Taiwan.
#T810252; r. AD/43675/43696; en-US 27

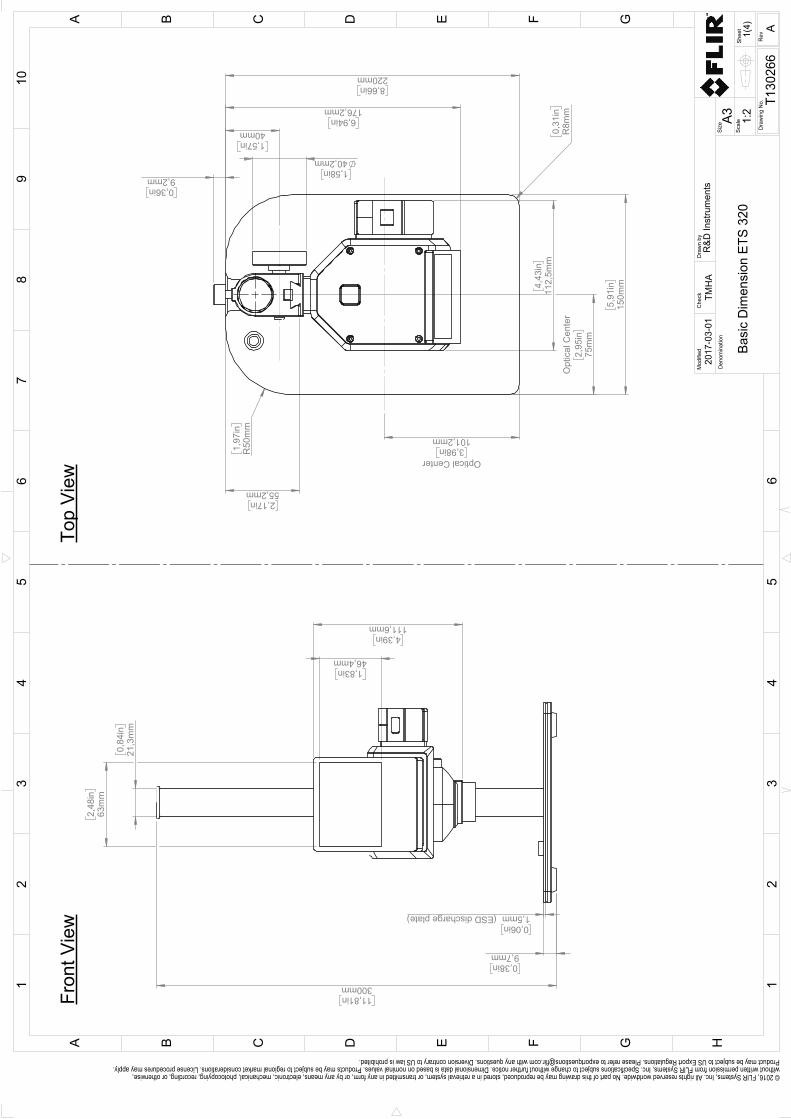
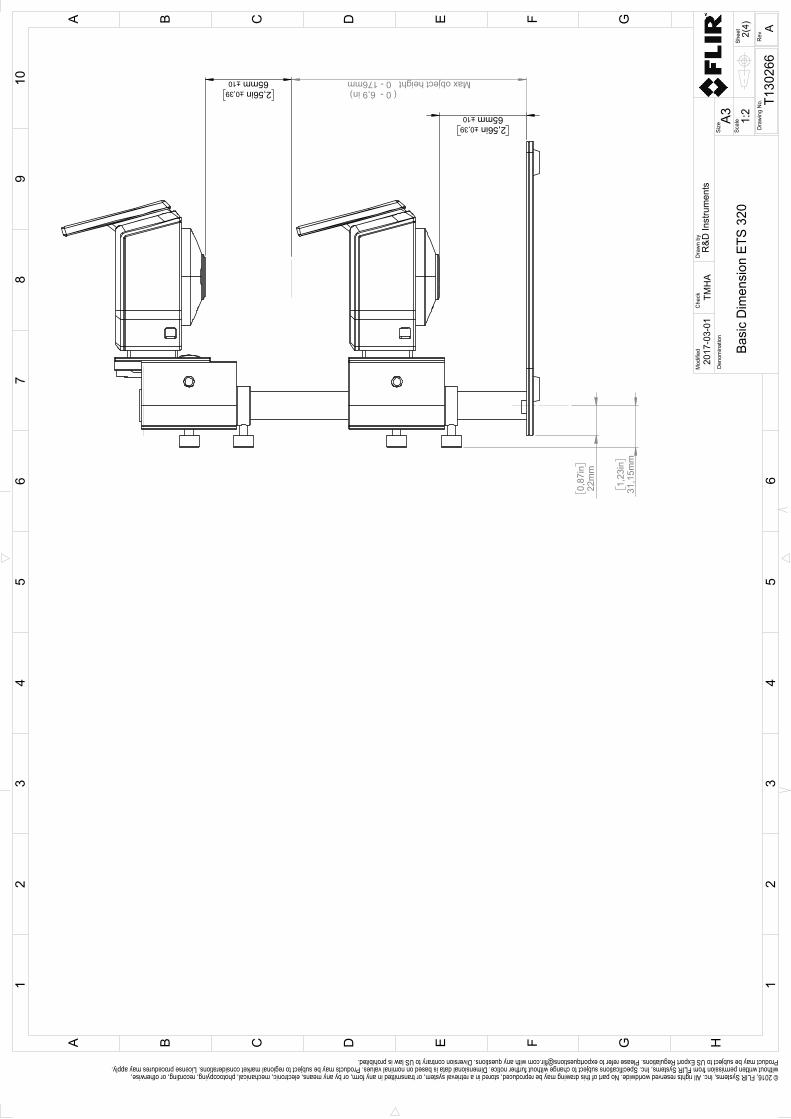
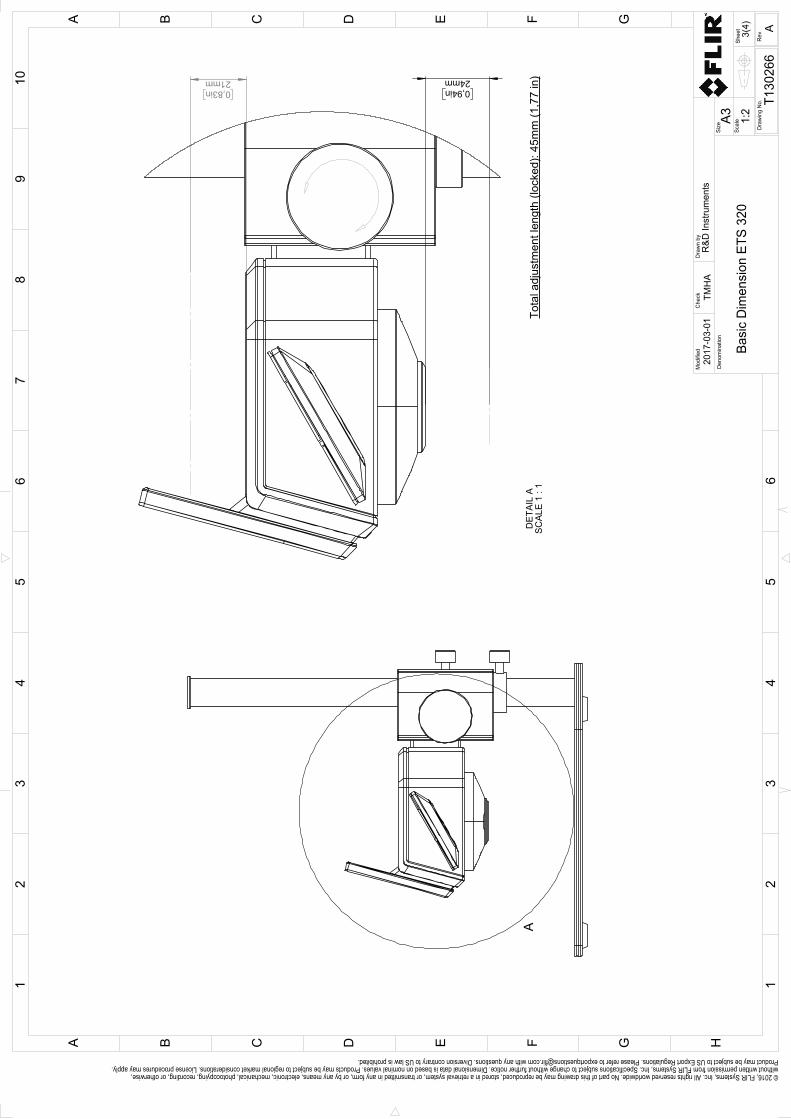
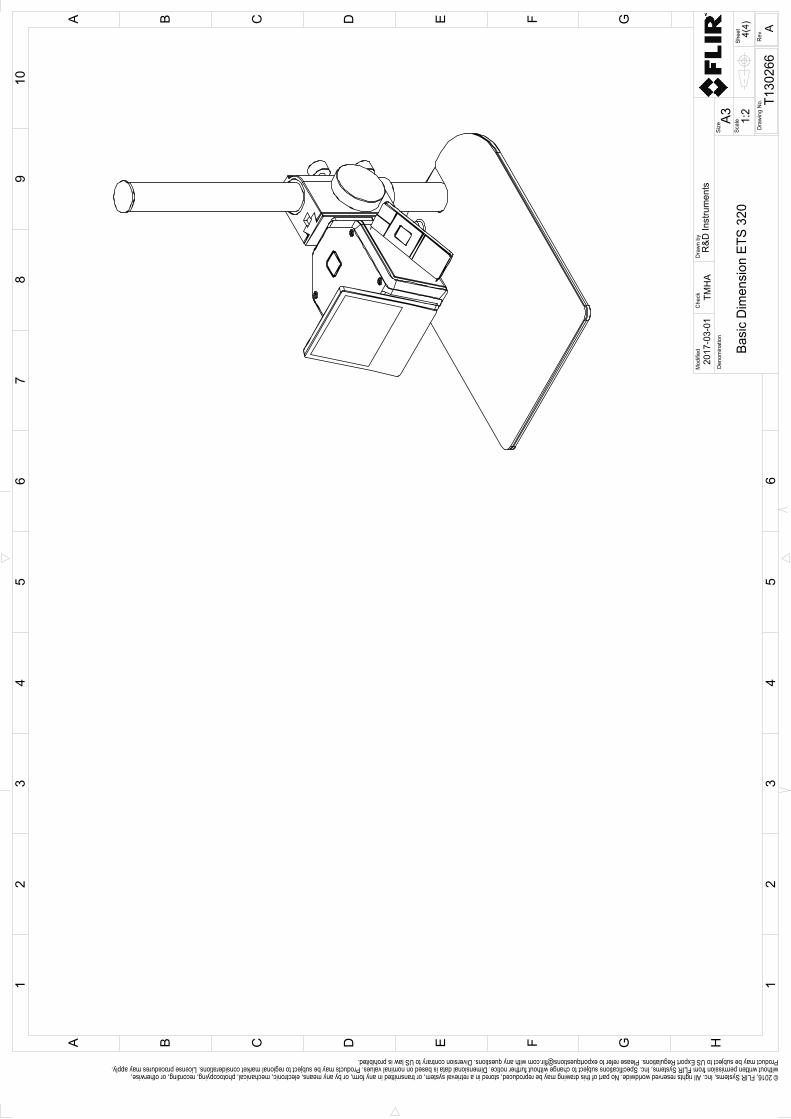
Mechanical drawings11
[See next page]
#T810252; r. AD/43675/43696; en-US 28
0,06in1,5mm (ESD discharge plate)
4,39in
111,6mm
11,81in300mm
0,38in9,7mm
1,83in
46,4mm
2,
48in
63m
m
0,
84in
21,3
mm
5,
91in
150m
m
8,66in
220mm
0,31
inR
8mm
1,97
inR
50m
m
4,
43in
112,
5mm
Opt
ical
Cen
ter
2,95
in75
mm
1,58in40,2mm
6,94in
176,2mm
2,17in
55,2mm
0,36in9,2mm
1,57in40mm
Optical Center3,98in
101,2mm
Fron
t Vie
wTo
p V
iew
Shee
t
Dra
win
g N
o.
Size
Che
ckD
raw
n by
Den
omin
atio
nA3
1(4)
T130
266
Basi
c D
imen
sion
ETS
320
TMH
A20
17-0
3-01
R&D
Inst
rum
ents
Mod
ified
12
34
56
78
910
A B C D E F G H
13
25
4
C FB D GEA
6R
ev
A
1:2
Scal
e
© 2016, FLIR Systems, Inc. All rights reserved worldwide. No part of this drawing may be reproduced, stored in a retrieval system, or transmitted in any form, or by any means, electronic, mechanical, photocopying, recording, or otherwise, without written permission from FLIR Systems, Inc. Specifications subject to change without further notice. Dimensional data is based on nominal values. Products may be subject to regional market considerations. License procedures may apply. Product may be subject to US Export Regulations. Please refer to [email protected] with any questions. Diversion contrary to US law is prohibited.
2,56in ±0,3965mm ±10
( 0 - 6,9 in)Max object height 0 - 176mm
0,
87in
22m
m
1,
23in
31,1
5mm
2,56in ±0,3965mm ±10
Shee
t
Dra
win
g N
o.
Size
Che
ckD
raw
n by
Den
omin
atio
nA3
2(4)
T130
266
Basi
c D
imen
sion
ETS
320
TMH
A20
17-0
3-01
R&D
Inst
rum
ents
Mod
ified
12
34
56
78
910
A B C D E F G H
13
25
4
C FB D GEA
6R
ev
A
1:2
Scal
e
© 2016, FLIR Systems, Inc. All rights reserved worldwide. No part of this drawing may be reproduced, stored in a retrieval system, or transmitted in any form, or by any means, electronic, mechanical, photocopying, recording, or otherwise, without written permission from FLIR Systems, Inc. Specifications subject to change without further notice. Dimensional data is based on nominal values. Products may be subject to regional market considerations. License procedures may apply. Product may be subject to US Export Regulations. Please refer to [email protected] with any questions. Diversion contrary to US law is prohibited.
A
0,94in24mm
0,83in21mm
DE
TAIL
AS
CA
LE 1
: 1
Tota
l adj
ustm
ent l
engt
h (lo
cked
): 45
mm
(1,7
7 in
)
Shee
t
Dra
win
g N
o.
Size
Che
ckD
raw
n by
Den
omin
atio
nA3
3(4)
T130
266
Basi
c D
imen
sion
ETS
320
TMH
A20
17-0
3-01
R&D
Inst
rum
ents
Mod
ified
12
34
56
78
910
A B C D E F G H
13
25
4
C FB D GEA
6R
ev
A
1:2
Scal
e
© 2016, FLIR Systems, Inc. All rights reserved worldwide. No part of this drawing may be reproduced, stored in a retrieval system, or transmitted in any form, or by any means, electronic, mechanical, photocopying, recording, or otherwise, without written permission from FLIR Systems, Inc. Specifications subject to change without further notice. Dimensional data is based on nominal values. Products may be subject to regional market considerations. License procedures may apply. Product may be subject to US Export Regulations. Please refer to [email protected] with any questions. Diversion contrary to US law is prohibited.
Shee
t
Dra
win
g N
o.
Size
Che
ckD
raw
n by
Den
omin
atio
nA3
4(4)
T130
266
Basi
c D
imen
sion
ETS
320
TMH
A20
17-0
3-01
R&D
Inst
rum
ents
Mod
ified
12
34
56
78
910
A B C D E F G H
13
25
4
C FB D GEA
6R
ev
A
1:2
Scal
e
© 2016, FLIR Systems, Inc. All rights reserved worldwide. No part of this drawing may be reproduced, stored in a retrieval system, or transmitted in any form, or by any means, electronic, mechanical, photocopying, recording, or otherwise, without written permission from FLIR Systems, Inc. Specifications subject to change without further notice. Dimensional data is based on nominal values. Products may be subject to regional market considerations. License procedures may apply. Product may be subject to US Export Regulations. Please refer to [email protected] with any questions. Diversion contrary to US law is prohibited.
Cleaning the camera12
12.1 Camera housing, cables, and other items12.1.1 Liquids
Use one of these liquids:
• Warm water• A weak detergent solution
12.1.2 Equipment
A soft cloth
12.1.3 Procedure
Follow this procedure:
1. Soak the cloth in the liquid.2. Twist the cloth to remove excess liquid.3. Clean the part with the cloth.
CAUTION
Do not apply solvents or similar liquids to the camera, the cables, or other items. This can causedamage.
12.2 Infrared lens12.2.1 Liquids
Use one of these liquids:
• A commercial lens cleaning liquid with more than 30% isopropyl alcohol.• 96% ethyl alcohol (C2H5OH).
12.2.2 Equipment
Cotton wool
CAUTION
If you use a lens cleaning cloth it must be dry. Do not use a lens cleaning cloth with the liquids that aregiven in section 12.2.1 above. These liquids can cause material on the lens cleaning cloth to becomeloose. This material can have an unwanted effect on the surface of the lens.
12.2.3 Procedure
Follow this procedure:
1. Soak the cotton wool in the liquid.2. Twist the cotton wool to remove excess liquid.3. Clean the lens one time only and discard the cotton wool.
WARNING
Make sure that you read all applicable MSDS (Material Safety Data Sheets) and warning labels on con-tainers before you use a liquid: the liquids can be dangerous.
CAUTION
• Be careful when you clean the infrared lens. The lens has a delicate anti-reflective coating.• Do not clean the infrared lens too vigorously. This can damage the anti-reflective coating.
#T810252; r. AD/43675/43696; en-US 33
About FLIR Systems13
FLIR Systems was established in 1978 to pioneer the development of high-performanceinfrared imaging systems, and is the world leader in the design, manufacture, and mar-keting of thermal imaging systems for a wide variety of commercial, industrial, and gov-ernment applications. Today, FLIR Systems embraces five major companies withoutstanding achievements in infrared technology since 1958—the Swedish AGEMA In-frared Systems (formerly AGA Infrared Systems), the three United States companies In-digo Systems, FSI, and Inframetrics, and the French company Cedip.
Since 2007, FLIR Systems has acquired several companies with world-leading expertisein sensor technologies:
• Extech Instruments (2007)• Ifara Tecnologías (2008)• Salvador Imaging (2009)• OmniTech Partners (2009)• Directed Perception (2009)• Raymarine (2010)• ICx Technologies (2010)• TackTick Marine Digital Instruments (2011)• Aerius Photonics (2011)• Lorex Technology (2012)• Traficon (2012)• MARSS (2013)• DigitalOptics micro-optics business (2013)• DVTEL (2015)• Point Grey Research (2016)• Prox Dynamics (2016)
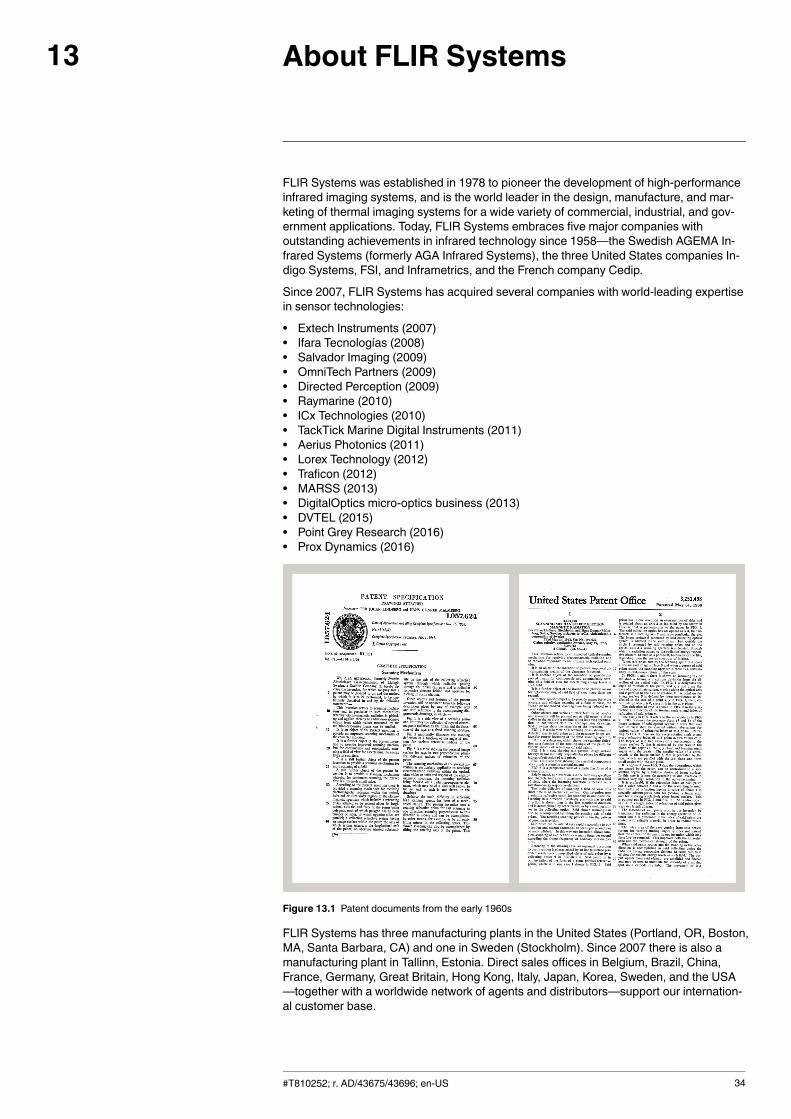
Figure 13.1 Patent documents from the early 1960s
FLIR Systems has three manufacturing plants in the United States (Portland, OR, Boston,MA, Santa Barbara, CA) and one in Sweden (Stockholm). Since 2007 there is also amanufacturing plant in Tallinn, Estonia. Direct sales offices in Belgium, Brazil, China,France, Germany, Great Britain, Hong Kong, Italy, Japan, Korea, Sweden, and the USA—together with a worldwide network of agents and distributors—support our internation-al customer base.
#T810252; r. AD/43675/43696; en-US 34
About FLIR Systems13
FLIR Systems is at the forefront of innovation in the infrared camera industry. We antici-pate market demand by constantly improving our existing cameras and developing newones. The company has set milestones in product design and development such as theintroduction of the first battery-operated portable camera for industrial inspections, andthe first uncooled infrared camera, to mention just two innovations.
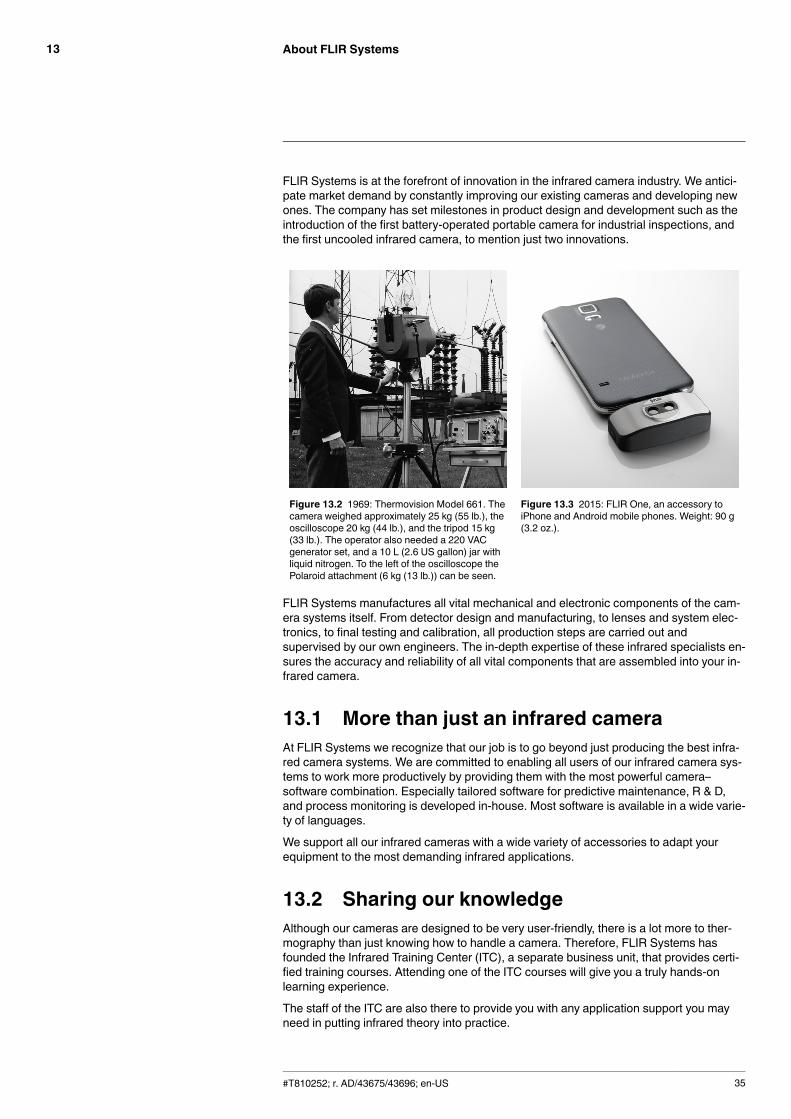
Figure 13.2 1969: Thermovision Model 661. Thecamera weighed approximately 25 kg (55 lb.), theoscilloscope 20 kg (44 lb.), and the tripod 15 kg(33 lb.). The operator also needed a 220 VACgenerator set, and a 10 L (2.6 US gallon) jar withliquid nitrogen. To the left of the oscilloscope thePolaroid attachment (6 kg (13 lb.)) can be seen.
Figure 13.3 2015: FLIR One, an accessory toiPhone and Android mobile phones. Weight: 90 g(3.2 oz.).
FLIR Systems manufactures all vital mechanical and electronic components of the cam-era systems itself. From detector design and manufacturing, to lenses and system elec-tronics, to final testing and calibration, all production steps are carried out andsupervised by our own engineers. The in-depth expertise of these infrared specialists en-sures the accuracy and reliability of all vital components that are assembled into your in-frared camera.
13.1 More than just an infrared cameraAt FLIR Systems we recognize that our job is to go beyond just producing the best infra-red camera systems. We are committed to enabling all users of our infrared camera sys-tems to work more productively by providing them with the most powerful camera–software combination. Especially tailored software for predictive maintenance, R & D,and process monitoring is developed in-house. Most software is available in a wide varie-ty of languages.
We support all our infrared cameras with a wide variety of accessories to adapt yourequipment to the most demanding infrared applications.
13.2 Sharing our knowledgeAlthough our cameras are designed to be very user-friendly, there is a lot more to ther-mography than just knowing how to handle a camera. Therefore, FLIR Systems hasfounded the Infrared Training Center (ITC), a separate business unit, that provides certi-fied training courses. Attending one of the ITC courses will give you a truly hands-onlearning experience.
The staff of the ITC are also there to provide you with any application support you mayneed in putting infrared theory into practice.
#T810252; r. AD/43675/43696; en-US 35

About FLIR Systems13
13.3 Supporting our customersFLIR Systems operates a worldwide service network to keep your camera running at alltimes. If you discover a problem with your camera, local service centers have all theequipment and expertise to solve it within the shortest possible time. Therefore, there isno need to send your camera to the other side of the world or to talk to someone whodoes not speak your language.
#T810252; r. AD/43675/43696; en-US 36
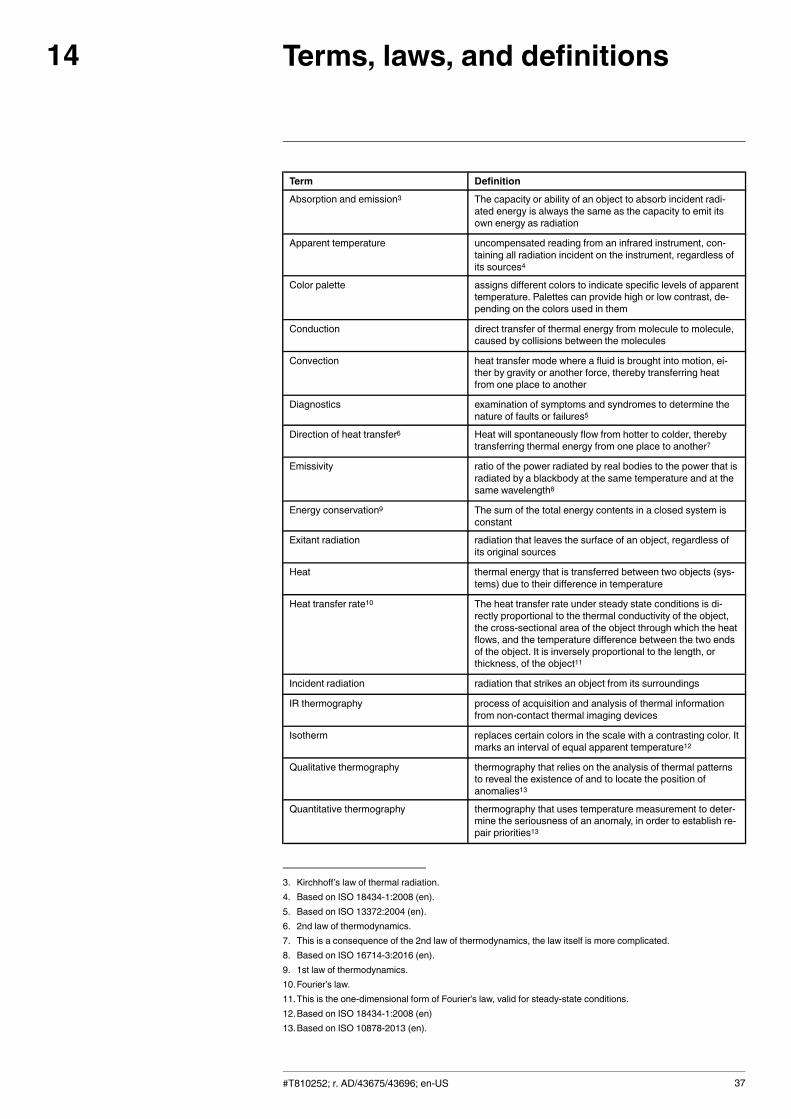
Terms, laws, and definitions14
Term Definition
Absorption and emission3 The capacity or ability of an object to absorb incident radi-ated energy is always the same as the capacity to emit itsown energy as radiation
Apparent temperature uncompensated reading from an infrared instrument, con-taining all radiation incident on the instrument, regardless ofits sources4
Color palette assigns different colors to indicate specific levels of apparenttemperature. Palettes can provide high or low contrast, de-pending on the colors used in them
Conduction direct transfer of thermal energy from molecule to molecule,caused by collisions between the molecules
Convection heat transfer mode where a fluid is brought into motion, ei-ther by gravity or another force, thereby transferring heatfrom one place to another
Diagnostics examination of symptoms and syndromes to determine thenature of faults or failures5
Direction of heat transfer6 Heat will spontaneously flow from hotter to colder, therebytransferring thermal energy from one place to another7
Emissivity ratio of the power radiated by real bodies to the power that isradiated by a blackbody at the same temperature and at thesame wavelength8
Energy conservation9 The sum of the total energy contents in a closed system isconstant
Exitant radiation radiation that leaves the surface of an object, regardless ofits original sources
Heat thermal energy that is transferred between two objects (sys-tems) due to their difference in temperature
Heat transfer rate10 The heat transfer rate under steady state conditions is di-rectly proportional to the thermal conductivity of the object,the cross-sectional area of the object through which the heatflows, and the temperature difference between the two endsof the object. It is inversely proportional to the length, orthickness, of the object11
Incident radiation radiation that strikes an object from its surroundings
IR thermography process of acquisition and analysis of thermal informationfrom non-contact thermal imaging devices
Isotherm replaces certain colors in the scale with a contrasting color. Itmarks an interval of equal apparent temperature12
Qualitative thermography thermography that relies on the analysis of thermal patternsto reveal the existence of and to locate the position ofanomalies13
Quantitative thermography thermography that uses temperature measurement to deter-mine the seriousness of an anomaly, in order to establish re-pair priorities13
#T810252; r. AD/43675/43696; en-US 37
3. Kirchhoff’s law of thermal radiation.4. Based on ISO 18434-1:2008 (en).5. Based on ISO 13372:2004 (en).6. 2nd law of thermodynamics.7. This is a consequence of the 2nd law of thermodynamics, the law itself is more complicated.8. Based on ISO 16714-3:2016 (en).9. 1st law of thermodynamics.10.Fourier’s law.11.This is the one-dimensional form of Fourier’s law, valid for steady-state conditions.12.Based on ISO 18434-1:2008 (en)13.Based on ISO 10878-2013 (en).
Terms, laws, and definitions14
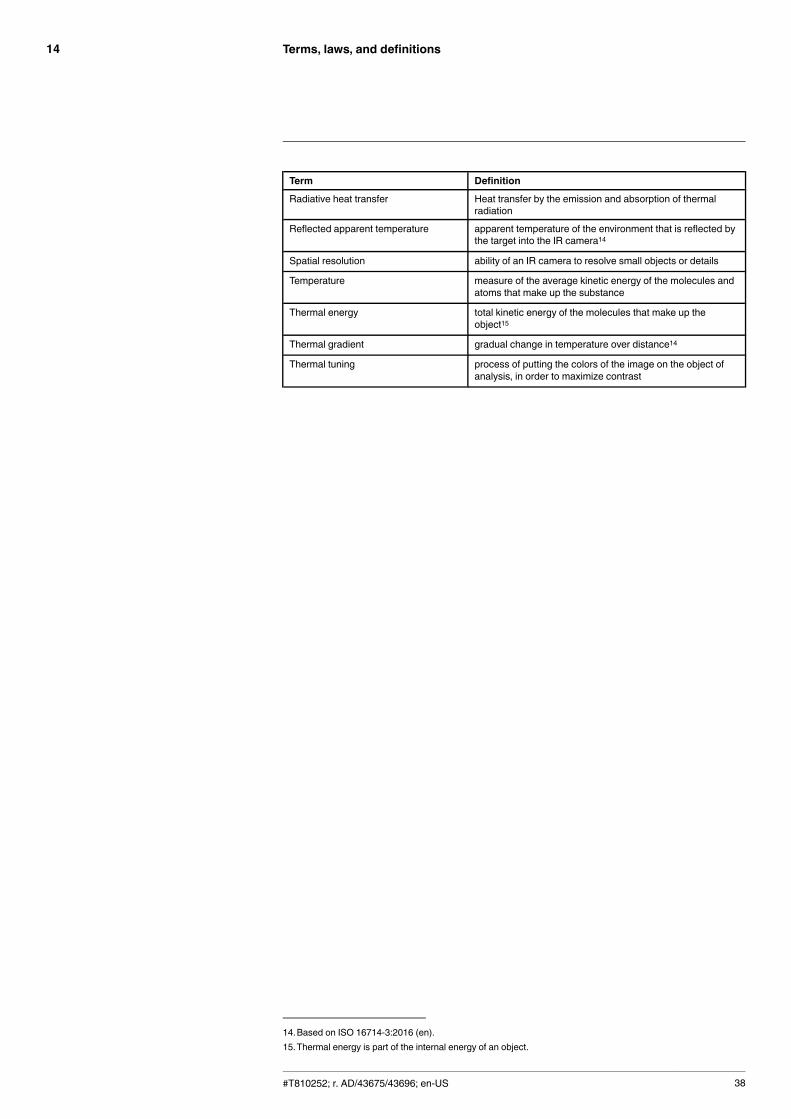
Term Definition
Radiative heat transfer Heat transfer by the emission and absorption of thermalradiation
Reflected apparent temperature apparent temperature of the environment that is reflected bythe target into the IR camera14
Spatial resolution ability of an IR camera to resolve small objects or details
Temperature measure of the average kinetic energy of the molecules andatoms that make up the substance
Thermal energy total kinetic energy of the molecules that make up theobject15
Thermal gradient gradual change in temperature over distance14
Thermal tuning process of putting the colors of the image on the object ofanalysis, in order to maximize contrast
#T810252; r. AD/43675/43696; en-US 38
14.Based on ISO 16714-3:2016 (en).15.Thermal energy is part of the internal energy of an object.
Thermographic measurementtechniques
15
15.1 IntroductionAn infrared camera measures and images the emitted infrared radiation from an object.The fact that radiation is a function of object surface temperature makes it possible forthe camera to calculate and display this temperature.
However, the radiation measured by the camera does not only depend on the tempera-ture of the object but is also a function of the emissivity. Radiation also originates fromthe surroundings and is reflected in the object. The radiation from the object and the re-flected radiation will also be influenced by the absorption of the atmosphere.
To measure temperature accurately, it is therefore necessary to compensate for the ef-fects of a number of different radiation sources. This is done on-line automatically by thecamera. The following object parameters must, however, be supplied for the camera:
• The emissivity of the object• The reflected apparent temperature• The distance between the object and the camera• The relative humidity• Temperature of the atmosphere
15.2 EmissivityThe most important object parameter to set correctly is the emissivity which, in short, is ameasure of how much radiation is emitted from the object, compared to that from a per-fect blackbody of the same temperature.
Normally, object materials and surface treatments exhibit emissivity ranging from approx-imately 0.1 to 0.95. A highly polished (mirror) surface falls below 0.1, while an oxidizedor painted surface has a higher emissivity. Oil-based paint, regardless of color in the visi-ble spectrum, has an emissivity over 0.9 in the infrared. Human skin exhibits an emissiv-ity 0.97 to 0.98.
Non-oxidized metals represent an extreme case of perfect opacity and high reflexivity,which does not vary greatly with wavelength. Consequently, the emissivity of metals islow – only increasing with temperature. For non-metals, emissivity tends to be high, anddecreases with temperature.
15.2.1 Finding the emissivity of a sample
15.2.1.1 Step 1: Determining reflected apparent temperature
Use one of the following two methods to determine reflected apparent temperature:
#T810252; r. AD/43675/43696; en-US 39
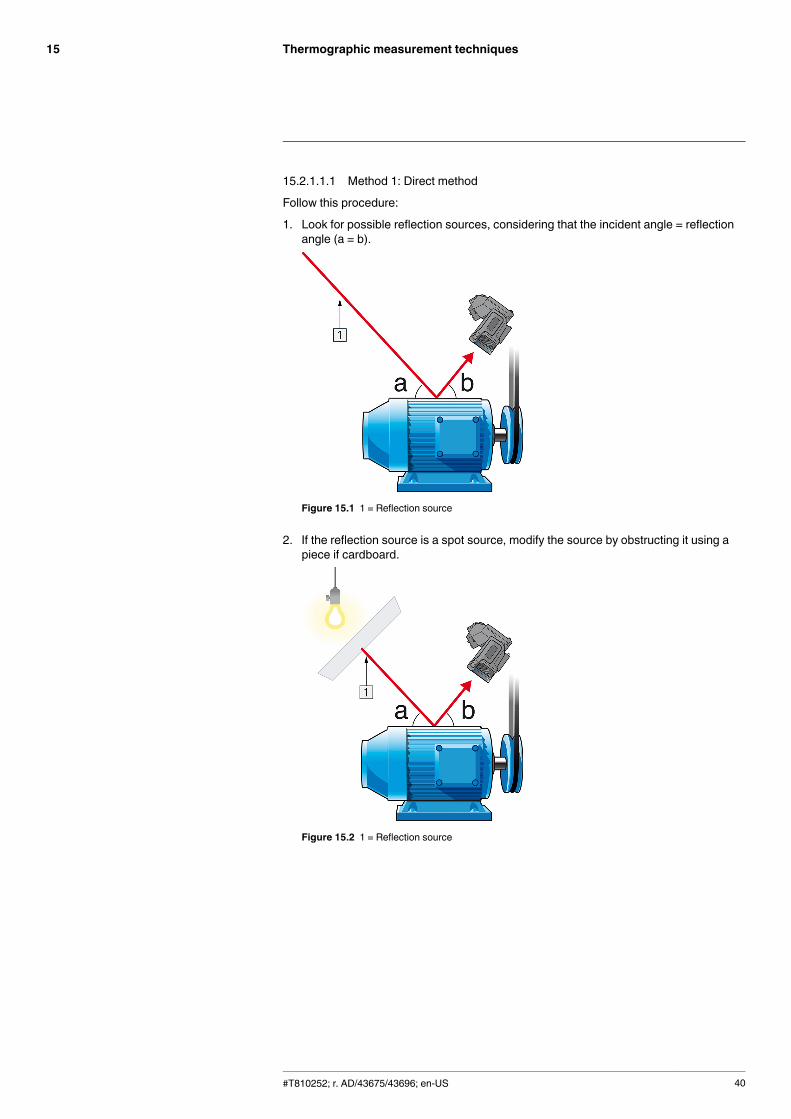
Thermographic measurement techniques15
15.2.1.1.1 Method 1: Direct method
Follow this procedure:
1. Look for possible reflection sources, considering that the incident angle = reflectionangle (a = b).
Figure 15.1 1 = Reflection source
2. If the reflection source is a spot source, modify the source by obstructing it using apiece if cardboard.
Figure 15.2 1 = Reflection source
#T810252; r. AD/43675/43696; en-US 40
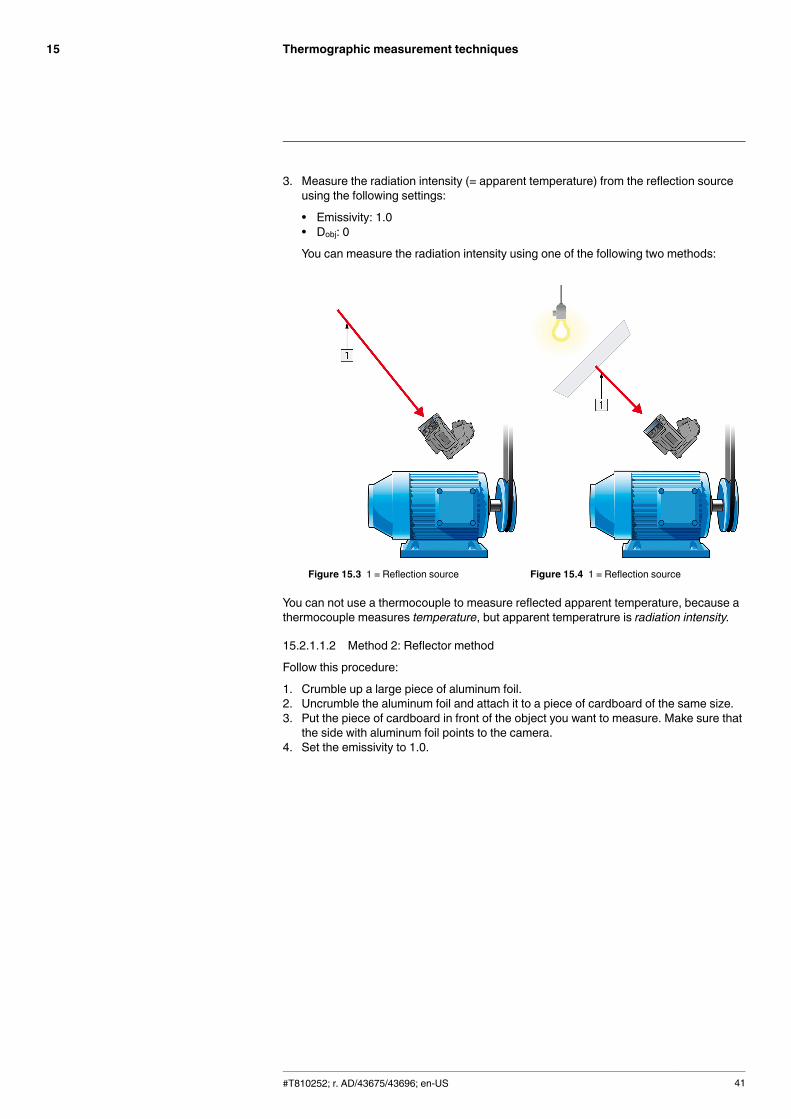
Thermographic measurement techniques15
3. Measure the radiation intensity (= apparent temperature) from the reflection sourceusing the following settings:
• Emissivity: 1.0• Dobj: 0
You can measure the radiation intensity using one of the following two methods:
Figure 15.3 1 = Reflection source Figure 15.4 1 = Reflection source
You can not use a thermocouple to measure reflected apparent temperature, because athermocouple measures temperature, but apparent temperatrure is radiation intensity.
15.2.1.1.2 Method 2: Reflector method
Follow this procedure:
1. Crumble up a large piece of aluminum foil.2. Uncrumble the aluminum foil and attach it to a piece of cardboard of the same size.3. Put the piece of cardboard in front of the object you want to measure. Make sure that
the side with aluminum foil points to the camera.4. Set the emissivity to 1.0.
#T810252; r. AD/43675/43696; en-US 41
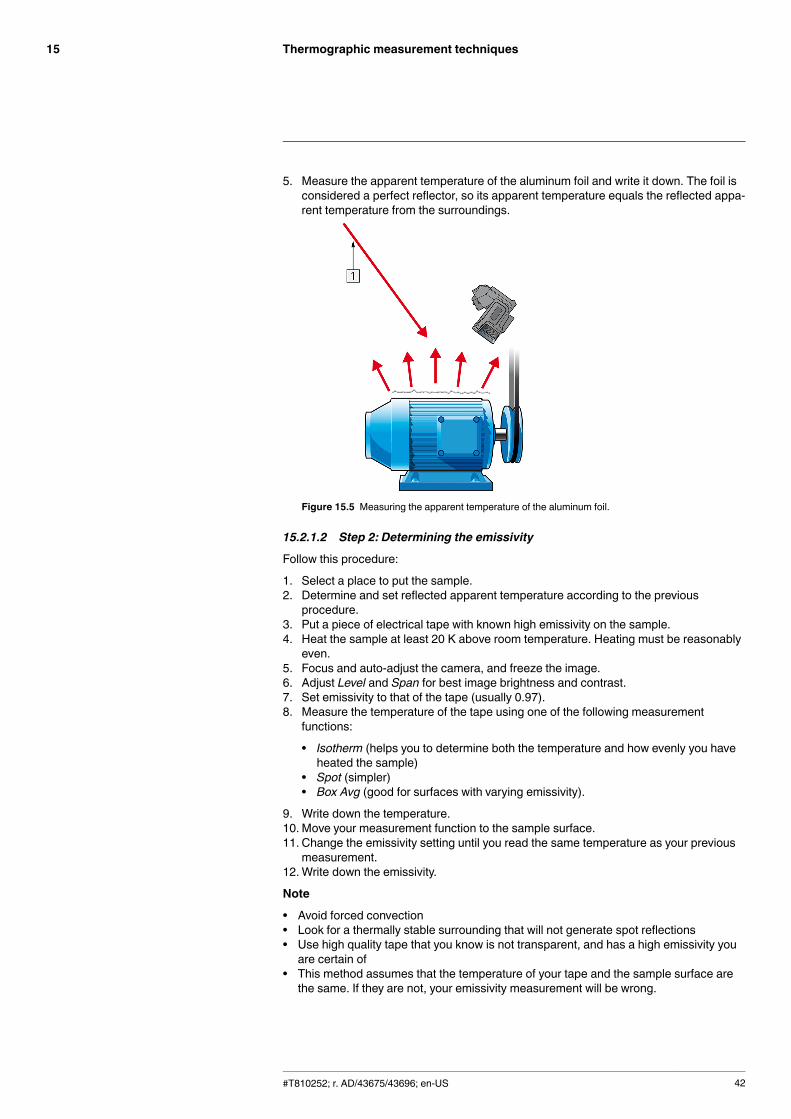
Thermographic measurement techniques15
5. Measure the apparent temperature of the aluminum foil and write it down. The foil isconsidered a perfect reflector, so its apparent temperature equals the reflected appa-rent temperature from the surroundings.
Figure 15.5 Measuring the apparent temperature of the aluminum foil.
15.2.1.2 Step 2: Determining the emissivity
Follow this procedure:
1. Select a place to put the sample.2. Determine and set reflected apparent temperature according to the previous
procedure.3. Put a piece of electrical tape with known high emissivity on the sample.4. Heat the sample at least 20 K above room temperature. Heating must be reasonably
even.5. Focus and auto-adjust the camera, and freeze the image.6. Adjust Level and Span for best image brightness and contrast.7. Set emissivity to that of the tape (usually 0.97).8. Measure the temperature of the tape using one of the following measurement
functions:
• Isotherm (helps you to determine both the temperature and how evenly you haveheated the sample)
• Spot (simpler)• Box Avg (good for surfaces with varying emissivity).
9. Write down the temperature.10. Move your measurement function to the sample surface.11. Change the emissivity setting until you read the same temperature as your previous
measurement.12.Write down the emissivity.
Note
• Avoid forced convection• Look for a thermally stable surrounding that will not generate spot reflections• Use high quality tape that you know is not transparent, and has a high emissivity youare certain of
• This method assumes that the temperature of your tape and the sample surface arethe same. If they are not, your emissivity measurement will be wrong.
#T810252; r. AD/43675/43696; en-US 42
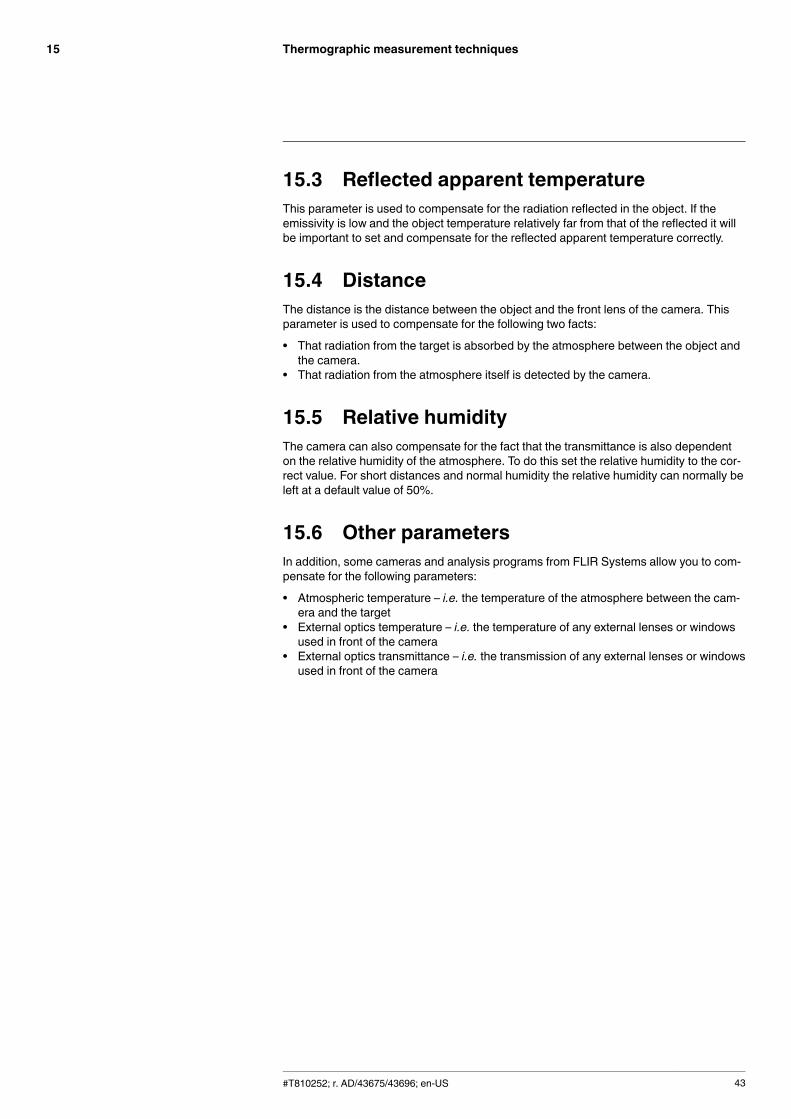
Thermographic measurement techniques15
15.3 Reflected apparent temperatureThis parameter is used to compensate for the radiation reflected in the object. If theemissivity is low and the object temperature relatively far from that of the reflected it willbe important to set and compensate for the reflected apparent temperature correctly.
15.4 DistanceThe distance is the distance between the object and the front lens of the camera. Thisparameter is used to compensate for the following two facts:
• That radiation from the target is absorbed by the atmosphere between the object andthe camera.
• That radiation from the atmosphere itself is detected by the camera.
15.5 Relative humidityThe camera can also compensate for the fact that the transmittance is also dependenton the relative humidity of the atmosphere. To do this set the relative humidity to the cor-rect value. For short distances and normal humidity the relative humidity can normally beleft at a default value of 50%.
15.6 Other parametersIn addition, some cameras and analysis programs from FLIR Systems allow you to com-pensate for the following parameters:
• Atmospheric temperature – i.e. the temperature of the atmosphere between the cam-era and the target
• External optics temperature – i.e. the temperature of any external lenses or windowsused in front of the camera
• External optics transmittance – i.e. the transmission of any external lenses or windowsused in front of the camera
#T810252; r. AD/43675/43696; en-US 43
The secret to a good thermalimage
16
16.1 Introduction
The use of thermal cameras has spread to many professional environments in recentyears. They are easy to handle, and thermal images are quick to take. Images can alsobe attached to reports easily, e.g., for an inspection of an electrical installation or buildingas evidence of work carried out or of any faults or deviations identified. However, peopleoften forget that an image to be used as evidence or even proof before the courts mustmeet certain requirements: this is not achieved with a quick snapshot. So, what charac-terizes a really good thermal image?
16.2 Background
During the practical exercises in our thermography training classes we notice, time andtime again, how difficult some participants find choosing the optimal camera settings fordifferent tasks. Not everyone has a background in, for example, amateur photography(more on the difference between thermography and photography in the next section),and to take a good and meaningful thermal image you need some knowledge of photog-raphy, including its practical application. For this reason, it is hardly surprising that ther-mographers, particularly those without training, repeatedly produce reports with thermalimages that are devoid of meaning or even support the wrong conclusions and are fit on-ly for the waste bin. Unfortunately, such reports are found not only in companies in whichthermography is more of an added bonus but also in businesses where these reportsmay be part of a critical process monitoring or maintenance program. There are two mainreasons for this: either the users don't know what a good thermal image is or how to takeone, or—for whatever reason—the job is not being done properly.
16.3 A good image
As thermography and photography are related, it makes sense to take a look at what isimportant to professional photographers. How do they characterize a good image? Threeaspects can be pointed out as the most important:
1. An image has to touch the observer in some way. That means it needs to be unusual,striking, or unique, and has to arouse interest and, depending on the genre, emotion.
2. The composition and balance must be in harmony; the image detail and content mustgo together aesthetically.
3. The lighting must be interesting, such as back lighting or side lighting that casts dra-matic shadows, or evening light or other pleasing illumination—whatever fits the over-all effect that the photographer wants.
To what extent can these concepts be applied to thermography?
With thermography, the motif should also be interesting. In other words, our aim is to de-pict an object or its condition. Emotions are not required—facts have priority in thermalimages (assuming they are not an art project!). In everyday working life, it is important toillustrate thermal patterns clearly and to facilitate temperature measurements.
The thermal image must also have suitable image detail and display the object at an ap-propriate size and position.
Without external illumination, neither visual sight nor photography is possible becausewhat we see with our eyes or capture with a camera is reflected light. In thermography,the camera records both emitted and reflected radiation. Therefore, the relationship andintensity of the infrared radiation, both emitted by the object and by the surrounding envi-ronment, are important. Brightness and contrast in the image are then adjusted bychanging the displayed temperature interval.
The comparison between photography and thermography can be summarized in a tableusing a few keywords:
Photography Thermography
Interesting motif The object to be examined
“Tells a story” “Presents facts”
#T810252; r. AD/43675/43696; en-US 44
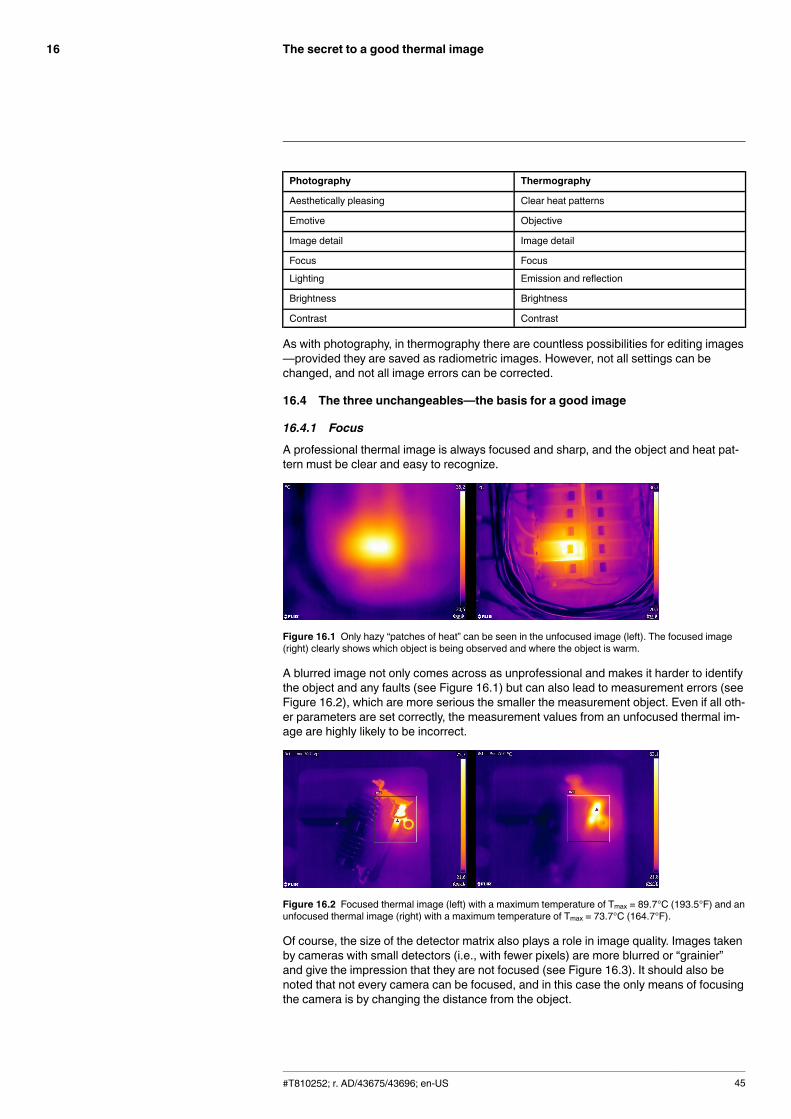
The secret to a good thermal image16
Photography Thermography
Aesthetically pleasing Clear heat patterns
Emotive Objective
Image detail Image detail
Focus Focus
Lighting Emission and reflection
Brightness Brightness
Contrast Contrast
As with photography, in thermography there are countless possibilities for editing images—provided they are saved as radiometric images. However, not all settings can bechanged, and not all image errors can be corrected.
16.4 The three unchangeables—the basis for a good image
16.4.1 Focus
A professional thermal image is always focused and sharp, and the object and heat pat-tern must be clear and easy to recognize.
Figure 16.1 Only hazy “patches of heat” can be seen in the unfocused image (left). The focused image(right) clearly shows which object is being observed and where the object is warm.
A blurred image not only comes across as unprofessional and makes it harder to identifythe object and any faults (see Figure 16.1) but can also lead to measurement errors (seeFigure 16.2), which are more serious the smaller the measurement object. Even if all oth-er parameters are set correctly, the measurement values from an unfocused thermal im-age are highly likely to be incorrect.
Figure 16.2 Focused thermal image (left) with a maximum temperature of Tmax = 89.7°C (193.5°F) and anunfocused thermal image (right) with a maximum temperature of Tmax = 73.7°C (164.7°F).
Of course, the size of the detector matrix also plays a role in image quality. Images takenby cameras with small detectors (i.e., with fewer pixels) are more blurred or “grainier”and give the impression that they are not focused (see Figure 16.3). It should also benoted that not every camera can be focused, and in this case the only means of focusingthe camera is by changing the distance from the object.
#T810252; r. AD/43675/43696; en-US 45
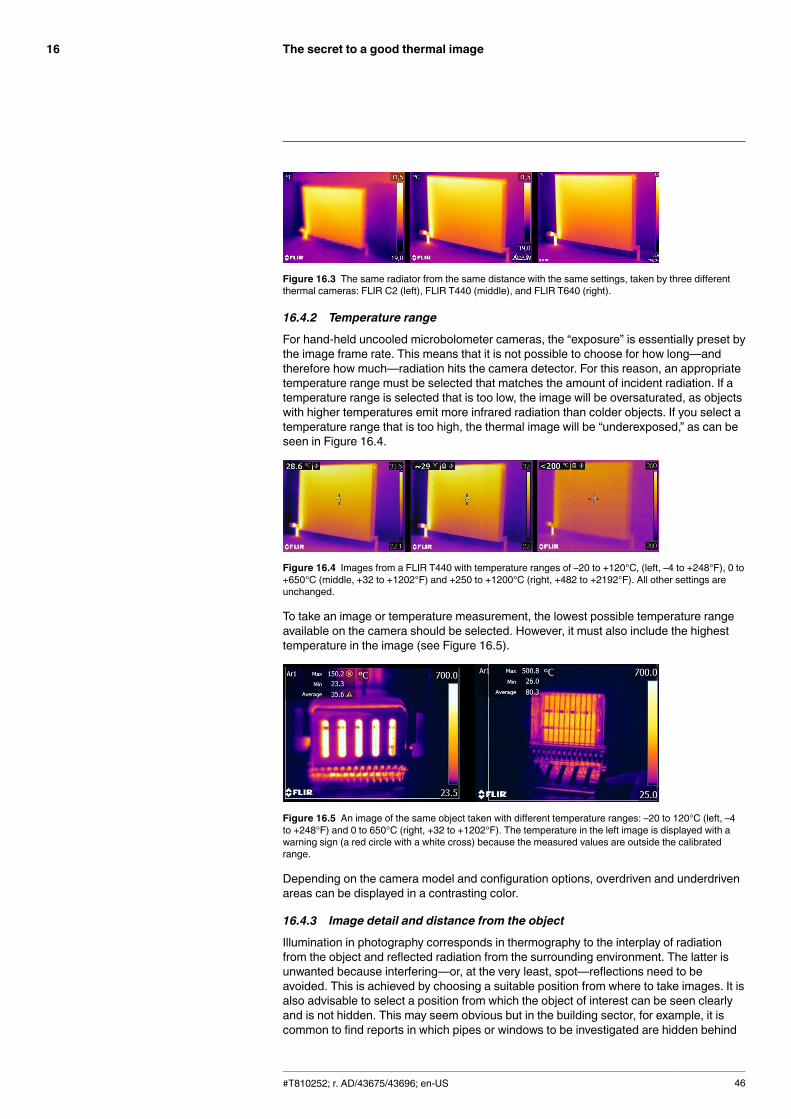
The secret to a good thermal image16
Figure 16.3 The same radiator from the same distance with the same settings, taken by three differentthermal cameras: FLIR C2 (left), FLIR T440 (middle), and FLIR T640 (right).
16.4.2 Temperature range
For hand-held uncooled microbolometer cameras, the “exposure” is essentially preset bythe image frame rate. This means that it is not possible to choose for how long—andtherefore how much—radiation hits the camera detector. For this reason, an appropriatetemperature range must be selected that matches the amount of incident radiation. If atemperature range is selected that is too low, the image will be oversaturated, as objectswith higher temperatures emit more infrared radiation than colder objects. If you select atemperature range that is too high, the thermal image will be “underexposed,” as can beseen in Figure 16.4.
Figure 16.4 Images from a FLIR T440 with temperature ranges of –20 to +120°C, (left, –4 to +248°F), 0 to+650°C (middle, +32 to +1202°F) and +250 to +1200°C (right, +482 to +2192°F). All other settings areunchanged.
To take an image or temperature measurement, the lowest possible temperature rangeavailable on the camera should be selected. However, it must also include the highesttemperature in the image (see Figure 16.5).
Figure 16.5 An image of the same object taken with different temperature ranges: –20 to 120°C (left, –4to +248°F) and 0 to 650°C (right, +32 to +1202°F). The temperature in the left image is displayed with awarning sign (a red circle with a white cross) because the measured values are outside the calibratedrange.
Depending on the camera model and configuration options, overdriven and underdrivenareas can be displayed in a contrasting color.
16.4.3 Image detail and distance from the object
Illumination in photography corresponds in thermography to the interplay of radiationfrom the object and reflected radiation from the surrounding environment. The latter isunwanted because interfering—or, at the very least, spot—reflections need to beavoided. This is achieved by choosing a suitable position from where to take images. It isalso advisable to select a position from which the object of interest can be seen clearlyand is not hidden. This may seem obvious but in the building sector, for example, it iscommon to find reports in which pipes or windows to be investigated are hidden behind
#T810252; r. AD/43675/43696; en-US 46
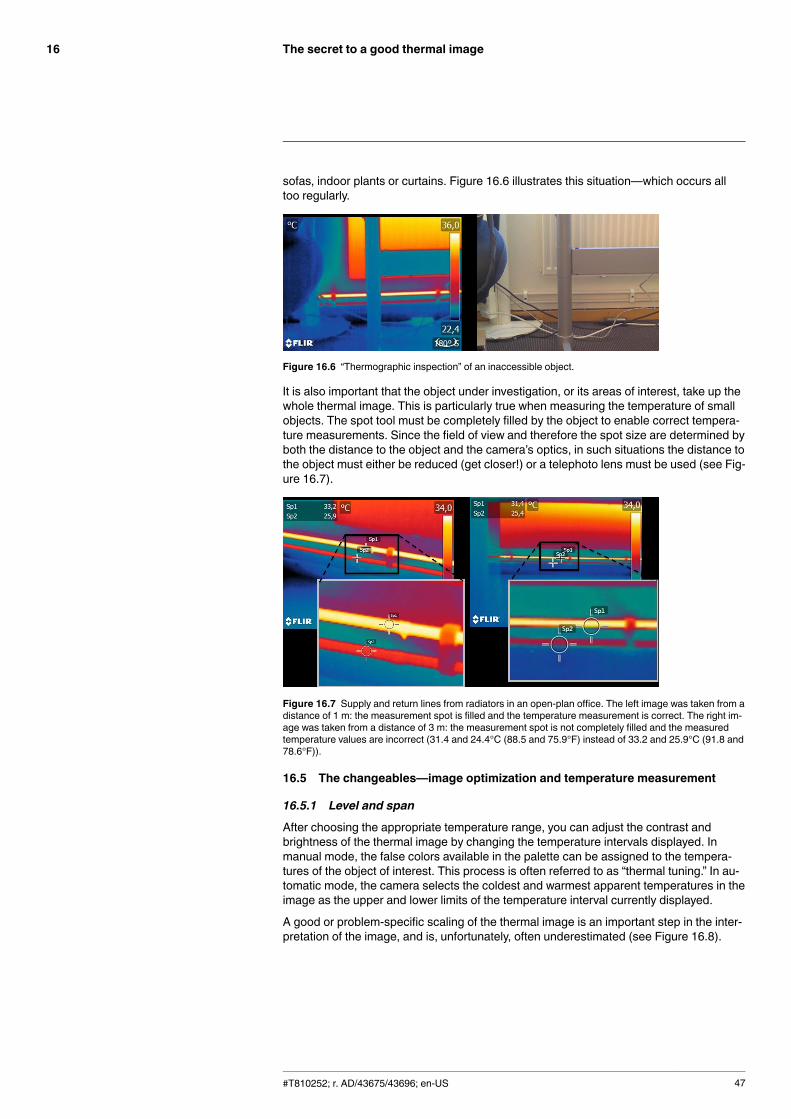
The secret to a good thermal image16
sofas, indoor plants or curtains. Figure 16.6 illustrates this situation—which occurs alltoo regularly.
Figure 16.6 “Thermographic inspection” of an inaccessible object.
It is also important that the object under investigation, or its areas of interest, take up thewhole thermal image. This is particularly true when measuring the temperature of smallobjects. The spot tool must be completely filled by the object to enable correct tempera-ture measurements. Since the field of view and therefore the spot size are determined byboth the distance to the object and the camera’s optics, in such situations the distance tothe object must either be reduced (get closer!) or a telephoto lens must be used (see Fig-ure 16.7).
Figure 16.7 Supply and return lines from radiators in an open-plan office. The left image was taken from adistance of 1 m: the measurement spot is filled and the temperature measurement is correct. The right im-age was taken from a distance of 3 m: the measurement spot is not completely filled and the measuredtemperature values are incorrect (31.4 and 24.4°C (88.5 and 75.9°F) instead of 33.2 and 25.9°C (91.8 and78.6°F)).
16.5 The changeables—image optimization and temperature measurement
16.5.1 Level and span
After choosing the appropriate temperature range, you can adjust the contrast andbrightness of the thermal image by changing the temperature intervals displayed. Inmanual mode, the false colors available in the palette can be assigned to the tempera-tures of the object of interest. This process is often referred to as “thermal tuning.” In au-tomatic mode, the camera selects the coldest and warmest apparent temperatures in theimage as the upper and lower limits of the temperature interval currently displayed.
A good or problem-specific scaling of the thermal image is an important step in the inter-pretation of the image, and is, unfortunately, often underestimated (see Figure 16.8).
#T810252; r. AD/43675/43696; en-US 47
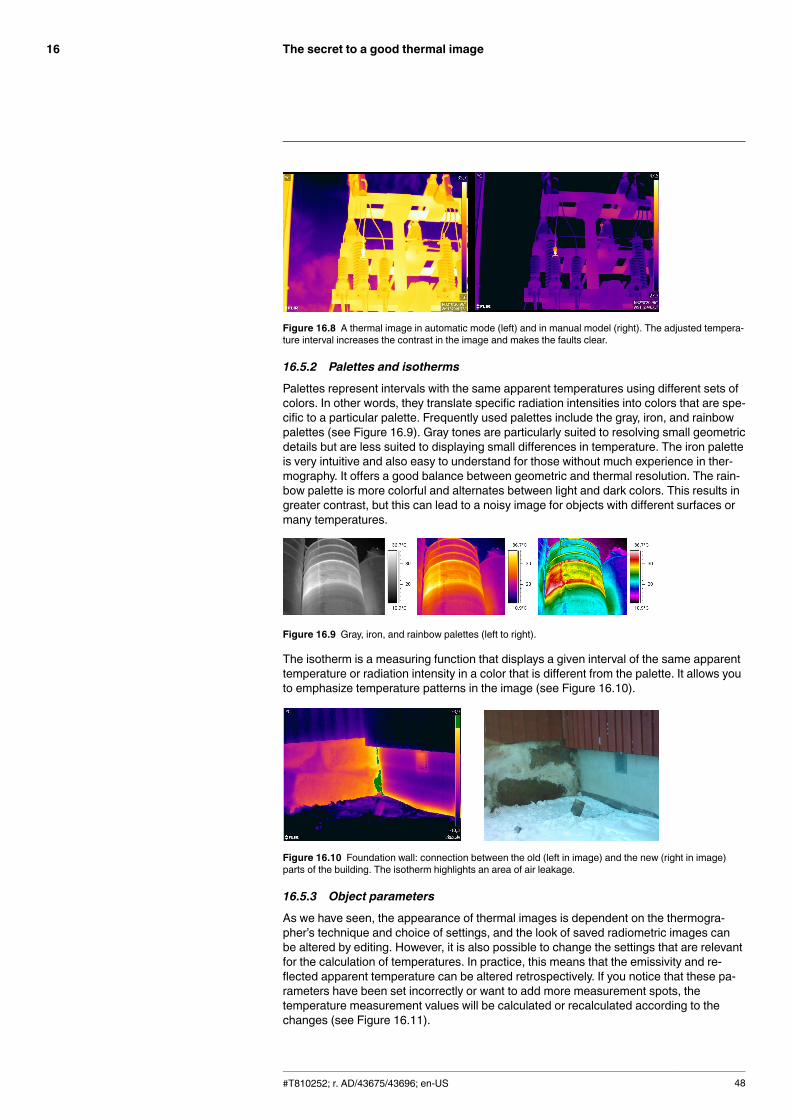
The secret to a good thermal image16
Figure 16.8 A thermal image in automatic mode (left) and in manual model (right). The adjusted tempera-ture interval increases the contrast in the image and makes the faults clear.
16.5.2 Palettes and isotherms
Palettes represent intervals with the same apparent temperatures using different sets ofcolors. In other words, they translate specific radiation intensities into colors that are spe-cific to a particular palette. Frequently used palettes include the gray, iron, and rainbowpalettes (see Figure 16.9). Gray tones are particularly suited to resolving small geometricdetails but are less suited to displaying small differences in temperature. The iron paletteis very intuitive and also easy to understand for those without much experience in ther-mography. It offers a good balance between geometric and thermal resolution. The rain-bow palette is more colorful and alternates between light and dark colors. This results ingreater contrast, but this can lead to a noisy image for objects with different surfaces ormany temperatures.
Figure 16.9 Gray, iron, and rainbow palettes (left to right).
The isotherm is a measuring function that displays a given interval of the same apparenttemperature or radiation intensity in a color that is different from the palette. It allows youto emphasize temperature patterns in the image (see Figure 16.10).
Figure 16.10 Foundation wall: connection between the old (left in image) and the new (right in image)parts of the building. The isotherm highlights an area of air leakage.
16.5.3 Object parameters
As we have seen, the appearance of thermal images is dependent on the thermogra-pher’s technique and choice of settings, and the look of saved radiometric images canbe altered by editing. However, it is also possible to change the settings that are relevantfor the calculation of temperatures. In practice, this means that the emissivity and re-flected apparent temperature can be altered retrospectively. If you notice that these pa-rameters have been set incorrectly or want to add more measurement spots, thetemperature measurement values will be calculated or recalculated according to thechanges (see Figure 16.11).
#T810252; r. AD/43675/43696; en-US 48
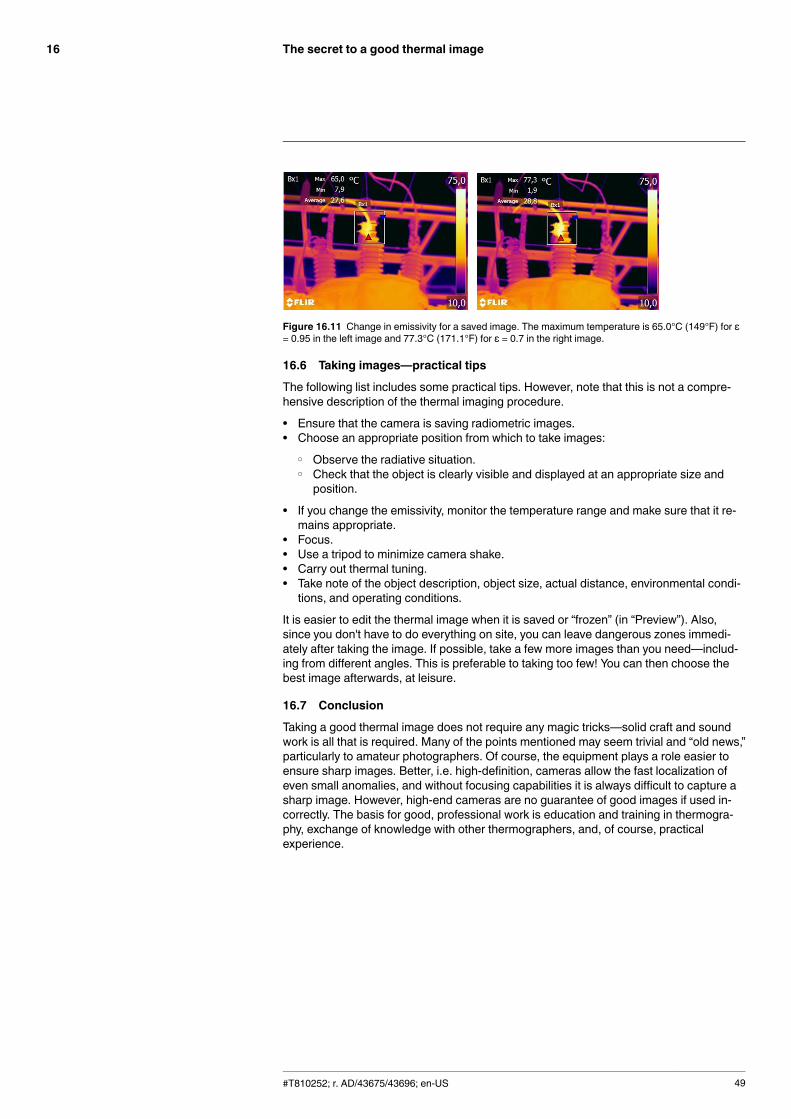
The secret to a good thermal image16
Figure 16.11 Change in emissivity for a saved image. The maximum temperature is 65.0°C (149°F) for ε= 0.95 in the left image and 77.3°C (171.1°F) for ε = 0.7 in the right image.
16.6 Taking images—practical tips
The following list includes some practical tips. However, note that this is not a compre-hensive description of the thermal imaging procedure.
• Ensure that the camera is saving radiometric images.• Choose an appropriate position from which to take images:
◦ Observe the radiative situation.◦ Check that the object is clearly visible and displayed at an appropriate size andposition.
• If you change the emissivity, monitor the temperature range and make sure that it re-mains appropriate.
• Focus.• Use a tripod to minimize camera shake.• Carry out thermal tuning.• Take note of the object description, object size, actual distance, environmental condi-tions, and operating conditions.
It is easier to edit the thermal image when it is saved or “frozen” (in “Preview”). Also,since you don't have to do everything on site, you can leave dangerous zones immedi-ately after taking the image. If possible, take a few more images than you need—includ-ing from different angles. This is preferable to taking too few! You can then choose thebest image afterwards, at leisure.
16.7 Conclusion
Taking a good thermal image does not require any magic tricks—solid craft and soundwork is all that is required. Many of the points mentioned may seem trivial and “old news,”particularly to amateur photographers. Of course, the equipment plays a role easier toensure sharp images. Better, i.e. high-definition, cameras allow the fast localization ofeven small anomalies, and without focusing capabilities it is always difficult to capture asharp image. However, high-end cameras are no guarantee of good images if used in-correctly. The basis for good, professional work is education and training in thermogra-phy, exchange of knowledge with other thermographers, and, of course, practicalexperience.
#T810252; r. AD/43675/43696; en-US 49
About calibration17
17.1 IntroductionCalibration of a thermal camera is a prerequisite for temperature measurement. The cali-bration provides the relationship between the input signal and the physical quantity thatthe user wants to measure. However, despite its widespread and frequent use, the term“calibration” is often misunderstood and misused. Local and national differences as wellas translation-related issues create additional confusion.
Unclear terminology can lead to difficulties in communication and erroneous translations,and subsequently to incorrect measurements due to misunderstandings and, in the worstcase, even to lawsuits.
17.2 Definition—what is calibration?The International Bureau of Weights and Measures16 defines calibration17 in the followingway:
an operation that, under specified conditions, in a first step, establishes a relation be-tween the quantity values with measurement uncertainties provided by measurementstandards and corresponding indications with associated measurement uncertaintiesand, in a second step, uses this information to establish a relation for obtaining a meas-urement result from an indication.
The calibration itself may be expressed in different formats: this can be a statement, cali-bration function, calibration diagram18, calibration curve19, or calibration table.
Often, the first step alone in the above definition is perceived and referred to as being“calibration.” However, this is not (always) sufficient.
Considering the calibration procedure of a thermal camera, the first step establishes therelation between emitted radiation (the quantity value) and the electrical output signal(the indication). This first step of the calibration procedure consists of obtaining a homo-geneous (or uniform) response when the camera is placed in front of an extended sourceof radiation.
As we know the temperature of the reference source emitting the radiation, in the secondstep the obtained output signal (the indication) can be related to the reference source’stemperature (measurement result). The second step includes drift measurement andcompensation.
To be correct, calibration of a thermal camera is, strictly, not expressed through tempera-ture. Thermal cameras are sensitive to infrared radiation: therefore, at first you obtain aradiance correspondence, then a relationship between radiance and temperature. Forbolometer cameras used by non-R&D customers, radiance is not expressed: only thetemperature is provided.
17.3 Camera calibration at FLIR SystemsWithout calibration, an infrared camera would not be able to measure either radiance ortemperature. At FLIR Systems, the calibration of uncooled microbolometer cameras witha measurement capability is carried out during both production and service. Cooled cam-eras with photon detectors are often calibrated by the user with special software. Withthis type of software, in theory, common handheld uncooled thermal cameras could becalibrated by the user too. However, as this software is not suitable for reporting
#T810252; r. AD/43675/43696; en-US 50
16.http://www.bipm.org/en/about-us/ [Retrieved 2017-01-31.]17.http://jcgm.bipm.org/vim/en/2.39.html [Retrieved 2017-01-31.]18.http://jcgm.bipm.org/vim/en/4.30.html [Retrieved 2017-01-31.]19.http://jcgm.bipm.org/vim/en/4.31.html [Retrieved 2017-01-31.]
About calibration17
purposes, most users do not have it. Non-measuring devices that are used for imagingonly do not need temperature calibration. Sometimes this is also reflected in camera ter-minology when talking about infrared or thermal imaging cameras compared with ther-mography cameras, where the latter are the measuring devices.
The calibration information, no matter if the calibration is done by FLIR Systems or theuser, is stored in calibration curves, which are expressed by mathematical functions. Asradiation intensity changes with both temperature and the distance between the objectand the camera, different curves are generated for different temperature ranges and ex-changeable lenses.
17.4 The differences between a calibrationperformed by a user and that performed directlyat FLIR SystemsFirst, the reference sources that FLIR Systems uses are themselves calibrated andtraceable. This means, at each FLIR Systems site performing calibration, that the sour-ces are controlled by an independent national authority. The camera calibration certifi-cate is confirmation of this. It is proof that not only has the calibration been performed byFLIR Systems but that it has also been carried out using calibrated references. Someusers own or have access to accredited reference sources, but they are very few innumber.
Second, there is a technical difference. When performing a user calibration, the result isoften (but not always) not drift compensated. This means that the values do not take intoaccount a possible change in the camera’s output when the camera’s internal tempera-ture varies. This yields a larger uncertainty. Drift compensation uses data obtained in cli-mate-controlled chambers. All FLIR Systems cameras are drift compensated when theyare first delivered to the customer and when they are recalibrated by FLIR Systems serv-ice departments.
17.5 Calibration, verification and adjustmentA common misconception is to confuse calibration with verification or adjustment. In-deed, calibration is a prerequisite for verification, which provides confirmation that speci-fied requirements are met. Verification provides objective evidence that a given itemfulfills specified requirements. To obtain the verification, defined temperatures (emittedradiation) of calibrated and traceable reference sources are measured. The measure-ment results, including the deviation, are noted in a table. The verification certificatestates that these measurement results meet specified requirements. Sometimes, compa-nies or organizations offer and market this verification certificate as a “calibrationcertificate.”
Proper verification—and by extension calibration and/or recalibration—can only beachieved when a validated protocol is respected. The process is more than placing thecamera in front of blackbodies and checking if the camera output (as temperature, for in-stance) corresponds to the original calibration table. It is often forgotten that a camera isnot sensitive to temperature but to radiation. Furthermore, a camera is an imaging sys-tem, not just a single sensor. Consequently, if the optical configuration allowing the cam-era to “collect” radiance is poor or misaligned, then the “verification” (or calibration orrecalibration) is worthless.
For instance, one has to ensure that the distance between the blackbody and the cameraas well as the diameter of the blackbody cavity are chosen so as to reduce stray radiationand the size-of-source effect.
To summarize: a validated protocol must comply with the physical laws for radiance, andnot only those for temperature.
#T810252; r. AD/43675/43696; en-US 51
About calibration17
Calibration is also a prerequisite for adjustment, which is the set of operations carried outon a measuring system such that the system provides prescribed indications corre-sponding to given values of quantities to be measured, typically obtained from measure-ment standards. Simplified, adjustment is a manipulation that results in instruments thatmeasure correctly within their specifications. In everyday language, the term “calibration”is widely used instead of “adjustment” for measuring devices.
17.6 Non-uniformity correctionWhen the thermal camera displays ”Calibrating…” it is adjusting for the deviation in re-sponse of each individual detector element (pixel). In thermography, this is called a ”non-uniformity correction” (NUC). It is an offset update, and the gain remains unchanged.
The European standard EN 16714-3, Non-destructive Testing—Thermographic Testing—Part 3: Terms and Definitions, defines an NUC as “Image correction carried out by thecamera software to compensate for different sensitivities of detector elements and otheroptical and geometrical disturbances.”
During the NUC (the offset update), a shutter (internal flag) is placed in the optical path,and all the detector elements are exposed to the same amount of radiation originatingfrom the shutter. Therefore, in an ideal situation, they should all give the same output sig-nal. However, each individual element has its own response, so the output is not uniform.This deviation from the ideal result is calculated and used to mathematically perform animage correction, which is essentially a correction of the displayed radiation signal.Some cameras do not have an internal flag. In this case, the offset update must be per-formed manually using special software and an external uniform source of radiation.
An NUC is performed, for example, at start-up, when changing a measurement range, orwhen the environment temperature changes. Some cameras also allow the user to trig-ger it manually. This is useful when you have to perform a critical measurement with aslittle image disturbance as possible.
17.7 Thermal image adjustment (thermaltuning)Some people use the term “image calibration” when adjusting the thermal contrast andbrightness in the image to enhance specific details. During this operation, the tempera-ture interval is set in such a way that all available colors are used to show only (or mainly)the temperatures in the region of interest. The correct term for this manipulation is “ther-mal image adjustment” or “thermal tuning”, or, in some languages, “thermal image optimi-zation.” You must be in manual mode to undertake this, otherwise the camera will set thelower and upper limits of the displayed temperature interval automatically to the coldestand hottest temperatures in the scene.
#T810252; r. AD/43675/43696; en-US 52
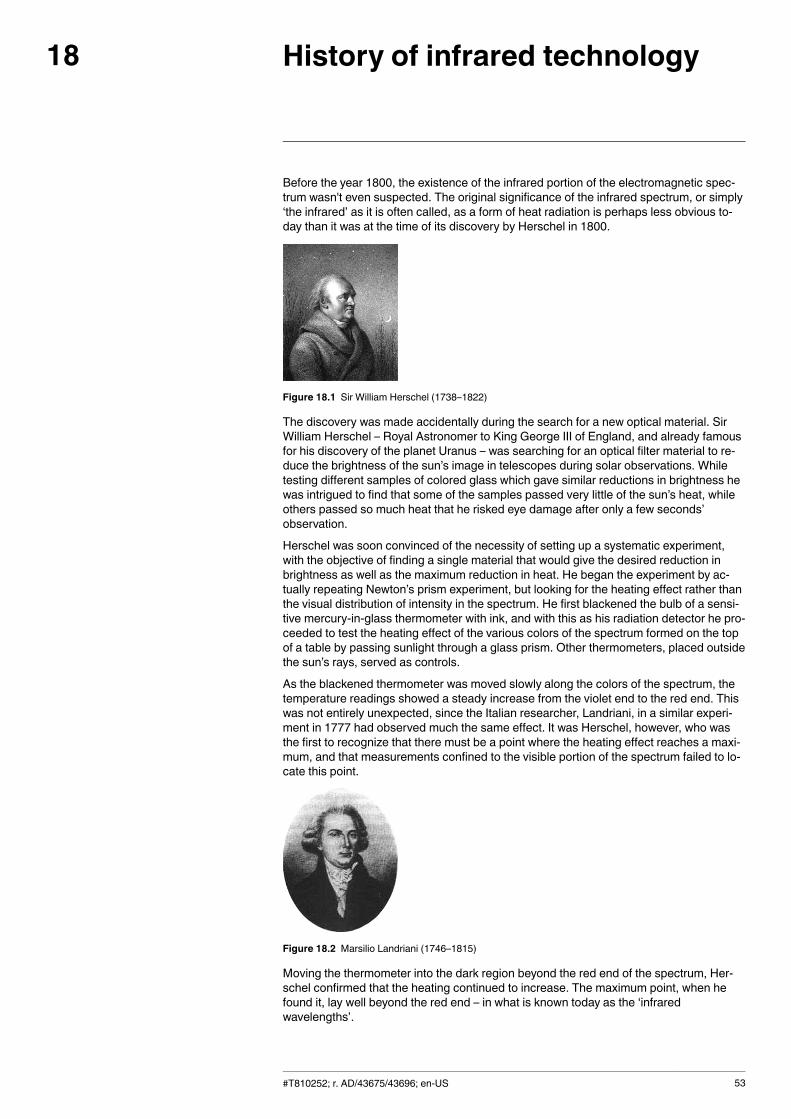
History of infrared technology18
Before the year 1800, the existence of the infrared portion of the electromagnetic spec-trum wasn't even suspected. The original significance of the infrared spectrum, or simply‘the infrared’ as it is often called, as a form of heat radiation is perhaps less obvious to-day than it was at the time of its discovery by Herschel in 1800.
Figure 18.1 Sir William Herschel (1738–1822)
The discovery was made accidentally during the search for a new optical material. SirWilliam Herschel – Royal Astronomer to King George III of England, and already famousfor his discovery of the planet Uranus – was searching for an optical filter material to re-duce the brightness of the sun’s image in telescopes during solar observations. Whiletesting different samples of colored glass which gave similar reductions in brightness hewas intrigued to find that some of the samples passed very little of the sun’s heat, whileothers passed so much heat that he risked eye damage after only a few seconds’observation.
Herschel was soon convinced of the necessity of setting up a systematic experiment,with the objective of finding a single material that would give the desired reduction inbrightness as well as the maximum reduction in heat. He began the experiment by ac-tually repeating Newton’s prism experiment, but looking for the heating effect rather thanthe visual distribution of intensity in the spectrum. He first blackened the bulb of a sensi-tive mercury-in-glass thermometer with ink, and with this as his radiation detector he pro-ceeded to test the heating effect of the various colors of the spectrum formed on the topof a table by passing sunlight through a glass prism. Other thermometers, placed outsidethe sun’s rays, served as controls.
As the blackened thermometer was moved slowly along the colors of the spectrum, thetemperature readings showed a steady increase from the violet end to the red end. Thiswas not entirely unexpected, since the Italian researcher, Landriani, in a similar experi-ment in 1777 had observed much the same effect. It was Herschel, however, who wasthe first to recognize that there must be a point where the heating effect reaches a maxi-mum, and that measurements confined to the visible portion of the spectrum failed to lo-cate this point.
Figure 18.2 Marsilio Landriani (1746–1815)
Moving the thermometer into the dark region beyond the red end of the spectrum, Her-schel confirmed that the heating continued to increase. The maximum point, when hefound it, lay well beyond the red end – in what is known today as the ‘infraredwavelengths’.
#T810252; r. AD/43675/43696; en-US 53
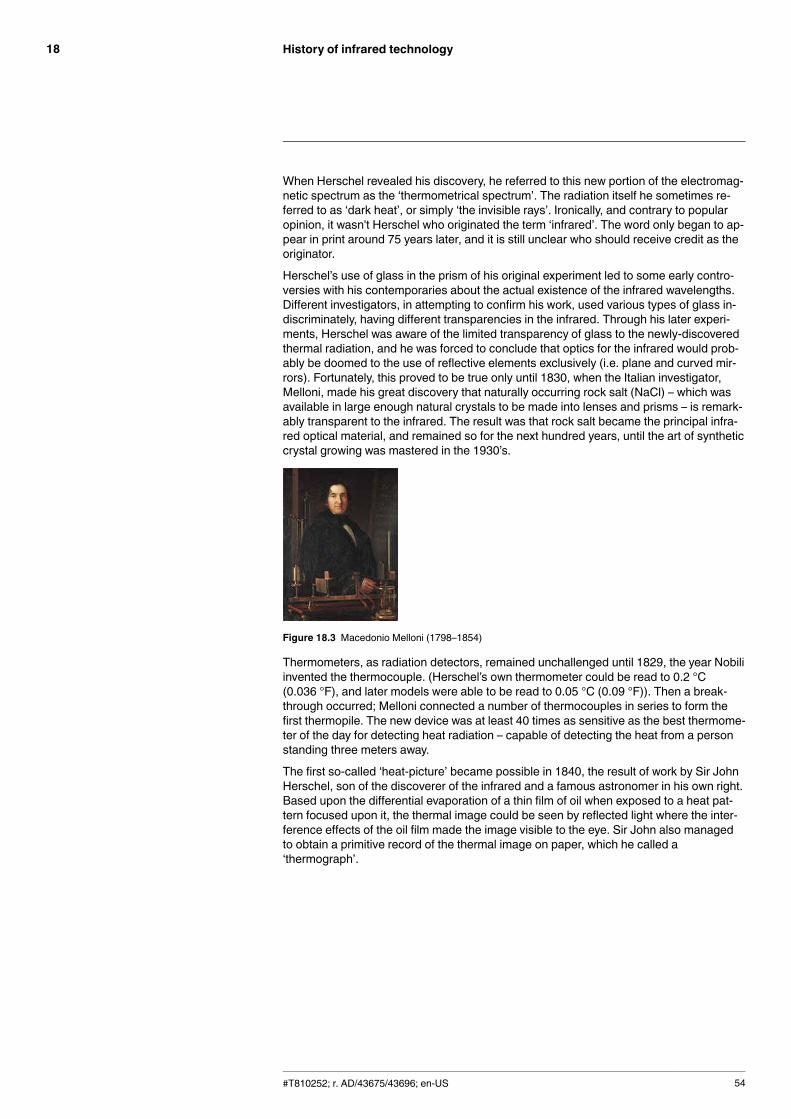
History of infrared technology18
When Herschel revealed his discovery, he referred to this new portion of the electromag-netic spectrum as the ‘thermometrical spectrum’. The radiation itself he sometimes re-ferred to as ‘dark heat’, or simply ‘the invisible rays’. Ironically, and contrary to popularopinion, it wasn't Herschel who originated the term ‘infrared’. The word only began to ap-pear in print around 75 years later, and it is still unclear who should receive credit as theoriginator.
Herschel’s use of glass in the prism of his original experiment led to some early contro-versies with his contemporaries about the actual existence of the infrared wavelengths.Different investigators, in attempting to confirm his work, used various types of glass in-discriminately, having different transparencies in the infrared. Through his later experi-ments, Herschel was aware of the limited transparency of glass to the newly-discoveredthermal radiation, and he was forced to conclude that optics for the infrared would prob-ably be doomed to the use of reflective elements exclusively (i.e. plane and curved mir-rors). Fortunately, this proved to be true only until 1830, when the Italian investigator,Melloni, made his great discovery that naturally occurring rock salt (NaCl) – which wasavailable in large enough natural crystals to be made into lenses and prisms – is remark-ably transparent to the infrared. The result was that rock salt became the principal infra-red optical material, and remained so for the next hundred years, until the art of syntheticcrystal growing was mastered in the 1930’s.
Figure 18.3 Macedonio Melloni (1798–1854)
Thermometers, as radiation detectors, remained unchallenged until 1829, the year Nobiliinvented the thermocouple. (Herschel’s own thermometer could be read to 0.2 °C(0.036 °F), and later models were able to be read to 0.05 °C (0.09 °F)). Then a break-through occurred; Melloni connected a number of thermocouples in series to form thefirst thermopile. The new device was at least 40 times as sensitive as the best thermome-ter of the day for detecting heat radiation – capable of detecting the heat from a personstanding three meters away.
The first so-called ‘heat-picture’ became possible in 1840, the result of work by Sir JohnHerschel, son of the discoverer of the infrared and a famous astronomer in his own right.Based upon the differential evaporation of a thin film of oil when exposed to a heat pat-tern focused upon it, the thermal image could be seen by reflected light where the inter-ference effects of the oil film made the image visible to the eye. Sir John also managedto obtain a primitive record of the thermal image on paper, which he called a‘thermograph’.
#T810252; r. AD/43675/43696; en-US 54
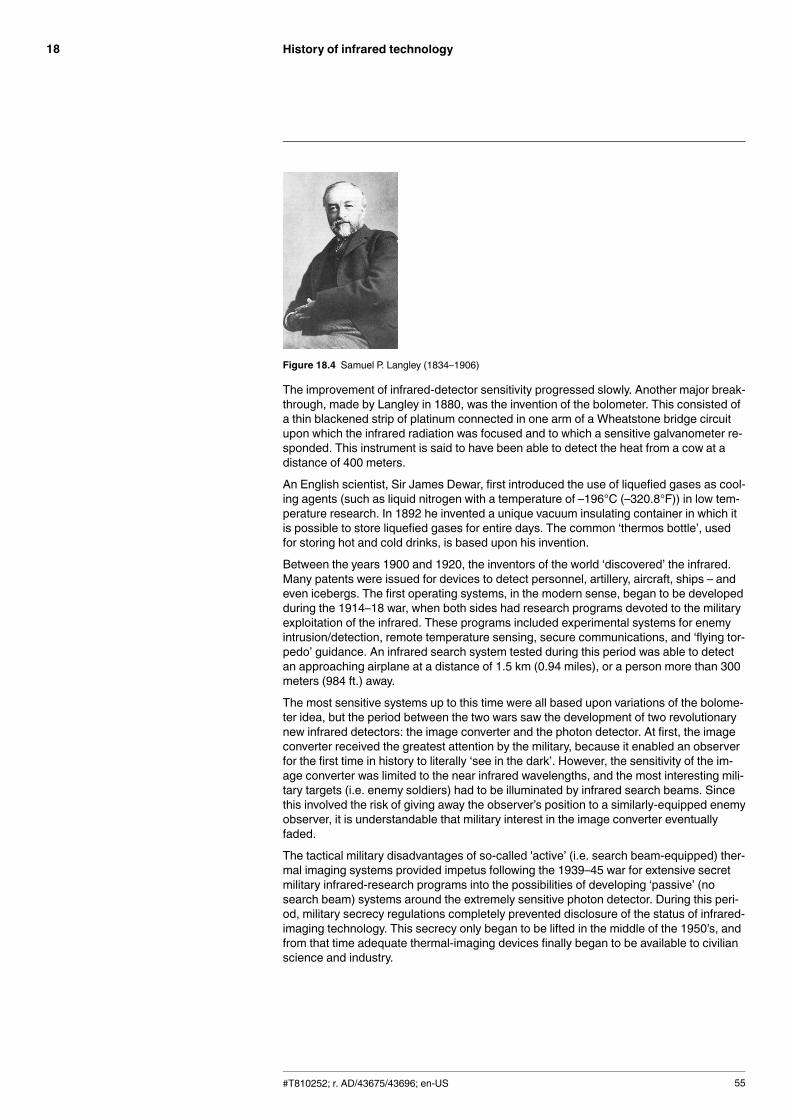
History of infrared technology18
Figure 18.4 Samuel P. Langley (1834–1906)
The improvement of infrared-detector sensitivity progressed slowly. Another major break-through, made by Langley in 1880, was the invention of the bolometer. This consisted ofa thin blackened strip of platinum connected in one arm of a Wheatstone bridge circuitupon which the infrared radiation was focused and to which a sensitive galvanometer re-sponded. This instrument is said to have been able to detect the heat from a cow at adistance of 400 meters.
An English scientist, Sir James Dewar, first introduced the use of liquefied gases as cool-ing agents (such as liquid nitrogen with a temperature of –196°C (–320.8°F)) in low tem-perature research. In 1892 he invented a unique vacuum insulating container in which itis possible to store liquefied gases for entire days. The common ‘thermos bottle’, usedfor storing hot and cold drinks, is based upon his invention.
Between the years 1900 and 1920, the inventors of the world ‘discovered’ the infrared.Many patents were issued for devices to detect personnel, artillery, aircraft, ships – andeven icebergs. The first operating systems, in the modern sense, began to be developedduring the 1914–18 war, when both sides had research programs devoted to the militaryexploitation of the infrared. These programs included experimental systems for enemyintrusion/detection, remote temperature sensing, secure communications, and ‘flying tor-pedo’ guidance. An infrared search system tested during this period was able to detectan approaching airplane at a distance of 1.5 km (0.94 miles), or a person more than 300meters (984 ft.) away.
The most sensitive systems up to this time were all based upon variations of the bolome-ter idea, but the period between the two wars saw the development of two revolutionarynew infrared detectors: the image converter and the photon detector. At first, the imageconverter received the greatest attention by the military, because it enabled an observerfor the first time in history to literally ‘see in the dark’. However, the sensitivity of the im-age converter was limited to the near infrared wavelengths, and the most interesting mili-tary targets (i.e. enemy soldiers) had to be illuminated by infrared search beams. Sincethis involved the risk of giving away the observer’s position to a similarly-equipped enemyobserver, it is understandable that military interest in the image converter eventuallyfaded.
The tactical military disadvantages of so-called 'active’ (i.e. search beam-equipped) ther-mal imaging systems provided impetus following the 1939–45 war for extensive secretmilitary infrared-research programs into the possibilities of developing ‘passive’ (nosearch beam) systems around the extremely sensitive photon detector. During this peri-od, military secrecy regulations completely prevented disclosure of the status of infrared-imaging technology. This secrecy only began to be lifted in the middle of the 1950’s, andfrom that time adequate thermal-imaging devices finally began to be available to civilianscience and industry.
#T810252; r. AD/43675/43696; en-US 55
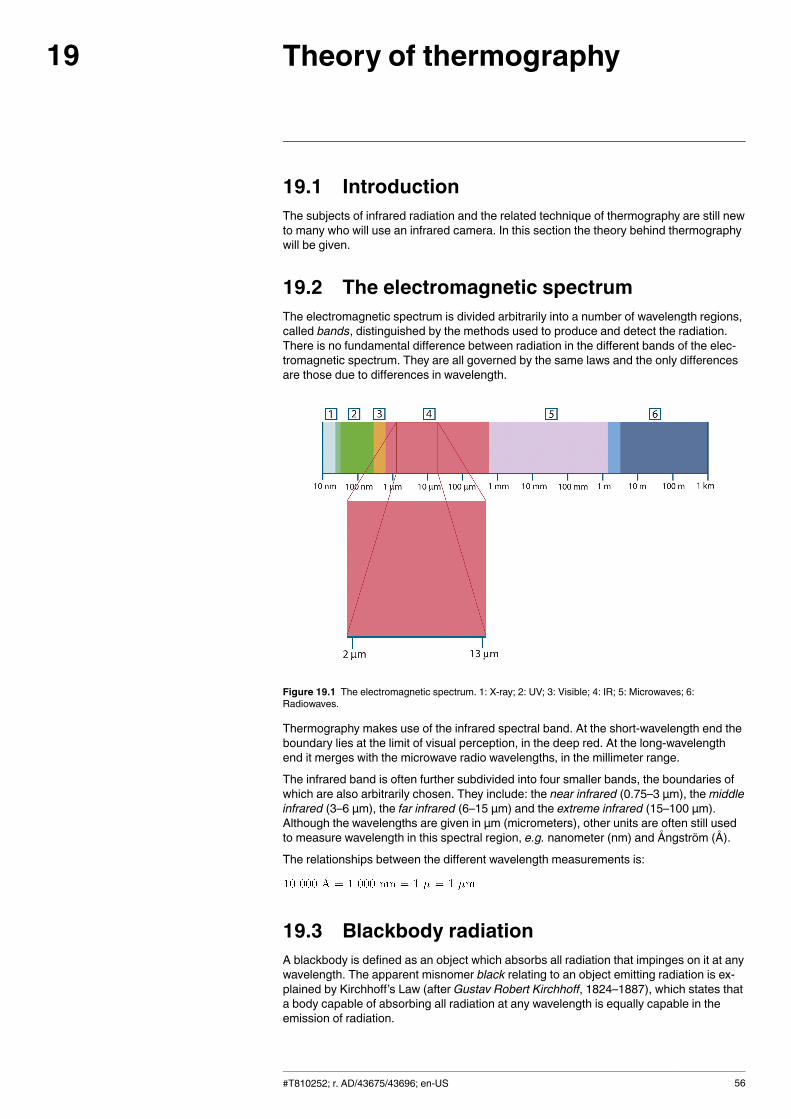
Theory of thermography19
19.1 IntroductionThe subjects of infrared radiation and the related technique of thermography are still newto many who will use an infrared camera. In this section the theory behind thermographywill be given.
19.2 The electromagnetic spectrumThe electromagnetic spectrum is divided arbitrarily into a number of wavelength regions,called bands, distinguished by the methods used to produce and detect the radiation.There is no fundamental difference between radiation in the different bands of the elec-tromagnetic spectrum. They are all governed by the same laws and the only differencesare those due to differences in wavelength.
Figure 19.1 The electromagnetic spectrum. 1: X-ray; 2: UV; 3: Visible; 4: IR; 5: Microwaves; 6:Radiowaves.
Thermography makes use of the infrared spectral band. At the short-wavelength end theboundary lies at the limit of visual perception, in the deep red. At the long-wavelengthend it merges with the microwave radio wavelengths, in the millimeter range.
The infrared band is often further subdivided into four smaller bands, the boundaries ofwhich are also arbitrarily chosen. They include: the near infrared (0.75–3 μm), themiddleinfrared (3–6 μm), the far infrared (6–15 μm) and the extreme infrared (15–100 μm).Although the wavelengths are given in μm (micrometers), other units are often still usedto measure wavelength in this spectral region, e.g. nanometer (nm) and Ångström (Å).
The relationships between the different wavelength measurements is:
19.3 Blackbody radiationA blackbody is defined as an object which absorbs all radiation that impinges on it at anywavelength. The apparent misnomer black relating to an object emitting radiation is ex-plained by Kirchhoff’s Law (after Gustav Robert Kirchhoff, 1824–1887), which states thata body capable of absorbing all radiation at any wavelength is equally capable in theemission of radiation.
#T810252; r. AD/43675/43696; en-US 56
Theory of thermography19
Figure 19.2 Gustav Robert Kirchhoff (1824–1887)
The construction of a blackbody source is, in principle, very simple. The radiation charac-teristics of an aperture in an isotherm cavity made of an opaque absorbing material rep-resents almost exactly the properties of a blackbody. A practical application of theprinciple to the construction of a perfect absorber of radiation consists of a box that islight tight except for an aperture in one of the sides. Any radiation which then enters thehole is scattered and absorbed by repeated reflections so only an infinitesimal fractioncan possibly escape. The blackness which is obtained at the aperture is nearly equal toa blackbody and almost perfect for all wavelengths.
By providing such an isothermal cavity with a suitable heater it becomes what is termeda cavity radiator. An isothermal cavity heated to a uniform temperature generates black-body radiation, the characteristics of which are determined solely by the temperature ofthe cavity. Such cavity radiators are commonly used as sources of radiation in tempera-ture reference standards in the laboratory for calibrating thermographic instruments,such as a FLIR Systems camera for example.
If the temperature of blackbody radiation increases to more than 525°C (977°F), thesource begins to be visible so that it appears to the eye no longer black. This is the incipi-ent red heat temperature of the radiator, which then becomes orange or yellow as thetemperature increases further. In fact, the definition of the so-called color temperature ofan object is the temperature to which a blackbody would have to be heated to have thesame appearance.
Now consider three expressions that describe the radiation emitted from a blackbody.
19.3.1 Planck’s law
Figure 19.3 Max Planck (1858–1947)
Max Planck (1858–1947) was able to describe the spectral distribution of the radiationfrom a blackbody by means of the following formula:
#T810252; r. AD/43675/43696; en-US 57
Theory of thermography19
where:Wλb Blackbody spectral radiant emittance at wavelength λ.
c Velocity of light = 3 × 10⁸ m/s
h Planck’s constant = 6.6 × 10⁻³⁴ Joule sec.
k Boltzmann’s constant = 1.4 × 10⁻²³ Joule/K.
T Absolute temperature (K) of a blackbody.
λ Wavelength (μm).
Note The factor 10-6 is used since spectral emittance in the curves is expressed inWatt/m2, μm.Planck’s formula, when plotted graphically for various temperatures, produces a family ofcurves. Following any particular Planck curve, the spectral emittance is zero at λ = 0,then increases rapidly to a maximum at a wavelength λmax and after passing it ap-proaches zero again at very long wavelengths. The higher the temperature, the shorterthe wavelength at which maximum occurs.
Figure 19.4 Blackbody spectral radiant emittance according to Planck’s law, plotted for various absolutetemperatures. 1: Spectral radiant emittance (W/cm2 × 103(μm)); 2: Wavelength (μm)
19.3.2 Wien’s displacement law
By differentiating Planck’s formula with respect to λ, and finding the maximum, we have:
This is Wien’s formula (afterWilhelm Wien, 1864–1928), which expresses mathemati-cally the common observation that colors vary from red to orange or yellow as the tem-perature of a thermal radiator increases. The wavelength of the color is the same as thewavelength calculated for λmax. A good approximation of the value of λmax for a givenblackbody temperature is obtained by applying the rule-of-thumb 3 000/T μm. Thus, avery hot star such as Sirius (11 000 K), emitting bluish-white light, radiates with the peakof spectral radiant emittance occurring within the invisible ultraviolet spectrum, at wave-length 0.27 μm.
#T810252; r. AD/43675/43696; en-US 58
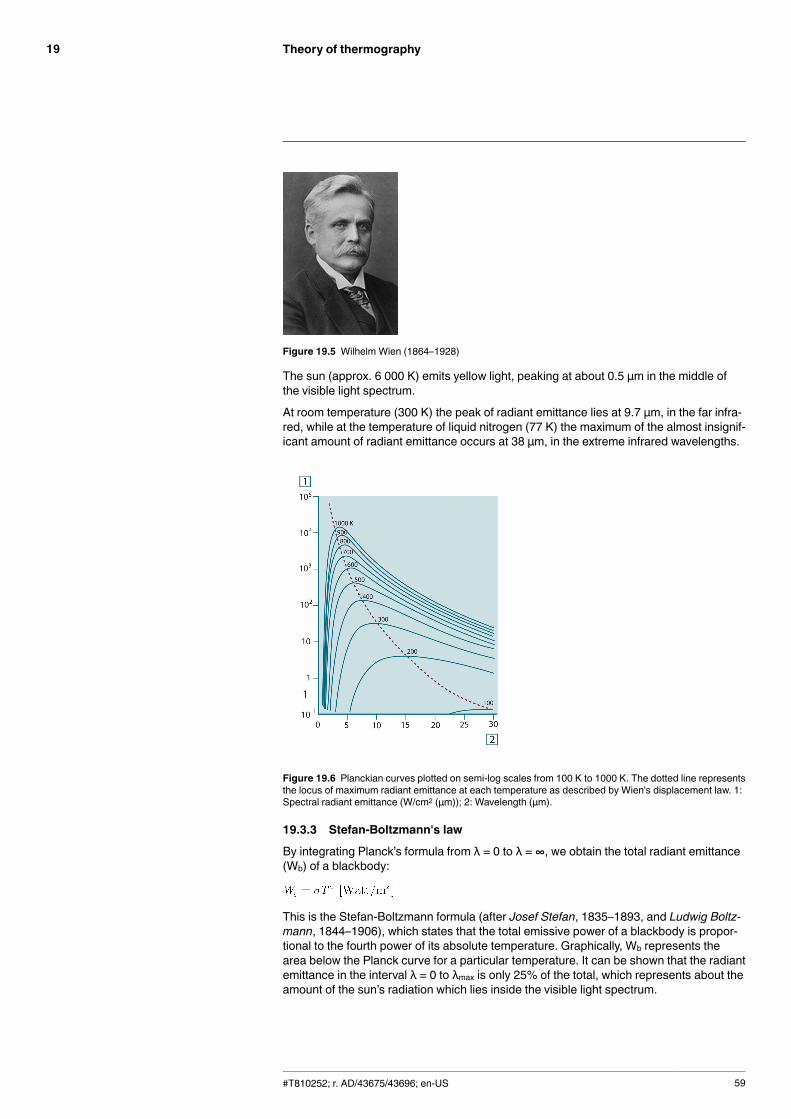
Theory of thermography19
Figure 19.5 Wilhelm Wien (1864–1928)
The sun (approx. 6 000 K) emits yellow light, peaking at about 0.5 μm in the middle ofthe visible light spectrum.
At room temperature (300 K) the peak of radiant emittance lies at 9.7 μm, in the far infra-red, while at the temperature of liquid nitrogen (77 K) the maximum of the almost insignif-icant amount of radiant emittance occurs at 38 μm, in the extreme infrared wavelengths.
Figure 19.6 Planckian curves plotted on semi-log scales from 100 K to 1000 K. The dotted line representsthe locus of maximum radiant emittance at each temperature as described by Wien's displacement law. 1:Spectral radiant emittance (W/cm2 (μm)); 2: Wavelength (μm).
19.3.3 Stefan-Boltzmann's law
By integrating Planck’s formula from λ = 0 to λ = ∞, we obtain the total radiant emittance(Wb) of a blackbody:
This is the Stefan-Boltzmann formula (after Josef Stefan, 1835–1893, and Ludwig Boltz-mann, 1844–1906), which states that the total emissive power of a blackbody is propor-tional to the fourth power of its absolute temperature. Graphically, Wb represents thearea below the Planck curve for a particular temperature. It can be shown that the radiantemittance in the interval λ = 0 to λmax is only 25% of the total, which represents about theamount of the sun’s radiation which lies inside the visible light spectrum.
#T810252; r. AD/43675/43696; en-US 59
Theory of thermography19
Figure 19.7 Josef Stefan (1835–1893), and Ludwig Boltzmann (1844–1906)
Using the Stefan-Boltzmann formula to calculate the power radiated by the human body,at a temperature of 300 K and an external surface area of approx. 2 m2, we obtain 1 kW.This power loss could not be sustained if it were not for the compensating absorption ofradiation from surrounding surfaces, at room temperatures which do not vary too drasti-cally from the temperature of the body – or, of course, the addition of clothing.
19.3.4 Non-blackbody emitters
So far, only blackbody radiators and blackbody radiation have been discussed. However,real objects almost never comply with these laws over an extended wavelength region –although they may approach the blackbody behavior in certain spectral intervals. For ex-ample, a certain type of white paint may appear perfectly white in the visible light spec-trum, but becomes distinctly gray at about 2 μm, and beyond 3 μm it is almost black.
There are three processes which can occur that prevent a real object from acting like ablackbody: a fraction of the incident radiation α may be absorbed, a fraction ρ may be re-flected, and a fraction τ may be transmitted. Since all of these factors are more or lesswavelength dependent, the subscript λ is used to imply the spectral dependence of theirdefinitions. Thus:
• The spectral absorptance αλ= the ratio of the spectral radiant power absorbed by anobject to that incident upon it.
• The spectral reflectance ρλ = the ratio of the spectral radiant power reflected by an ob-ject to that incident upon it.
• The spectral transmittance τλ = the ratio of the spectral radiant power transmittedthrough an object to that incident upon it.
The sum of these three factors must always add up to the whole at any wavelength, sowe have the relation:
For opaque materials τλ = 0 and the relation simplifies to:
Another factor, called the emissivity, is required to describe the fraction ε of the radiantemittance of a blackbody produced by an object at a specific temperature. Thus, wehave the definition:
The spectral emissivity ελ= the ratio of the spectral radiant power from an object to thatfrom a blackbody at the same temperature and wavelength.
Expressed mathematically, this can be written as the ratio of the spectral emittance ofthe object to that of a blackbody as follows:
Generally speaking, there are three types of radiation source, distinguished by the waysin which the spectral emittance of each varies with wavelength.
• A blackbody, for which ελ = ε = 1• A graybody, for which ελ = ε = constant less than 1
#T810252; r. AD/43675/43696; en-US 60
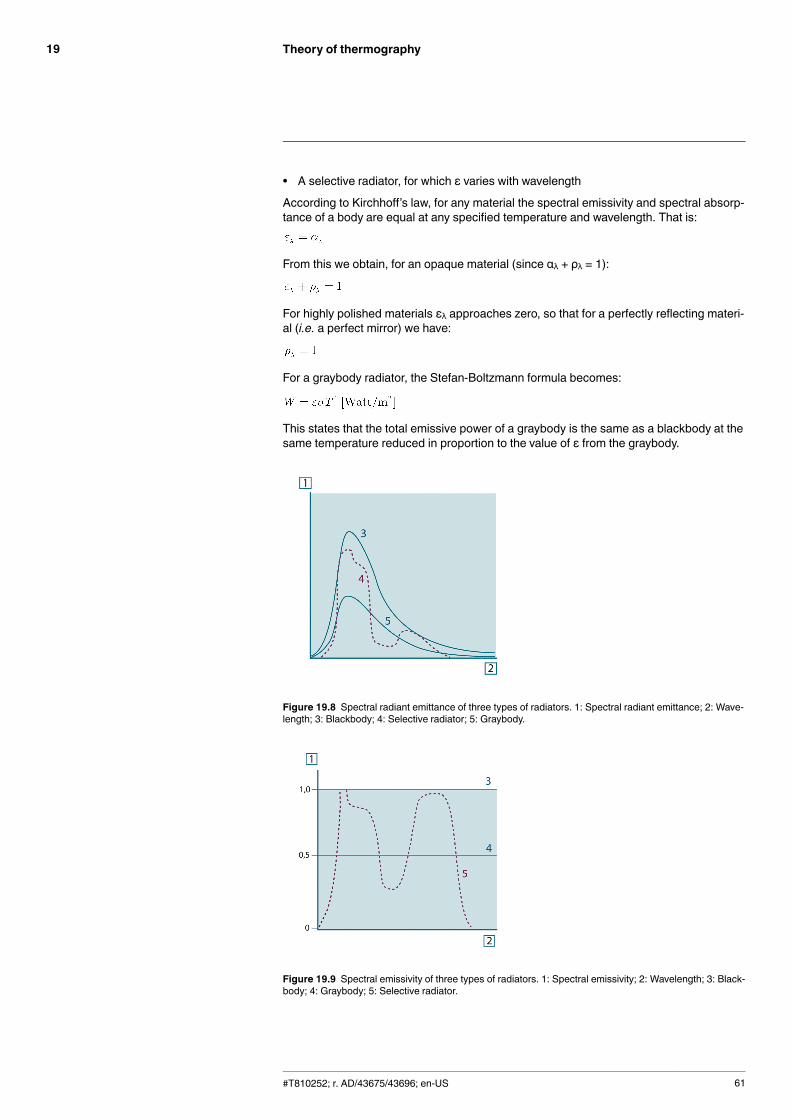
Theory of thermography19
• A selective radiator, for which ε varies with wavelength
According to Kirchhoff’s law, for any material the spectral emissivity and spectral absorp-tance of a body are equal at any specified temperature and wavelength. That is:
From this we obtain, for an opaque material (since αλ + ρλ = 1):
For highly polished materials ελ approaches zero, so that for a perfectly reflecting materi-al (i.e. a perfect mirror) we have:
For a graybody radiator, the Stefan-Boltzmann formula becomes:
This states that the total emissive power of a graybody is the same as a blackbody at thesame temperature reduced in proportion to the value of ε from the graybody.
Figure 19.8 Spectral radiant emittance of three types of radiators. 1: Spectral radiant emittance; 2: Wave-length; 3: Blackbody; 4: Selective radiator; 5: Graybody.
Figure 19.9 Spectral emissivity of three types of radiators. 1: Spectral emissivity; 2: Wavelength; 3: Black-body; 4: Graybody; 5: Selective radiator.
#T810252; r. AD/43675/43696; en-US 61
Theory of thermography19
19.4 Infrared semi-transparent materialsConsider now a non-metallic, semi-transparent body – let us say, in the form of a thick flatplate of plastic material. When the plate is heated, radiation generated within its volumemust work its way toward the surfaces through the material in which it is partially ab-sorbed. Moreover, when it arrives at the surface, some of it is reflected back into the inte-rior. The back-reflected radiation is again partially absorbed, but some of it arrives at theother surface, through which most of it escapes; part of it is reflected back again.Although the progressive reflections become weaker and weaker they must all be addedup when the total emittance of the plate is sought. When the resulting geometrical seriesis summed, the effective emissivity of a semi-transparent plate is obtained as:
When the plate becomes opaque this formula is reduced to the single formula:
This last relation is a particularly convenient one, because it is often easier to measurereflectance than to measure emissivity directly.
#T810252; r. AD/43675/43696; en-US 62
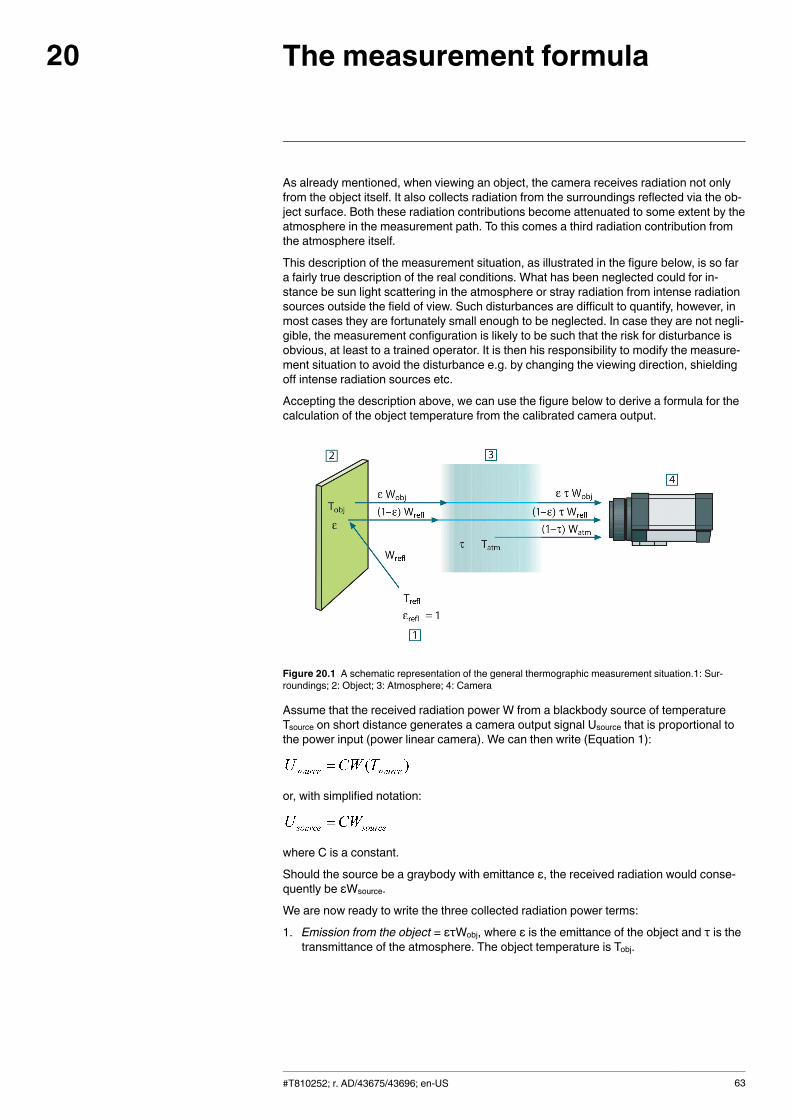
The measurement formula20
As already mentioned, when viewing an object, the camera receives radiation not onlyfrom the object itself. It also collects radiation from the surroundings reflected via the ob-ject surface. Both these radiation contributions become attenuated to some extent by theatmosphere in the measurement path. To this comes a third radiation contribution fromthe atmosphere itself.
This description of the measurement situation, as illustrated in the figure below, is so fara fairly true description of the real conditions. What has been neglected could for in-stance be sun light scattering in the atmosphere or stray radiation from intense radiationsources outside the field of view. Such disturbances are difficult to quantify, however, inmost cases they are fortunately small enough to be neglected. In case they are not negli-gible, the measurement configuration is likely to be such that the risk for disturbance isobvious, at least to a trained operator. It is then his responsibility to modify the measure-ment situation to avoid the disturbance e.g. by changing the viewing direction, shieldingoff intense radiation sources etc.
Accepting the description above, we can use the figure below to derive a formula for thecalculation of the object temperature from the calibrated camera output.
Figure 20.1 A schematic representation of the general thermographic measurement situation.1: Sur-roundings; 2: Object; 3: Atmosphere; 4: Camera
Assume that the received radiation power W from a blackbody source of temperatureTsource on short distance generates a camera output signal Usource that is proportional tothe power input (power linear camera). We can then write (Equation 1):
or, with simplified notation:
where C is a constant.
Should the source be a graybody with emittance ε, the received radiation would conse-quently be εWsource.
We are now ready to write the three collected radiation power terms:
1. Emission from the object = ετWobj, where ε is the emittance of the object and τ is thetransmittance of the atmosphere. The object temperature is Tobj.
#T810252; r. AD/43675/43696; en-US 63
The measurement formula20
2. Reflected emission from ambient sources = (1 – ε)τWrefl, where (1 – ε) is the reflec-tance of the object. The ambient sources have the temperature Trefl.It has here been assumed that the temperature Trefl is the same for all emitting surfa-ces within the halfsphere seen from a point on the object surface. This is of coursesometimes a simplification of the true situation. It is, however, a necessary simplifica-tion in order to derive a workable formula, and Trefl can – at least theoretically – be giv-en a value that represents an efficient temperature of a complex surrounding.
Note also that we have assumed that the emittance for the surroundings = 1. This iscorrect in accordance with Kirchhoff’s law: All radiation impinging on the surroundingsurfaces will eventually be absorbed by the same surfaces. Thus the emittance = 1.(Note though that the latest discussion requires the complete sphere around the ob-ject to be considered.)
3. Emission from the atmosphere = (1 – τ)τWatm, where (1 – τ) is the emittance of the at-mosphere. The temperature of the atmosphere is Tatm.
The total received radiation power can now be written (Equation 2):
We multiply each term by the constant C of Equation 1 and replace the CW products bythe corresponding U according to the same equation, and get (Equation 3):
Solve Equation 3 for Uobj (Equation 4):
This is the general measurement formula used in all the FLIR Systems thermographicequipment. The voltages of the formula are:Table 20.1 Voltages
Uobj Calculated camera output voltage for a blackbody of temperatureTobj i.e. a voltage that can be directly converted into true requestedobject temperature.
Utot Measured camera output voltage for the actual case.
Urefl Theoretical camera output voltage for a blackbody of temperatureTrefl according to the calibration.
Uatm Theoretical camera output voltage for a blackbody of temperatureTatm according to the calibration.
The operator has to supply a number of parameter values for the calculation:
• the object emittance ε,• the relative humidity,• Tatm• object distance (Dobj)• the (effective) temperature of the object surroundings, or the reflected ambient tem-perature Trefl, and
• the temperature of the atmosphere TatmThis task could sometimes be a heavy burden for the operator since there are normallyno easy ways to find accurate values of emittance and atmospheric transmittance for theactual case. The two temperatures are normally less of a problem provided the surround-ings do not contain large and intense radiation sources.
A natural question in this connection is: How important is it to know the right values ofthese parameters? It could though be of interest to get a feeling for this problem alreadyhere by looking into some different measurement cases and compare the relative
#T810252; r. AD/43675/43696; en-US 64
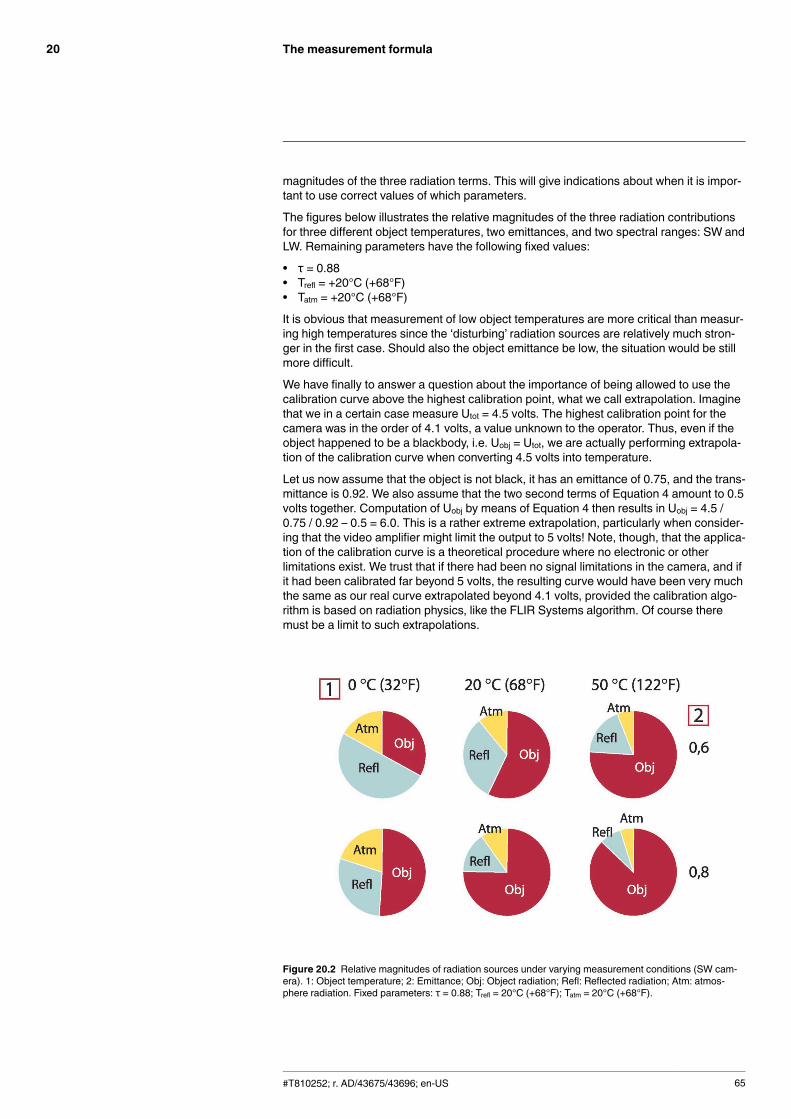
The measurement formula20
magnitudes of the three radiation terms. This will give indications about when it is impor-tant to use correct values of which parameters.
The figures below illustrates the relative magnitudes of the three radiation contributionsfor three different object temperatures, two emittances, and two spectral ranges: SW andLW. Remaining parameters have the following fixed values:
• τ = 0.88• Trefl = +20°C (+68°F)• Tatm = +20°C (+68°F)
It is obvious that measurement of low object temperatures are more critical than measur-ing high temperatures since the ‘disturbing’ radiation sources are relatively much stron-ger in the first case. Should also the object emittance be low, the situation would be stillmore difficult.
We have finally to answer a question about the importance of being allowed to use thecalibration curve above the highest calibration point, what we call extrapolation. Imaginethat we in a certain case measure Utot = 4.5 volts. The highest calibration point for thecamera was in the order of 4.1 volts, a value unknown to the operator. Thus, even if theobject happened to be a blackbody, i.e. Uobj = Utot, we are actually performing extrapola-tion of the calibration curve when converting 4.5 volts into temperature.
Let us now assume that the object is not black, it has an emittance of 0.75, and the trans-mittance is 0.92. We also assume that the two second terms of Equation 4 amount to 0.5volts together. Computation of Uobj by means of Equation 4 then results in Uobj = 4.5 /0.75 / 0.92 – 0.5 = 6.0. This is a rather extreme extrapolation, particularly when consider-ing that the video amplifier might limit the output to 5 volts! Note, though, that the applica-tion of the calibration curve is a theoretical procedure where no electronic or otherlimitations exist. We trust that if there had been no signal limitations in the camera, and ifit had been calibrated far beyond 5 volts, the resulting curve would have been very muchthe same as our real curve extrapolated beyond 4.1 volts, provided the calibration algo-rithm is based on radiation physics, like the FLIR Systems algorithm. Of course theremust be a limit to such extrapolations.
Figure 20.2 Relative magnitudes of radiation sources under varying measurement conditions (SW cam-era). 1: Object temperature; 2: Emittance; Obj: Object radiation; Refl: Reflected radiation; Atm: atmos-phere radiation. Fixed parameters: τ = 0.88; Trefl = 20°C (+68°F); Tatm = 20°C (+68°F).
#T810252; r. AD/43675/43696; en-US 65
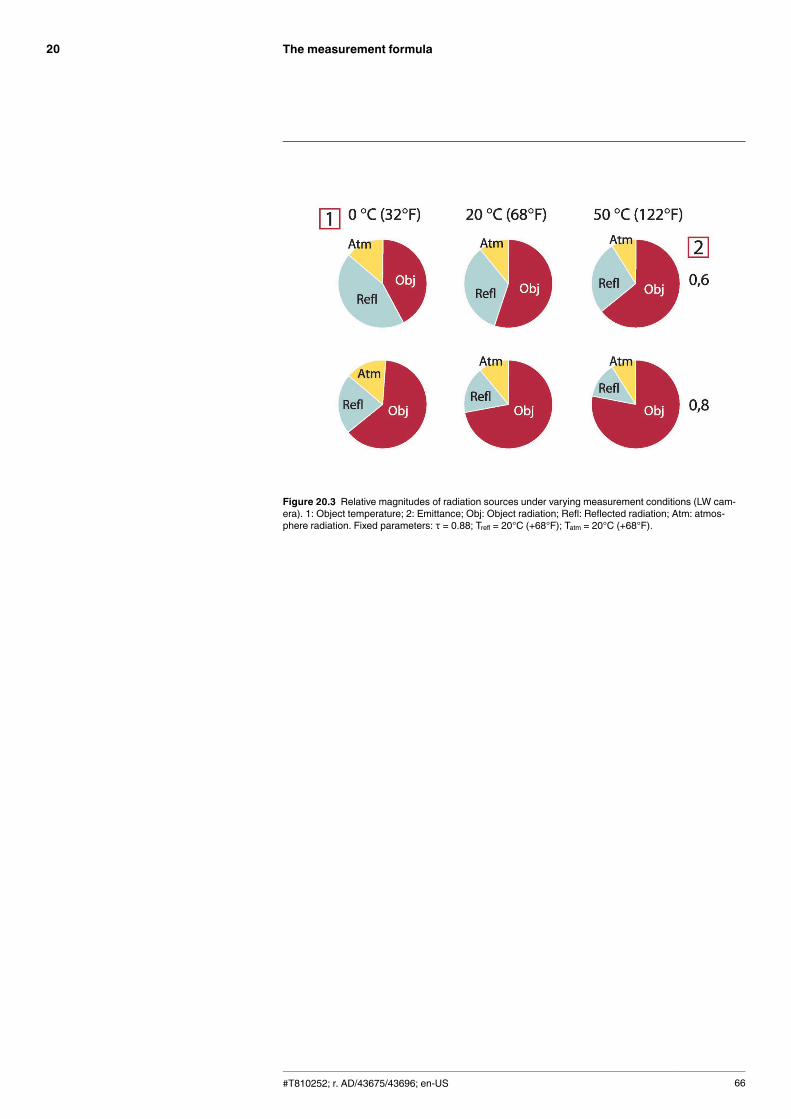
The measurement formula20
Figure 20.3 Relative magnitudes of radiation sources under varying measurement conditions (LW cam-era). 1: Object temperature; 2: Emittance; Obj: Object radiation; Refl: Reflected radiation; Atm: atmos-phere radiation. Fixed parameters: τ = 0.88; Trefl = 20°C (+68°F); Tatm = 20°C (+68°F).
#T810252; r. AD/43675/43696; en-US 66
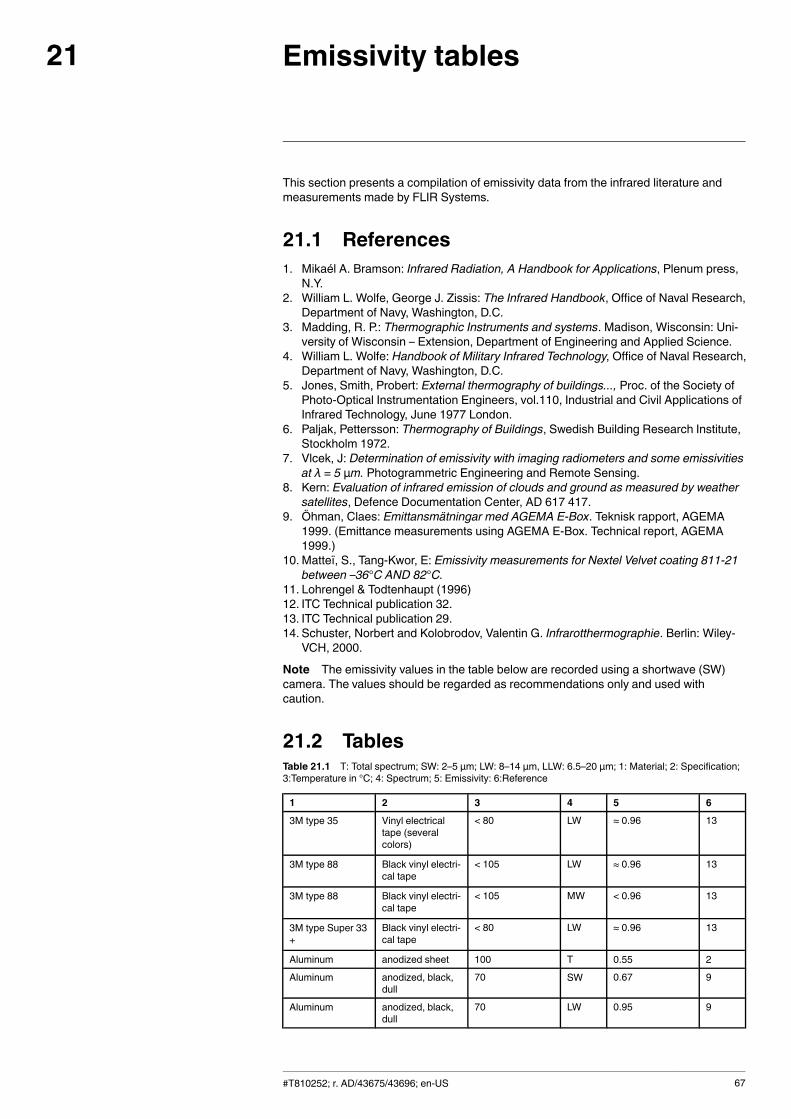
Emissivity tables21
This section presents a compilation of emissivity data from the infrared literature andmeasurements made by FLIR Systems.
21.1 References1. Mikaél A. Bramson: Infrared Radiation, A Handbook for Applications, Plenum press,
N.Y.2. William L. Wolfe, George J. Zissis: The Infrared Handbook, Office of Naval Research,
Department of Navy, Washington, D.C.3. Madding, R. P.: Thermographic Instruments and systems. Madison, Wisconsin: Uni-
versity of Wisconsin – Extension, Department of Engineering and Applied Science.4. William L. Wolfe: Handbook of Military Infrared Technology, Office of Naval Research,
Department of Navy, Washington, D.C.5. Jones, Smith, Probert: External thermography of buildings..., Proc. of the Society of
Photo-Optical Instrumentation Engineers, vol.110, Industrial and Civil Applications ofInfrared Technology, June 1977 London.
6. Paljak, Pettersson: Thermography of Buildings, Swedish Building Research Institute,Stockholm 1972.
7. Vlcek, J: Determination of emissivity with imaging radiometers and some emissivitiesat λ = 5 µm. Photogrammetric Engineering and Remote Sensing.
8. Kern: Evaluation of infrared emission of clouds and ground as measured by weathersatellites, Defence Documentation Center, AD 617 417.
9. Öhman, Claes: Emittansmätningar med AGEMA E-Box. Teknisk rapport, AGEMA1999. (Emittance measurements using AGEMA E-Box. Technical report, AGEMA1999.)
10. Matteï, S., Tang-Kwor, E: Emissivity measurements for Nextel Velvet coating 811-21between –36°C AND 82°C.
11. Lohrengel & Todtenhaupt (1996)12. ITC Technical publication 32.13. ITC Technical publication 29.14. Schuster, Norbert and Kolobrodov, Valentin G. Infrarotthermographie. Berlin: Wiley-
VCH, 2000.
Note The emissivity values in the table below are recorded using a shortwave (SW)camera. The values should be regarded as recommendations only and used withcaution.
21.2 TablesTable 21.1 T: Total spectrum; SW: 2–5 µm; LW: 8–14 µm, LLW: 6.5–20 µm; 1: Material; 2: Specification;3:Temperature in °C; 4: Spectrum; 5: Emissivity: 6:Reference
1 2 3 4 5 6
3M type 35 Vinyl electricaltape (severalcolors)
< 80 LW ≈ 0.96 13
3M type 88 Black vinyl electri-cal tape
< 105 LW ≈ 0.96 13
3M type 88 Black vinyl electri-cal tape
< 105 MW < 0.96 13
3M type Super 33+
Black vinyl electri-cal tape
< 80 LW ≈ 0.96 13
Aluminum anodized sheet 100 T 0.55 2
Aluminum anodized, black,dull
70 SW 0.67 9
Aluminum anodized, black,dull
70 LW 0.95 9
#T810252; r. AD/43675/43696; en-US 67
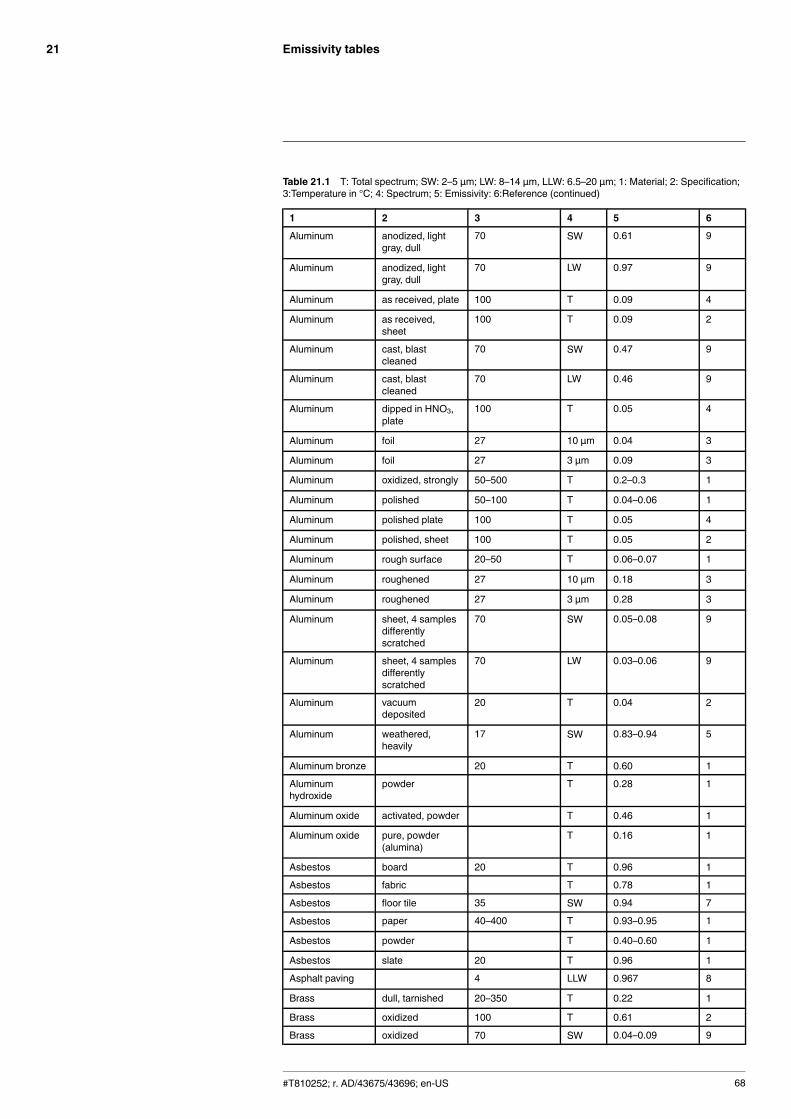
Emissivity tables21
Table 21.1 T: Total spectrum; SW: 2–5 µm; LW: 8–14 µm, LLW: 6.5–20 µm; 1: Material; 2: Specification;3:Temperature in °C; 4: Spectrum; 5: Emissivity: 6:Reference (continued)
1 2 3 4 5 6
Aluminum anodized, lightgray, dull
70 SW 0.61 9
Aluminum anodized, lightgray, dull
70 LW 0.97 9
Aluminum as received, plate 100 T 0.09 4
Aluminum as received,sheet
100 T 0.09 2
Aluminum cast, blastcleaned
70 SW 0.47 9
Aluminum cast, blastcleaned
70 LW 0.46 9
Aluminum dipped in HNO3,plate
100 T 0.05 4
Aluminum foil 27 10 µm 0.04 3
Aluminum foil 27 3 µm 0.09 3
Aluminum oxidized, strongly 50–500 T 0.2–0.3 1
Aluminum polished 50–100 T 0.04–0.06 1
Aluminum polished plate 100 T 0.05 4
Aluminum polished, sheet 100 T 0.05 2
Aluminum rough surface 20–50 T 0.06–0.07 1
Aluminum roughened 27 10 µm 0.18 3
Aluminum roughened 27 3 µm 0.28 3
Aluminum sheet, 4 samplesdifferentlyscratched
70 SW 0.05–0.08 9
Aluminum sheet, 4 samplesdifferentlyscratched
70 LW 0.03–0.06 9
Aluminum vacuumdeposited
20 T 0.04 2
Aluminum weathered,heavily
17 SW 0.83–0.94 5
Aluminum bronze 20 T 0.60 1
Aluminumhydroxide
powder T 0.28 1
Aluminum oxide activated, powder T 0.46 1
Aluminum oxide pure, powder(alumina)
T 0.16 1
Asbestos board 20 T 0.96 1
Asbestos fabric T 0.78 1
Asbestos floor tile 35 SW 0.94 7
Asbestos paper 40–400 T 0.93–0.95 1
Asbestos powder T 0.40–0.60 1
Asbestos slate 20 T 0.96 1
Asphalt paving 4 LLW 0.967 8
Brass dull, tarnished 20–350 T 0.22 1
Brass oxidized 100 T 0.61 2
Brass oxidized 70 SW 0.04–0.09 9
#T810252; r. AD/43675/43696; en-US 68
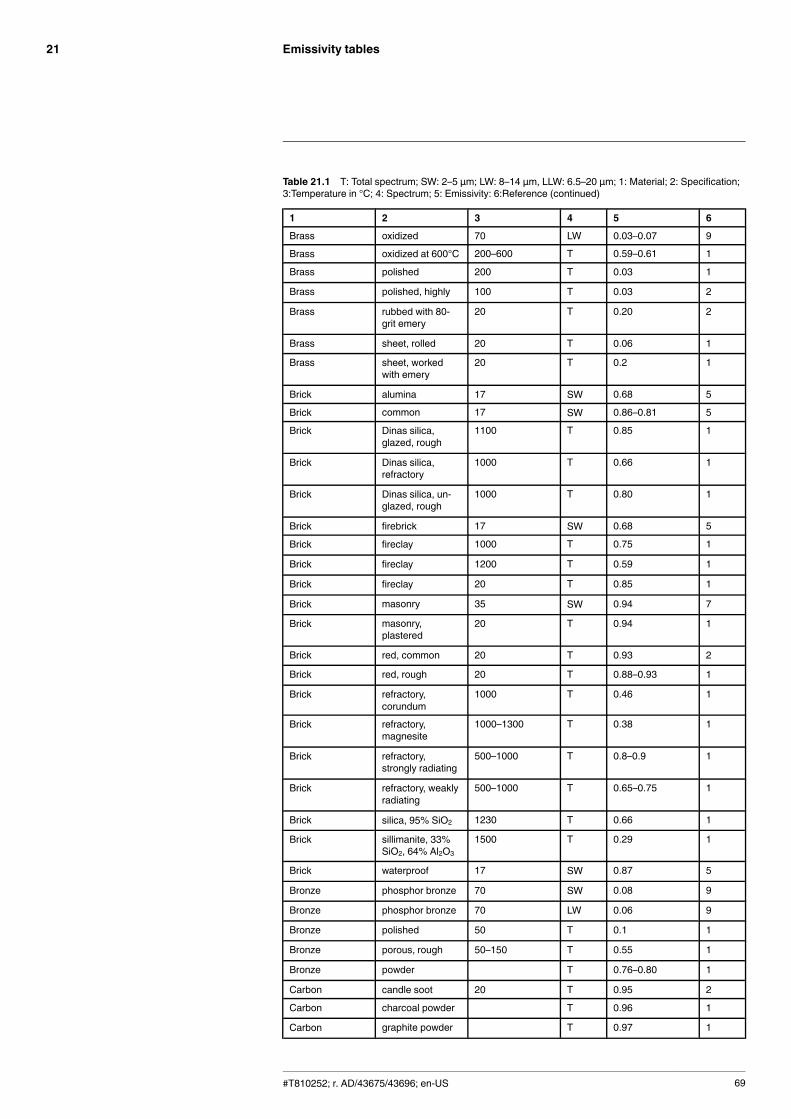
Emissivity tables21
Table 21.1 T: Total spectrum; SW: 2–5 µm; LW: 8–14 µm, LLW: 6.5–20 µm; 1: Material; 2: Specification;3:Temperature in °C; 4: Spectrum; 5: Emissivity: 6:Reference (continued)
1 2 3 4 5 6
Brass oxidized 70 LW 0.03–0.07 9
Brass oxidized at 600°C 200–600 T 0.59–0.61 1
Brass polished 200 T 0.03 1
Brass polished, highly 100 T 0.03 2
Brass rubbed with 80-grit emery
20 T 0.20 2
Brass sheet, rolled 20 T 0.06 1
Brass sheet, workedwith emery
20 T 0.2 1
Brick alumina 17 SW 0.68 5
Brick common 17 SW 0.86–0.81 5
Brick Dinas silica,glazed, rough
1100 T 0.85 1
Brick Dinas silica,refractory
1000 T 0.66 1
Brick Dinas silica, un-glazed, rough
1000 T 0.80 1
Brick firebrick 17 SW 0.68 5
Brick fireclay 1000 T 0.75 1
Brick fireclay 1200 T 0.59 1
Brick fireclay 20 T 0.85 1
Brick masonry 35 SW 0.94 7
Brick masonry,plastered
20 T 0.94 1
Brick red, common 20 T 0.93 2
Brick red, rough 20 T 0.88–0.93 1
Brick refractory,corundum
1000 T 0.46 1
Brick refractory,magnesite
1000–1300 T 0.38 1
Brick refractory,strongly radiating
500–1000 T 0.8–0.9 1
Brick refractory, weaklyradiating
500–1000 T 0.65–0.75 1
Brick silica, 95% SiO2 1230 T 0.66 1
Brick sillimanite, 33%SiO2, 64% Al2O3
1500 T 0.29 1
Brick waterproof 17 SW 0.87 5
Bronze phosphor bronze 70 SW 0.08 9
Bronze phosphor bronze 70 LW 0.06 9
Bronze polished 50 T 0.1 1
Bronze porous, rough 50–150 T 0.55 1
Bronze powder T 0.76–0.80 1
Carbon candle soot 20 T 0.95 2
Carbon charcoal powder T 0.96 1
Carbon graphite powder T 0.97 1
#T810252; r. AD/43675/43696; en-US 69
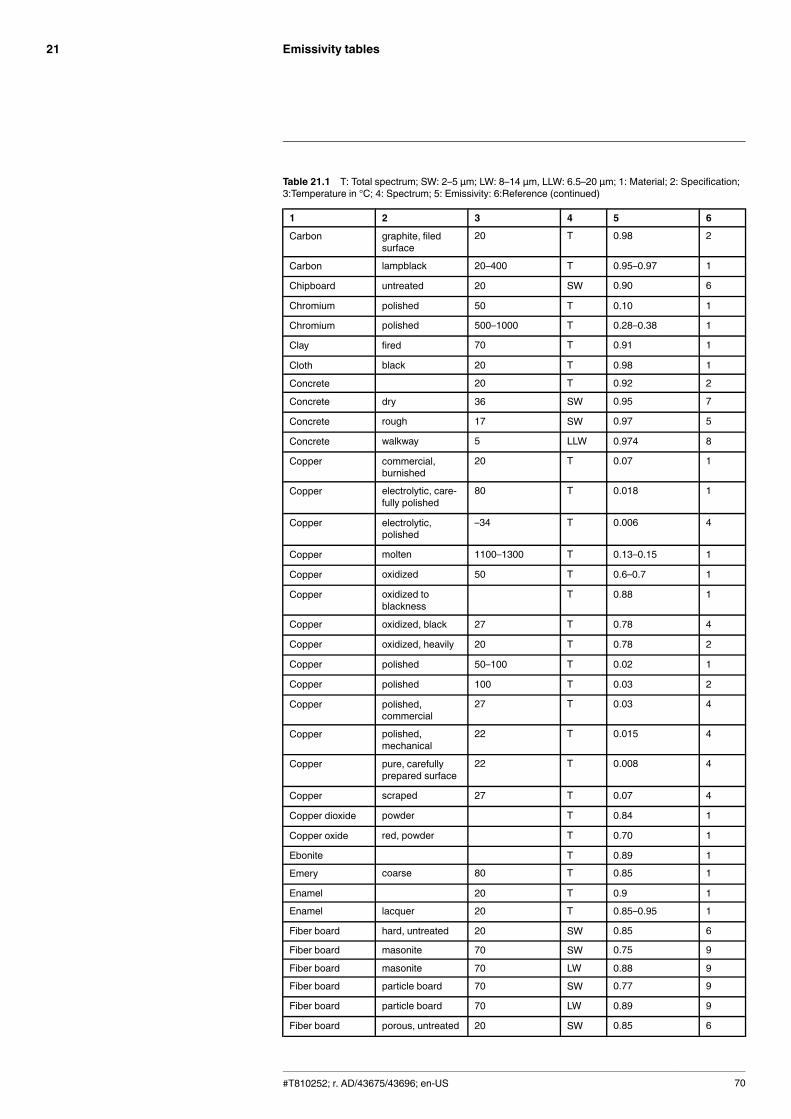
Emissivity tables21
Table 21.1 T: Total spectrum; SW: 2–5 µm; LW: 8–14 µm, LLW: 6.5–20 µm; 1: Material; 2: Specification;3:Temperature in °C; 4: Spectrum; 5: Emissivity: 6:Reference (continued)
1 2 3 4 5 6
Carbon graphite, filedsurface
20 T 0.98 2
Carbon lampblack 20–400 T 0.95–0.97 1
Chipboard untreated 20 SW 0.90 6
Chromium polished 50 T 0.10 1
Chromium polished 500–1000 T 0.28–0.38 1
Clay fired 70 T 0.91 1
Cloth black 20 T 0.98 1
Concrete 20 T 0.92 2
Concrete dry 36 SW 0.95 7
Concrete rough 17 SW 0.97 5
Concrete walkway 5 LLW 0.974 8
Copper commercial,burnished
20 T 0.07 1
Copper electrolytic, care-fully polished
80 T 0.018 1
Copper electrolytic,polished
–34 T 0.006 4
Copper molten 1100–1300 T 0.13–0.15 1
Copper oxidized 50 T 0.6–0.7 1
Copper oxidized toblackness
T 0.88 1
Copper oxidized, black 27 T 0.78 4
Copper oxidized, heavily 20 T 0.78 2
Copper polished 50–100 T 0.02 1
Copper polished 100 T 0.03 2
Copper polished,commercial
27 T 0.03 4
Copper polished,mechanical
22 T 0.015 4
Copper pure, carefullyprepared surface
22 T 0.008 4
Copper scraped 27 T 0.07 4
Copper dioxide powder T 0.84 1
Copper oxide red, powder T 0.70 1
Ebonite T 0.89 1
Emery coarse 80 T 0.85 1
Enamel 20 T 0.9 1
Enamel lacquer 20 T 0.85–0.95 1
Fiber board hard, untreated 20 SW 0.85 6
Fiber board masonite 70 SW 0.75 9
Fiber board masonite 70 LW 0.88 9
Fiber board particle board 70 SW 0.77 9
Fiber board particle board 70 LW 0.89 9
Fiber board porous, untreated 20 SW 0.85 6
#T810252; r. AD/43675/43696; en-US 70
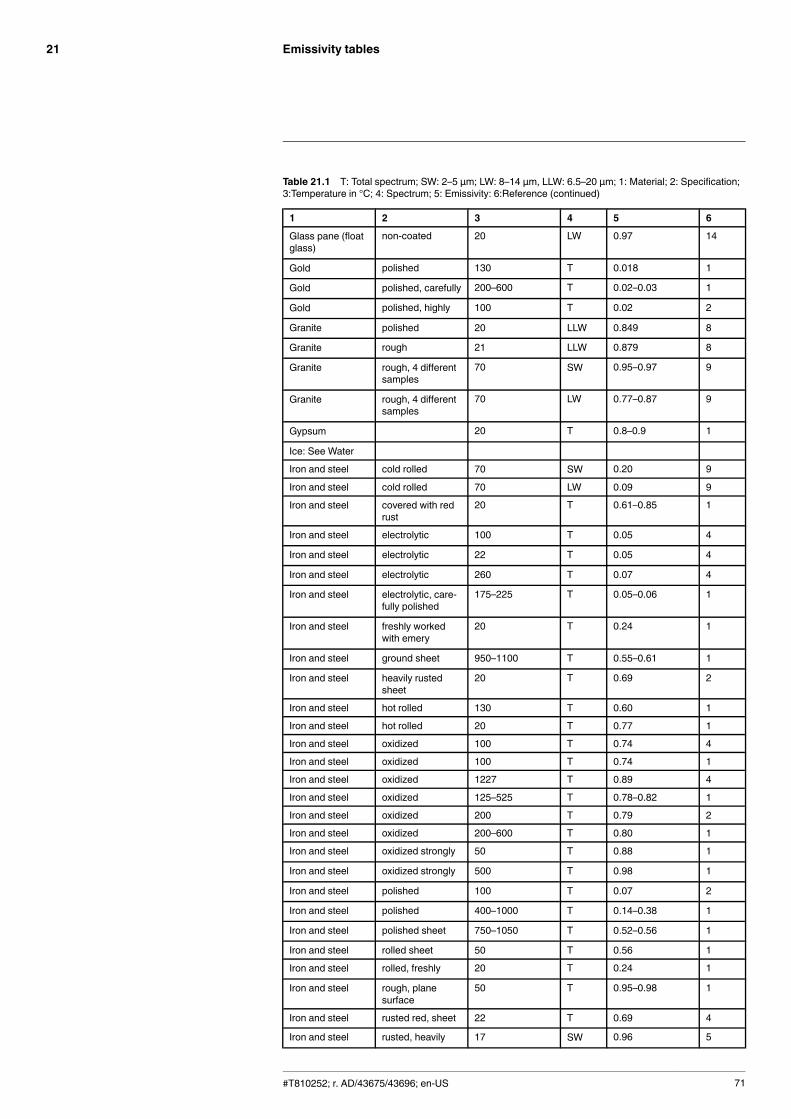
Emissivity tables21
Table 21.1 T: Total spectrum; SW: 2–5 µm; LW: 8–14 µm, LLW: 6.5–20 µm; 1: Material; 2: Specification;3:Temperature in °C; 4: Spectrum; 5: Emissivity: 6:Reference (continued)
1 2 3 4 5 6
Glass pane (floatglass)
non-coated 20 LW 0.97 14
Gold polished 130 T 0.018 1
Gold polished, carefully 200–600 T 0.02–0.03 1
Gold polished, highly 100 T 0.02 2
Granite polished 20 LLW 0.849 8
Granite rough 21 LLW 0.879 8
Granite rough, 4 differentsamples
70 SW 0.95–0.97 9
Granite rough, 4 differentsamples
70 LW 0.77–0.87 9
Gypsum 20 T 0.8–0.9 1
Ice: See Water
Iron and steel cold rolled 70 SW 0.20 9
Iron and steel cold rolled 70 LW 0.09 9
Iron and steel covered with redrust
20 T 0.61–0.85 1
Iron and steel electrolytic 100 T 0.05 4
Iron and steel electrolytic 22 T 0.05 4
Iron and steel electrolytic 260 T 0.07 4
Iron and steel electrolytic, care-fully polished
175–225 T 0.05–0.06 1
Iron and steel freshly workedwith emery
20 T 0.24 1
Iron and steel ground sheet 950–1100 T 0.55–0.61 1
Iron and steel heavily rustedsheet
20 T 0.69 2
Iron and steel hot rolled 130 T 0.60 1
Iron and steel hot rolled 20 T 0.77 1
Iron and steel oxidized 100 T 0.74 4
Iron and steel oxidized 100 T 0.74 1
Iron and steel oxidized 1227 T 0.89 4
Iron and steel oxidized 125–525 T 0.78–0.82 1
Iron and steel oxidized 200 T 0.79 2
Iron and steel oxidized 200–600 T 0.80 1
Iron and steel oxidized strongly 50 T 0.88 1
Iron and steel oxidized strongly 500 T 0.98 1
Iron and steel polished 100 T 0.07 2
Iron and steel polished 400–1000 T 0.14–0.38 1
Iron and steel polished sheet 750–1050 T 0.52–0.56 1
Iron and steel rolled sheet 50 T 0.56 1
Iron and steel rolled, freshly 20 T 0.24 1
Iron and steel rough, planesurface
50 T 0.95–0.98 1
Iron and steel rusted red, sheet 22 T 0.69 4
Iron and steel rusted, heavily 17 SW 0.96 5
#T810252; r. AD/43675/43696; en-US 71
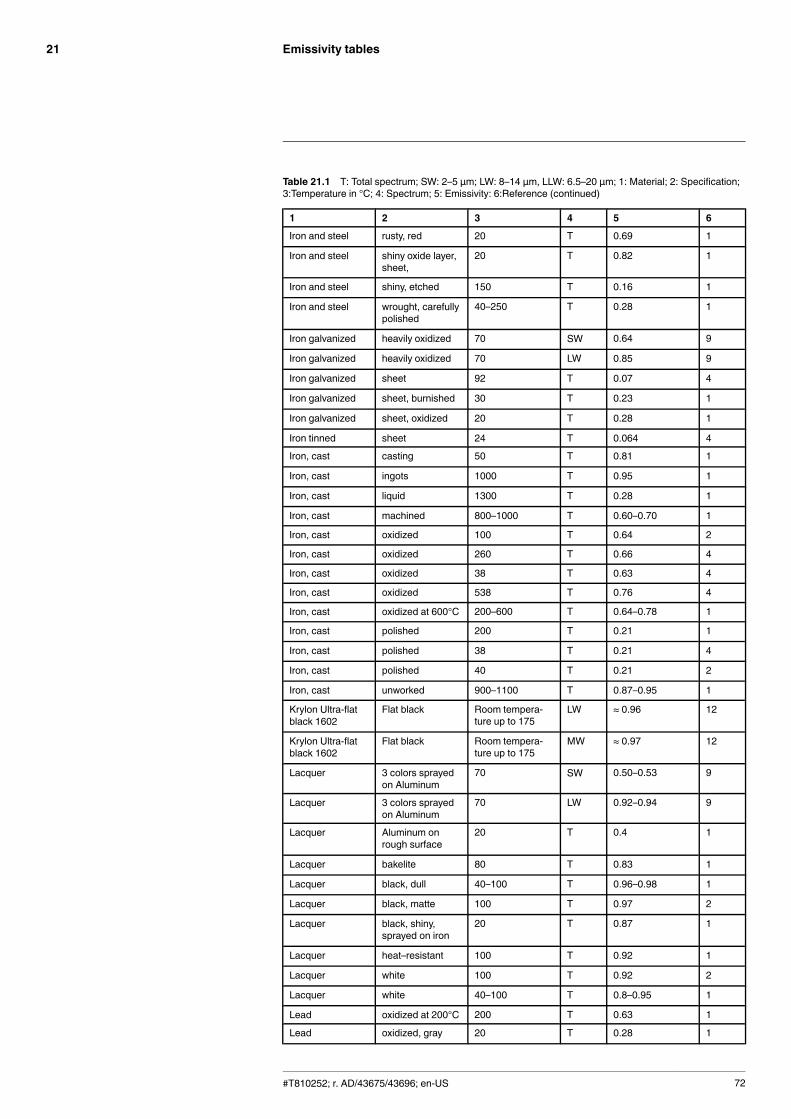
Emissivity tables21
Table 21.1 T: Total spectrum; SW: 2–5 µm; LW: 8–14 µm, LLW: 6.5–20 µm; 1: Material; 2: Specification;3:Temperature in °C; 4: Spectrum; 5: Emissivity: 6:Reference (continued)
1 2 3 4 5 6
Iron and steel rusty, red 20 T 0.69 1
Iron and steel shiny oxide layer,sheet,
20 T 0.82 1
Iron and steel shiny, etched 150 T 0.16 1
Iron and steel wrought, carefullypolished
40–250 T 0.28 1
Iron galvanized heavily oxidized 70 SW 0.64 9
Iron galvanized heavily oxidized 70 LW 0.85 9
Iron galvanized sheet 92 T 0.07 4
Iron galvanized sheet, burnished 30 T 0.23 1
Iron galvanized sheet, oxidized 20 T 0.28 1
Iron tinned sheet 24 T 0.064 4
Iron, cast casting 50 T 0.81 1
Iron, cast ingots 1000 T 0.95 1
Iron, cast liquid 1300 T 0.28 1
Iron, cast machined 800–1000 T 0.60–0.70 1
Iron, cast oxidized 100 T 0.64 2
Iron, cast oxidized 260 T 0.66 4
Iron, cast oxidized 38 T 0.63 4
Iron, cast oxidized 538 T 0.76 4
Iron, cast oxidized at 600°C 200–600 T 0.64–0.78 1
Iron, cast polished 200 T 0.21 1
Iron, cast polished 38 T 0.21 4
Iron, cast polished 40 T 0.21 2
Iron, cast unworked 900–1100 T 0.87–0.95 1
Krylon Ultra-flatblack 1602
Flat black Room tempera-ture up to 175
LW ≈ 0.96 12
Krylon Ultra-flatblack 1602
Flat black Room tempera-ture up to 175
MW ≈ 0.97 12
Lacquer 3 colors sprayedon Aluminum
70 SW 0.50–0.53 9
Lacquer 3 colors sprayedon Aluminum
70 LW 0.92–0.94 9
Lacquer Aluminum onrough surface
20 T 0.4 1
Lacquer bakelite 80 T 0.83 1
Lacquer black, dull 40–100 T 0.96–0.98 1
Lacquer black, matte 100 T 0.97 2
Lacquer black, shiny,sprayed on iron
20 T 0.87 1
Lacquer heat–resistant 100 T 0.92 1
Lacquer white 100 T 0.92 2
Lacquer white 40–100 T 0.8–0.95 1
Lead oxidized at 200°C 200 T 0.63 1
Lead oxidized, gray 20 T 0.28 1
#T810252; r. AD/43675/43696; en-US 72
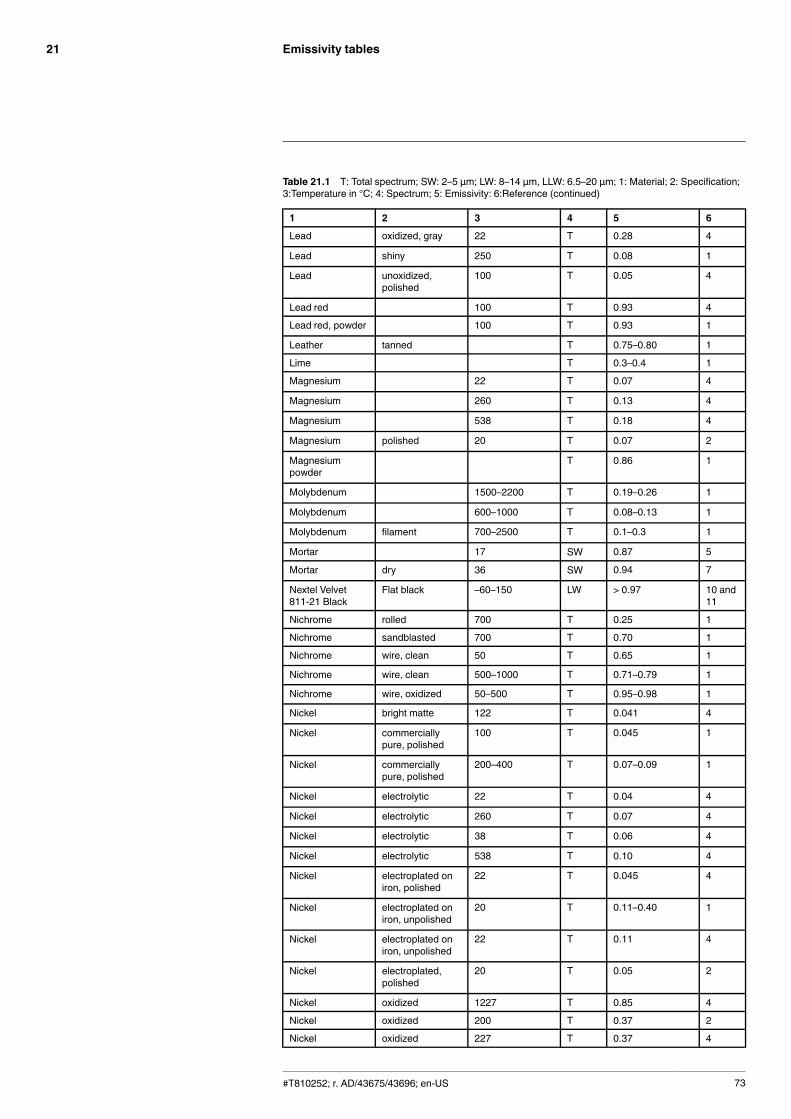
Emissivity tables21
Table 21.1 T: Total spectrum; SW: 2–5 µm; LW: 8–14 µm, LLW: 6.5–20 µm; 1: Material; 2: Specification;3:Temperature in °C; 4: Spectrum; 5: Emissivity: 6:Reference (continued)
1 2 3 4 5 6
Lead oxidized, gray 22 T 0.28 4
Lead shiny 250 T 0.08 1
Lead unoxidized,polished
100 T 0.05 4
Lead red 100 T 0.93 4
Lead red, powder 100 T 0.93 1
Leather tanned T 0.75–0.80 1
Lime T 0.3–0.4 1
Magnesium 22 T 0.07 4
Magnesium 260 T 0.13 4
Magnesium 538 T 0.18 4
Magnesium polished 20 T 0.07 2
Magnesiumpowder
T 0.86 1
Molybdenum 1500–2200 T 0.19–0.26 1
Molybdenum 600–1000 T 0.08–0.13 1
Molybdenum filament 700–2500 T 0.1–0.3 1
Mortar 17 SW 0.87 5
Mortar dry 36 SW 0.94 7
Nextel Velvet811-21 Black
Flat black –60–150 LW > 0.97 10 and11
Nichrome rolled 700 T 0.25 1
Nichrome sandblasted 700 T 0.70 1
Nichrome wire, clean 50 T 0.65 1
Nichrome wire, clean 500–1000 T 0.71–0.79 1
Nichrome wire, oxidized 50–500 T 0.95–0.98 1
Nickel bright matte 122 T 0.041 4
Nickel commerciallypure, polished
100 T 0.045 1
Nickel commerciallypure, polished
200–400 T 0.07–0.09 1
Nickel electrolytic 22 T 0.04 4
Nickel electrolytic 260 T 0.07 4
Nickel electrolytic 38 T 0.06 4
Nickel electrolytic 538 T 0.10 4
Nickel electroplated oniron, polished
22 T 0.045 4
Nickel electroplated oniron, unpolished
20 T 0.11–0.40 1
Nickel electroplated oniron, unpolished
22 T 0.11 4
Nickel electroplated,polished
20 T 0.05 2
Nickel oxidized 1227 T 0.85 4
Nickel oxidized 200 T 0.37 2
Nickel oxidized 227 T 0.37 4
#T810252; r. AD/43675/43696; en-US 73
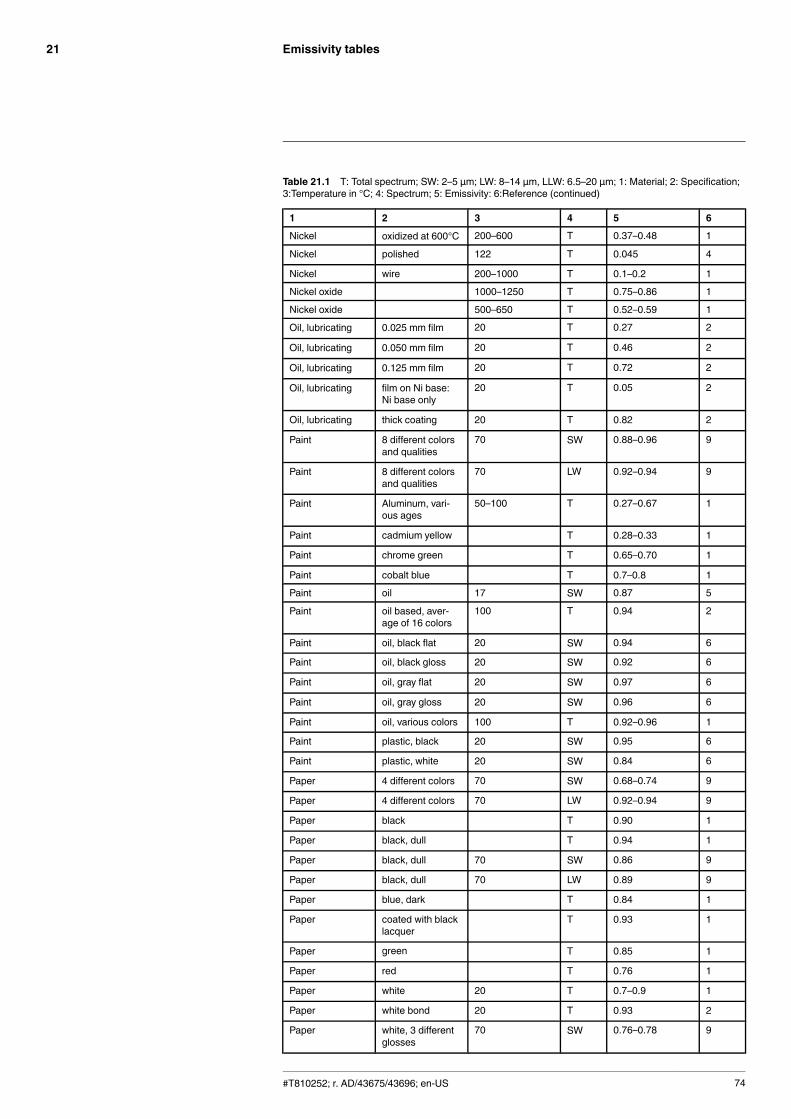
Emissivity tables21
Table 21.1 T: Total spectrum; SW: 2–5 µm; LW: 8–14 µm, LLW: 6.5–20 µm; 1: Material; 2: Specification;3:Temperature in °C; 4: Spectrum; 5: Emissivity: 6:Reference (continued)
1 2 3 4 5 6
Nickel oxidized at 600°C 200–600 T 0.37–0.48 1
Nickel polished 122 T 0.045 4
Nickel wire 200–1000 T 0.1–0.2 1
Nickel oxide 1000–1250 T 0.75–0.86 1
Nickel oxide 500–650 T 0.52–0.59 1
Oil, lubricating 0.025 mm film 20 T 0.27 2
Oil, lubricating 0.050 mm film 20 T 0.46 2
Oil, lubricating 0.125 mm film 20 T 0.72 2
Oil, lubricating film on Ni base:Ni base only
20 T 0.05 2
Oil, lubricating thick coating 20 T 0.82 2
Paint 8 different colorsand qualities
70 SW 0.88–0.96 9
Paint 8 different colorsand qualities
70 LW 0.92–0.94 9
Paint Aluminum, vari-ous ages
50–100 T 0.27–0.67 1
Paint cadmium yellow T 0.28–0.33 1
Paint chrome green T 0.65–0.70 1
Paint cobalt blue T 0.7–0.8 1
Paint oil 17 SW 0.87 5
Paint oil based, aver-age of 16 colors
100 T 0.94 2
Paint oil, black flat 20 SW 0.94 6
Paint oil, black gloss 20 SW 0.92 6
Paint oil, gray flat 20 SW 0.97 6
Paint oil, gray gloss 20 SW 0.96 6
Paint oil, various colors 100 T 0.92–0.96 1
Paint plastic, black 20 SW 0.95 6
Paint plastic, white 20 SW 0.84 6
Paper 4 different colors 70 SW 0.68–0.74 9
Paper 4 different colors 70 LW 0.92–0.94 9
Paper black T 0.90 1
Paper black, dull T 0.94 1
Paper black, dull 70 SW 0.86 9
Paper black, dull 70 LW 0.89 9
Paper blue, dark T 0.84 1
Paper coated with blacklacquer
T 0.93 1
Paper green T 0.85 1
Paper red T 0.76 1
Paper white 20 T 0.7–0.9 1
Paper white bond 20 T 0.93 2
Paper white, 3 differentglosses
70 SW 0.76–0.78 9
#T810252; r. AD/43675/43696; en-US 74
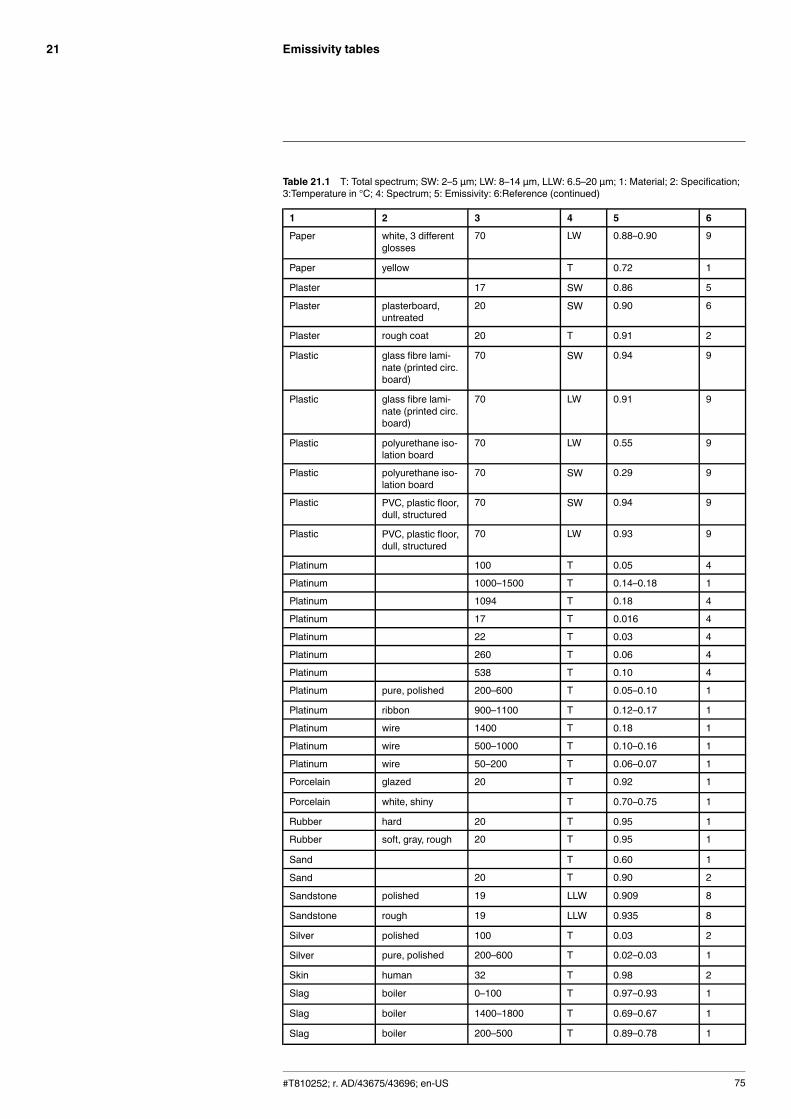
Emissivity tables21
Table 21.1 T: Total spectrum; SW: 2–5 µm; LW: 8–14 µm, LLW: 6.5–20 µm; 1: Material; 2: Specification;3:Temperature in °C; 4: Spectrum; 5: Emissivity: 6:Reference (continued)
1 2 3 4 5 6
Paper white, 3 differentglosses
70 LW 0.88–0.90 9
Paper yellow T 0.72 1
Plaster 17 SW 0.86 5
Plaster plasterboard,untreated
20 SW 0.90 6
Plaster rough coat 20 T 0.91 2
Plastic glass fibre lami-nate (printed circ.board)
70 SW 0.94 9
Plastic glass fibre lami-nate (printed circ.board)
70 LW 0.91 9
Plastic polyurethane iso-lation board
70 LW 0.55 9
Plastic polyurethane iso-lation board
70 SW 0.29 9
Plastic PVC, plastic floor,dull, structured
70 SW 0.94 9
Plastic PVC, plastic floor,dull, structured
70 LW 0.93 9
Platinum 100 T 0.05 4
Platinum 1000–1500 T 0.14–0.18 1
Platinum 1094 T 0.18 4
Platinum 17 T 0.016 4
Platinum 22 T 0.03 4
Platinum 260 T 0.06 4
Platinum 538 T 0.10 4
Platinum pure, polished 200–600 T 0.05–0.10 1
Platinum ribbon 900–1100 T 0.12–0.17 1
Platinum wire 1400 T 0.18 1
Platinum wire 500–1000 T 0.10–0.16 1
Platinum wire 50–200 T 0.06–0.07 1
Porcelain glazed 20 T 0.92 1
Porcelain white, shiny T 0.70–0.75 1
Rubber hard 20 T 0.95 1
Rubber soft, gray, rough 20 T 0.95 1
Sand T 0.60 1
Sand 20 T 0.90 2
Sandstone polished 19 LLW 0.909 8
Sandstone rough 19 LLW 0.935 8
Silver polished 100 T 0.03 2
Silver pure, polished 200–600 T 0.02–0.03 1
Skin human 32 T 0.98 2
Slag boiler 0–100 T 0.97–0.93 1
Slag boiler 1400–1800 T 0.69–0.67 1
Slag boiler 200–500 T 0.89–0.78 1
#T810252; r. AD/43675/43696; en-US 75
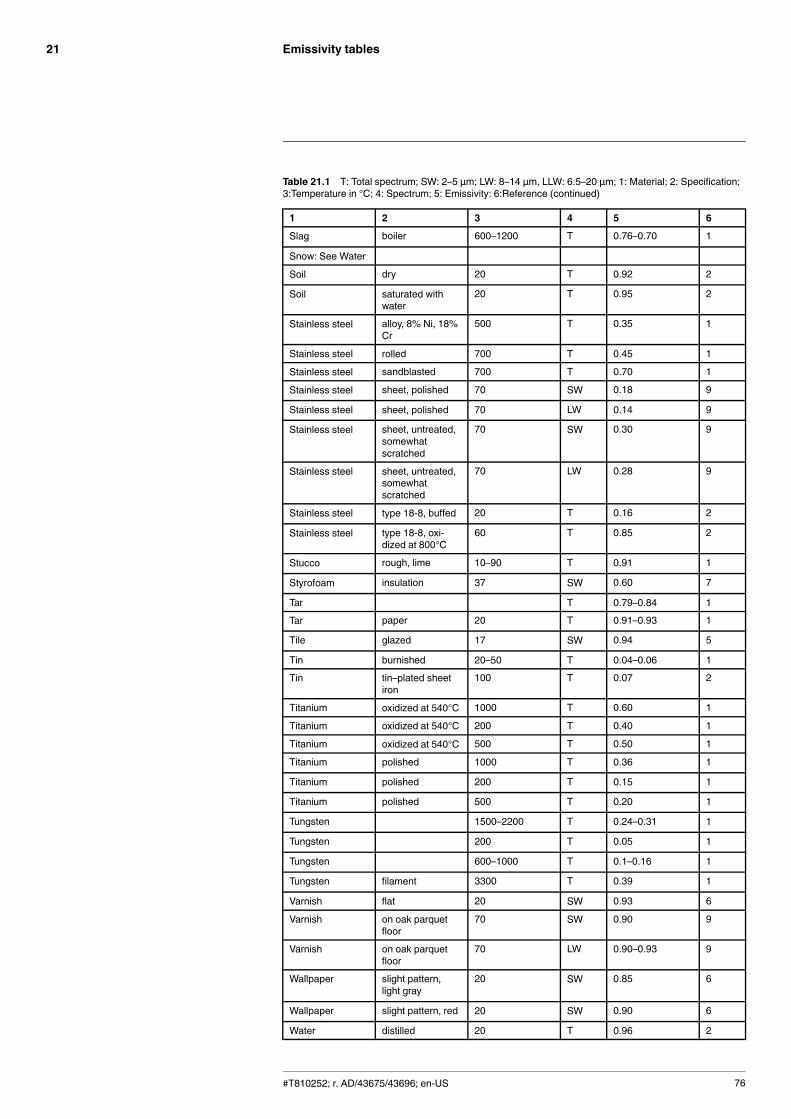
Emissivity tables21
Table 21.1 T: Total spectrum; SW: 2–5 µm; LW: 8–14 µm, LLW: 6.5–20 µm; 1: Material; 2: Specification;3:Temperature in °C; 4: Spectrum; 5: Emissivity: 6:Reference (continued)
1 2 3 4 5 6
Slag boiler 600–1200 T 0.76–0.70 1
Snow: See Water
Soil dry 20 T 0.92 2
Soil saturated withwater
20 T 0.95 2
Stainless steel alloy, 8% Ni, 18%Cr
500 T 0.35 1
Stainless steel rolled 700 T 0.45 1
Stainless steel sandblasted 700 T 0.70 1
Stainless steel sheet, polished 70 SW 0.18 9
Stainless steel sheet, polished 70 LW 0.14 9
Stainless steel sheet, untreated,somewhatscratched
70 SW 0.30 9
Stainless steel sheet, untreated,somewhatscratched
70 LW 0.28 9
Stainless steel type 18-8, buffed 20 T 0.16 2
Stainless steel type 18-8, oxi-dized at 800°C
60 T 0.85 2
Stucco rough, lime 10–90 T 0.91 1
Styrofoam insulation 37 SW 0.60 7
Tar T 0.79–0.84 1
Tar paper 20 T 0.91–0.93 1
Tile glazed 17 SW 0.94 5
Tin burnished 20–50 T 0.04–0.06 1
Tin tin–plated sheetiron
100 T 0.07 2
Titanium oxidized at 540°C 1000 T 0.60 1
Titanium oxidized at 540°C 200 T 0.40 1
Titanium oxidized at 540°C 500 T 0.50 1
Titanium polished 1000 T 0.36 1
Titanium polished 200 T 0.15 1
Titanium polished 500 T 0.20 1
Tungsten 1500–2200 T 0.24–0.31 1
Tungsten 200 T 0.05 1
Tungsten 600–1000 T 0.1–0.16 1
Tungsten filament 3300 T 0.39 1
Varnish flat 20 SW 0.93 6
Varnish on oak parquetfloor
70 SW 0.90 9
Varnish on oak parquetfloor
70 LW 0.90–0.93 9
Wallpaper slight pattern,light gray
20 SW 0.85 6
Wallpaper slight pattern, red 20 SW 0.90 6
Water distilled 20 T 0.96 2
#T810252; r. AD/43675/43696; en-US 76
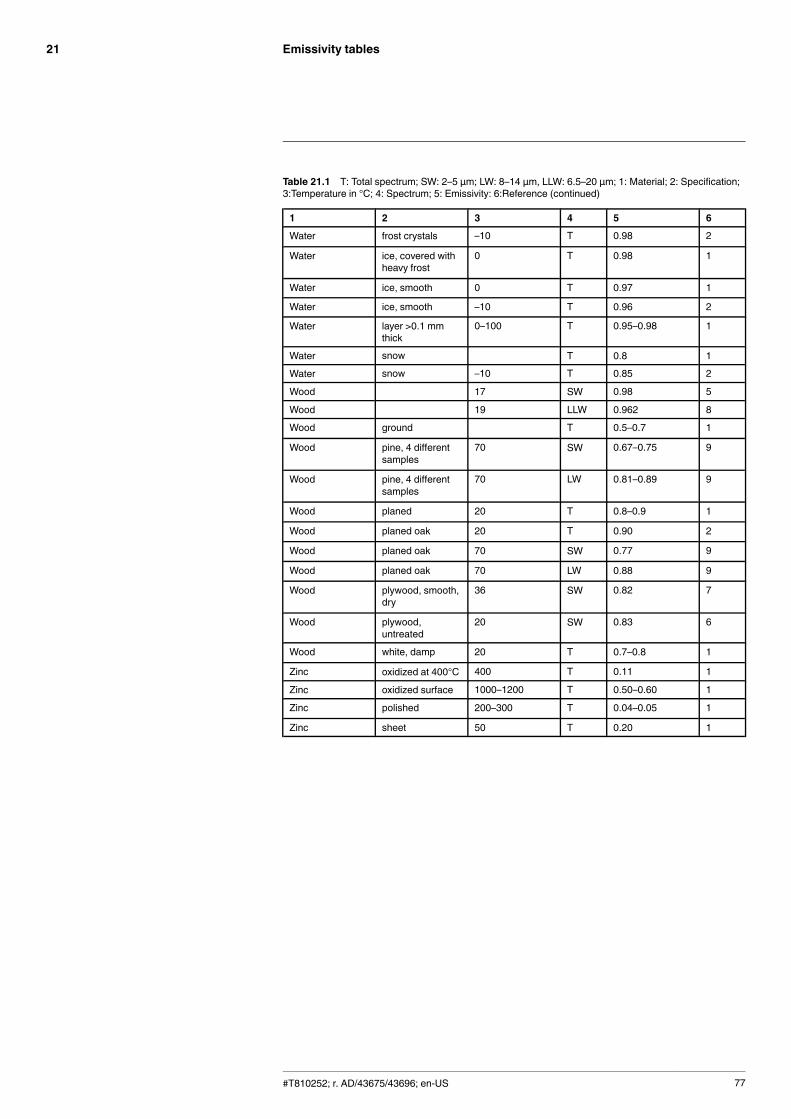
Emissivity tables21
Table 21.1 T: Total spectrum; SW: 2–5 µm; LW: 8–14 µm, LLW: 6.5–20 µm; 1: Material; 2: Specification;3:Temperature in °C; 4: Spectrum; 5: Emissivity: 6:Reference (continued)
1 2 3 4 5 6
Water frost crystals –10 T 0.98 2
Water ice, covered withheavy frost
0 T 0.98 1
Water ice, smooth 0 T 0.97 1
Water ice, smooth –10 T 0.96 2
Water layer >0.1 mmthick
0–100 T 0.95–0.98 1
Water snow T 0.8 1
Water snow –10 T 0.85 2
Wood 17 SW 0.98 5
Wood 19 LLW 0.962 8
Wood ground T 0.5–0.7 1
Wood pine, 4 differentsamples
70 SW 0.67–0.75 9
Wood pine, 4 differentsamples
70 LW 0.81–0.89 9
Wood planed 20 T 0.8–0.9 1
Wood planed oak 20 T 0.90 2
Wood planed oak 70 SW 0.77 9
Wood planed oak 70 LW 0.88 9
Wood plywood, smooth,dry
36 SW 0.82 7
Wood plywood,untreated
20 SW 0.83 6
Wood white, damp 20 T 0.7–0.8 1
Zinc oxidized at 400°C 400 T 0.11 1
Zinc oxidized surface 1000–1200 T 0.50–0.60 1
Zinc polished 200–300 T 0.04–0.05 1
Zinc sheet 50 T 0.20 1
#T810252; r. AD/43675/43696; en-US 77

A note on the technical production of this publicationThis publication was produced using XML — the eXtensible Markup Language. For more informationabout XML, please visit http://www.w3.org/XML/A note on the typeface used in this publicationThis publication was typeset using Linotype Helvetica™World. Helvetica™ was designed by MaxMiedinger (1910–1980)LOEF (List Of Effective Files)T501250.xml; en-US; AD; 43675; 2017-07-06T505552.xml; en-US; 9599; 2013-11-05T505469.xml; en-US; 39689; 2017-01-25T505013.xml; en-US; 39689; 2017-01-25T506128.xml; en-US; 40817; 2017-03-02T505470.xml; en-US; 39513; 2017-01-18T505007.xml; en-US; 42810; 2017-05-23T506125.xml; en-US; 40753; 2017-03-02T505000.xml; en-US; 39687; 2017-01-25T506155.xml; en-US; 42220; 2017-04-26T506051.xml; en-US; 40460; 2017-02-20T505005.xml; en-US; 42810; 2017-05-23T505001.xml; en-US; 41563; 2017-03-23T505006.xml; en-US; 41563; 2017-03-23T505002.xml; en-US; 39512; 2017-01-18
#T810252; r. AD/43675/43696; en-US 78

last page
Publ. No.: T810252Release: ADCommit: 43675Head: 43696Language: en-USModified: 2017-07-06Formatted: 2017-07-06
Websitehttp://www.flir.comCustomer supporthttp://support.flir.comCopyright© 2017, FLIR Systems, Inc. All rights reserved worldwide.DisclaimerSpecifications subject to change without further notice. Models and accessories subject to regional market considerations. License procedures may apply.Products described herein may be subject to US Export Regulations. Please refer to [email protected] with any questions.


![Getting Started Guide FLIR Txxx series - Net Zero Tools · Getting Started Guide FLIR Txxx series ... QHW]HURWRROV FRP Flir T420-NIST Thermal Imaging Infrared Camera Thermography](https://static.documents.pub/doc/80x56/5ac536137f8b9aae1b8deaff/getting-started-guide-flir-txxx-series-net-zero-started-guide-flir-txxx-series.jpg)


