International Journal of Applied Environmental Sciences
ISSN 0973-6077 Volume 11, Number 2 (2016), pp. 413-423
© Research India Publications
http://www.ripublication.com
User’s Perspective: Knowledge and Attitude towards
E-Waste
Dr. Brijesh Sivathanu
Associate Professor, Symbiosis Center for Information Technology,
Symbiosis International University, Hinjewadi, Phase-I,
Pune-411057, Maharashtra. India.
Abstract
The world's largest and fastest growing manufacturing industry today is the
electronics industry. The rapid growth in this sector combined with rapid
product obsolescence due to the advent of latest technologies and discarded
electronics is now the fastest growing concern in the entire industrialized
world. The growing quantity of waste from the electronics industry that is “E-
waste” is beginning to reach disastrous proportions not only globally but also
in most of the cities in India.
In this paper, the author discusses the consumers’ awareness and preference
towards the disposal of e-waste. A primary survey was conducted using a
structured questionnaire among 600 consumers in Pune city. The exploratory
factor analysis technique was deployed to identify the awareness factors
contributing to the consumer’s preference towards the proper disposal and
management of e-waste.
The findings show that five important factors contribute to the consumer’s
preference during the disposal of e-waste. These antecedents are Awareness of
toxic effects on human health, Awareness of Environmental Hazards,
Awareness of proper disposal of E-waste, Awareness of E-waste Management
by various stakeholders and Awareness of Convenience of Recycling.
This paper suggests the various pathways to create awareness so that the
attitude of the consumers towards disposal of e-waste can be changed which
would be helpful to the society to handle E-waste properly and focus towards
efficient and effective E-waste management.
Keywords: Awareness, preference, e-waste disposal, antecedents and E-waste
management.
414 Dr. Brijesh Sivathanu
Introduction The manufacturing and service industries are the key drivers of global economic
growth, and within this, Information and communication technology (ICT) along with
the electrical and electronics sectors play a major role. The recent advancements in
science and technology translate to the fact that day-to-day life today is incomplete
without an electronic or electrical device. India is one of the largest growing
consumer electronics markets globally and will be the fifth largest consumer
electronics market by 2025, from its current 12th position. Though electrical and
electronic equipment have enhanced the quality of our lives, their usage has also led
to the generation of electronic waste (e-waste) that causes health and environmental
issues. E-waste has a direct relationship with the country’s economic growth and
overall consumer spending (Frost and Sullivan Report 2015).
The consumption of electrical and electronic equipment (EEE) has increased
tremendously from the institutional users to the households too. This growing rate of
consumption among the consumers along with the shortened product life cycle due to
rapid progression of technology has resulted in the rapid growth of electronic waste
(e-waste). The e-waste comprises of discarded television, computers, mother boards,
mobile phones, pen drives, cathode ray tubes, printed circuit boards, air conditioners,
refrigerators, compact discs and plasma television. The data published by Central
Pollution Control Board (CPCB) in the year 2014 mentions that 75 % of the e-waste
is television and electrical equipment, 20% computers, 2% mobile phones and 3%
others which include toys, leisure and sports equipment.
E-waste is more hazardous than any other municipal waste and it contains many
hazardous chemicals like polyvinyl chloride (PVC plastics), Nonylphenol,
Polybrominated diphenyl ethers, polychlorinated biphenyls copper, Triphenyl
phosphate, Chromium VI, Barium, Beryllium, Phosphor and additives lead, mercury,
arsenic (in older models), cadmium, manganese, cobalt, gold, and iron. These
chemicals create water pollution, land pollution and air pollution and hazardous to
human health.
With reference to the above hazards, the proper management of e-waste is an
alarming issue for government agencies. There are various stake holders involved in
the e-waste management comprising of regulatory bodies like Ministry of
environment and forest (MoEF), Central Pollution Control Board (CPCB) and
Maharashtra Pollution Control Board (MPCB). The National Association of Software
and Services Companies (NASSCOM), Manufacturers’ Association for Information
Technology (MAIT), NGOs, Consumer, Individual households, manufactures and
retailers, business sector companies, Traders / Scrap Dealers / Dissemblers, Recyclers
along with informal sectors like Hawkers are involved in the collection of E-waste.
Among the states in the country, Maharashtra is leading in the e-waste generation as
the cities like Mumbai and Navi Mumbai has generated 61,500 MT and Pune has
12,300 MT in 2014 (Frost and Sullivan Report, 2015).
As the electronic waste (e-Waste) generated in Pune city is not segregated, collected
or processed by government institutions, the Pune City's solid waste management
system has to bear an additional 30 per cent burden. While the e-waste rules were
User’s Perspective: Knowledge And Attitude Towards E-Waste 415
implemented in 2011, even after four years the problem of domestic e-waste disposal
and recycling still remains in Pune city.
The e-waste generated in the city is the waste coming from the IT belts of Hadapsar,
Kharadi and Magarpatta areas. This waste usually has computers, copper and lead
wires, laptops and other electrical equipments used in offices.
As per the Pune Municipal Corporation (PMC) report in 2014, around 500 MT to
1000 MT e-waste generated in the city is of domestic nature of which maximum 300
MT is being collected. The PMC is conducting awareness programs and campaigns
for citizens to encourage them to segregate their e-waste.
The IT/ITeS sector was found to be the highest contributor to the quantity of E-waste
generated in Pune city. As found in this study, the main reason for this, is the frequent
replacement and discarding of obsolete computers in this sector. With the introduction
of new and modified versions of software every few months, the substitution and
desertion rate of electrical and electronic equipments (EEE) is reasonably high in this
sector. Most of the times, the older hardware is not compatible with the new software,
and consequently, companies are forced to opt for newer hardware contributing
significantly to the e-waste generation (Anwesha Borthakur, 2015).
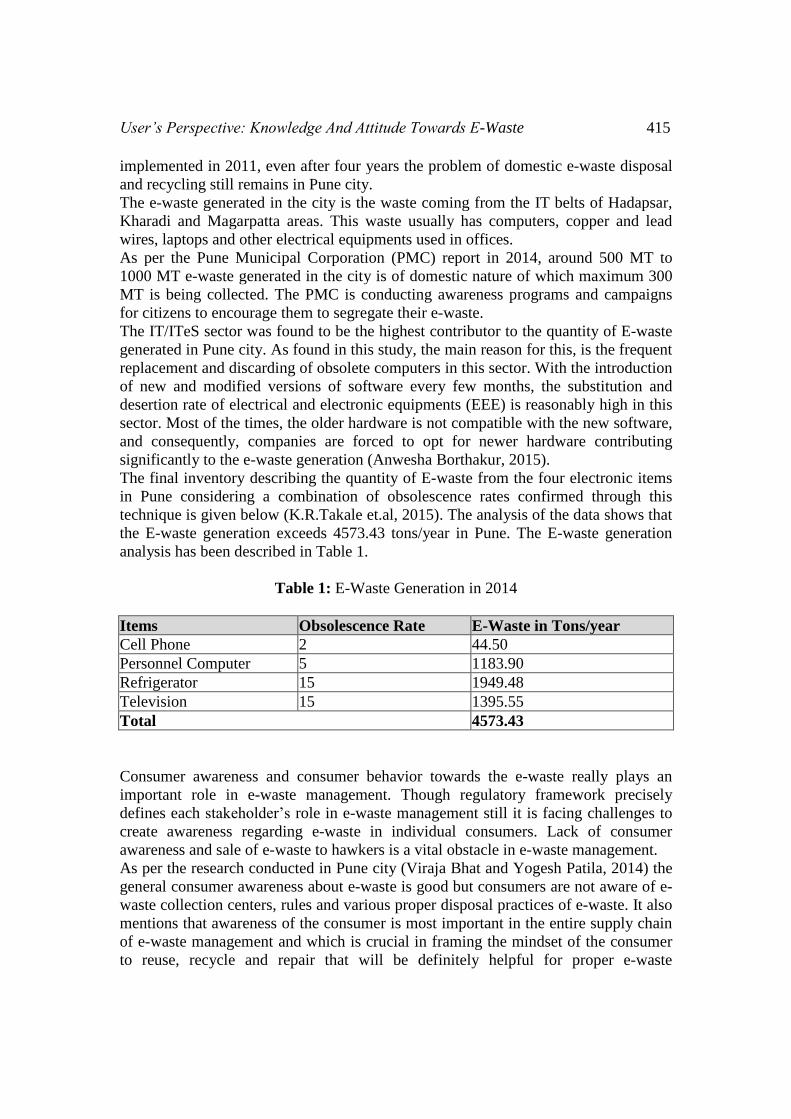
The final inventory describing the quantity of E-waste from the four electronic items
in Pune considering a combination of obsolescence rates confirmed through this
technique is given below (K.R.Takale et.al, 2015). The analysis of the data shows that
the E-waste generation exceeds 4573.43 tons/year in Pune. The E-waste generation
analysis has been described in Table 1.
Table 1: E-Waste Generation in 2014
Items Obsolescence Rate E-Waste in Tons/year
Cell Phone 2 44.50
Personnel Computer 5 1183.90
Refrigerator 15 1949.48
Television 15 1395.55
Total 4573.43
Consumer awareness and consumer behavior towards the e-waste really plays an
important role in e-waste management. Though regulatory framework precisely
defines each stakeholder’s role in e-waste management still it is facing challenges to
create awareness regarding e-waste in individual consumers. Lack of consumer
awareness and sale of e-waste to hawkers is a vital obstacle in e-waste management.
As per the research conducted in Pune city (Viraja Bhat and Yogesh Patila, 2014) the
general consumer awareness about e-waste is good but consumers are not aware of e-
waste collection centers, rules and various proper disposal practices of e-waste. It also
mentions that awareness of the consumer is most important in the entire supply chain
of e-waste management and which is crucial in framing the mindset of the consumer
to reuse, recycle and repair that will be definitely helpful for proper e-waste
416 Dr. Brijesh Sivathanu
management to protect the environment, health, livelihood and sustainable
development.
After the study of the existing literature, the link between socioeconomic,
demographic characteristics of the consumers and recycling behavior was explored.
The most commonly examined variables under consideration are education, age,
gender and income.
The evidences examined during the literature review suggests that general attitudes
towards the environment, environmental activism, convenience, as well as a broad
array of socio-economic variables have to be considered while assessing the factors
influencing the willingness of the consumers to recycle e-waste.
The importance of recycling and information about where and how to recycle needs to
be conveyed to the general consumers to increase their participation in e-waste
recycling (Guagnano et al., 1995)
The convenience in e-waste recycling can increase the household involvement as it
requires consumer’s time, effort, money and space (Domina and Koch , 2002)
The consumer’s recycling behavior is largely driven by convenience. One of the
important parameter in consumer recycling behavior is how frequently e-waste is
collected by recyclers. (Hornik et al., 1995). It also mentions with reference to meta-
analysis that one of the strong predictor of recycling behavior is the frequency of
recyclable collection.
It is really necessary that the consumer be aware of the availability of recycling
method and facilities provided by government and various agencies. Most of the
studies (Oskamp, 1994; Hornik et al., 1995), state that knowledge about recycling is a
strong predictor of the recycling behavior of the consumers.
As per (Nnorom, 2009) less awareness of the toxic hazards of e-waste and threat of
not using correct techniques are considered prime barriers of e-waste recycling. This
Research also confirms that the residents’ willingness in e-waste recycling is directly
associated with the awareness of environmental issues related to e-waste.
Many of the studies mention that the education level and income have a positive
relationship with recycling of e-waste by residents (Hornik et al., 2005; Hansmann et
al., 2006; Tonglet et al., 2004).
The research conducted (Zhaoua Wang et.al, 2011) in Beijing confirms that the
convenience of recycling facilities and service, recycling habits, residential conditions
and economic benefits are determinants of the consumers’ willingness and behavior in
e-waste recycling.
(Jenkins et al., 2003) in his research suggests that cost and convenience has a
significant impact on the e-waste recycling behavior of the consumers.
The study conducted by Oskamp et al.,1998 and Guerin, Crete, and Mercier, 2001
show that significant statistical relationship exists between the environmental
concerns of the consumer and their recycling behavior.
The research conducted by (Gamba & Oskamp, 1994; Oskamp, 1995) depict that a
positive association exists between income and recycling behavior of consumers
towards e-waste.
User’s Perspective: Knowledge And Attitude Towards E-Waste 417
Objectives of the Study 1. To study consumers’ awareness towards the E-waste in Pune city.
2. To identify the awareness factors contributing to the consumer’s preference
towards the proper disposal and management of e-waste in Pune city.
Research Methodology This is an exploratory research study to understand the consumers’ awareness towards
e-waste in Pune city. For conducting this research, both primary and secondary data
was collected. The primary survey was done using structured questionnaire with
closed ended questions using five point Likert scale ranging from “Strongly Agree” to
“Strongly Disagree”.
The sample respondents were selected based on the convenience sampling method. A
total of 600 consumers from Pune city were surveyed to conduct the exploratory study
and to identify the awareness factors affecting the preference of consumers for proper
disposal and management of e-waste. The collected data was coded and entered for
statistical analysis using SPSS software. First a demographic profile of the
respondents was prepared by applying frequency distribution. Later, the data obtained
for the study were analyzed using Exploratory Factor analysis for identification of the
awareness antecedents contributing to the consumer’s preference towards the proper
disposal and management of e-waste in Pune city. Factor analysis was conducted as a
data reduction technique to minimize the number of variables whilst simultaneously
maximizing the amount of information in the analysis.
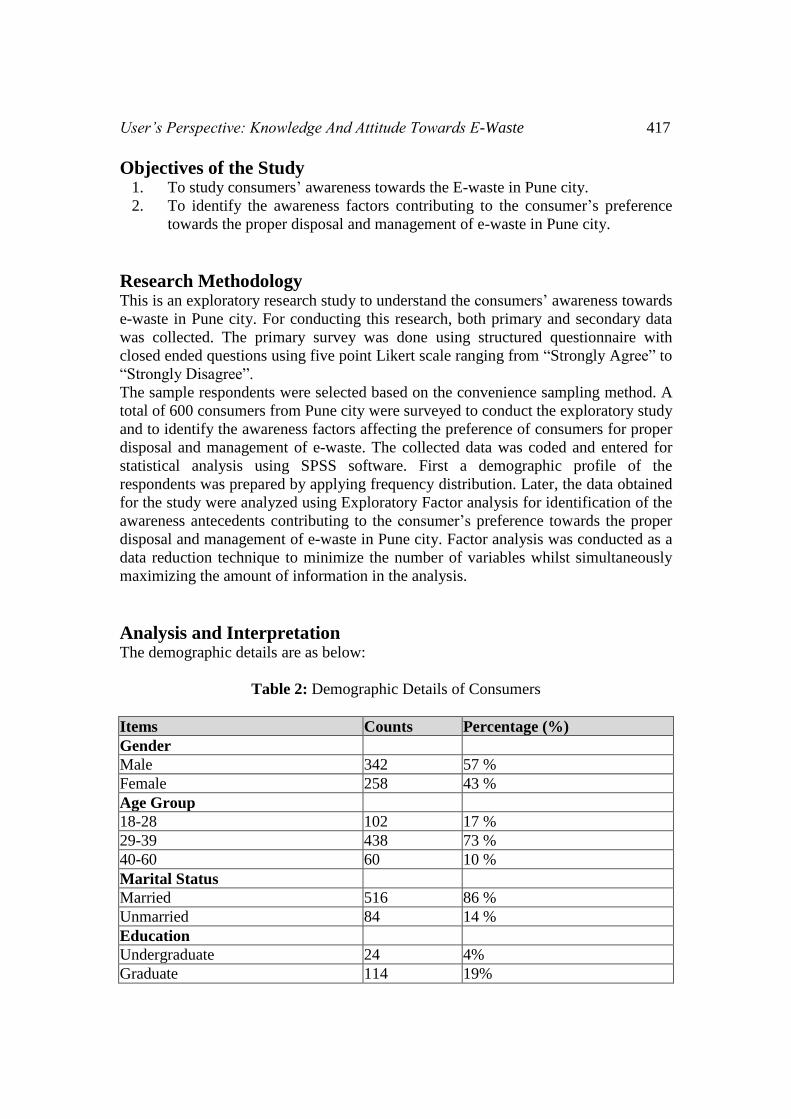
Analysis and Interpretation The demographic details are as below:
Table 2: Demographic Details of Consumers
Items Counts Percentage (%)
Gender
Male 342 57 %
Female 258 43 %
Age Group
18-28 102 17 %
29-39 438 73 %
40-60 60 10 %
Marital Status
Married 516 86 %
Unmarried 84 14 %
Education
Undergraduate 24 4%
Graduate 114 19%
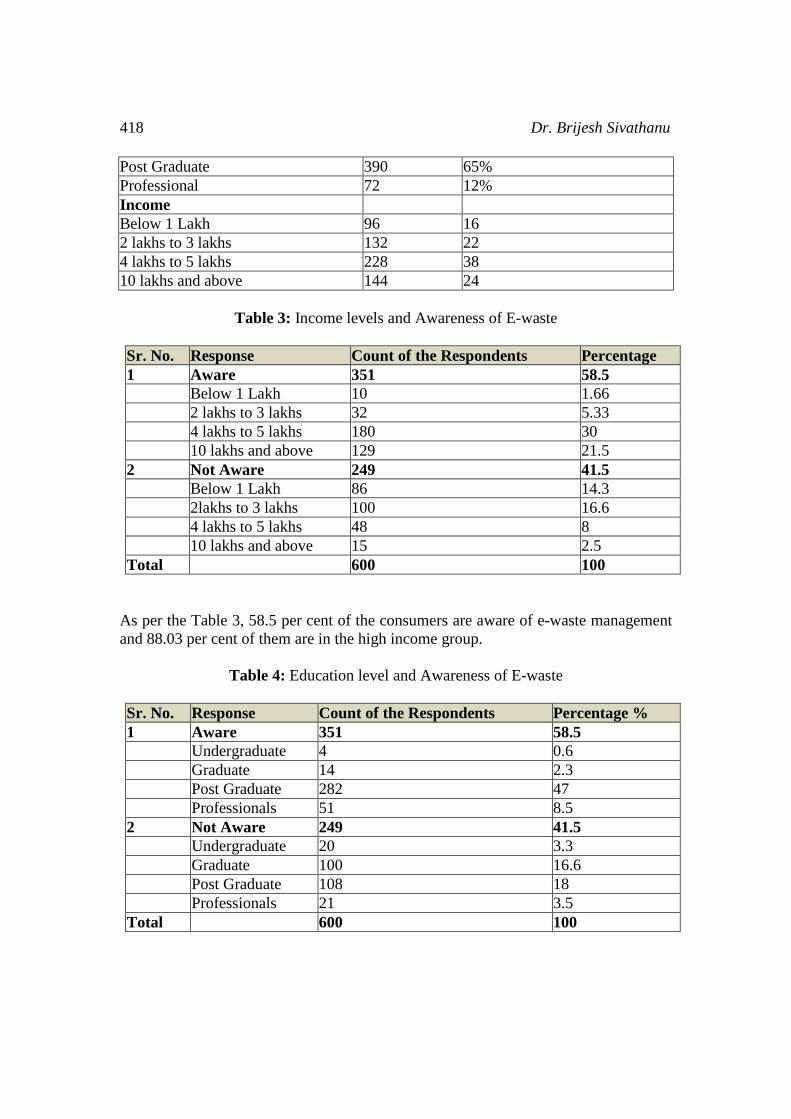
418 Dr. Brijesh Sivathanu
Post Graduate 390 65%
Professional 72 12%
Income
Below 1 Lakh 96 16
2 lakhs to 3 lakhs 132 22
4 lakhs to 5 lakhs 228 38
10 lakhs and above 144 24
Table 3: Income levels and Awareness of E-waste
Sr. No. Response Count of the Respondents Percentage
1 Aware 351 58.5
Below 1 Lakh 10 1.66
2 lakhs to 3 lakhs 32 5.33
4 lakhs to 5 lakhs 180 30
10 lakhs and above 129 21.5
2 Not Aware 249 41.5
Below 1 Lakh 86 14.3
2lakhs to 3 lakhs 100 16.6
4 lakhs to 5 lakhs 48 8
10 lakhs and above 15 2.5
Total 600 100
As per the Table 3, 58.5 per cent of the consumers are aware of e-waste management
and 88.03 per cent of them are in the high income group.
Table 4: Education level and Awareness of E-waste
Sr. No. Response Count of the Respondents Percentage %
1 Aware 351 58.5
Undergraduate 4 0.6
Graduate 14 2.3
Post Graduate 282 47
Professionals 51 8.5
2 Not Aware 249 41.5
Undergraduate 20 3.3
Graduate 100 16.6
Post Graduate 108 18
Professionals 21 3.5
Total 600 100
User’s Perspective: Knowledge And Attitude Towards E-Waste 419
As per the Table 4, 58.5 per cent of the consumers are aware of e-waste management
and 94.87 per cent of them are post graduate and professionals.
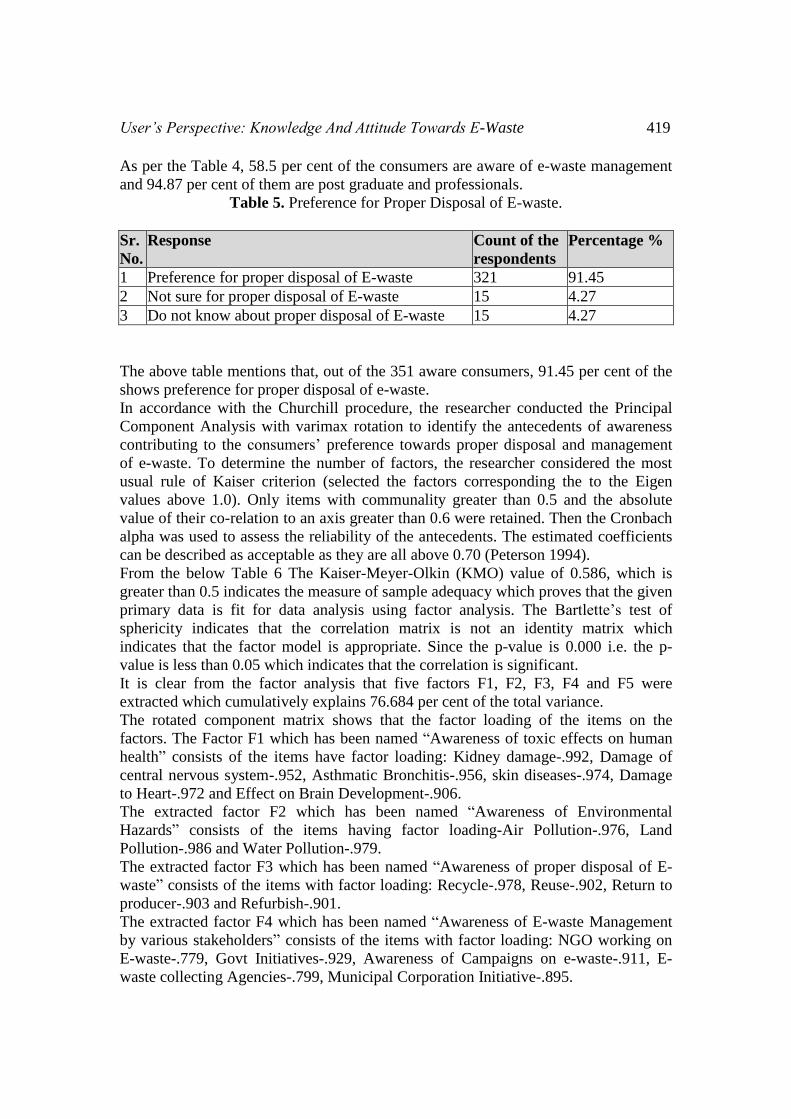
Table 5. Preference for Proper Disposal of E-waste.
Sr.
No.
Response Count of the
respondents
Percentage %
1 Preference for proper disposal of E-waste 321 91.45
2 Not sure for proper disposal of E-waste 15 4.27
3 Do not know about proper disposal of E-waste 15 4.27
The above table mentions that, out of the 351 aware consumers, 91.45 per cent of the
shows preference for proper disposal of e-waste.
In accordance with the Churchill procedure, the researcher conducted the Principal
Component Analysis with varimax rotation to identify the antecedents of awareness
contributing to the consumers’ preference towards proper disposal and management
of e-waste. To determine the number of factors, the researcher considered the most
usual rule of Kaiser criterion (selected the factors corresponding the to the Eigen
values above 1.0). Only items with communality greater than 0.5 and the absolute
value of their co-relation to an axis greater than 0.6 were retained. Then the Cronbach
alpha was used to assess the reliability of the antecedents. The estimated coefficients
can be described as acceptable as they are all above 0.70 (Peterson 1994).
From the below Table 6 The Kaiser-Meyer-Olkin (KMO) value of 0.586, which is
greater than 0.5 indicates the measure of sample adequacy which proves that the given
primary data is fit for data analysis using factor analysis. The Bartlette’s test of
sphericity indicates that the correlation matrix is not an identity matrix which
indicates that the factor model is appropriate. Since the p-value is 0.000 i.e. the p-
value is less than 0.05 which indicates that the correlation is significant.
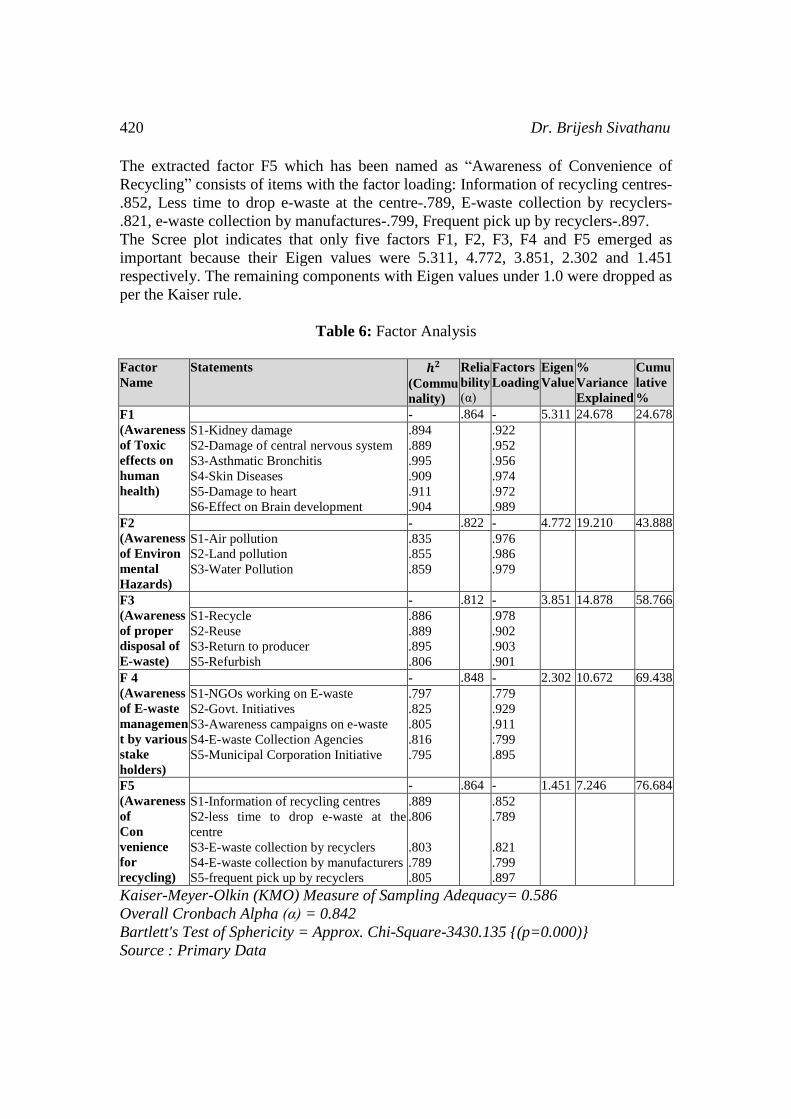
It is clear from the factor analysis that five factors F1, F2, F3, F4 and F5 were
extracted which cumulatively explains 76.684 per cent of the total variance.
The rotated component matrix shows that the factor loading of the items on the
factors. The Factor F1 which has been named “Awareness of toxic effects on human
health” consists of the items have factor loading: Kidney damage-.992, Damage of
central nervous system-.952, Asthmatic Bronchitis-.956, skin diseases-.974, Damage
to Heart-.972 and Effect on Brain Development-.906.
The extracted factor F2 which has been named “Awareness of Environmental
Hazards” consists of the items having factor loading-Air Pollution-.976, Land
Pollution-.986 and Water Pollution-.979.
The extracted factor F3 which has been named “Awareness of proper disposal of E-
waste” consists of the items with factor loading: Recycle-.978, Reuse-.902, Return to
producer-.903 and Refurbish-.901.
The extracted factor F4 which has been named “Awareness of E-waste Management
by various stakeholders” consists of the items with factor loading: NGO working on
E-waste-.779, Govt Initiatives-.929, Awareness of Campaigns on e-waste-.911, E-
waste collecting Agencies-.799, Municipal Corporation Initiative-.895.
420 Dr. Brijesh Sivathanu
The extracted factor F5 which has been named as “Awareness of Convenience of
Recycling” consists of items with the factor loading: Information of recycling centres-
.852, Less time to drop e-waste at the centre-.789, E-waste collection by recyclers-
.821, e-waste collection by manufactures-.799, Frequent pick up by recyclers-.897.
The Scree plot indicates that only five factors F1, F2, F3, F4 and F5 emerged as
important because their Eigen values were 5.311, 4.772, 3.851, 2.302 and 1.451
respectively. The remaining components with Eigen values under 1.0 were dropped as
per the Kaiser rule.
Table 6: Factor Analysis
Factor
Name
Statements 𝒉𝟐
(Commu
nality)
Relia
bility
(α)
Factors
Loading
Eigen
Value
%
Variance
Explained
Cumu
lative
%
F1
(Awareness
of Toxic
effects on
human
health)
- .864 - 5.311 24.678 24.678
S1-Kidney damage
S2-Damage of central nervous system
S3-Asthmatic Bronchitis
S4-Skin Diseases
S5-Damage to heart
S6-Effect on Brain development
.894
.889
.995
.909
.911
.904
.922
.952
.956
.974
.972
.989
F2
(Awareness
of Environ
mental
Hazards)
- .822 - 4.772 19.210 43.888
S1-Air pollution
S2-Land pollution
S3-Water Pollution
.835
.855
.859
.976
.986
.979
F3
(Awareness
of proper
disposal of
E-waste)
- .812 - 3.851 14.878 58.766
S1-Recycle
S2-Reuse
S3-Return to producer
S5-Refurbish
.886
.889
.895
.806
.978
.902
.903
.901
F 4
(Awareness
of E-waste
managemen
t by various
stake
holders)
- .848 - 2.302 10.672 69.438
S1-NGOs working on E-waste
S2-Govt. Initiatives
S3-Awareness campaigns on e-waste
S4-E-waste Collection Agencies
S5-Municipal Corporation Initiative
.797
.825
.805
.816
.795
.779
.929
.911
.799
.895
F5
(Awareness
of
Con
venience
for
recycling)
- .864 - 1.451 7.246 76.684
S1-Information of recycling centres
S2-less time to drop e-waste at the
centre
S3-E-waste collection by recyclers
S4-E-waste collection by manufacturers
S5-frequent pick up by recyclers
.889
.806
.803
.789
.805
.852
.789
.821
.799
.897
Kaiser-Meyer-Olkin (KMO) Measure of Sampling Adequacy= 0.586
Overall Cronbach Alpha (α) = 0.842
Bartlett's Test of Sphericity = Approx. Chi-Square-3430.135 {(p=0.000)}
Source : Primary Data
User’s Perspective: Knowledge And Attitude Towards E-Waste 421
Result and Discussion Conclusion and Managerial Implications :
Consumer awareness plays a vital role in proper e-waste management. This study
found that 58.5 per cent of the 600 consumers surveyed in Pune city were aware of e-
waste. Out of the aware consumers, 88.03 per cent of them are of the high income
group and 94.87 per cent of the consumers are post graduate and professionals. The
results show that there is a significant relationship between the education and income
levels of the consumers and their awareness of e-waste. This clearly shows that the
findings of the current study align and confirm with the previous studies conducted as
mentioned in the review of literature (Hornik et al., 2005; Hansmann et al., 2006;
Tonglet et al., 2004). Also 91.45 per cent out of the aware consumers have preference
for proper disposal and management of e-waste.
The present study makes both academic and practical contributions. From an
academic point of view, it contributes to the existing literature in the area of consumer
awareness and preference for proper disposal and management of e-waste. It can also
be used by future researchers to study the role of various stakeholders including the
formal and informal sectors and the techniques used in e-waste management. The
results of this research confirm with many prior studies on e-waste management.
From a managerial point of view, the contributions of the proposed study are as
follows:
One of the key determinants for the future success of E-waste management is the
consumer’s awareness and preference during the disposal of e-waste. These
awareness antecedents are Awareness of toxic effects on human health, Awareness of
Environmental Hazards, Awareness of proper disposal of E-waste, Awareness of E-
waste Management by various stakeholders and Awareness of Convenience of
Recycling. The key stakeholders can draw meaningful insights to understand the
factors which influence consumers’ preference towards management and disposal of
e-waste.
Scope For Further Research :
This paper identifies the awareness antecedents contributing to the consumer’s
preference towards the proper disposal and management of e-waste. Future
researchers may empirically examine the relationships among the consumers’
awareness antecedents of e-waste management.
Further, demographic characteristics like age, income, gender and education play an
important role in the consumers’ awareness and preference of disposal and
management e-waste. Future research may test the effects of these demographic
characteristics on e-waste management.
This research was carried out only in the city of Pune. It would be important to test
these measures in other cities and parts of India to improve the reliability and validity
of the study.
422 Dr. Brijesh Sivathanu
References
[1] Anwesha, Borthaku, (2015). Generation and Management of Electronic Waste
in the City of Pune, India. Bulletin of Science, Technology & Society 2014,
Vol. 34(1-2), 43-52.
[2] Domina, T. & Koch, K. (2002). Convenience and frequency of recycling:
implications for including textiles in curbside recycling programs.
Environment and Behavior, 34, 216-238.
[3] Frost and Sullivan Report (2015). Electronic Waste Management Services in
India-A perspective on growth opportunities, 9835-15.
[4] Gamba, R., & Oskamp, S. (1994). Factors influencing community residents'
participation in commingled curbside recycling programs. Environment and
Behavior, 26, 587-612.
[5] Guagnano, G. A. Stern, P.C. and Dietz, T. (1995). Influences on attitude-
behavior relationships: a natural experiment with curbside recycling.
Environment and Behavior, 27(5), 699-718.
[6] Guerin, D., Crete, J., & Mercier, J. (2001). A multilevel analysis of the
determinants of recycling behavior in the European Countries. Social Science
Research, 30, 195-218.
[7] Hansmann, Ralf, Bernasconi, Petra, Smieszek, Timo, Loukopoulos, Peter,
Scholz, Roland W.,(2006). Justifications and self-organization as determinants
of recycling behavior: the case of used batteries. Resources, Conservation and
Recycling (47), 133-159.
[8] Hornik, Jacob, Cherian Joseph, Mandansky, Michelle, Narayana, Chem.
(2005). Determinant of recycling behavior: a synthesis of research result. The
Journal of Socio-Economics 24(1), 105-127.
[9] Jenkins, R.R., Martinez, S.A., Palmer, K., & Podolsky, M.J. (2003). The
determinants of household recycling: a material-specific analysis of recycling
program features and unit pricing. Journal of Environmental Economics &
Management, 45, 294-318.
[10] Nnorom, I.C., (2009). Survey of willingness of residents to participate in
electronic waste recycling in Nigeria. A case study of mobile phone recycling.
Journal of Cleaner Production. (17) 1629-1637.
[11] Oskamp, S., Harrington, M.J., Edwards, T.C., Sherwood, D.L., Okuda, S.M.,
and Swanson, D.C. (1991). Factors influencing household recycling behavior.
Environment and Behavior, (23),494-519.
[12] Oskamp, S., Burkhardt, R., Schultz, P.W., Hurin, S. & Zelezny, L. (1998).
Predicting three dimensions of residential curbside recycling: An
observational study. Journal of Environmental Education, 29(2), 37-42.
User’s Perspective: Knowledge And Attitude Towards E-Waste 423
[13] Oskamp, S. (1995). Resource conservation and recycling: Behavior and
policy. Journal of Social Issues, 51(4), 157-173.
[14] Scott, D. (1999). Equal opportunity, unequal results: Determinants of
household recycling intensity. Environment and Behavior, 31(2), 267-290.
[15] Takale, K., R., et.al. (2015). Electronic Waste & Its Present Scenario for Pune
City. International Journal of Innovative Research in Science, Engineering and
Technology 4(6), 4238-4244.
[16] Tonglet, Michele, Phillips, Paul S., Read, Adam D.,(2004). Using the theory
of planned behaviour to investigate the determinants of recycling behaviour: a
case study from Brixworth. UK. Resources, Conservation and Recycling (41),
191-214.
[17] Viraja, Bhat, & Yogesh, Patil (2014). E-waste Consciousness and Disposal
Practices among Residents of Pune City. Procedia-Social and Behavioral
Science (133), 491-498.
[18] Zhaoua, Wang, et.al (2011). Willingness and behavior towards e-waste
recycling for residents in Beijing city. China. Journal of Cleaner Production
(19), 977-983.
424 Dr. Brijesh Sivathanu