PRELIMINARY RESULTS OF NATURAL ATTENUATION MODELING IN THE WEST BRANCH CANAL CREEK AREA, ABERDEEN PROVING GROUND, MARYLAND By Jonathan C. Johnson U.S. GEOLOGICAL SURVEY Open-File Report 00-287 In cooperation with the U.S. ARMY GARRISON, ABERDEEN PROVING GROUND ENVIRONMENTAL CONSERVATION AND RESTORATION DIVISION ABERDEEN PROVING GROUND, MARYLAND The contents of this report have been approved for public release and unlimited distribution by the U.S. Army clearance number 3242-A-4. Baltimore, Maryland 2000 USGS science for a changing world
Transcript
PRELIMINARY RESULTS OF NATURAL ATTENUATION MODELING IN THE WEST BRANCH CANAL CREEK AREA, ABERDEEN PROVING GROUND, MARYLAND
By Jonathan C. Johnson
U.S. GEOLOGICAL SURVEY
Open-File Report 00-287
In cooperation with the
U.S. ARMY GARRISON, ABERDEEN PROVING GROUND
ENVIRONMENTAL CONSERVATION AND RESTORATION DIVISION
ABERDEEN PROVING GROUND, MARYLAND
The contents of this report have been approved for public release and unlimited distribution by the U.S. Army clearance number 3242-A-4.
Baltimore, Maryland
2000
USGSscience for a changing world
U.S. DEPARTMENT OF THE INTERIOR
BRUCE BABBITT, Secretary
U.S. GEOLOGICAL SURVEY
Charles G. Groat, Director
The use of trade, product, or firm names in this report is for descriptive purposes only and does not imply endorsement by the U.S. Government.
For additional information Copies of this report can bewrite to: purchased from:
District Chief U.S. Geological SurveyU.S Geological Survey Branch of Information Services8987 Yellow Brick Road Box 25286Baltimore, MD 21237 Denver, CO 80225-0286
Hydrogeology and contaminant distribution .......................................................................4
Numerical model and simplifying assumptions...................................................................8Model domain and discretization.............................................................................9Hydrologic boundary conditions .............................................................................9Simplifying assumptions for the model................................................................. 11
Hydrogeology of the study area.................................................................11Contaminant distribution...........................................................................11Microbiology .............................................................................................14Biodegradation reaction pathways.............................................................14
Model calibration, sensitivity analysis, and results ...........................................................19Calibration of the model ........................................................................................20Model sensitivity analysis......................................................................................22Simulation results..................................................................................................25
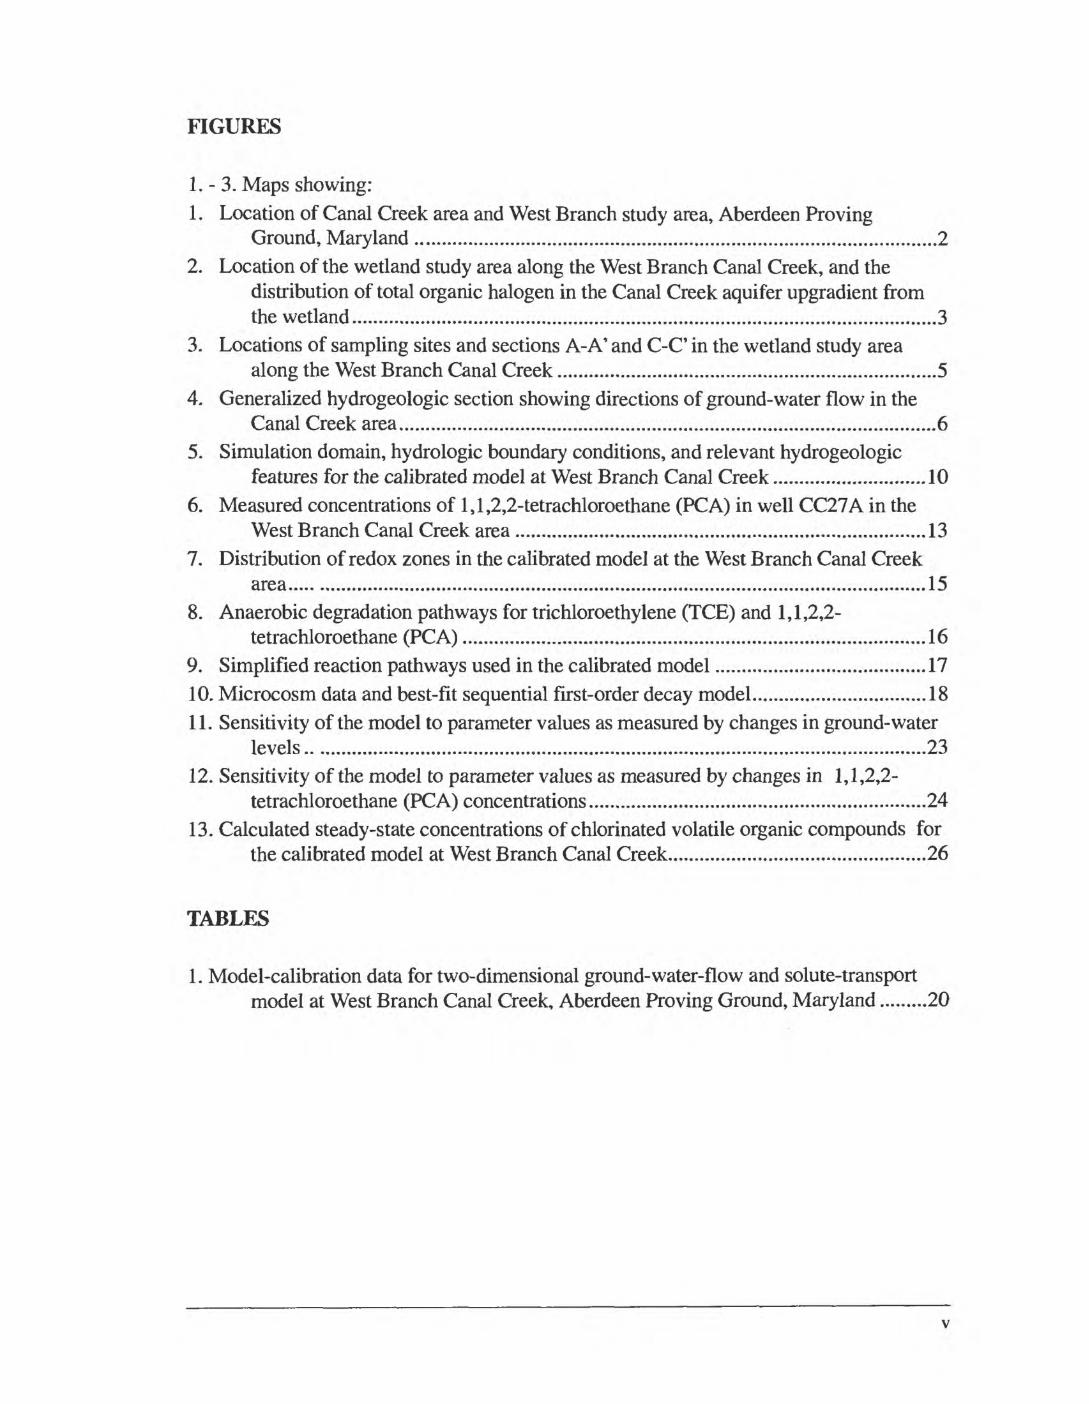
1. - 3. Maps showing:1. Location of Canal Creek area and West Branch study area, Aberdeen Proving
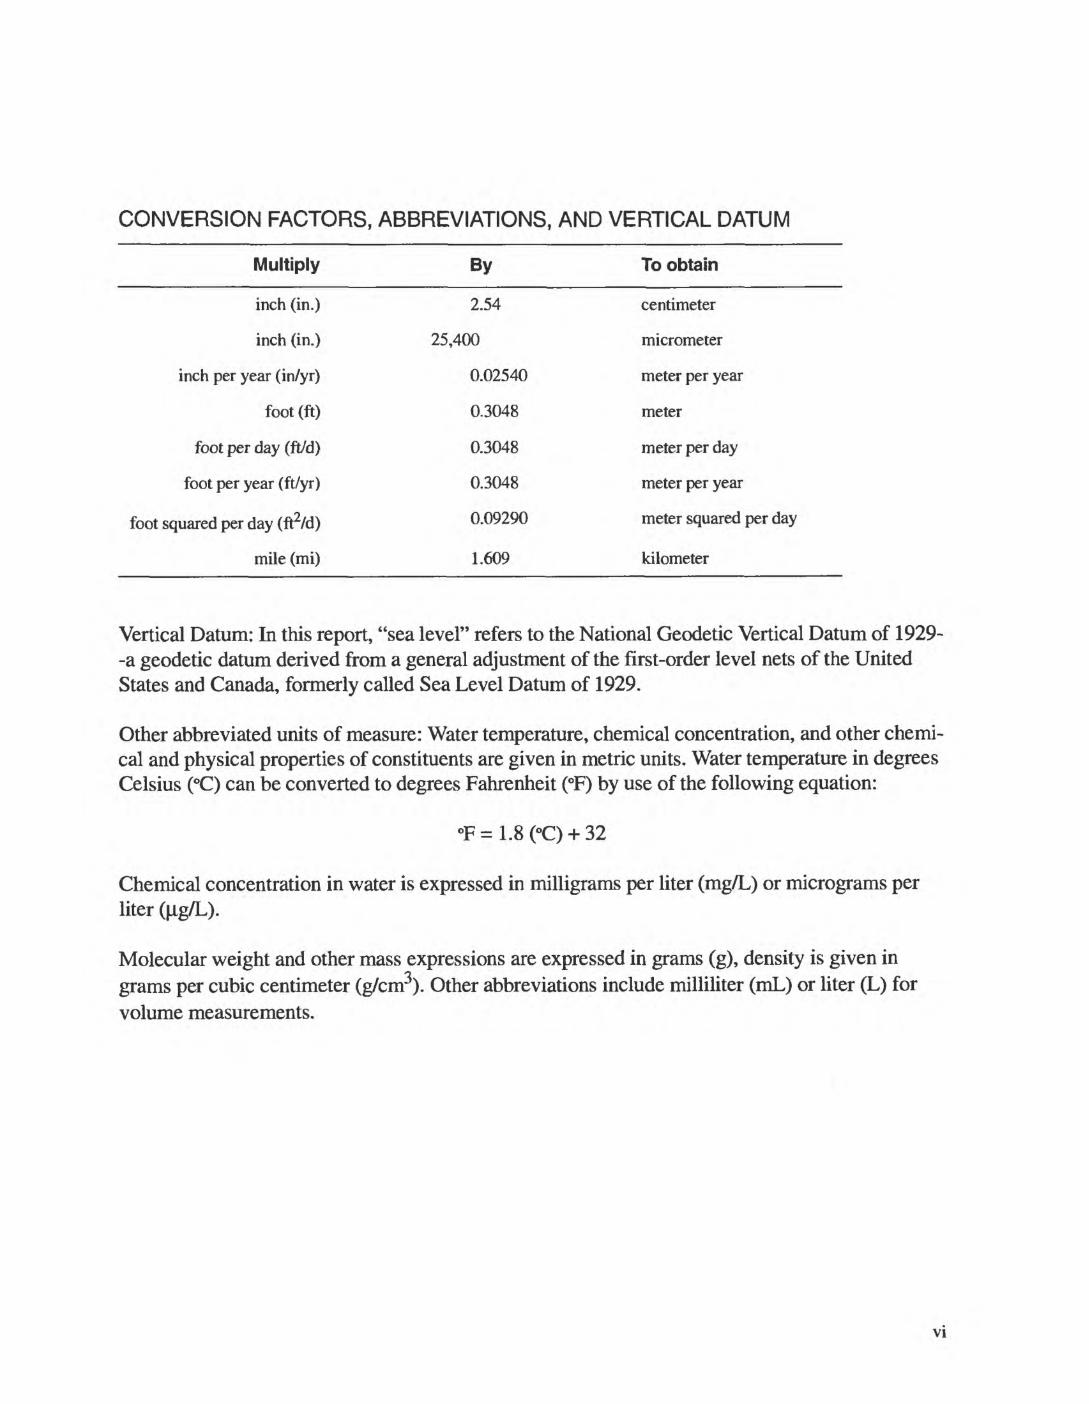
Ground, Maryland ...................................................................................................22. Location of the wetland study area along the West Branch Canal Creek, and the
distribution of total organic halogen in the Canal Creek aquifer upgradient from the wetland...............................................................................................................3
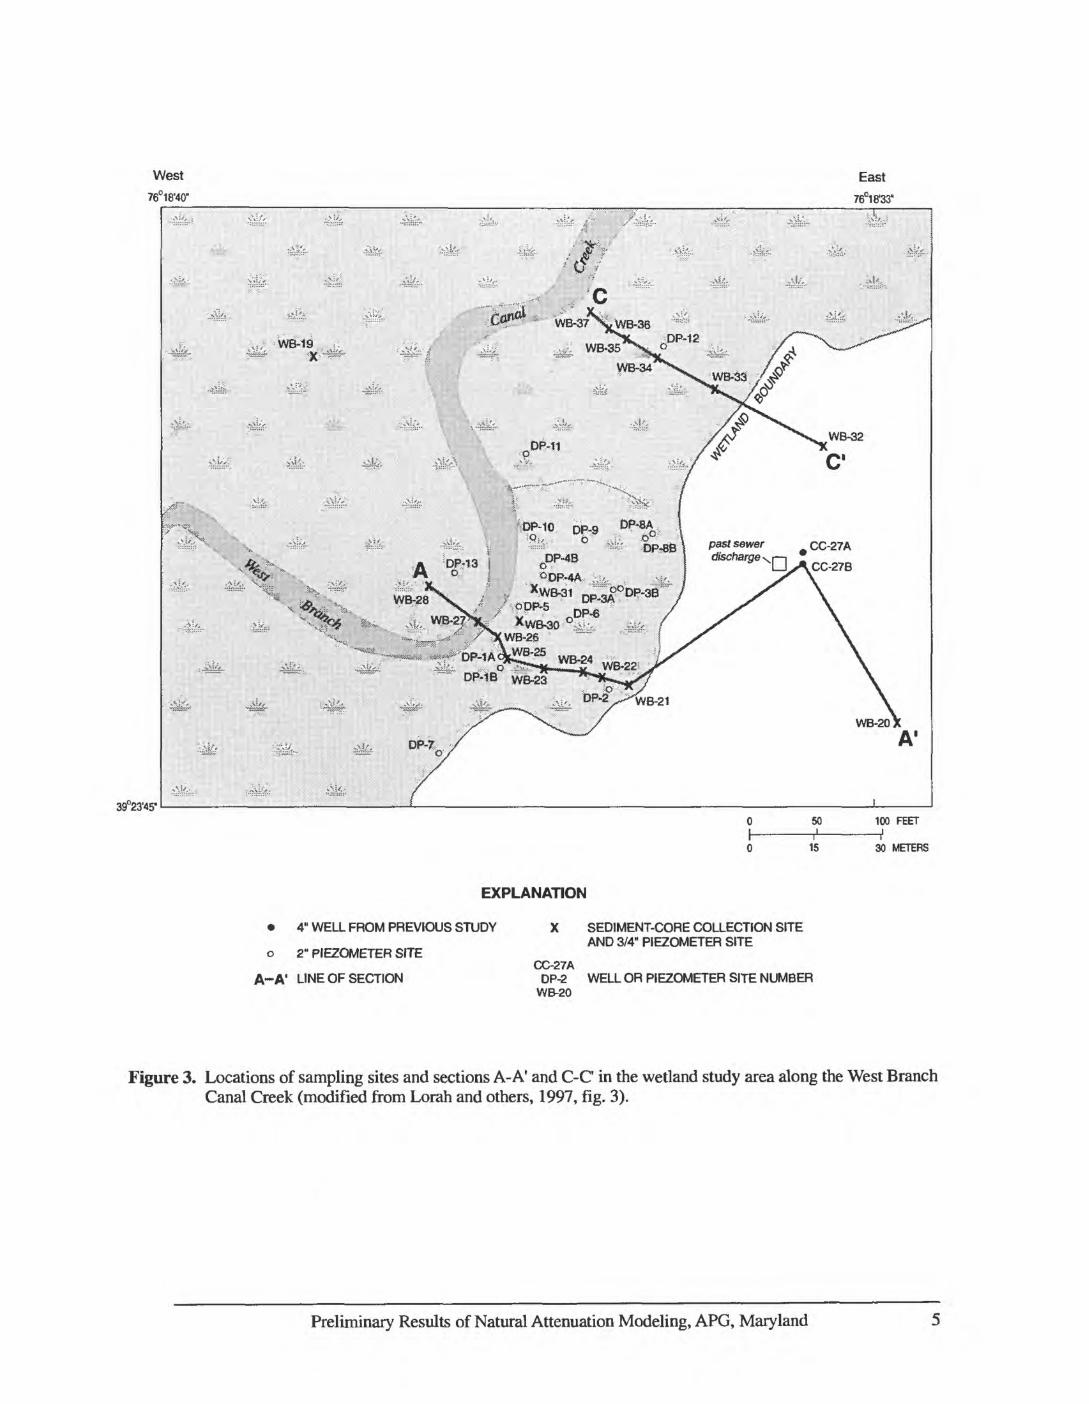
3. Locations of sampling sites and sections A-A' and C-C in the wetland study areaalong the West Branch Canal Creek ........................................................................5
4. Generalized hydrogeologic section showing directions of ground-water flow in theCanal Creek area......................................................................................................6
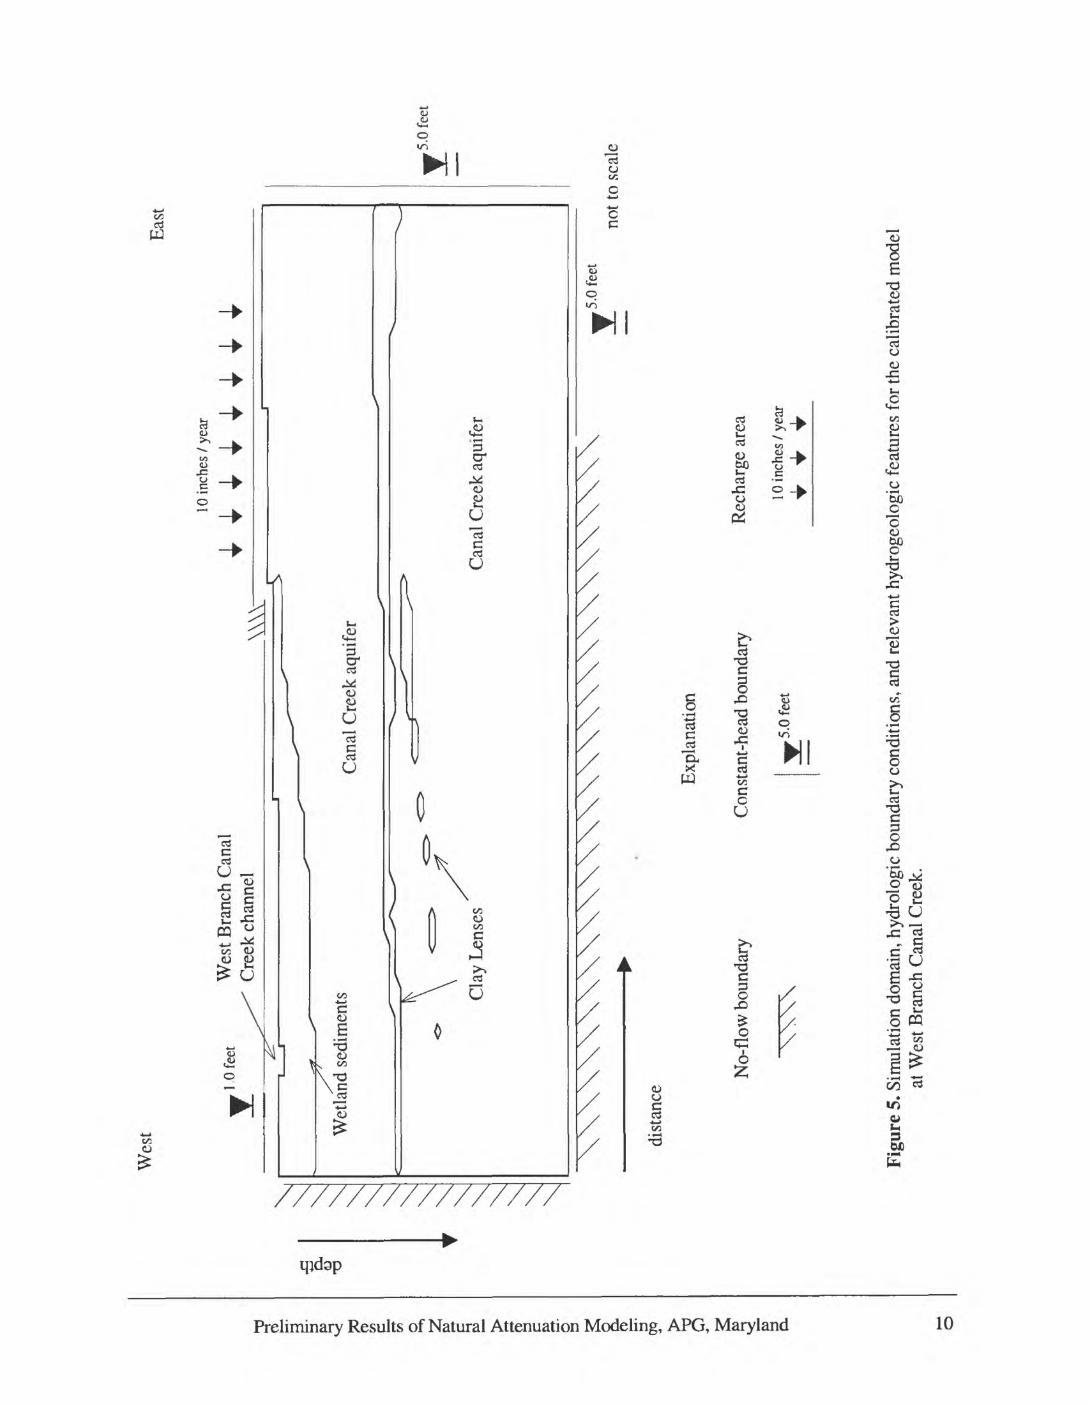
5. Simulation domain, hydrologic boundary conditions, and relevant hydrogeologicfeatures for the calibrated model at West Branch Canal Creek .............................10
6. Measured concentrations of 1,1,2,2-tetrachloroethane (PCA) in well CC27A in theWest Branch Canal Creek area ..............................................................................13
7. Distribution of redox zones in the calibrated model at the West Branch Canal Creekarea........................................................................................................................15
8. Anaerobic degradation pathways for trichloroethylene (TCE) and 1,1,2,2- tetrachloroethane (PCA)........................................................................................16
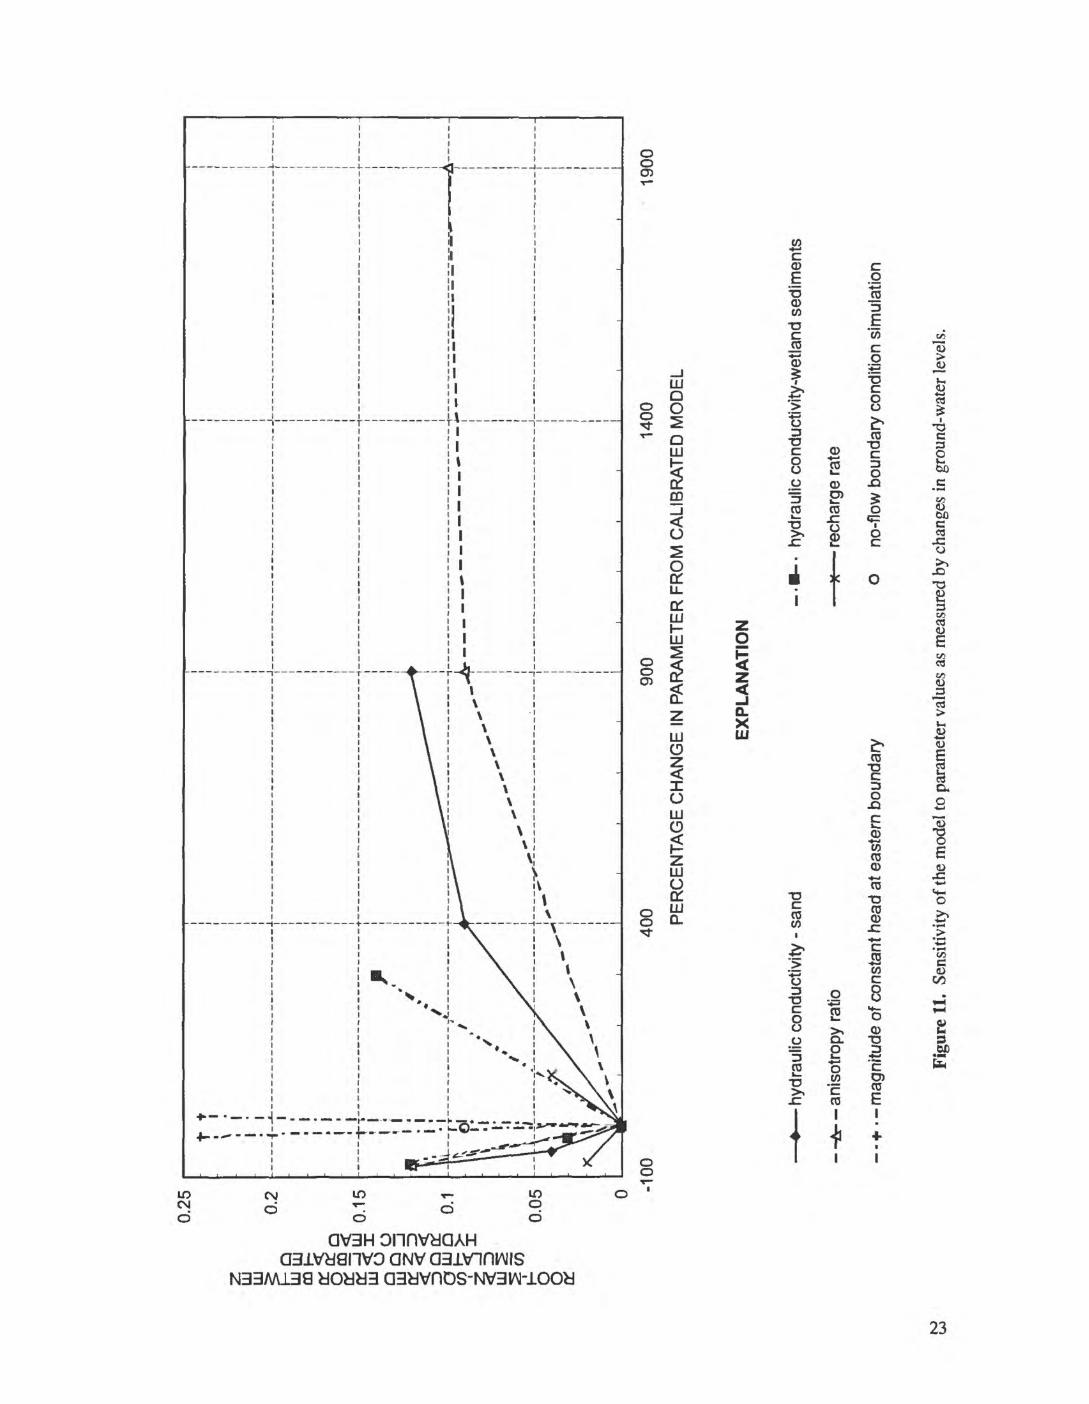
9. Simplified reaction pathways used in the calibrated model ........................................1710. Microcosm data and best-fit sequential first-order decay model................................. 1811. Sensitivity of the model to parameter values as measured by changes in ground-water
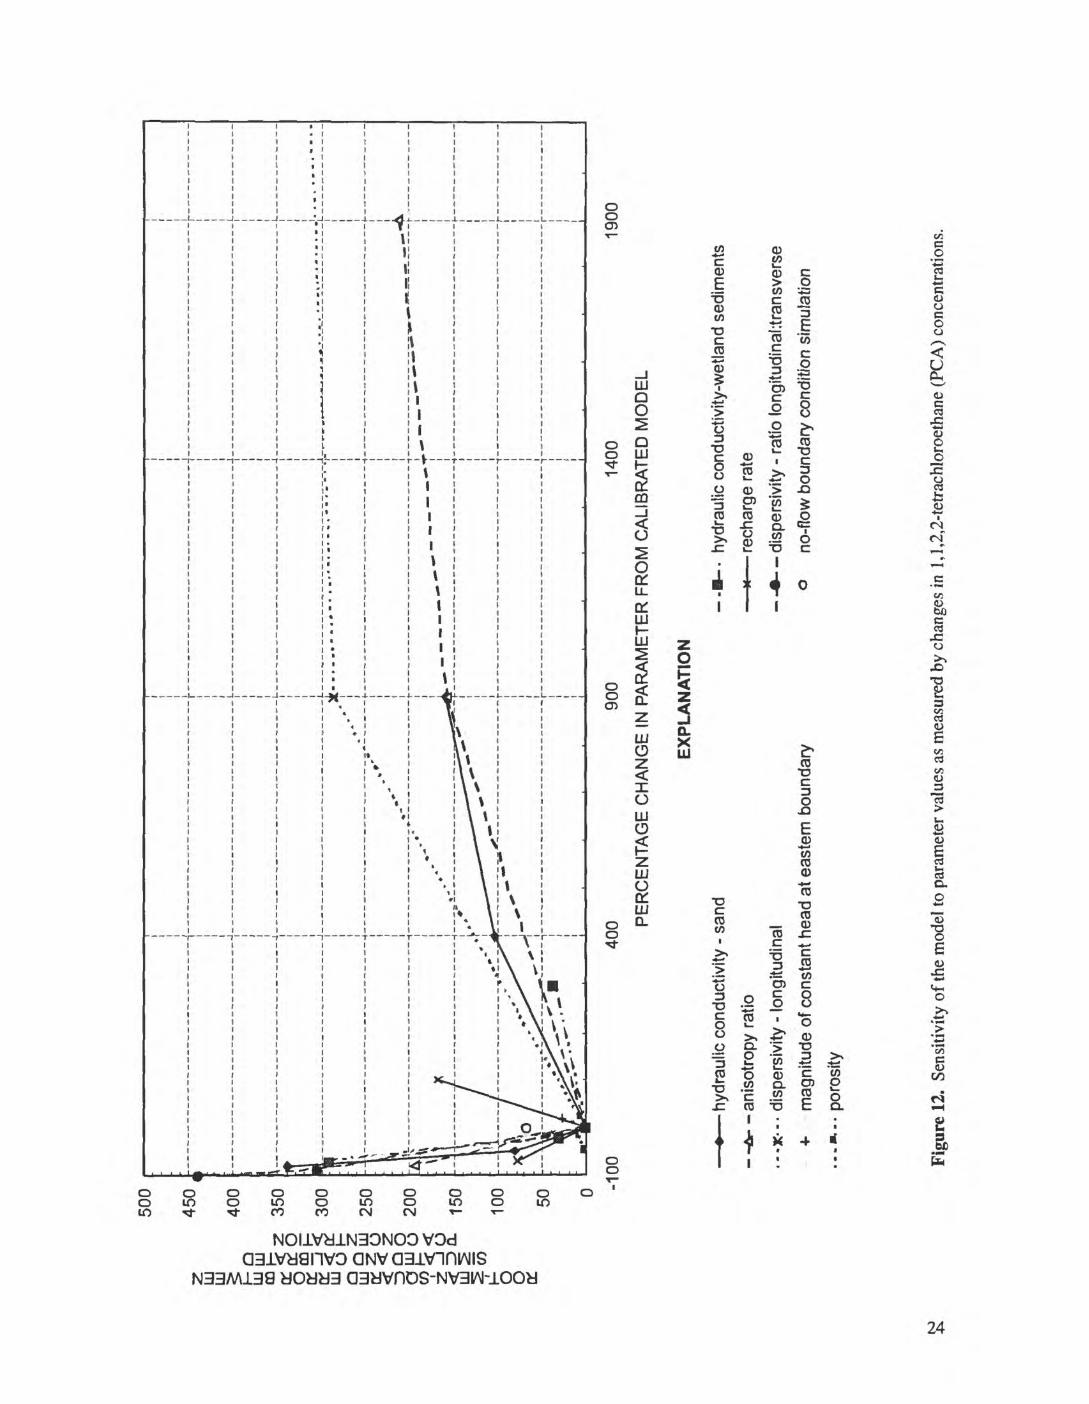
levels.....................................................................................................................2312. Sensitivity of the model to parameter values as measured by changes in 1,1,2,2-
tetrachloroethane (PCA) concentrations................................................................2413. Calculated steady-state concentrations of chlorinated volatile organic compounds for
the calibrated model at West Branch Canal Creek.................................................26
TABLES
1. Model-calibration data for two-dimensional ground-water-flow and solute-transportmodel at West Branch Canal Creek, Aberdeen Proving Ground, Maryland .........20
CONVERSION FACTORS, ABBREVIATIONS, AND VERTICAL DATUM
Multiply
inch (in.)
inch (in.)
inch per year (in/yr)
foot (ft)
foot per day (ft/d)
foot per year (ft/yr)
foot squared per day (ft2/d)
mile (mi)
By
2.54
25,400
0.02540
0.3048
0.3048
0.3048
0.09290
1.609
To obtain
centimeter
micrometer
meter per year
meter
meter per day
meter per year
meter squared per day
kilometer
Vertical Datum: In this report, "sea level" refers to the National Geodetic Vertical Datum of 1929- -a geodetic datum derived from a general adjustment of the first-order level nets of the United States and Canada, formerly called Sea Level Datum of 1929.
Other abbreviated units of measure: Water temperature, chemical concentration, and other chemi cal and physical properties of constituents are given in metric units. Water temperature in degrees Celsius (°C) can be converted to degrees Fahrenheit (°F) by use of the following equation:
°F=1.8(°C) + 32
Chemical concentration in water is expressed in milligrams per liter (mg/L) or micrograms per liter (ug/L).
Molecular weight and other mass expressions are expressed in grams (g), density is given in grams per cubic centimeter (g/cm3). Other abbreviations include milliliter (mL) or liter (L) for volume measurements.
VI
PRELIMINARY RESULTS OF NATURAL ATTENUATION MODELING IN THE WEST BRANCH CANAL CREEK AREA, ABERDEEN PROVING GROUND, MARYLAND
by Jonathan C. Johnson
ABSTRACT
In cooperation with the U.S. Army, the U.S. Geological Survey is investigating the processes of natural attenuation at West Branch Canal Creek, Aberdeen Proving Ground, Maryland. Natural attenuation refers to the naturally occurring processes that serve to reduce mass, or concentration of a contaminant in the environment. Biodegradation, dis persion, and abiotic transformation are possible mechanisms for the reduction of contami nant mass, or concentration in ground water.
West Branch Canal Creek is a tidally influenced freshwater wetland that receives discharge from a sand aquifer beneath the wetland. A plume of chlorinated volatile organic compounds in the aquifer is transported to the wetland sediments where it under goes biodegradation. Previous U.S. Geological Survey studies described the hydrogeol- ogy, geochemistry, and biogeochemistry of this site. This information has been used to simulate the processes of natural attenuation.
Simulations based on data from a limited part of the wetland show that 99.89 per cent of the parent compound 1,1,2,2-tetrachloroethane is removed from the subsurface by biodegradation processes. Simulating the natural attenuation processes required the use of simplifying assumptions regarding the hydrology and transport properties of the materials at the site. The most important simplifying assumptions relevant to the results are as fol lows: (1) the diurnal and seasonal changes in ground-water levels due to the influence of the tides are not included; (2) the ground-water flow and reactive-solute transport are rep resented using a two-dimensional steady-state simulation; and (3) a simplified set of bio degradation reactions is employed rather than the whole set of reactions and resultant daughter products. The model is sensitive to dispersivity and velocity, and would benefit from additional data on these parameters.
INTRODUCTION
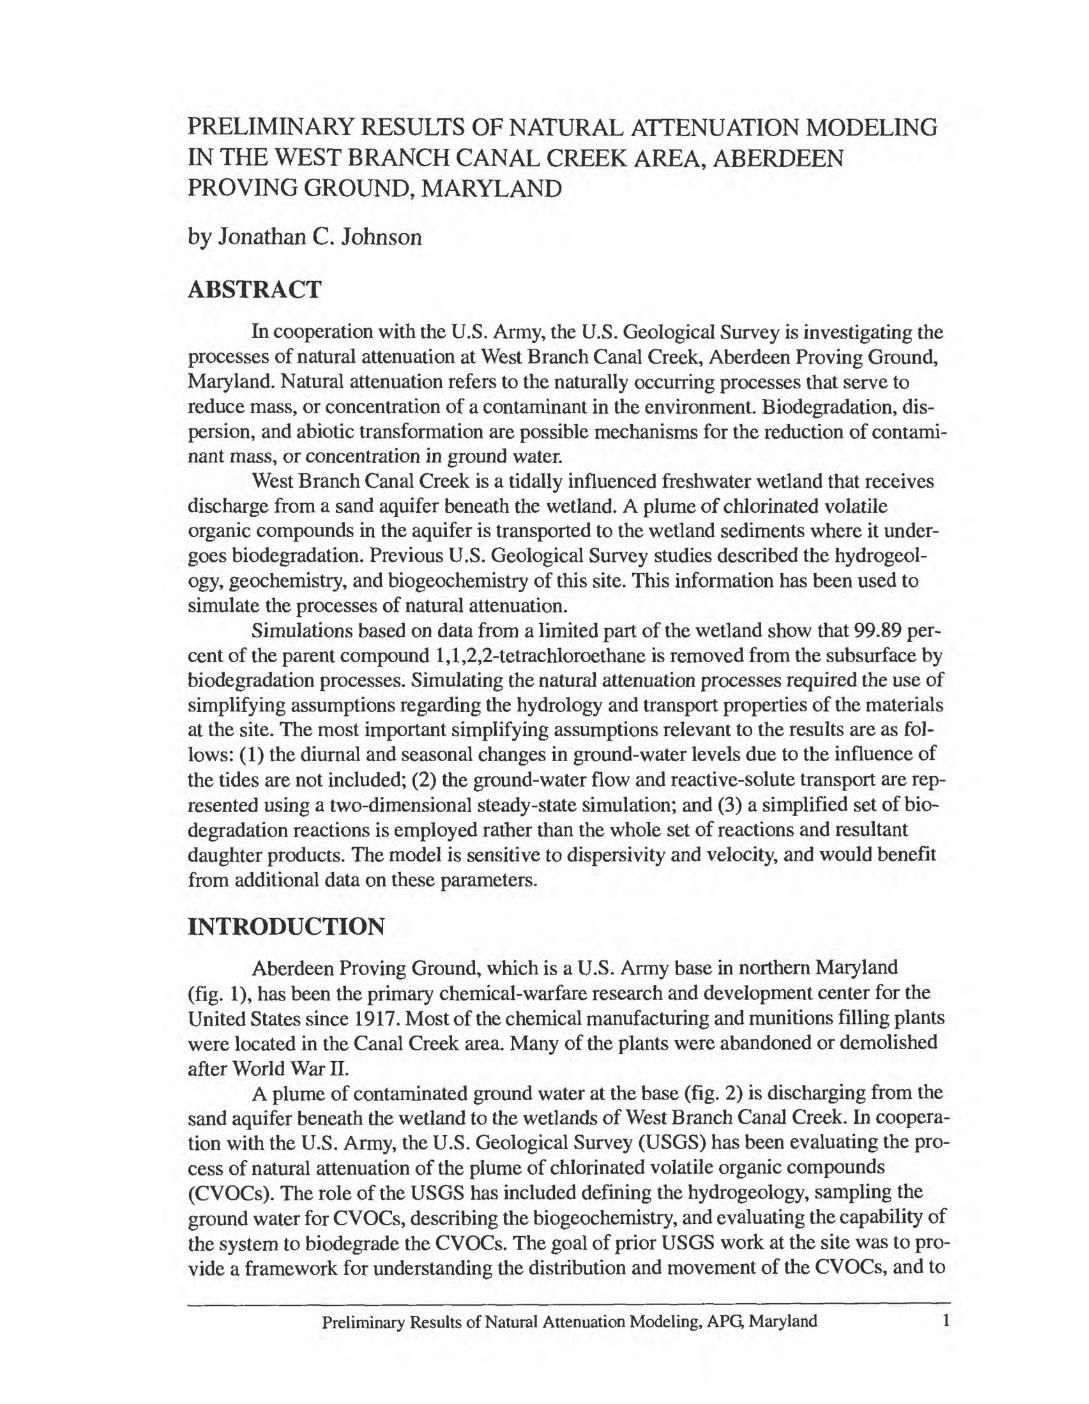
Aberdeen Proving Ground, which is a U.S. Army base in northern Maryland (fig. 1), has been the primary chemical-warfare research and development center for the United States since 1917. Most of the chemical manufacturing and munitions filling plants were located in the Canal Creek area. Many of the plants were abandoned or demolished after World War II.
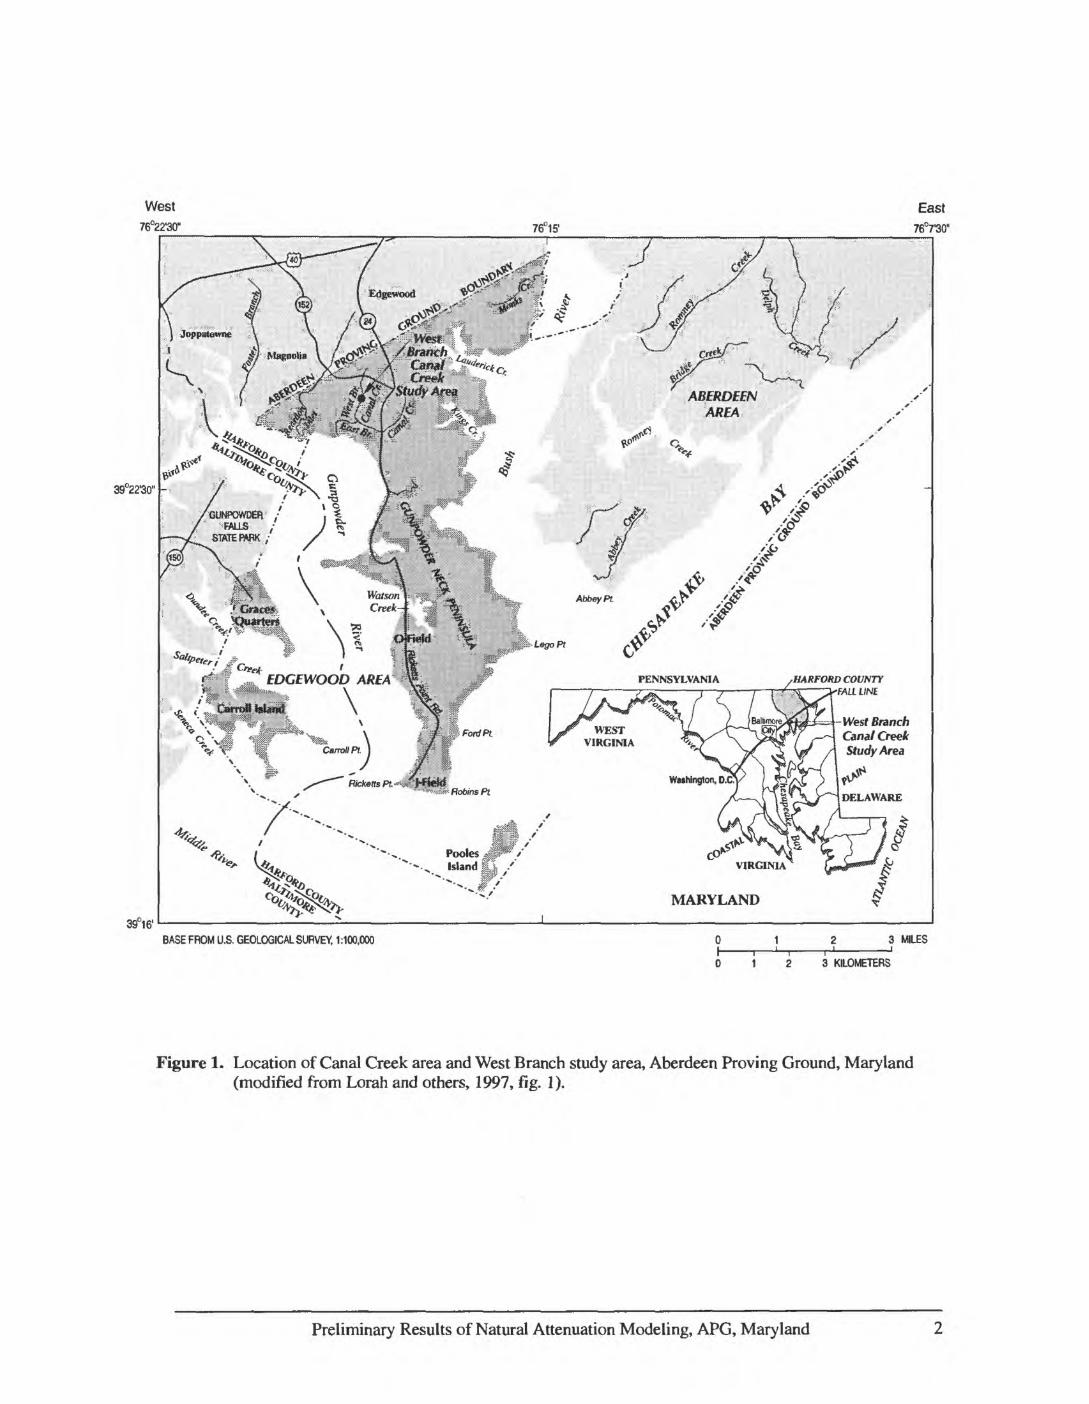
A plume of contaminated ground water at the base (fig. 2) is discharging from the sand aquifer beneath the wetland to the wetlands of West Branch Canal Creek. In coopera tion with the U.S. Army, the U.S. Geological Survey (USGS) has been evaluating the pro cess of natural attenuation of the plume of chlorinated volatile organic compounds (CVOCs). The role of the USGS has included defining the hydrogeology, sampling the ground water for CVOCs, describing the biogeochemistry, and evaluating the capability of the system to biodegrade the CVOCs. The goal of prior USGS work at the site was to pro vide a framework for understanding the distribution and movement of the CVOCs, and to
Preliminary Results of Natural Attenuation Modeling, APG, Maryland 1
West76°22'30"
39022'30" -
GUNPOWDER /KftLLS
- SWTEBWK,;
=4-Mfesf Branch Cana/ Creet Study/Area
BASE FROM U.S. GEOLOGICAL SURVEY, 1:100,000
1 2 3 KILOMETERS
Figure 1. Location of Canal Creek area and West Branch study area, Aberdeen Proving Ground, Maryland (modified from Lorah and others, 1997, fig. 1).
Preliminary Results of Natural Attenuation Modeling, APG, Maryland
West East76°19' 76°18'
39°24' -
BASE MODIFIED FROM EDGEWOOD ENGINEERING PLANS AND SERVICES DIVISION MAP. ABERDEEN PROVING GROUND. 1984
1.000 2,000 FEET
250 500 METERS
EXPLANATION
7 .ȣ) APPROXIMATE LINE OF EQUAL TOTAL ORGANIC HALOGEN CONCENTRATION - Interval, in micrograms per liter, is variable. Queried where uncertain. Sampled in July-September 1988,
WELL SITE
Figure 2. Location of the wetland study area along the West Branch Canal Creek, Aberdeen Proving Ground, Maryland, and the distribution of total organic halogen in the Canal Creek aquifer upgradient from the wetland (from Lorah and others, 1997, fig.2).
Preliminary Results of Natural Attenuation Modeling, APG, Maryland
quantify the extent of natural attenuation. The objectives of this report are to begin to quantify the effect of biodegradation on the fate of the CVOCs, and to begin to examine the sensitivity of the system to changes in environmental conditions.
This report presents preliminary results of simulations of natural attenuation of CVOCs along a transect (C-C in figure 3) perpendicular to and extending about 200 feet southeasterly from the creek. The results presented here, which are based on two-dimen sional ground-water-flow and contaminant-transport modeling conducted by the USGS during Federal fiscal years 1998 and 1999, are considered preliminary in that the simu lated distribution of CVOC daughter products has not been calibrated to actual data. The long-term modeling objectives are to quantify the natural attenuation processes at West Branch Canal Creek, and to examine the sensitivity of the system to changes in environ mental conditions.
The hydrogeology of the Canal Creek area is described in Oliveros and Vroblesky (1989), and the ground-water chemistry and the distribution of organic and inorganic con taminants in the area are described in Lorah and Vroblesky (1989). These reports delin eated the extent of the contamination in the Canal Creek area and helped to guide subsequent investigations. Historical industrial production data were combined with mea sured concentration distributions and hydrogeologic information to divide the Canal Creek area into subregions of similar character (Lorah and Clark, 1996). This division into subregions helped focus subsequent studies into well-defined units. Results of the investi gation of the CVOC contamination along West Branch Canal Creek are presented in con sultant reports (such as Jacobs Engineering Group Inc., 1995), and two USGS publications a report describing the data and data-collection methods (Olsen and others, 1997), and a report describing analysis of the data and the transformation of the contaminants by natu ral attenuation processes (Lorah and others, 1997). This report builds on the analysis com pleted by Lorah and others (1997), using the conceptual model developed therein, hydraulic heads, contaminant distribution, and distribution of microbiological indicators, to construct numerical simulations of the fate and transport of the contaminants along West Branch Canal Creek.
HYDROGEOLOGY AND CONTAMINANT DISTRIBUTION
West Branch Canal Creek is a tidally influenced freshwater wetland. The discharge to the wetland is primarily from local ground-water-flow systems recharged by infiltra tion. The wetland sediments are organic-rich silts and clays that are 7 to 12 feet (ft) thick. The wetland sediments are comprised of an upper peat unit and a lower clayey unit. The upper unit has a higher organic content and slightly different mineralogy than the lower unit (Lorah and others, 1997). Approximately 40 to 45 ft of sand and gravel of the Canal Creek aquifer underlie the wetland sediments. This aquifer becomes thinner on the west side of West Branch Canal Creek. Thin, discontinuous clay lenses are common in the Canal Creek aquifer. Beneath this aquifer is a 60-ft-thick clay confining unit, known as the lower confining unit.
Preliminary Results of Natural Attenuation Modeling, APG, Maryland
39°23'45"
- DPrBB\ past sewer CC-27A discharge^
50 100 FEET
30 METERS
EXPLANATION
4" WELL FROM PREVIOUS STUDY
o 2" PIEZOMETER SITE
A-A1 LINE OF SECTION
X SEDIMENT-CORE COLLECTION SITE AND 3/4" PIEZOMETER SITE
CC-27ADP-2 WELL OR PIEZOMETER SITE NUMBER
WB-20
Figure 3. Locations of sampling sites and sections A-A1 and C-C in the wetland study area along the West Branch Canal Creek (modified from Lorah and others, 1997, fig. 3).
Preliminary Results of Natural Attenuation Modeling, APG, Maryland
Stud
y A
rea
i i £3
ft 5'
I I (TO
Wes
t '
o7
w»
Eas
t
EX
PL
AN
AT
ION
^
GR
OU
ND
-WA
TE
R-F
LO
W D
IRE
CT
ION
I R
EC
HA
RG
E A
RE
A
NO
T T
O S
CA
LE
D.
Figu
re 4
. Gen
eral
ized
hyd
roge
olog
ic s
ectio
n sh
owin
g di
rect
ions
of g
roun
d-w
ater
flo
w
in th
e C
anal
Cre
ek a
rea
(mod
ified
fro
m L
orah
and
oth
ers,
199
7, f
ig. 4
).
The uplands surrounding the creek have been the site for military-industrial activi ties since World War I. The surface materials are composed of redistributed native materi als and fill materials. The native surface materials consist of an upper confining unit (silts and clays) that is replaced by surficial aquifer materials in some places. The surface is paved in many locations, and the top layer over much of the area nearest the creek is com posed of heterogeneous fill materials. In regions where the surficial aquifer is present, space between paved areas allows infiltrating water to recharge the local ground-water- flow system. Depth to water ranges from about 5 ft to 20 ft below land surface in the upland areas. A generalized hydrogeologic section showing directions of ground-water flow is shown in figure 4.
Measurements of hydraulic head, contaminant distribution, and microbiological indicators are reported in Lorah and others (1997) and Olsen and others (1997). Those investigations focused on CVOC distribution and indicators of microbiological activity. The data were gathered primarily along two transects, one north and one south of well CC27A, near the location of the former sewer discharge along West Branch Canal Creek (fig. 3). Each transect runs roughly perpendicular to the creek from the upland area beside the wetland, across the eastern part of the wetland to the creek. The southern transect con tinues across the creek. Each transect traverses roughly 200 ft of wetland and contains at least five well clusters.
Synoptic measurements of hydraulic head were made periodically along these transects from March 1995 to July 1999. Continuous measurements of hydraulic head were made at several locations to investigate tidal influence on the Canal Creek aquifer, and to define hydraulic parameters for the Canal Creek aquifer and the wetland sediments.
Hydraulic conductivities were estimated by use of slug tests and analysis of the effects of tides in both the Canal Creek aquifer and in the wetland sediments. The esti mated hydraulic conductivity in the Canal Creek aquifer ranges from 10 to 0.01 feet per day (ft/d) (Lorah and others, 1997). The estimated hydraulic conductivity of the wetland sediments ranges from 0.4 to 0.0003 ft/d (Lorah and others, 1997).
Sorption of CVOCs to the Canal Creek aquifer sediments is expected to be mini mal due to the lack of organic carbon in the sediment [median fraction organic carbon, 0.000026, based on 32 samples (Lorah and Vroblesky, 1989)]. In the wetland sediments, however, the organic-carbon content is quite high, averaging 18 percent in the upper peat unit, and the expected retardation coefficient for the CVOCs of interest is between 6 and 10 (Lorah and others, 1997). The retardation coefficient for the aquifer sediment is assumed to be 1 for this study.
Comprehensive measurement of the spatial distribution of ground-water contami nants and microbiological indicators was conducted once between June and October 1995 (Olsen and others, 1997). Interpretation of the contaminant distribution along the transects in two-dimensional profile is presented in Lorah and others (1997). Indicators of microbi ological activity allow the transects to be divided into regions where dominant oxidation- reduction (redox) processes take place (Lorah and others, 1997). Distribution of redox processes in the subsurface is important because redox conditions affect microbial trans formation of CVOCs.
Chlorinated organic contaminants at the site include trichloroethylene (TCE); 1,1,2,2- tetrachloroethane (PCA); 1,1,2- trichloroethane (112TCA); chloroform; carbon tetrachloride; cis-1,2- dichloroethylene (c/s-DCE); trans-1,2- dichloroethylene (trans- DCE); 1,2- dichloroethane (12DCA); and vinyl chloride (VC). The original contaminants
Preliminary Results of Natural Attenuation Modeling, APG, Maryland 7
are presumed to be PCA, TCE, chloroform, and carbon tetrachloride. Most other CVOCs observed at the site are presumed to be the product of biodegradation processes acting on these compounds. The primary CVOCs of concern are PCA and TCE, because their con centrations are higher than the concentrations of the other CVOCs at West Branch Canal Creek. PCA was present at the highest concentration of any CVOC at the site, especially along the northern transect. The highest measured concentration of CVOCs in the vicinity of the northern transect was in well CC27A, which is near a former sewer-line discharge point that may have contributed to the CVOC contamination. The degradation products of PCA and TCE are discussed in more detail in Lorah and others (1997).
The first-order biodegradation rate for PCA under methanogenic conditions was about 0.25 per day, as measured by anaerobic microcosm studies (Lorah and others, 1997). A similar rate was found for TCE under methanogenic conditions.
NUMERICAL MODEL AND SIMPLIFYING ASSUMPTIONS
At West Branch Canal Creek, several major processes contribute to the natural attenuation of CVOCs in ground water. Among the most important are biodegradation, dispersion in ground water, and sorption of the CVOCs to soil sediment. No numerical model currently exists that is ideally suited to quantifying all of the natural attenuation processes at West Branch Canal Creek; however, the USGS model BIOMOC (Essaid and Bekins, 1997) can be helpful in quantifying some of them.
BIOMOC is a multispecies solute-transport model that provides for simulation of biodegradation. It can simulate ground-water flow and solute transport in two dimensions and is capable of simulating complex reaction pathways. The transport solution is based on the USGS Method of Characteristics model, MOC (Konikow and Bredehoeft, 1978). BIOMOC, however, has limitations in its application to the study area. The flow package in the model does not allow for simulation of tides. Although the model allows for distrib uted parameters (properties that vary with location) such as hydraulic conductivity, initial concentration of contaminants, and biologic populations, it is not capable of simulating distributed retardation coefficients. The results of simulations made with this model must be interpreted with these limitations in mind.
The specific equations solved and the solution algorithm used are presented in the BIOMOC documentation report (Essaid and Bekins, 1997). Specific simplifications to the equations used in this study are as follows: (1) the flow equation is solved as a steady-state equation; (2) the transport simulations are run until the solutes have reached steady state; however, the Method of Characteristics transport algorithm requires that the equation be solved as a transient equation; (3) the multiple Monod formulation of the biodegradation equations is used, and competitive inhibition factors are used to limit biodegradation reac tions to specific spatial locations (to keep biodegradation in the anaerobic zone only); (4) biologic populations are assumed to be at steady state; and (5) first-order decay is simu lated using the method described in the documentation report (Essaid and Bekins, 1997), rather than the full Monod kinetics formulation.
Preliminary Results of Natural Attenuation Modeling, APG, Maryland
Model Domain and Discretization
The area simulated by the model is a two-dimensional slice along transect C-C' (fig. 3). The model boundary is about 30 ft east of well WB33 and extends beyond the creek channel. The simulation domain, the relevant hydrogeologic features, and the boundary conditions for flow are shown in figure 5. To adequately represent the complex reactions occurring within the wetland sediments, the model required a fine discretization. BIOMOC uses a uniform grid spacing for each spatial dimension. Grid blocks in these simulations are 4.9 ft long (horizontally) by 1.3 ft high (vertically), with a domain 68 blocks long and 60 blocks high. BIOMOC simulates the domain as a two-dimensional sys tem but allows a thickness for each block. For the simulations presented here, the domain is assumed to be 3.3 ft thick. Using a two-dimensional model requires the simplifying assumption that the model can adequately represent the ground-water flow and transport in only two spatial dimensions.
The steady-state ground-water-flow equation is solved to obtain velocities for the solute-transport algorithm, which is used in this case to simulate steady-state solute condi tions. This is accomplished by running the transport simulations until the concentration at each of the calibration locations is no longer changing with time. The transport algorithm uses the Method of Characteristics to solve the transport equations for solutes in ground water. The maximum time step is set by specifying the maximum distance (measured in number of grid blocks) a particle may travel in one time step. The maximum distance allowed in these simulations is one-half the size of a grid block.
Hydrologic Boundary Conditions
Hydrologic boundary conditions for the simulations (fig. 5) were selected on the basis of measured ground-water levels and the ability of a boundary condition to ade quately represent the calibration data. The eastern boundary of the domain is represented by a constant-head boundary of 5.0 ft. A no-flow boundary was selected for the western boundary of the simulation because the wetland is conceptualized as a discharge zone that is the same east of the creek as it is west of the creek. This conceptualization results in a model that assumes the ground-water-flow system is symmetric about the western model boundary. The lack of ground-water-level data in the wetland for the western side of the creek makes selection of this boundary condition and its location somewhat arbitrary.
The bottom of the domain is divided into two sections. The western part of the bot tom boundary is represented by a no-flow boundary because of the presence of the lower confining unit. The eastern part of the lower boundary is represented by a constant-head boundary identical to the magnitude at the eastern boundary (5.0 ft in the calibrated simu lation). This boundary condition was selected on the basis of its ability to represent the observed hydraulic heads in the lower part of the domain.
Preliminary Results of Natural Attenuation Modeling, APG, Maryland
Wes
tEa
st
S, 1 i I S
10 in
ches
/ ye
aro
feet
Wes
t Bra
nch
Can
al
^ C
reek
cha
nnel
\\\\
-
Wet
land
sed
imen
tsC
anal
Cre
ek a
quif
er
Cla
y L
ense
sC
anal
Cre
ek a
quif
er
, 5.0
fee
t
,5.0
fee
tno
t to
sca
le
dist
ance
No-
flow
bou
ndar
y
Exp
lana
tion
Con
stan
t-he
ad b
ound
ary
5.0
feet
Rec
harg
e ar
ea
10 in
ches
/ ye
ar
Figu
re 5
. Sim
ulat
ion
dom
ain,
hyd
rolo
gic
boun
dary
con
ditio
ns, a
nd r
elev
ant h
ydro
geol
ogic
fea
ture
s fo
r the
cal
ibra
ted
mod
el
at W
est B
ranc
h C
anal
Cre
ek.
The top of the domain is divided into three sections. The western part of the domain, which is regularly inundated by the tides, is modeled as a constant-head boundary of 1.0 ft (approximate mean value for the tide at this location). The central part of the domain is simulated as a no-flow boundary. This region is assumed to act as a recharge zone some of the time and as a discharge area at other times. The average condition for this region is assumed to be neither recharge nor discharge. The eastern part of the domain is simulated as a recharge area, with a value of 10 inches (in.) of recharge per year. This number was selected on the basis of a reduced value from the calibrated flow model of Lorah and Clark (1996), which used a recharge rate of 13.5 inches per year (in/yr) for the upland regions of the Canal Creek area. This value was decreased to 10 in/yr because it was assumed that the near-stream sediments of this region are likely to reach saturation with less recharge (thereby becoming discharge areas) than the average sediments of the upland areas.
Simplifying Assumptions for the Model
Several important simplifying assumptions are made in these simulations. The major assumptions are organized into four categories that are discussed below: hydrogeol- ogy, contaminant distribution, microbiology, and biodegradation reaction pathways. The most important simplifying assumptions relevant to the results are as follows: (1) the diur nal and seasonal changes in ground-water levels due to the influence of the tides are not included; (2) ground-water flow and reactive-solute transport are represented using a two- dimensional steady-state simulation; and (3) a simplified set of biodegradation reactions is employed rather than the whole set of reactions and resultant daughter products.
Hydrogeology of the Study Area
West Branch Canal Creek is a tidally influenced freshwater wetland, with a tidal range of approximately 2 ft. At low tide, West Branch Canal Creek is about 15 ft wide where the northern transect crosses it. At high tide, the creek can be wider than 350 ft. The tides influence ground-water levels in most of the wells along the creek and in the wet land, and there are also seasonal changes in ground-water levels. Seasonal fluctuations in recharge result in fluctuating ground-water levels, particularly in the upland areas. For this preliminary model, both the influence of the tides and the influence of seasonal changes in recharge are ignored. As a simplifying assumption, the ground-water levels in this model are assumed to be at steady state. The simulations of ground-water flow are therefore cal culated using the equations for steady-state ground-water flow.
BIOMOC simulates two-dimensional ground-water flow. Using BIOMOC to sim ulate the northern transect requires the assumption that the direction of ground-water flow is parallel to the transect.
Contaminant Distribution
Comprehensive sampling of the wells in the wetland for CVOCs was performed only once between June and October 1995 (Olsen and others, 1997). From this sample data and the interpretations by Lorah and others (1997), it is not possible to obtain infor mation needed for determining time scales necessary for simulation. Historical records from the area do not show when the contamination reached the ground water. The best
Preliminary Results of Natural Attenuation Modeling, APd Maryland 11
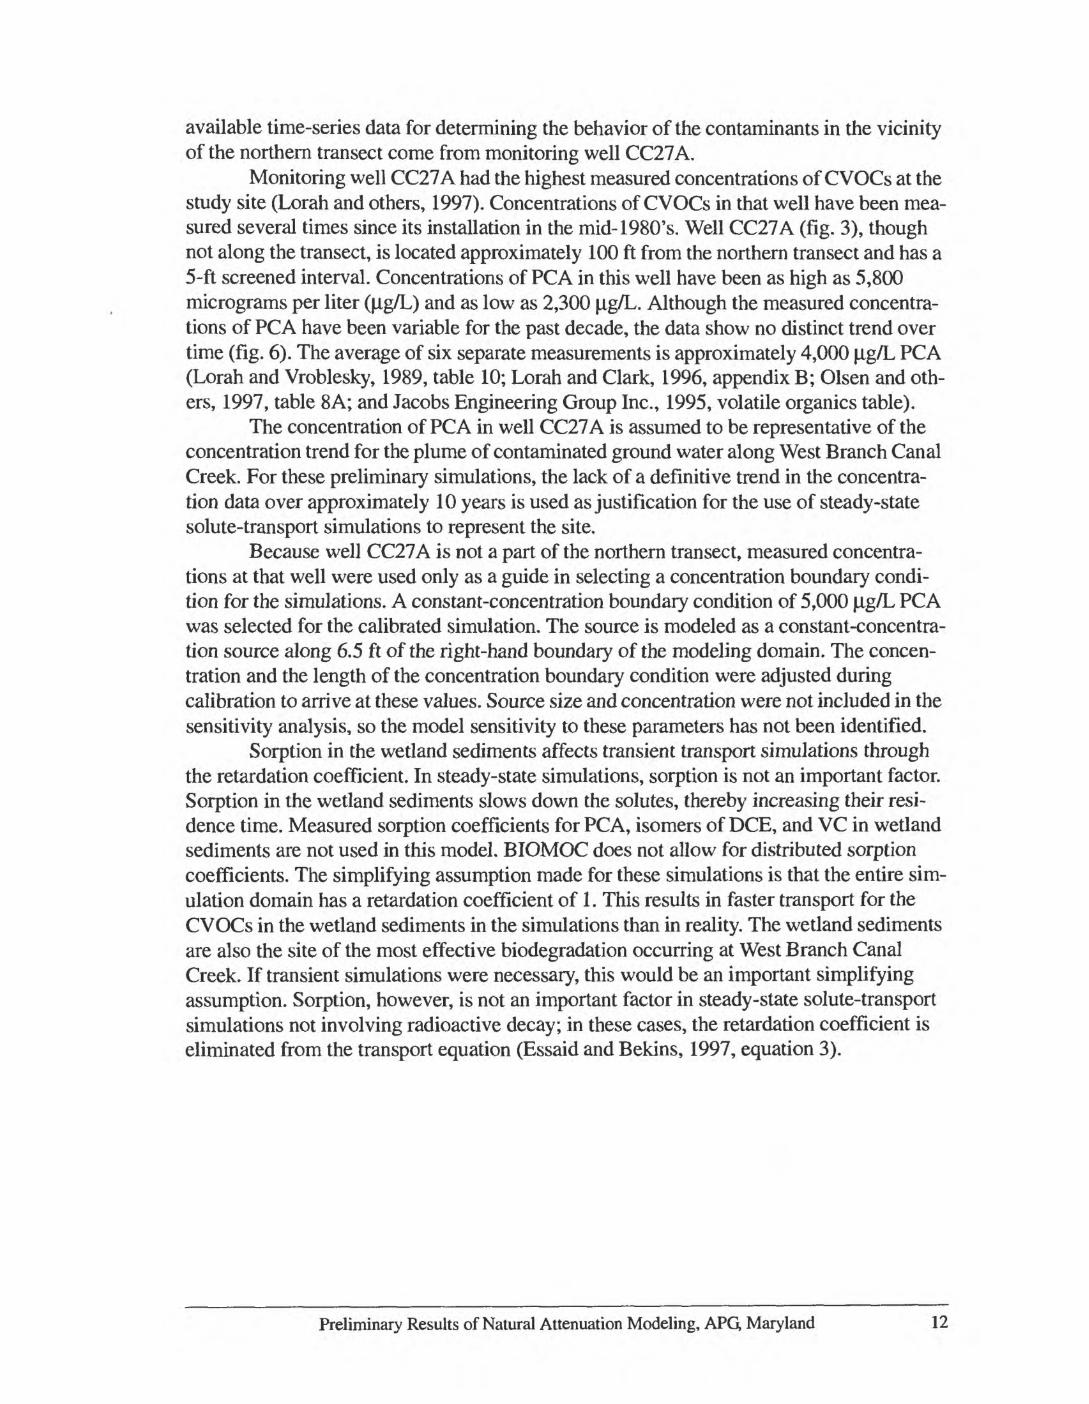
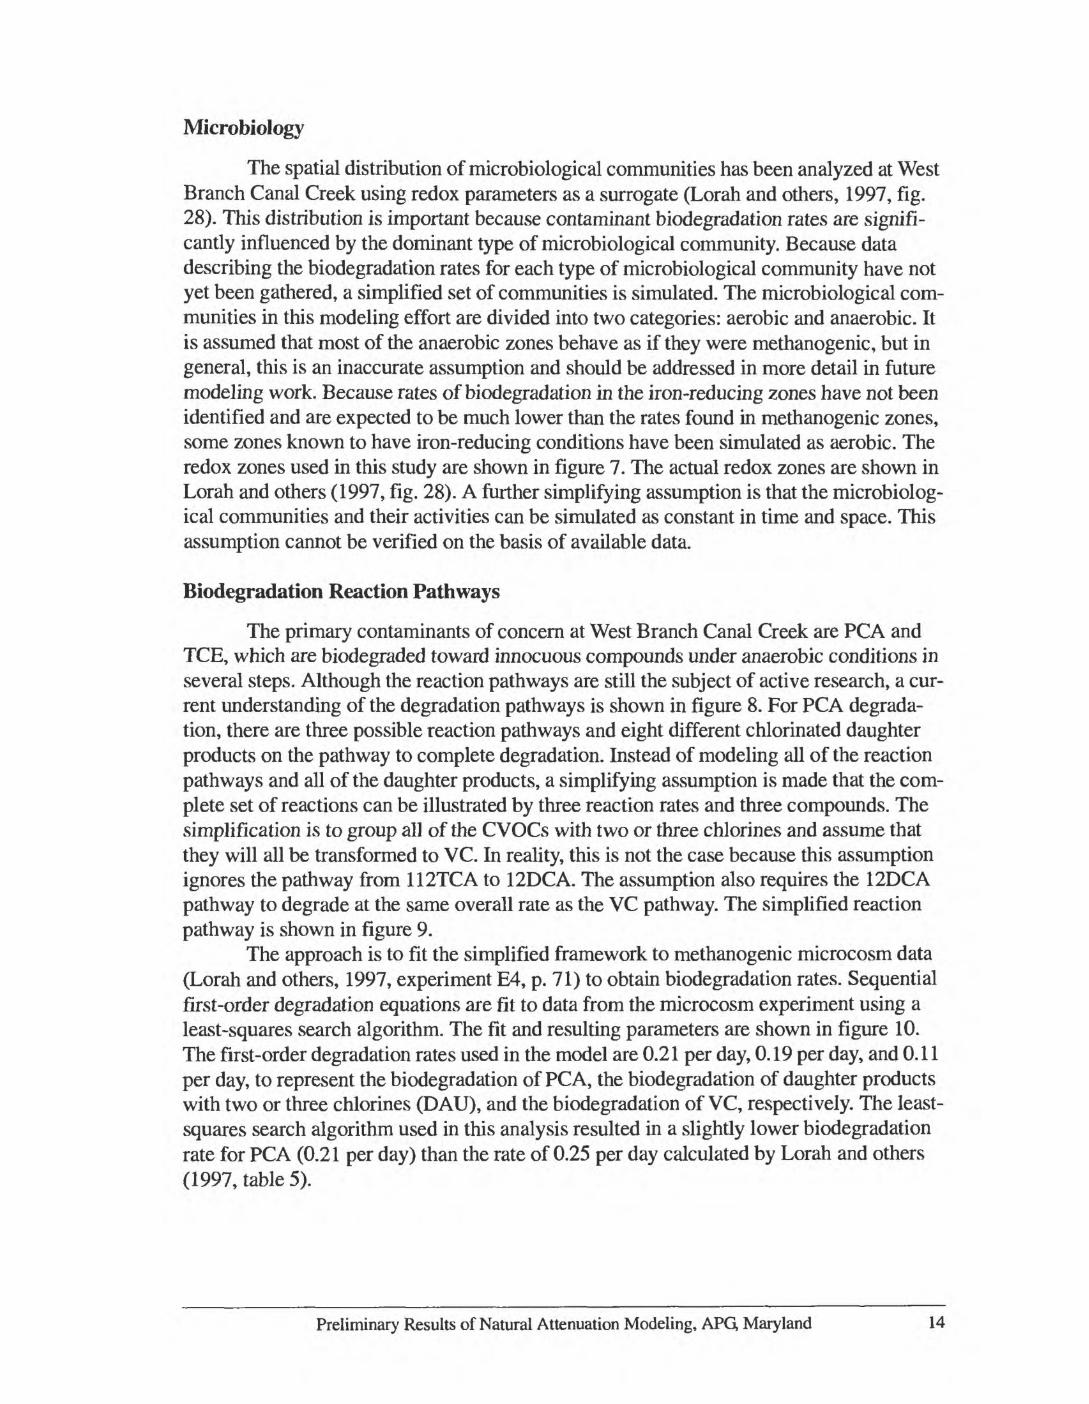
available time-series data for determining the behavior of the contaminants in the vicinity of the northern transect come from monitoring well CC27A.
Monitoring well CC27A had the highest measured concentrations of CVOCs at the study site (Lorah and others, 1997). Concentrations of CVOCs in that well have been mea sured several times since its installation in the mid-1980's. Well CC27A (fig. 3), though not along the transect, is located approximately 100 ft from the northern transect and has a 5-ft screened interval. Concentrations of PCA in this well have been as high as 5,800 micrograms per liter (|ig/L) and as low as 2,300 (ig/L. Although the measured concentra tions of PCA have been variable for the past decade, the data show no distinct trend over time (fig. 6). The average of six separate measurements is approximately 4,000 (ig/L PCA (Lorah and Vroblesky, 1989, table 10; Lorah and Clark, 1996, appendix B; Olsen and oth ers, 1997, table 8A; and Jacobs Engineering Group Inc., 1995, volatile organics table).
The concentration of PCA in well CC27A is assumed to be representative of the concentration trend for the plume of contaminated ground water along West Branch Canal Creek. For these preliminary simulations, the lack of a definitive trend in the concentra tion data over approximately 10 years is used as justification for the use of steady-state solute-transport simulations to represent the site.
Because well CC27A is not a part of the northern transect, measured concentra tions at that well were used only as a guide in selecting a concentration boundary condi tion for the simulations. A constant-concentration boundary condition of 5,000 (ig/L PCA was selected for the calibrated simulation. The source is modeled as a constant-concentra tion source along 6.5 ft of the right-hand boundary of the modeling domain. The concen tration and the length of the concentration boundary condition were adjusted during calibration to arrive at these values. Source size and concentration were not included in the sensitivity analysis, so the model sensitivity to these parameters has not been identified.
Sorption in the wetland sediments affects transient transport simulations through the retardation coefficient. In steady-state simulations, sorption is not an important factor. Sorption in the wetland sediments slows down the solutes, thereby increasing their resi dence time. Measured sorption coefficients for PCA, isomers of DCE, and VC in wetland sediments are not used in this model. BIOMOC does not allow for distributed sorption coefficients. The simplifying assumption made for these simulations is that the entire sim ulation domain has a retardation coefficient of 1. This results in faster transport for the CVOCs in the wetland sediments in the simulations than in reality. The wetland sediments are also the site of the most effective biodegradation occurring at West Branch Canal Creek. If transient simulations were necessary, this would be an important simplifying assumption. Sorption, however, is not an important factor in steady-state solute-transport simulations not involving radioactive decay; in these cases, the retardation coefficient is eliminated from the transport equation (Essaid and Bekins, 1997, equation 3).
Preliminary Results of Natural Attenuation Modeling, APQ Maryland 12
*
*
*
4
«CDO5 iC
r co -p
o
O5 ic
- cd -p
0
CM O5c 0cd LU
A Q_
C73LU
0 J- 0. <£= 0
- cdi
o
00 00
1c
- cd
o
CDop c
L rrf
u u
S03
f »"5 8 « uO "ca a c
§1§ 1O PQ
vov
6JC
CD
O O O
O O O
O O O CO
o o oCM
o o o
d3d SIAIVdiDOdOIIAI Nl 'NOIlVdlN30NOO VOd
Preliminary Results of Natural Attenuation Modeling, APG, Maryland 13
Microbiology
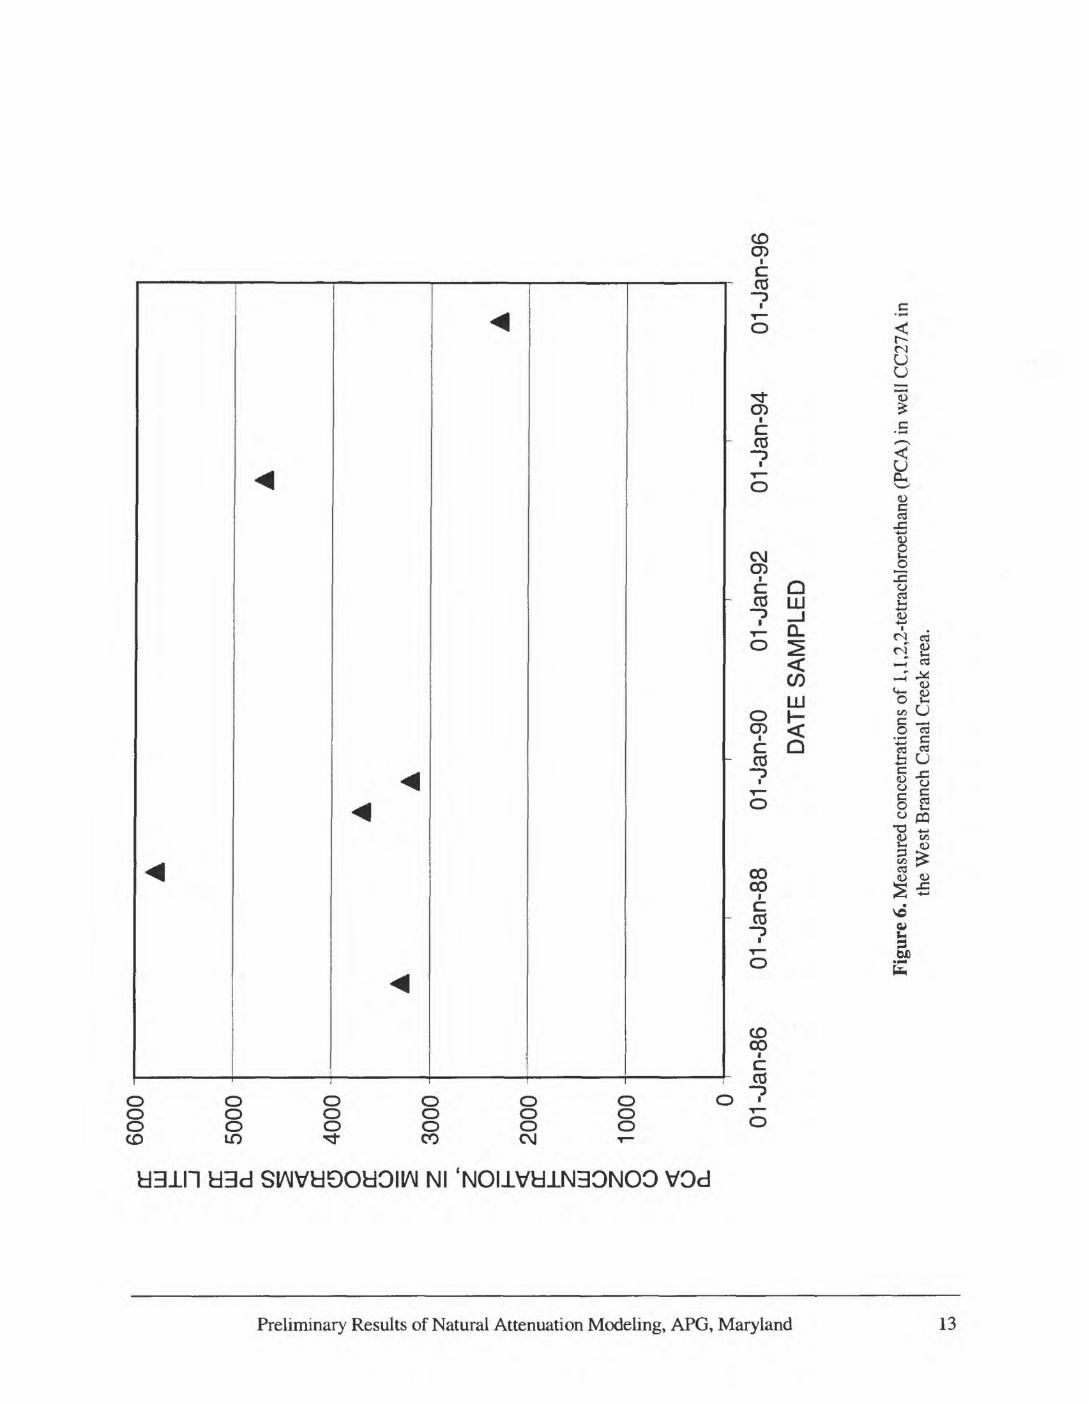
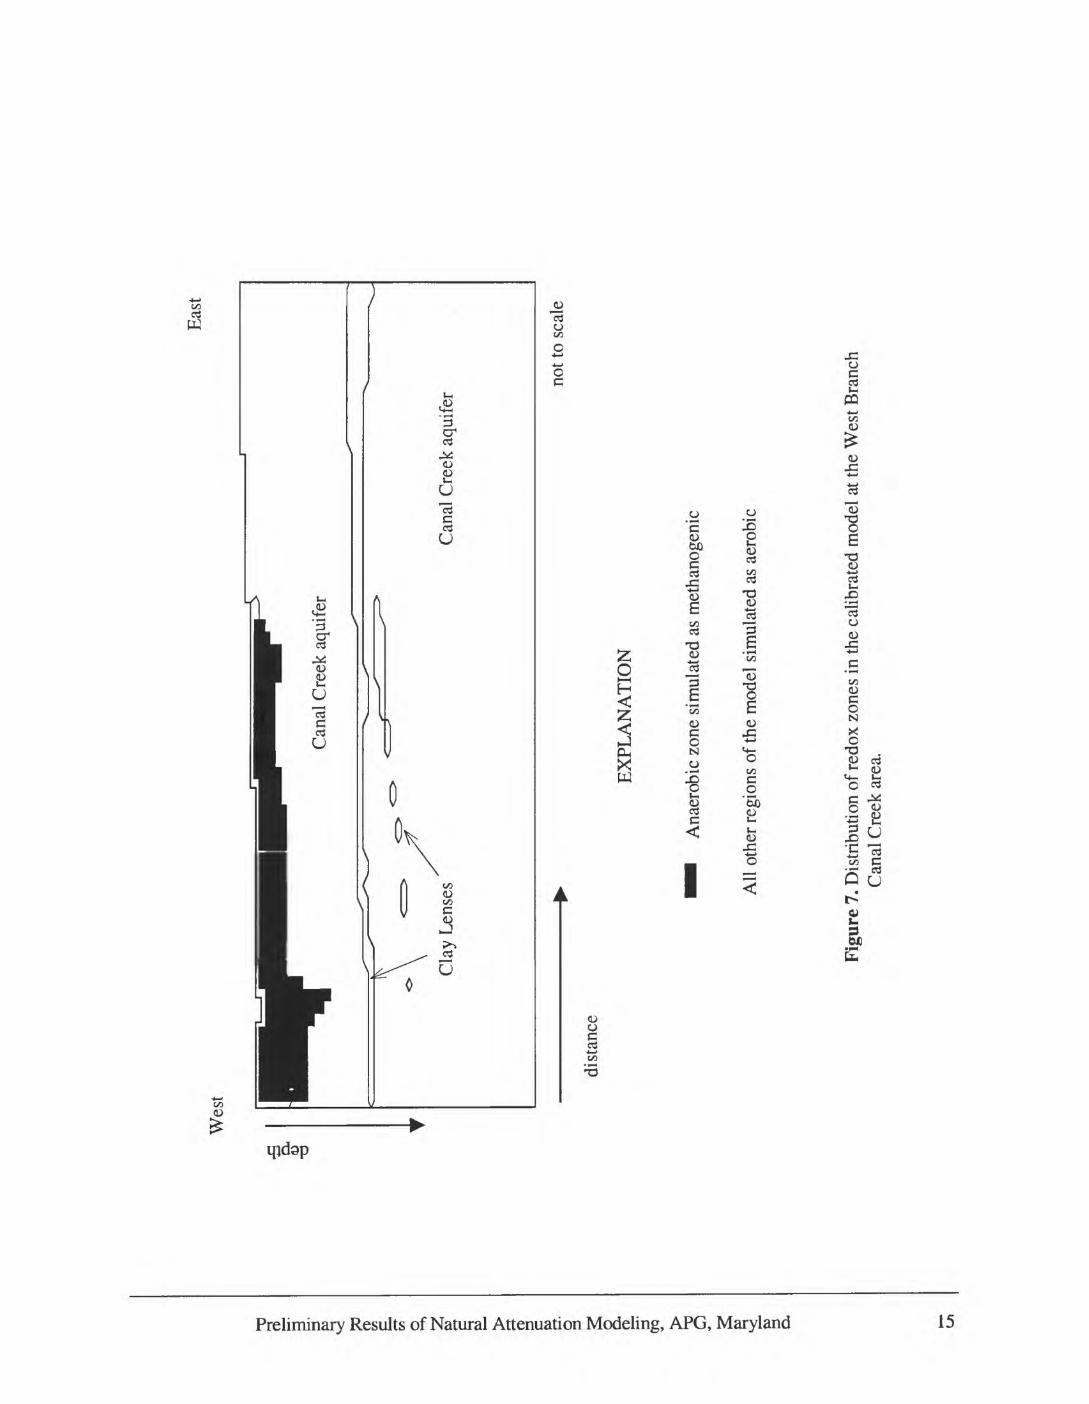
The spatial distribution of microbiological communities has been analyzed at West Branch Canal Creek using redox parameters as a surrogate (Lorah and others, 1997, fig. 28). This distribution is important because contaminant biodegradation rates are signifi cantly influenced by the dominant type of microbiological community. Because data describing the biodegradation rates for each type of microbiological community have not yet been gathered, a simplified set of communities is simulated. The microbiological com munities in this modeling effort are divided into two categories: aerobic and anaerobic. It is assumed that most of the anaerobic zones behave as if they were methanogenic, but in general, this is an inaccurate assumption and should be addressed in more detail in future modeling work. Because rates of biodegradation in the iron-reducing zones have not been identified and are expected to be much lower than the rates found in methanogenic zones, some zones known to have iron-reducing conditions have been simulated as aerobic. The redox zones used in this study are shown in figure 7. The actual redox zones are shown in Lorah and others (1997, fig. 28). A further simplifying assumption is that the microbiolog ical communities and their activities can be simulated as constant in time and space. This assumption cannot be verified on the basis of available data.
Biodegradation Reaction Pathways
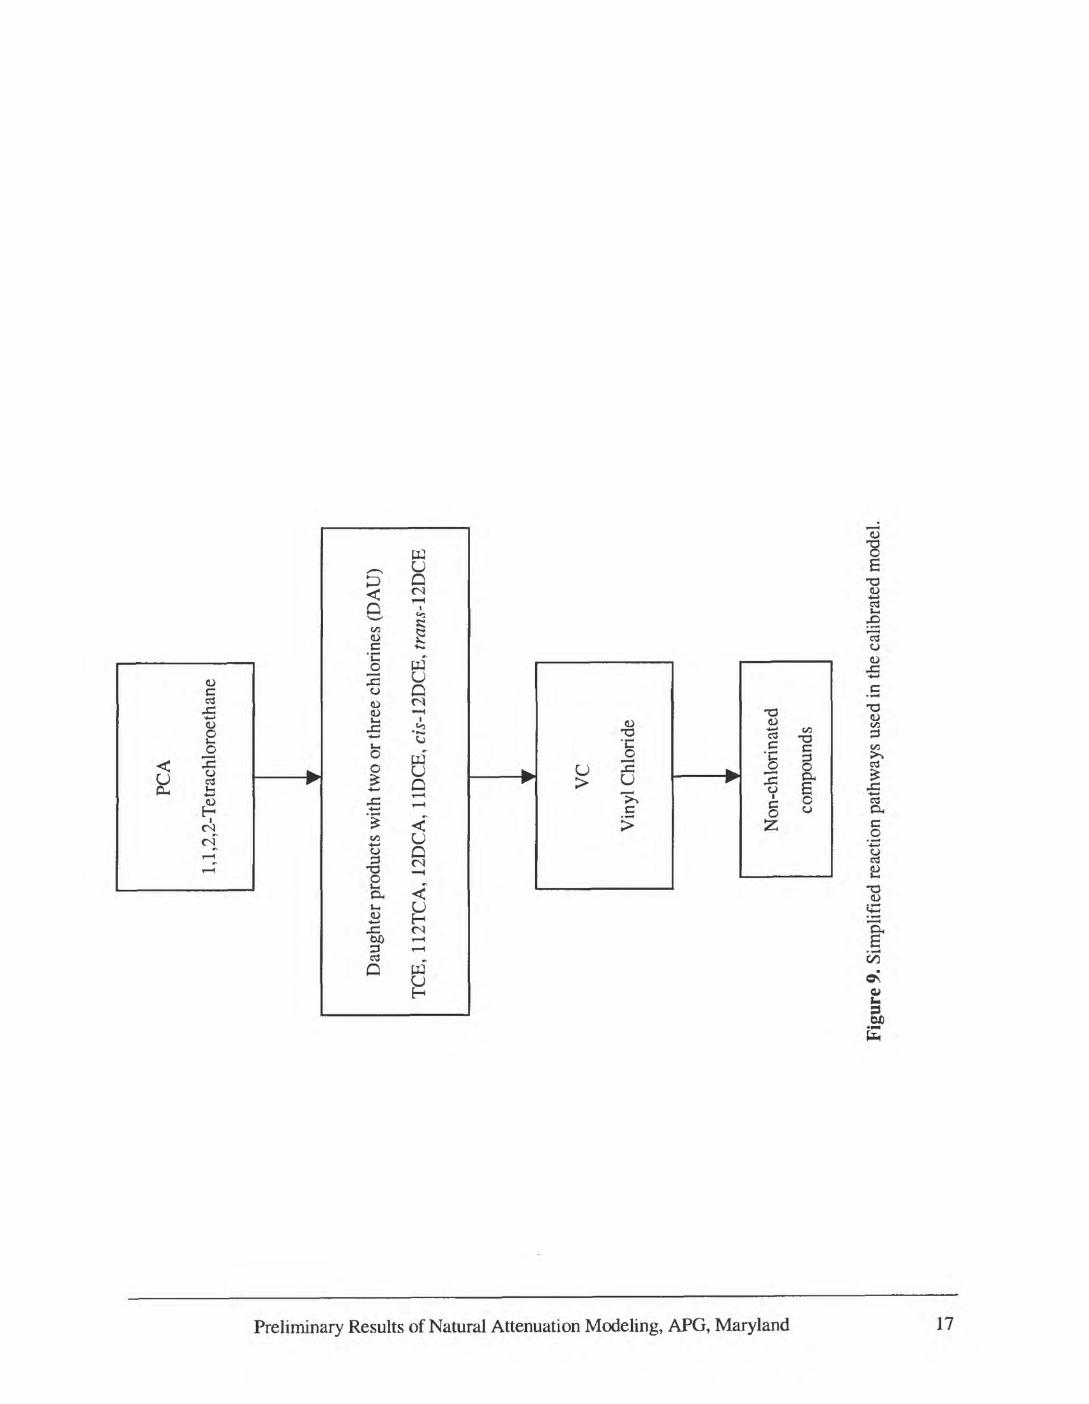
The primary contaminants of concern at West Branch Canal Creek are PCA and TCE, which are biodegraded toward innocuous compounds under anaerobic conditions in several steps. Although the reaction pathways are still the subject of active research, a cur rent understanding of the degradation pathways is shown in figure 8. For PCA degrada tion, there are three possible reaction pathways and eight different chlorinated daughter products on the pathway to complete degradation. Instead of modeling all of the reaction pathways and all of the daughter products, a simplifying assumption is made that the com plete set of reactions can be illustrated by three reaction rates and three compounds. The simplification is to group all of the CVOCs with two or three chlorines and assume that they will all be transformed to VC. In reality, this is not the case because this assumption ignores the pathway from 112TCA to 12DCA. The assumption also requires the 12DCA pathway to degrade at the same overall rate as the VC pathway. The simplified reaction pathway is shown in figure 9.
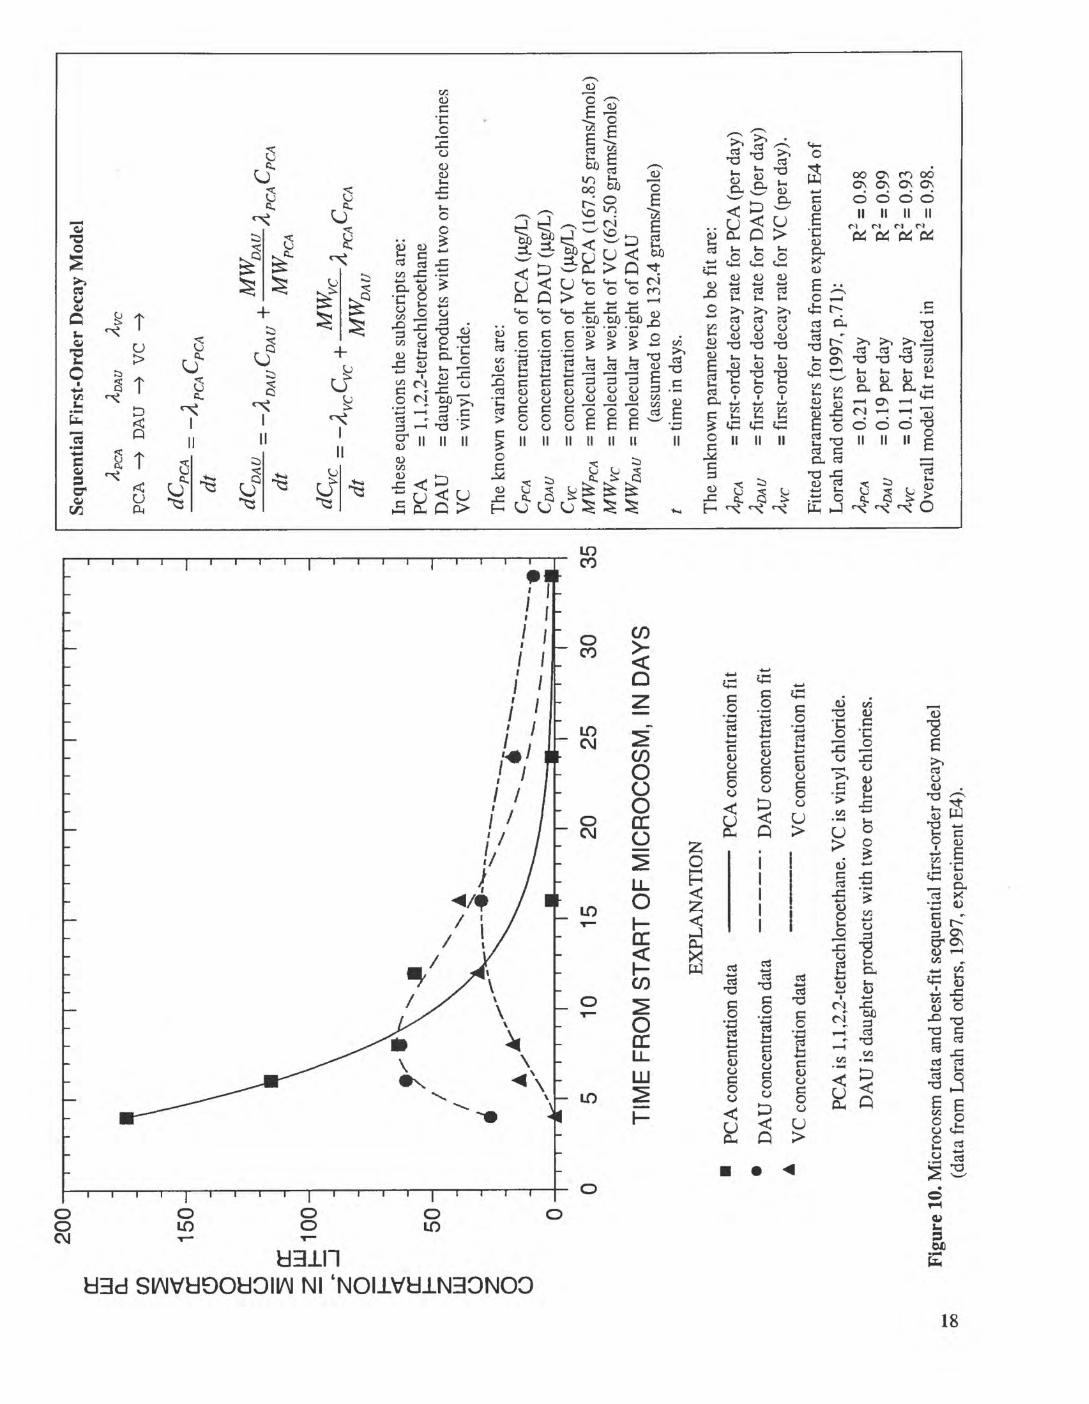
The approach is to fit the simplified framework to methanogenic microcosm data (Lorah and others, 1997, experiment E4, p. 71) to obtain biodegradation rates. Sequential first-order degradation equations are fit to data from the microcosm experiment using a least-squares search algorithm. The fit and resulting parameters are shown in figure 10. The first-order degradation rates used in the model are 0.21 per day, 0.19 per day, and 0.11 per day, to represent the biodegradation of PCA, the biodegradation of daughter products with two or three chlorines (DAU), and the biodegradation of VC, respectively. The least- squares search algorithm used in this analysis resulted in a slightly lower biodegradation rate for PCA (0.21 per day) than the rate of 0.25 per day calculated by Lorah and others (1997, table 5).
Preliminary Results of Natural Attenuation Modeling, APG, Maryland 14
Eas
tW
est
to
t 4> T3
Can
al C
reek
aqu
ifer
Cla
y Le
nses
Can
al C
reek
aqu
ifer
n I I "
dist
ance
not t
o sc
ale
EX
PLA
NA
TIO
N
Ana
erob
ic z
one
sim
ulat
ed a
s m
etha
noge
nic
o.
All
othe
r reg
ions
of t
he m
odel
sim
ulat
ed a
s ae
robi
c
Figu
re 7
. Dis
tribu
tion
of re
dox
zone
s in
the
calib
rate
d m
odel
at t
he W
est B
ranc
h C
anal
Cre
ek a
rea.
VI ! I I § (TO
...4,
1,2,
2-te
trac
hlor
oeth
ane
...-
"""
(PC
A)
b.iS
»5-"
" H
H_,-
"""'
I I
tric
hlo
roeth
ylene-*
'""
_/*
\
1(T
CE)
H
Cl
Cl
Cl
1,1-
^
cls-
1,2-
dlch
loro
ethy
lene
di
chlo
roet
hyle
neH
Cl
H H
W / \
/
\H
C
l C
l C
l(1
1DC
E)
(CIS
-12D
CE
)
^
\
«
viny
l chl
orid
e(V
C)
H H
X\
/c=
c/
\H
Cl
n vet
hyle
neH
H\
/C
-C/
\H
H ,
^r
ci
c|
s<
Jl
x^
1,1,
2-tri
chlo
roet
hane
^X
(1
12TC
A)\,
jS
H
H
tra
n^l
,2-
">
s H
-C-C
-CI
dich
loro
ethy
lene
j^
\
\H
Cl
^
Cl
Cl
Nc=c
x S
n
/
\
jS
0Cl
H
-r
1,2-
dich
loro
etha
ne(t
ran
s-^
DC
EJx;^
(1
2DC
A)
» jX
^
H H
^ /
I I
V^
H C
C
H
jf
I I
X^
ci ci _ j I V
chlo
roet
hane
H H
I I
H C
C
H
I I
Cl
Hn JL
etha
neH
HI
IH C
C
H
I I
H H
g.
HYD
RO
GEN
OLY
SIS
EX
PLA
NA
TIO
N
| D
ICH
LOR
OEL
IMIN
ATI
ON
1 D
EHYD
RO
CH
LOR
INA
TIO
N
Figu
re 8
. Ana
erob
ic d
egra
datio
n pa
thw
ays
for
tric
hlor
oeth
ylen
e (T
CE)
and
1,1
,2,2
-tet
rach
loro
etha
ne (
PCA
) (m
odif
ied
from
Lor
ah a
nd o
ther
s, 1
997,
fig
. 5).
8" on v!
O I I § I erc 3
PCA
1,1,
2,2-
Tet
rach
loro
e tha
ne
Dau
ghte
r pr
oduc
ts w
ith tw
o or
thre
e ch
lori
nes
(DA
U)
TC
E,
112T
CA
, 12
DC
A,
11D
CE,
cis
-l2D
CE
, tr
ans-
UD
CE
VC
Vin
yl C
hlor
ide
Non
-chl
orin
ated
com
poun
ds
Fig
ure
9. S
impl
ifie
d re
actio
n pa
thw
ays
used
in t
he c
alib
rate
d m
odel
.
200
0
A
TIM
E F
RO
M S
TA
RT
OF
MIC
RO
CO
SM
, IN
DA
YS
EX
PLA
NA
TIO
N
PCA
con
cent
ratio
n da
ta
PCA
con
cent
ratio
n fi
t
DA
U c
once
ntra
tion
data
"
DA
U c
once
ntra
tion
fit
VC
con
cent
ratio
n da
ta
y^ c
once
ntra
tion
fjt
PCA
is 1
,1,2
,2-t
etra
chlo
roet
hane
. V
C is
vin
yl c
hlor
ide.
D
AU
is d
augh
ter
prod
ucts
with
tw
o or
thre
e ch
lori
nes.
Fig
ure
10. M
icro
cosm
dat
a an
d be
st-f
it se
quen
tial
firs
t-or
der
deca
y m
odel
(d
ata
from
Lor
ah a
nd o
ther
s, 1
997,
exp
erim
ent E
4).
Sequ
enti
al F
irst
-Ord
er D
ecay
Mod
el
PCA
DA
UV
C
->
, atPC
A
dCD
AU
_
dt
dC
yC
_
dt
MW
, DA
U
MW
t
, -rM
Wr
PCA
3 c
^P
CA
^P
CA
DA
U
DAU
In t
hese
equ
atio
ns t
he s
ubsc
ript
s ar
e:PC
A
= 1,
1,2,
2-te
trac
hlor
oeth
ane
DA
U
= da
ught
er p
rodu
cts
with
tw
o or
thre
e ch
lori
nes
VC
=
viny
l chl
orid
e.
The
kno
wn
vari
able
s ar
e:CP
CA
= co
ncen
trat
ion
of P
CA
= co
ncen
trat
ion
of D
AU
= co
ncen
trat
ion
of V
C=
mol
ecul
ar w
eigh
t of
PC
A (
167.
85 g
ram
s/m
ole)
M
WVc
=
mol
ecul
ar w
eigh
t of
VC
(62
.50
gram
s/m
ole)
M
WDA
U =
mol
ecul
ar w
eigh
t of
DA
U(a
ssum
ed to
be
132.
4 gr
ams/
mol
e)
/ =
time
in d
ays.
The
unk
now
n pa
ram
eter
s to
be
fit a
re:
APCA
=
firs
t-or
der
deca
y ra
te f
or P
CA
(pe
r da
y)
ADAU
=
firs
t-or
der
deca
y ra
te f
or D
AU
(pe
r da
y)
/Ivc
= fi
rst-
orde
r de
cay
rate
for
VC
(pe
r da
y).
Fitte
d pa
ram
eter
s fo
r da
ta f
rom
exp
erim
ent E
4 of
L
orah
and
oth
ers
(199
7, p
.71)
: AP
CA
= 0.
21 p
er d
ay
R2 =
0.9
8 AD
AU
=0.
19 p
er d
ay
R2
= 0.
99
Avc
=0.
11 p
er d
ay
R2 =
0.9
3 O
vera
ll m
odel
fit
resu
lted
in
R2 =
0.9
8.
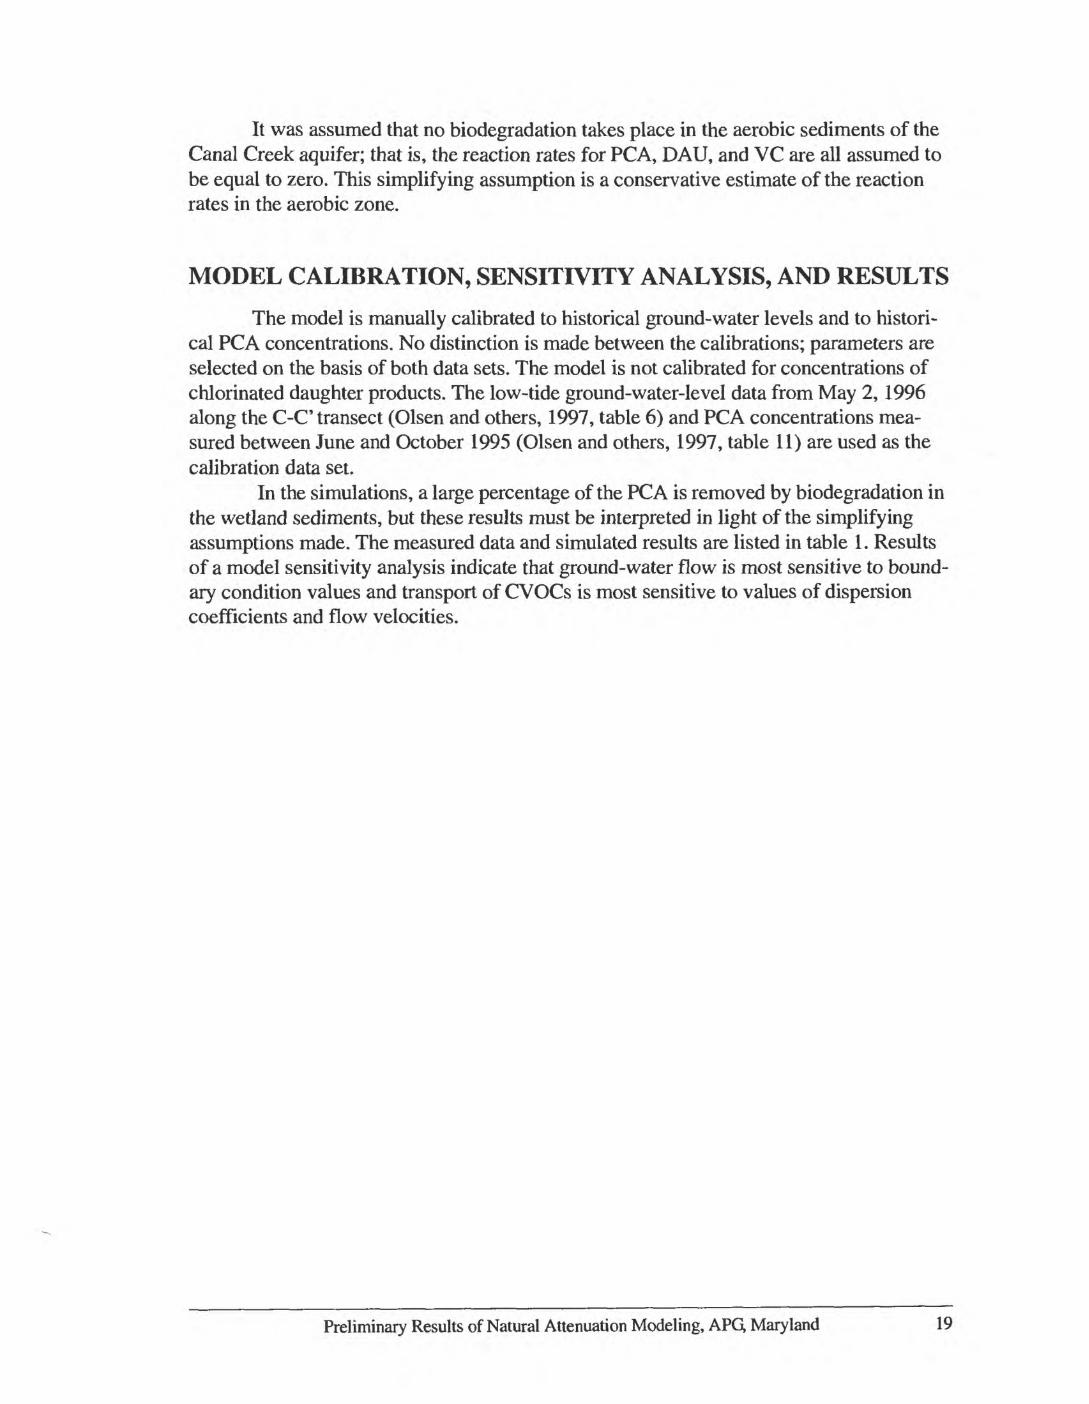
It was assumed that no biodegradation takes place in the aerobic sediments of the Canal Creek aquifer; that is, the reaction rates for PCA, DAU, and VC are all assumed to be equal to zero. This simplifying assumption is a conservative estimate of the reaction rates in the aerobic zone.
MODEL CALIBRATION, SENSITIVITY ANALYSIS, AND RESULTS
The model is manually calibrated to historical ground-water levels and to histori cal PCA concentrations. No distinction is made between the calibrations; parameters are selected on the basis of both data sets. The model is not calibrated for concentrations of chlorinated daughter products. The low-tide ground-water-level data from May 2,1996 along the C-C' transect (Olsen and others, 1997, table 6) and PCA concentrations mea sured between June and October 1995 (Olsen and others, 1997, table 11) are used as the calibration data set.
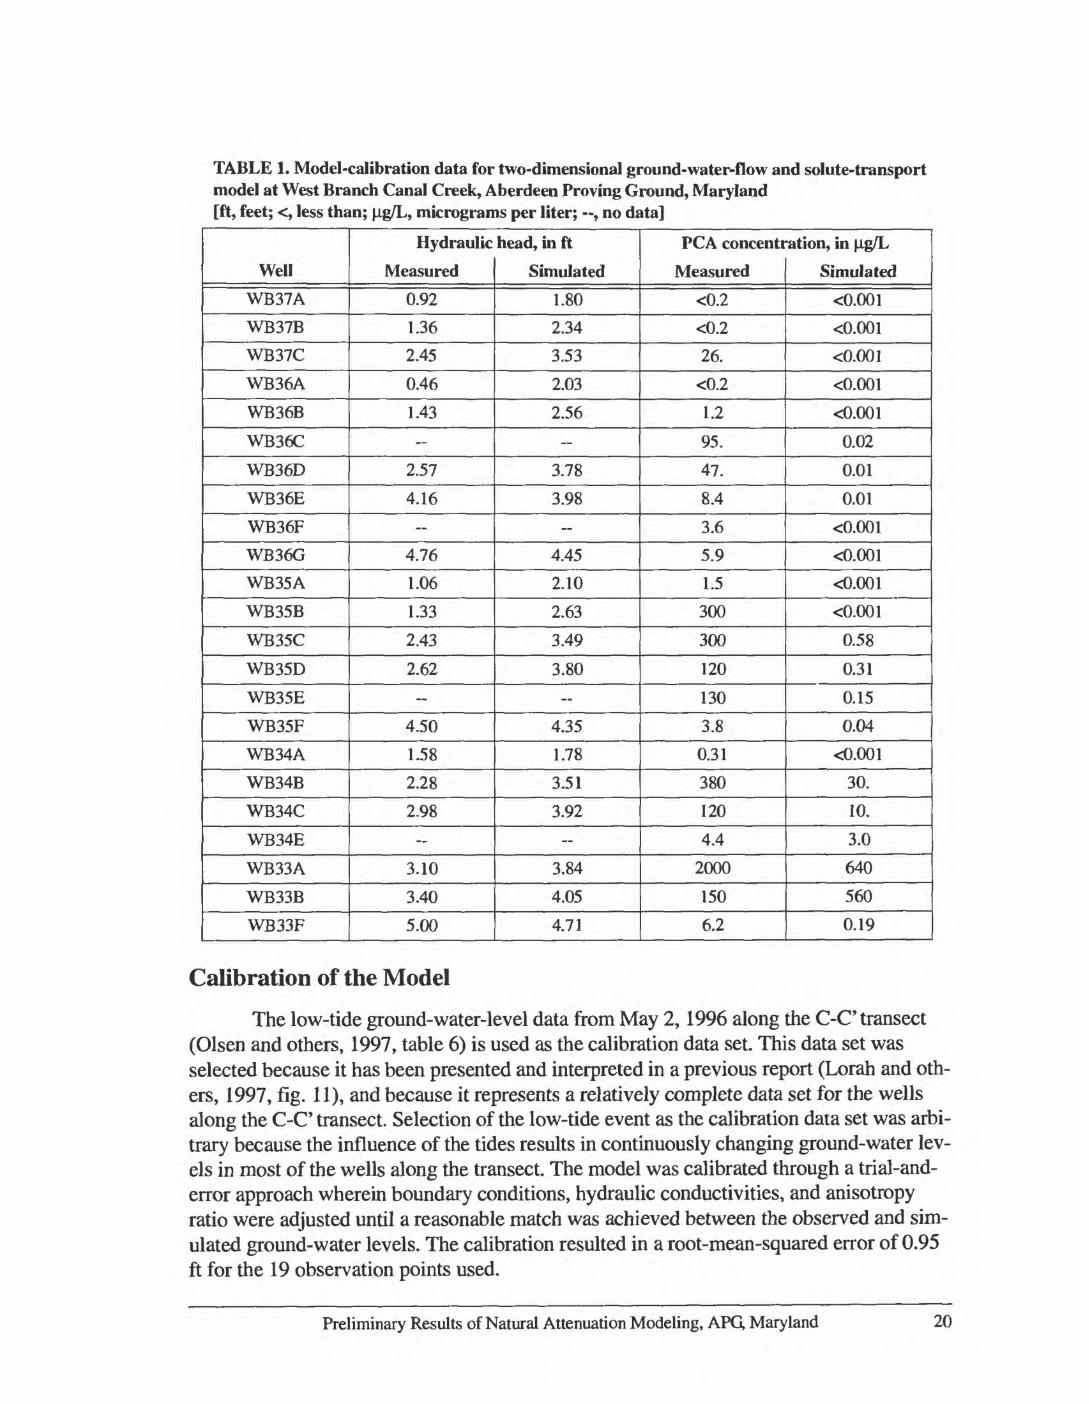
In the simulations, a large percentage of the PCA is removed by biodegradation in the wetland sediments, but these results must be interpreted in light of the simplifying assumptions made. The measured data and simulated results are listed in table 1. Results of a model sensitivity analysis indicate that ground-water flow is most sensitive to bound ary condition values and transport of CVOCs is most sensitive to values of dispersion coefficients and flow velocities.
Preliminary Results of Natural Attenuation Modeling, APG, Maryland 19
TABLE 1. Model-calibration data for two-dimensional ground-water-flow and solute-transport model at West Branch Canal Creek, Aberdeen Proving Ground, Maryland [ft, feet; <, less than; |ig/L, micrograms per liter; --, no data]
Well
WB37A
WB37B
WB37C
WB36A
WB36B
WB36C
WB36D
WB36E
WB36F
WB36G
WB35A
WB35B
WB35C
WB35D
WB35E
WB35F
WB34A
WB34B
WB34C
WB34E
WB33A
WB33B
WB33F
Hydraulic
Measured
0.92
1.36
2.45
0.46
1.43-
2.57
4.16-
4.76
1.06
1.33
2.43
2.62-
4.50
1.58
2.28
2.98-
3.10
3.40
5.00
head, in ft
Simulated
1.80
2.34
3.53
2.03
2.56-
3.78
3.98-
4.45
2.10
2.63
3.49
3.80-
4.35
1.78
3.51
3.92-
3.84
4.05
4.71
PCA concenti
Measured
<0.2
<0.2
26.
<0.2
1.2
95.
47.
8.4
3.6
5.9
1.5
300
300
120
130
3.8
0.31
380
120
4.4
2000
150
6.2
ation, in |ig/L
Simulated
<0.001
<0.001
<0.001
<0.001
<0.001
0.02
0.01
0.01
<0.001
<0.001
<0.001
<0.001
0.58
0.31
0.15
0.04
<0.001
30.
10.
3.0
640
560
0.19
Calibration of the Model
The low-tide ground-water-level data from May 2,1996 along the C-C' transect (Olsen and others, 1997, table 6) is used as the calibration data set. This data set was selected because it has been presented and interpreted in a previous report (Lorah and oth ers, 1997, fig. 11), and because it represents a relatively complete data set for the wells along the C-C' transect. Selection of the low-tide event as the calibration data set was arbi trary because the influence of the tides results in continuously changing ground-water lev els in most of the wells along the transect. The model was calibrated through a trial-and- error approach wherein boundary conditions, hydraulic conductivities, and anisotropy ratio were adjusted until a reasonable match was achieved between the observed and sim ulated ground-water levels. The calibration resulted in a root-mean-squared error of 0.95 ft for the 19 observation points used.
Preliminary Results of Natural Attenuation Modeling, APG, Maryland 20
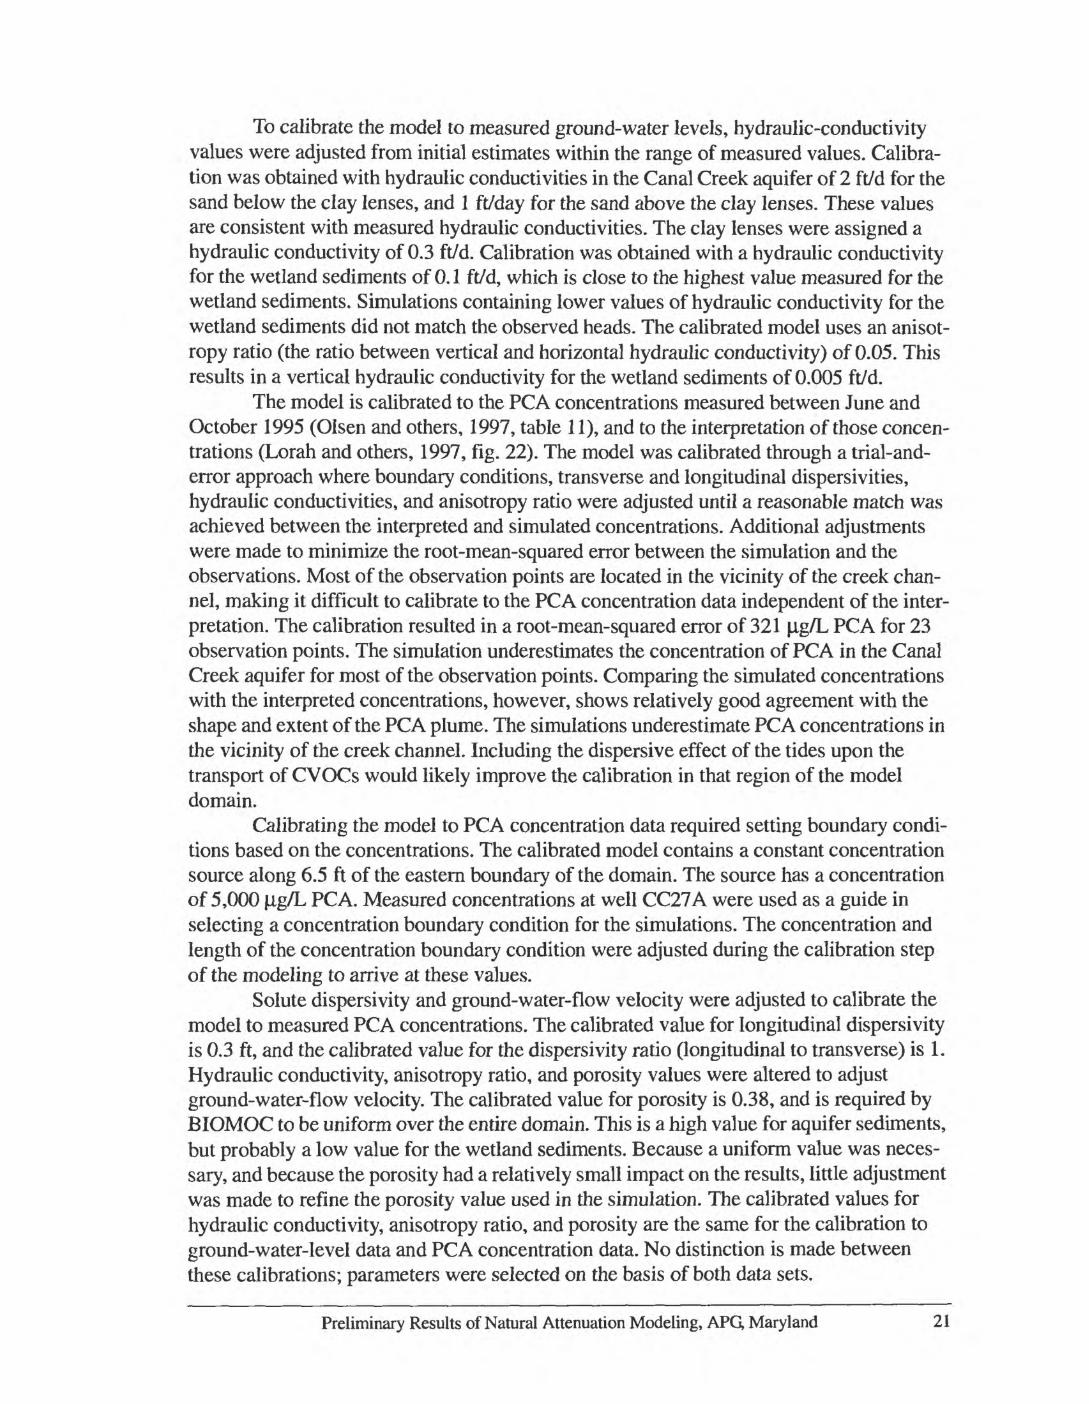
To calibrate the model to measured ground-water levels, hydraulic-conductivity values were adjusted from initial estimates within the range of measured values. Calibra tion was obtained with hydraulic conductivities in the Canal Creek aquifer of 2 ft/d for the sand below the clay lenses, and 1 ft/day for the sand above the clay lenses. These values are consistent with measured hydraulic conductivities. The clay lenses were assigned a hydraulic conductivity of 0.3 ft/d. Calibration was obtained with a hydraulic conductivity for the wetland sediments of 0.1 ft/d, which is close to the highest value measured for the wetland sediments. Simulations containing lower values of hydraulic conductivity for the wetland sediments did not match the observed heads. The calibrated model uses an anisot- ropy ratio (the ratio between vertical and horizontal hydraulic conductivity) of 0.05. This results in a vertical hydraulic conductivity for the wetland sediments of 0.005 ft/d.
The model is calibrated to the PCA concentrations measured between June and October 1995 (Olsen and others, 1997, table 11), and to the interpretation of those concen trations (Lorah and others, 1997, fig. 22). The model was calibrated through a trial-and- error approach where boundary conditions, transverse and longitudinal dispersivities, hydraulic conductivities, and anisotropy ratio were adjusted until a reasonable match was achieved between the interpreted and simulated concentrations. Additional adjustments were made to minimize the root-mean-squared error between the simulation and the observations. Most of the observation points are located in the vicinity of the creek chan nel, making it difficult to calibrate to the PCA concentration data independent of the inter pretation. The calibration resulted in a root-mean-squared error of 321 |J.g/L PCA for 23 observation points. The simulation underestimates the concentration of PCA in the Canal Creek aquifer for most of the observation points. Comparing the simulated concentrations with the interpreted concentrations, however, shows relatively good agreement with the shape and extent of the PCA plume. The simulations underestimate PCA concentrations in the vicinity of the creek channel. Including the dispersive effect of the tides upon the transport of CVOCs would likely improve the calibration in that region of the model domain.
Calibrating the model to PCA concentration data required setting boundary condi tions based on the concentrations. The calibrated model contains a constant concentration source along 6.5 ft of the eastern boundary of the domain. The source has a concentration of 5,000 |ig/L PCA. Measured concentrations at well CC27A were used as a guide in selecting a concentration boundary condition for the simulations. The concentration and length of the concentration boundary condition were adjusted during the calibration step of the modeling to arrive at these values.
Solute dispersivity and ground-water-flow velocity were adjusted to calibrate the model to measured PCA concentrations. The calibrated value for longitudinal dispersivity is 0.3 ft, and the calibrated value for the dispersivity ratio (longitudinal to transverse) is 1. Hydraulic conductivity, anisotropy ratio, and porosity values were altered to adjust ground-water-flow velocity. The calibrated value for porosity is 0.38, and is required by BIOMOC to be uniform over the entire domain. This is a high value for aquifer sediments, but probably a low value for the wetland sediments. Because a uniform value was neces sary, and because the porosity had a relatively small impact on the results, little adjustment was made to refine the porosity value used in the simulation. The calibrated values for hydraulic conductivity, anisotropy ratio, and porosity are the same for the calibration to ground-water-level data and PCA concentration data. No distinction is made between these calibrations; parameters were selected on the basis of both data sets.
Preliminary Results of Natural Attenuation Modeling, APG, Maryland 21
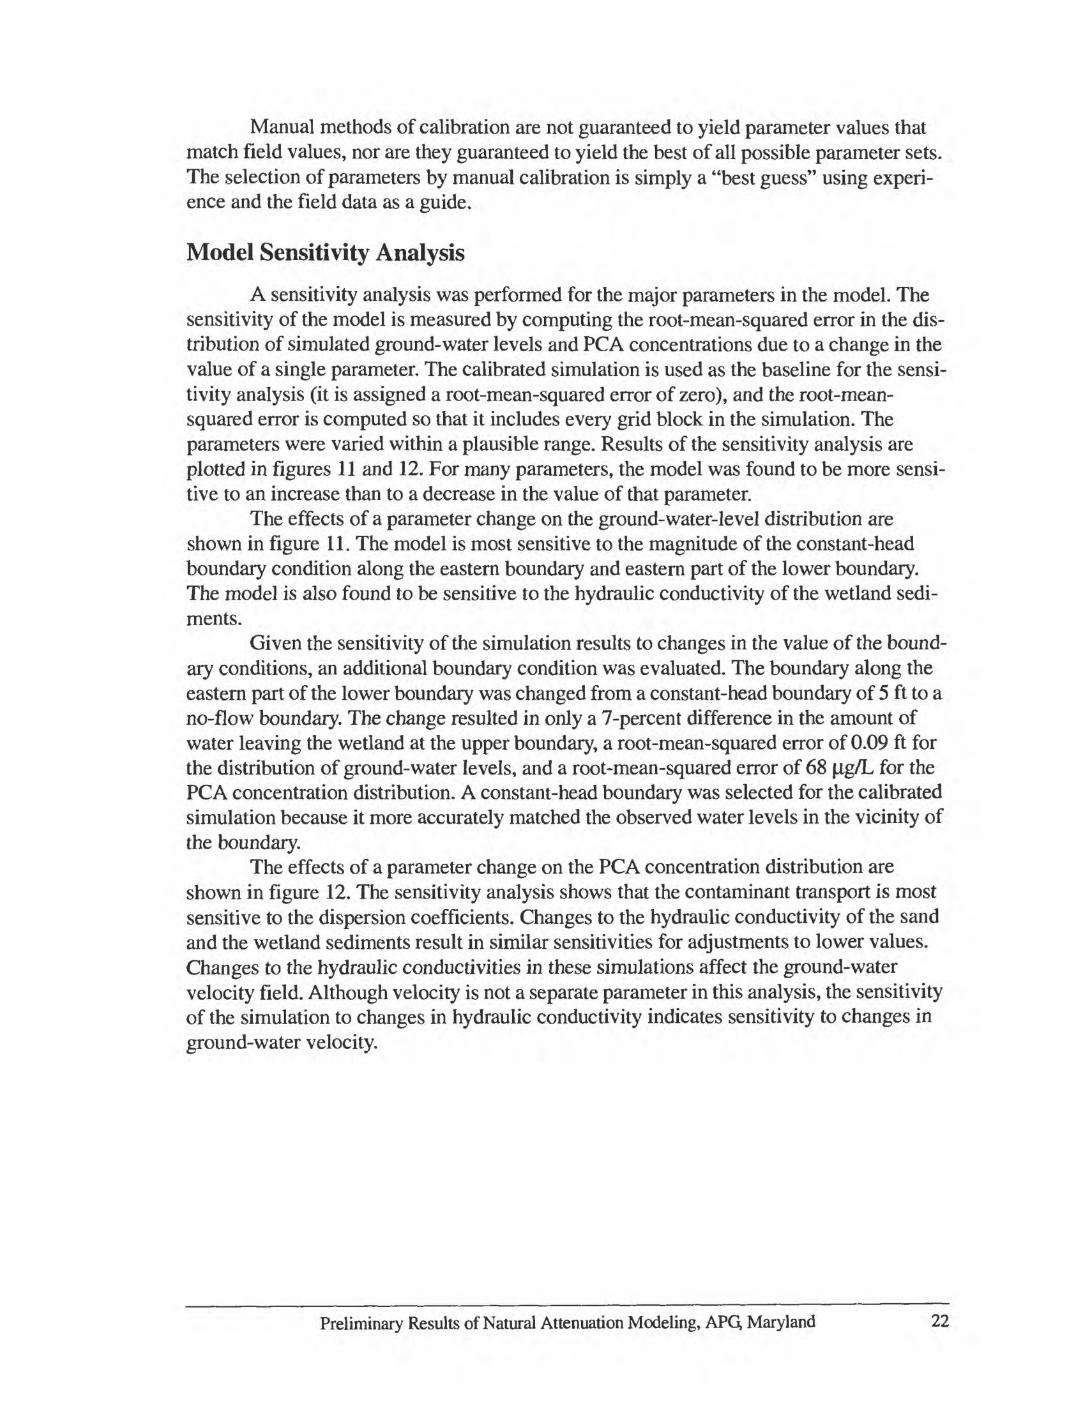
Manual methods of calibration are not guaranteed to yield parameter values that match field values, nor are they guaranteed to yield the best of all possible parameter sets. The selection of parameters by manual calibration is simply a "best guess" using experi ence and the field data as a guide.
Model Sensitivity Analysis
A sensitivity analysis was performed for the major parameters in the model. The sensitivity of the model is measured by computing the root-mean-squared error in the dis tribution of simulated ground-water levels and PCA concentrations due to a change in the value of a single parameter. The calibrated simulation is used as the baseline for the sensi tivity analysis (it is assigned a root-mean-squared error of zero), and the root-mean- squared error is computed so that it includes every grid block in the simulation. The parameters were varied within a plausible range. Results of the sensitivity analysis are plotted in figures 11 and 12. For many parameters, the model was found to be more sensi tive to an increase than to a decrease in the value of that parameter.
The effects of a parameter change on the ground-water-level distribution are shown in figure 11. The model is most sensitive to the magnitude of the constant-head boundary condition along the eastern boundary and eastern part of the lower boundary. The model is also found to be sensitive to the hydraulic conductivity of the wetland sedi ments.
Given the sensitivity of the simulation results to changes in the value of the bound ary conditions, an additional boundary condition was evaluated. The boundary along the eastern part of the lower boundary was changed from a constant-head boundary of 5 ft to a no-flow boundary. The change resulted in only a 7-percent difference in the amount of water leaving the wetland at the upper boundary, a root-mean-squared error of 0.09 ft for the distribution of ground-water levels, and a root-mean-squared error of 68 [ig/L for the PCA concentration distribution. A constant-head boundary was selected for the calibrated simulation because it more accurately matched the observed water levels in the vicinity of the boundary.
The effects of a parameter change on the PCA concentration distribution are shown in figure 12. The sensitivity analysis shows that the contaminant transport is most sensitive to the dispersion coefficients. Changes to the hydraulic conductivity of the sand and the wetland sediments result in similar sensitivities for adjustments to lower values. Changes to the hydraulic conductivities in these simulations affect the ground-water velocity field. Although velocity is not a separate parameter in this analysis, the sensitivity of the simulation to changes in hydraulic conductivity indicates sensitivity to changes in ground-water velocity.
Preliminary Results of Natural Attenuation Modeling, APG, Maryland 22
ROOT-MEAN-SQUARED ERROR BETWEENSIMULATED AND CALIBRATED
HYDRAULIC HEAD
t 3
60CO
p o en
p en
p fo
p Ko en
IHo o
CQ
a. a>
8
I(D Q]a. 21(D Q]iO.(D
CT O
a. Q]
Q]
if a- O Qj
8a.
I a.
o o
co o o
oA,iCTo
a. Q]
o oa. 5.; o"
.3 c_
5'
x; a.M
O O O
a.
2: Q]
a. co(Da.
(D
TJm
m
CD mO
CD m
Imm 73
|CO
m
-o 8 om
co o o
ROOT-MEAN-SQUARED ERROR BETWEENSIMULATED AND CALIBRATED
PCA CONCENTRATION
Ulo
Oo
_Ulo
Oo
N)
sO Os
o o
4k Ulyi oo o
3
§H-
00
3 w_<'
«3O
i I£L 5
1CO
CD CO
O
I 8
iy
1
CO3 O
I ***/O
ios Io
O cn
h X
o o
g g. Q)0) co 2.
tQ T3 CO3 CD O
Q. CD
O^
8
ICDtuQ.
CD 0> COCD
I
5- 3
I" ^
-3
^_ M O §
Q)
P 55"=aQ
Ig. co"
CD
cr <
§ f1 1 8 g
OT 5
3 5
<CD»CD
<_ <"
oTJ °m
m
Om o
H o x m
I 8
CD ^3- 1-0) 0)« E.
CD O
S. 8 CD 3
2. M"
Q.inCD Q. 3"
CD
03
m o o °S Oo m
COo o
I I!
I I
rr
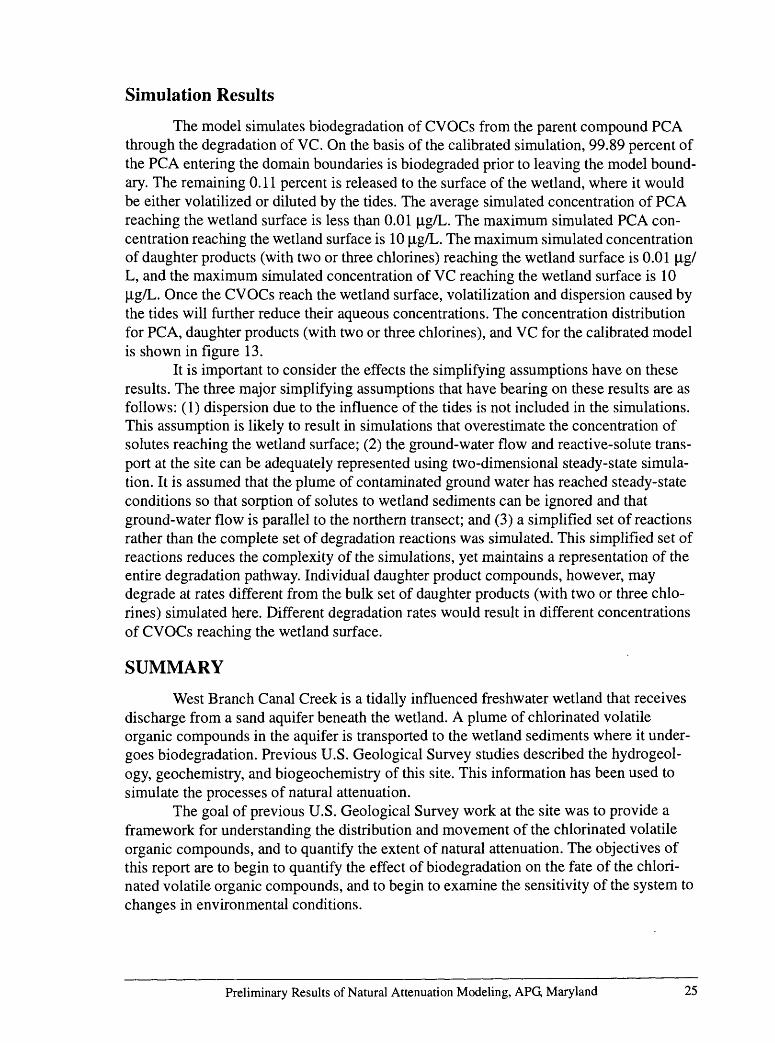
Simulation Results
The model simulates biodegradation of CVOCs from the parent compound PCA through the degradation of VC. On the basis of the calibrated simulation, 99.89 percent of the PCA entering the domain boundaries is biodegraded prior to leaving the model bound ary. The remaining 0.11 percent is released to the surface of the wetland, where it would be either volatilized or diluted by the tides. The average simulated concentration of PCA reaching the wetland surface is less than 0.01 |ig/L. The maximum simulated PCA con centration reaching the wetland surface is 10 |ig/L. The maximum simulated concentration of daughter products (with two or three chlorines) reaching the wetland surface is 0.01 |ig/ L, and the maximum simulated concentration of VC reaching the wetland surface is 10 [ig/L. Once the CVOCs reach the wetland surface, volatilization and dispersion caused by the tides will further reduce their aqueous concentrations. The concentration distribution for PCA, daughter products (with two or three chlorines), and VC for the calibrated model is shown in figure 13.
It is important to consider the effects the simplifying assumptions have on these results. The three major simplifying assumptions that have bearing on these results are as follows: (1) dispersion due to the influence of the tides is not included in the simulations. This assumption is likely to result in simulations that overestimate the concentration of solutes reaching the wetland surface; (2) the ground-water flow and reactive-solute trans port at the site can be adequately represented using two-dimensional steady-state simula tion. It is assumed that the plume of contaminated ground water has reached steady-state conditions so that sorption of solutes to wetland sediments can be ignored and that ground-water flow is parallel to the northern transect; and (3) a simplified set of reactions rather than the complete set of degradation reactions was simulated. This simplified set of reactions reduces the complexity of the simulations, yet maintains a representation of the entire degradation pathway. Individual daughter product compounds, however, may degrade at rates different from the bulk set of daughter products (with two or three chlo rines) simulated here. Different degradation rates would result in different concentrations of CVOCs reaching the wetland surface.
SUMMARY
West Branch Canal Creek is a tidally influenced freshwater wetland that receives discharge from a sand aquifer beneath the wetland. A plume of chlorinated volatile organic compounds in the aquifer is transported to the wetland sediments where it under goes biodegradation. Previous U.S. Geological Survey studies described the hydrogeol- ogy, geochemistry, and biogeochemistry of this site. This information has been used to simulate the processes of natural attenuation.
The goal of previous U.S. Geological Survey work at the site was to provide a framework for understanding the distribution and movement of the chlorinated volatile organic compounds, and to quantify the extent of natural attenuation. The objectives of this report are to begin to quantify the effect of biodegradation on the fate of the chlori nated volatile organic compounds, and to begin to examine the sensitivity of the system to changes in environmental conditions.
Preliminary Results of Natural Attenuation Modeling, APG, Maryland 25
PCA
DA
UV
C
"0 n VI e I.
o no I
-2.0
-1
.0
0.0
1.0
2.0
3.0
4.0
LO
G10
(CO
NC
EN
TR
AT
ION
, IN
MIC
RO
GR
AM
S PE
R L
ITE
R)
PCA
-
1,1,
2,2-
tetr
achl
oroe
than
e
DA
U -
dau
ghte
r pr
oduc
ts w
ith tw
o or
thre
e ch
lori
ne a
tom
s
VC
-
viny
l chl
orid
e
Figu
re 1
3.
Cal
cula
ted
stea
dy-s
tate
con
cent
ratio
ns o
f chl
orin
ated
vol
atile
org
anic
com
poun
ds f
or th
e ca
libra
ted
mod
el a
t Wes
t Bra
nch
Can
al C
reek
, A
berd
een
Prov
ing
Gro
und,
Mar
ylan
d.
Simulations were constructed based on the hydrologic, geochemical, and bio- geochemical framework developed in previous studies. The model domain was chosen to be representative of a two-dimensional cross section perpendicular to and extending about 200 feet southeasterly from the creek. This cross section intersects a contaminant plume of chlorinated volatile organic compounds including trichloroethylene; 1,1,2,2- tetrachloro ethane; 1,1,2- trichloroethane; chloroform; carbon tetrachloride; cis-1,2- dichloroethylene; trans-1,2- dichloroethylene; 1,2- dichloroethane; and vinyl chloride. The predominant contaminant of concern is 1,1,2,2- tetrachloroethane because it exists at higher concentra tions than the other chlorinated volatile organic compounds measured at the site. The geochemical framework developed in previous studies is greatly simplified for the pur poses of these simulations. All anaerobic zones found in the cross section are simulated as methanogenic. Biodegradation rates are obtained for a simplified set of chlorinated vola tile organic compounds based on experimental data from a previous investigation. The biodegradation rates are used in a two-dimensional flow, transport, and biodegradation model to simulate the transport and fate of the chlorinated volatile organic compounds. The model is calibrated to water-level data gathered in 1996 and 1,1,2,2- tetrachloroethane concentration data gathered in 1995.
On the basis of the calibrated simulation, 99.89 percent of the 1,1,2,2- tetrachloro ethane entering the domain boundaries is biodegraded prior to leaving the model bound ary. The remaining 0.11 percent is released to the surface of the wetland, where it would be either volatilized or diluted by the tides. The average simulated concentration of 1,1,2,2- tetrachloroethane reaching the wetland surface is less than 0.01 micrograms per liter. The maximum simulated 1,1,2,2- tetrachloroethane concentration reaching the wet land surface is 10 micrograms per liter. The maximum simulated concentration of daugh ter products (with two or three chlorines) reaching the wetland surface is 0.01 micrograms per liter, and the maximum simulated concentration of vinyl chloride reaching the wetland surface is 10 micrograms per liter. After the chlorinated volatile organic compounds reach the wetland surface, volatilization and dispersion caused by the tides will further reduce their aqueous concentrations.
Simulating the natural attenuation processes required the use of simplifying assumptions regarding the hydrology and transport properties of the materials at the site. The most important simplifying assumptions relevant to the results are as follows: (1) the diurnal and seasonal changes in ground-water levels due to the influence of the tides are not included; (2) the ground-water flow and reactive-solute transport are represented using a two-dimensional steady-state simulation; and (3) a simplified set of biodegradation reac tions are employed rather than the whole set of reactions and resultant daughter products. The model is sensitive to dispersivity and velocity, and would benefit from additional data on these parameters.
Preliminary Results of Natural Attenuation Modeling, APG, Maryland 27
REFERENCES CITED
Essaid, H.I., and Bekins, B.A., 1997, BIOMOC, A multispecies solute-transport model with biodegradation: U.S. Geological Survey Water-Resources Investigations Report 97-4022,68 p.
Konikow, L.F., and Bredehoeft, J.D., 1978, Computer model of two-dimensional solute transport and dispersion in ground water: U.S. Geological Survey Techniques of Water-Resources Investigations, book 7, chapter C2,90 p.
Lorah, M.M., and Vroblesky, D.A., 1989, Inorganic and organic ground-water chemistry in the Canal Creek area of Aberdeen Proving Ground, Maryland: U.S. Geological Survey Water-Resources Investigations Report 89-4022,97 p.
Lorah, M.M., and Clark, J.S., 1996, Contamination of ground water, surface water, and soil, and evaluation of selected ground-water pumping alternatives in the Canal Creek area of Aberdeen Proving Ground, Maryland: U.S. Geological Survey Open-File Report 95-282, 318 p.
Lorah, M.M., Olsen, L.D., Smith, B.L., Johnson, M.A., and Fleck, W.B., 1997, Natural attenuation of chlorinated volatile organic compounds in a freshwater tidal wet land, Aberdeen Proving Ground, Maryland: U.S. Geological Survey Water- Resources Investigations Report 97-4171, 95 p.
Oliveros, J.P., and Vroblesky, D.A., 1989, Hydrogeology of the Canal Creek area, Aber deen Proving Ground, Maryland: U.S. Geological Survey Water-Resources Inves tigations Report 89-4021, 50 p.
Olsen, L.D., Lorah, M.M., Marchand, E.H., Smith, B.L., and Johnson, M.A., 1997,Hydrogeologic, water-quality, and sediment-quality data for a freshwater tidal wet land, West Branch Canal Creek, Aberdeen Proving Ground, Maryland, 1992-1996: U.S. Geological Survey Open-File Report 97-560, 267 p.
Preliminary Results of Natural Attenuation Modeling, APG, Maryland 28