Using a Network of Flux Towers to Investigate the Effects of Wetland Restoration on Greenhouse Gas Fluxes nis Baldocchi, Jaclyn Hatala, Joe Verfaillie, Sara Knox, Frank Ander Department of Environmental Science, Policy and Management University of California, Berkeley AGU, 2012
Transcript
Using a Network of Flux Towers to Investigate the Effects of Wetland Restoration on Greenhouse Gas Fluxes
Dennis Baldocchi, Jaclyn Hatala, Joe Verfaillie, Sara Knox, Frank Anderson
Department of Environmental Science, Policy and ManagementUniversity of California, Berkeley
AGU, 2012
Delta Peatland is Subsiding!Landscape is Vulnerable to Flooding by Levee Failure;
Its Collapse would Shut-Down California’s Water Conveyance System
The Delta is a Vulnerable Ecosystem via Severe Land Subsidence
New Plans to Reverse Subsidence with Carbon Farming:Restored Tule Wetlands and Rice on
Twitchell and Sherman Islands
What are the: Cost/Benefits?; Unintended Consequences?
NEP (gC m-2 y-1)
-400 -200 0 200 400 600 800 1000 1200 1400
FC
H4
(gC
m-2
y-1
)
-40
-20
0
20
40
60
80
100
120
140
160
Coefficients:b[0]10.74b[1]0.068r ²0.7318
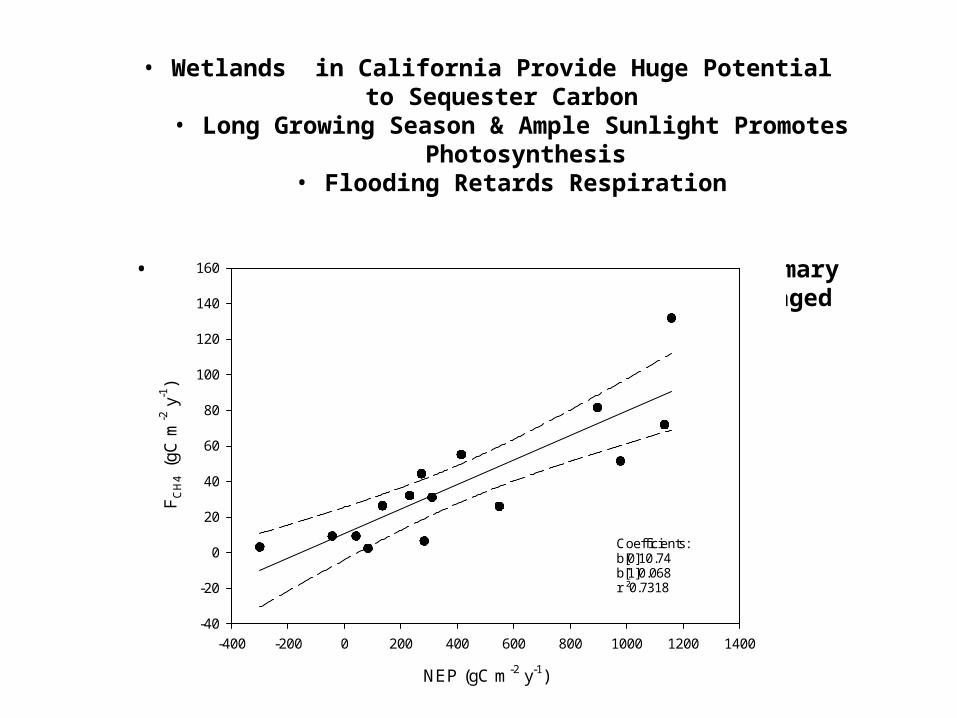
• Wetlands in California Provide Huge Potential to Sequester Carbon• Long Growing Season & Ample Sunlight Promotes Photosynthesis
• Flooding Retards Respiration
• At What Cost?• Annual Methane Emission Scales with Net Primary Productivity of
Wetlands, Natural and Managed
CH4
Anoxic Sediments
Water
Fluxes, Sources andSinks of Methane
Air-WaterExchange
Air, O2
Ebullition
AnaerobicMethanogenicArchaea
XylemTransport
Oxidation:MethanotropicBacteria
CO2
Anoxic Sediments
Water
Fluxes, Sources andSinks of Methane
Air-WaterExchange
Ebullition
AnaerobicMethanogenicArchaea
XylemTransport
Oxidation:MethanotropicBacteria
CO2
Over-Arching Research Questions
• How Does Management for Carbon Sequestration and Ecological Restoration affect Methane and Water Loss?– How Large are Carbon Dioxide and Methane Fluxes from
Drained & Managed Peatlands (Rice, Corn, Pasture) vs Restored Wetlands on daily, seasonal, annual time scales?
– How do Greenhouse Gas Fluxes Respond with Environmental Drivers (Light, Temperature, Oxygen, recent Photosynthesis, Water Table, Fraction of Water/Vegetation)?
Delta Field Sites
DDB Childhood HomeDDB Birth Place
Five Contrasting Study Sites
Drained Peatland Pasture, BAU
Seasonally-Flooded, Rice,Agricultural OptionNewly Restored, Wetland 15 Year Old,
Restored Wetland
Corn, BAU
Mean Diurnal Pattern of CO2 Exchange, Summer 2012
• Drainage & Disturbance by Restoration
• Promote Dark Respiration
• Flooding of Rice and the Older
• Wetland Suppresses Respiration
• Photosynthesis of C4 Corn out paces C3 Photosynthesis of Rice and Wetlands
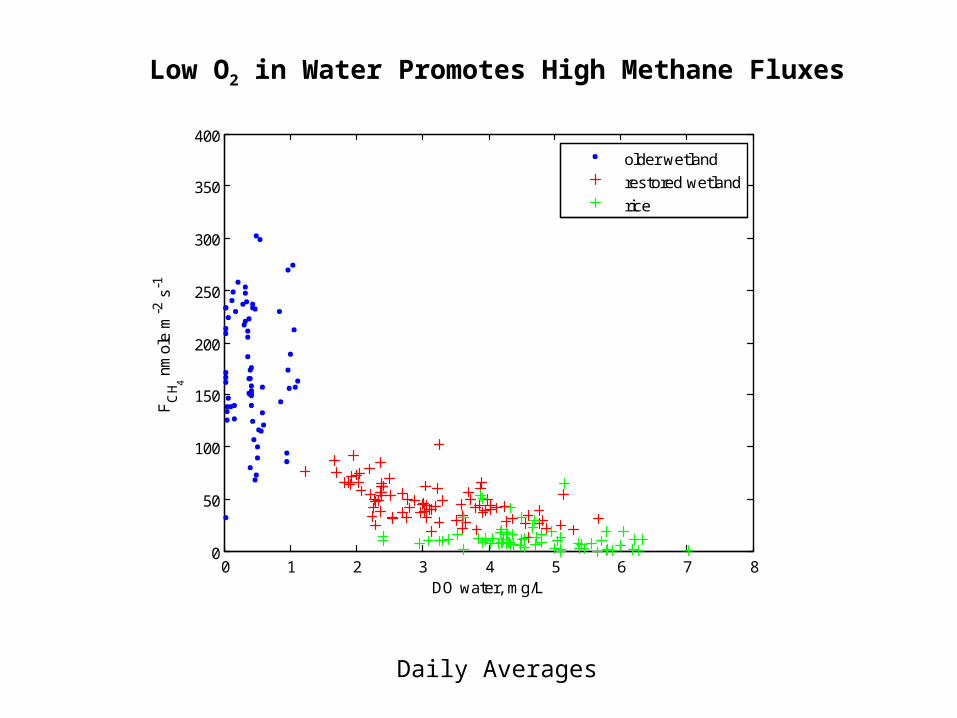
Rice, on peat, is a Smaller Methane Source than, Non-Tidal, Freshwater, Restored Wetlands
Low O2 in Water Promotes High Methane Fluxes
Daily Averages
0 1 2 3 4 5 6 7 80
50
100
150
200
250
300
350
400
FC
H 4 nm
ole
m-2
s-1
DO water, mg/L
older wetland
restored wetland
rice
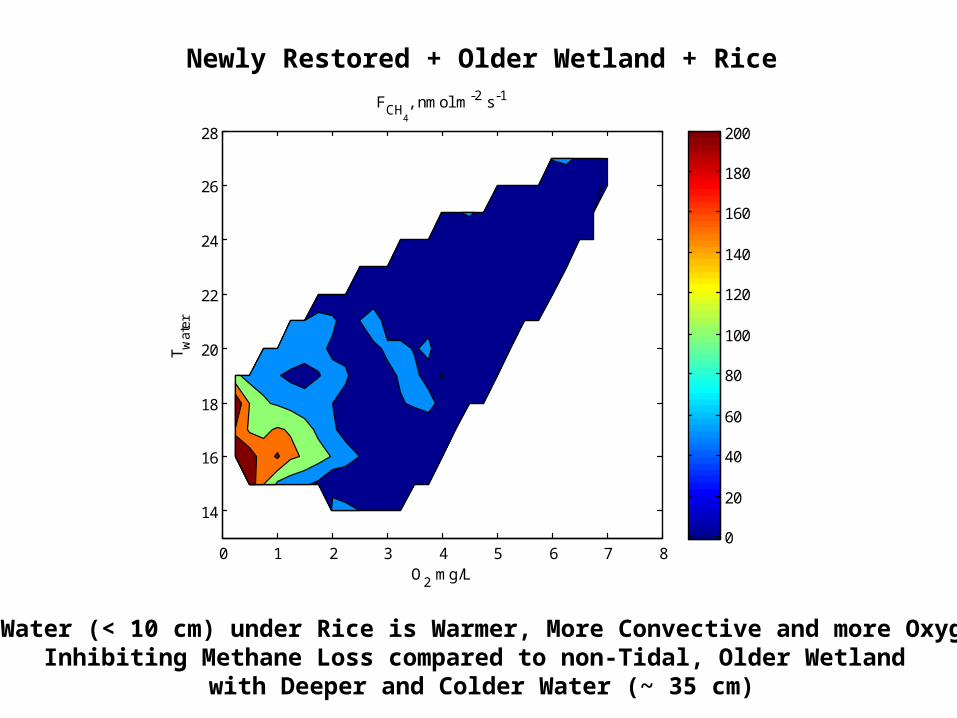
Newly Restored + Older Wetland + Rice
Shallow Water (< 10 cm) under Rice is Warmer, More Convective and more Oxygenated, Inhibiting Methane Loss compared to non-Tidal, Older Wetland
with Deeper and Colder Water (~ 35 cm)
O2 mg/L
T wat
er
FCH
4
, nmol m-2 s-1
0 1 2 3 4 5 6 7 8
14
16
18
20
22
24
26
28
0
20
40
60
80
100
120
140
160
180
200
Conclusions
• Restored Wetlands can be Effective Carbon Sinks– Only, Several Years after Establishment– But, they can produce Huge Amounts of Methane
• Rice and Corn have Large Photosynthetic Potential, and Flooding Inhibits Soil Respiration, compared to Corn– But, Their Effective Growing Season is Short– Carbon is Exported as Seed, Switching a C Sink to a Source– On Annual Basis, Agroecosystems are Carbon Sources that