49
Using ambulance data to inform violence prevention A guide for police, public health and violence prevention partnerships Alex Sutherland, Lucy Strang, Martin Stepanek, Chris Giacomantonio
Using ambulance data to inform violence preventionA guide for police, public health and violence prevention partnerships
Alex Sutherland, Lucy Strang, Martin Stepanek, Chris Giacomantonio
RAND Europe is a not-for-profit organisation whose mission is to help improve policy and decisionmaking through research and analysis. RAND’s publications do not necessarily reflect the opinions of its research clients and sponsors.
Limited Print and Electronic Distribution Rights
This document and trademark(s) contained herein are protected by law. This representation of RAND intellectual property is provided for noncommercial use only. Unauthorized posting of this publication online is prohibited. Permission is given to duplicate this document for personal use only, as long as it is unaltered and complete. Permission is required from RAND to reproduce, or reuse in another form, any of its research documents for commercial use. For information on reprint and linking permissions, please visit www.rand.org/pubs/permissions.
Support RANDMake a tax-deductible charitable contribution at
www.rand.org/giving/contribute
www.rand.org
www.rand.org/randeurope
For more information on this publication, visit www.rand.org/t/RR2253
Published by the RAND Corporation, Santa Monica, Calif., and Cambridge, UK
© Copyright 2017 RAND Corporation and LSE
R® is a registered trademark.
iii
Preface
Violence is preventable. Understanding where and when violence occurs is as important step in prevention. Police have traditionally focused on using their own intelligence for this purpose, but this is changing. Emergency department data on violent assaults have been used by some police forces for years to help understand more about where and when violence occurs, as well as who is victimised, aiding in efforts to reduce and prevent violence and its associated costs. Utilising ambulance call-out data is an extension of this concept, and the data constitutes a significant new source of intelligence that, when used alongside police and ED data, presents a more detailed picture of violence in a given area.
In the context of a new violence prevention initiative set up in 2015,1 the West Midlands Violence
Prevention Alliance2 was set up as a multi-agency response to public violence.3 In the same year, West Midlands Police received a grant from the Police Innovation Fund to bring together key partners relevant to accessing, understanding and making the best use of ambulance data to aid with the prevention of
violence. The first output from this study was a technical report, produced in 2017.4 The second was thisguidance for practitioners from any location who are seeking to establish a data-sharing arrangement between police and ambulance services and test the utility of such a practice in their own area.
For more information about RAND Europe or this document, please contact:
Dr Alex Sutherland
RAND Europe, Westbrook Centre, Milton Road, Cambridge CB4 1YG
Email: [email protected]
1Public Health England (2015). 2 West Midlands Violence Prevention Alliance homepage (2017). 3 Ibbotson (2015). 4 Sutherland et al. (2017). The technical report may be accessed here: https://www.rand.org/pubs/research_reports/RR2216.html
iv
Table of contents
Preface ..................................................................................................................................................... iii
Table of contents ...................................................................................................................................... iv
Figures ..................................................................................................................................................... vi
Tables ..................................................................................................................................................... vii
Acknowledgements ................................................................................................................................ viii
Abbreviations and glossary ........................................................................................................................ 9
Executive summary .................................................................................................................. 10
Data collection ................................................................................................................................. 11
Data-sharing partnerships ................................................................................................................. 11
Using ambulance data for injury surveillance .................................................................................... 12
1. Introduction to the guidance .............................................................................................. 14
1.1.Why use ambulance data for violence prevention activities? ........................................................ 15
1.2.Using this guidance .................................................................................................................... 16
2. Building and maintaining data-sharing partnerships ............................................................. 17
2.1.Agreeing a purpose ..................................................................................................................... 18
2.2.Generating buy-in ...................................................................................................................... 18
2.3.Data sharing ............................................................................................................................... 18
2.4.Building trust and relationships .................................................................................................. 19
3. Understanding the basic ambulance datasets ........................................................................ 21
3.1.Computer-aided dispatch (CAD) dataset .................................................................................... 21
3.2.Data processing .......................................................................................................................... 26
4. How might ambulance data be used for violence prevention? ............................................... 28
4.1.Example analysis steps ................................................................................................................ 28
4.2.Analysis based on incident frequency, time, location and victim characteristics ........................... 29
4.2.1. Comparison of volumes between police, ambulance and ED data ...................................... 29
4.2.2. Time of assault .................................................................................................................. 30
v
4.2.3. Injury severity and incident type ........................................................................................ 31
4.2.4. Location of assault ............................................................................................................. 32
4.2.5. Victim characteristics ......................................................................................................... 33
4.3.Potential uses of analysed ambulance data for police purposes .................................................... 33
4.3.1. Uses of type of assault data ................................................................................................ 35
4.3.2. Uses of time of assault data ................................................................................................ 35
4.3.3. Uses of location data .......................................................................................................... 36
4.4.Potential limitations of ambulance data ...................................................................................... 36
5. Summary ........................................................................................................................... 38
References ............................................................................................................................... 39
Appendix A: WMAS data requested .......................................................................................... 41
Appendix B: Caldicott Principles .............................................................................................. 42
Appendix C: Resources for setting up ambulance data sharing .................................................... 43
Appendix D: How to make using ambulance data easier ............................................................ 44
Appendix E: Communication reference 0288158 ....................................................................... 46
Appendix F: Patient Report Form ............................................................................................. 49
vi
Figures
Figure 1: Key players in ambulance data sharing ..................................................................................... 17
Figure 2: Example of a 200 m x 200 m spatial net in Wolverhampton city centre; each red dot represents a unique postcode .......................................................................................................................... 22
Figure 3: Example of conversion between coordinates (blue dot) and postcode (black polygon) using the postcode centroid (red dot) ............................................................................................................ 27
Figure 4: Number of violence-related incidents in police, ED and ambulance datasets, January 2012 to April 2017 ..................................................................................................................................... 30
Figure 5: Violent incidents in the police and CAD datasets by day of week, January 2012 to April 2017 30
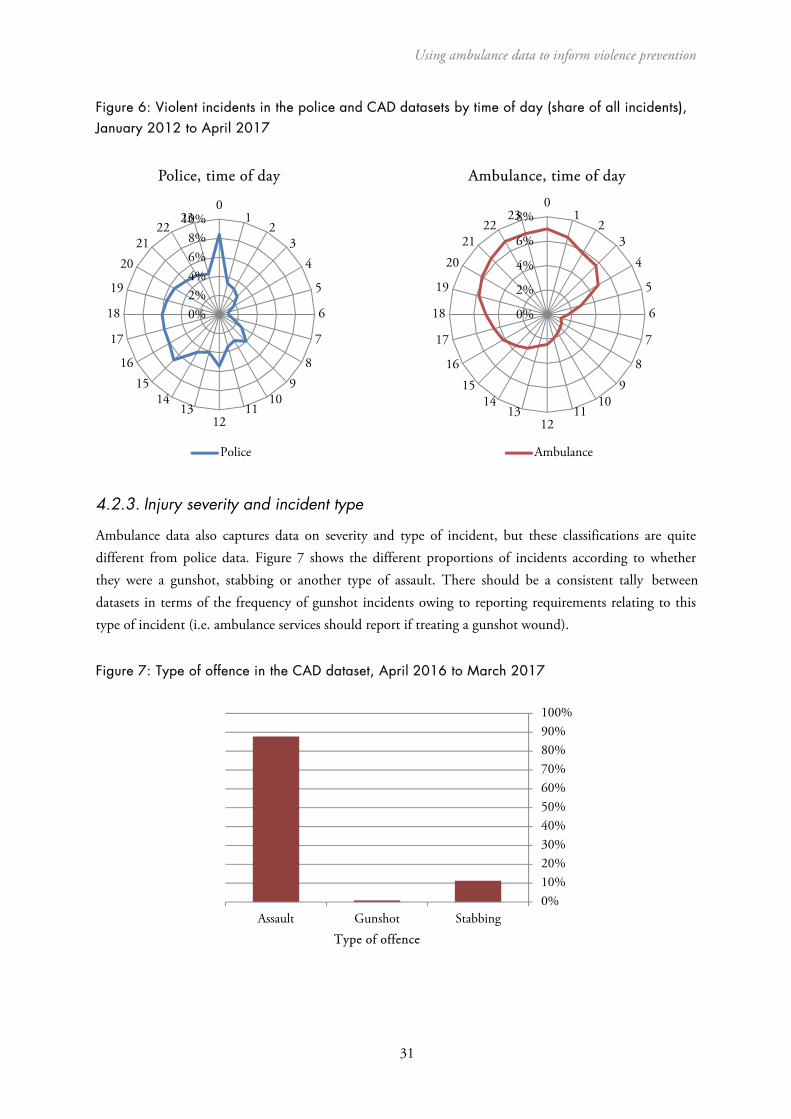
Figure 6: Violent incidents in the police and CAD datasets by time of day (share of all incidents), January 2012 to April 2017 ........................................................................................................................ 31
Figure 7: Type of offence in the CAD dataset, April 2016 to March 2017 ............................................. 31
Figure 8: Assaults within the 21–25 year olds age group in Wolverhampton from CAD dataset, 2012–2015 (top panel); police dataset of all violent crimes, 2012–2015 (bottom panel) .......................... 32
Figure 9: Gender and age distribution in the CAD dataset, April 2016 to March 2017 .......................... 33
Figure 10: Getting started checklist ........................................................................................................ 43
vii
Tables
Table 1: Example of CAD dataset fields ................................................................................................. 23
Table 2: Examples of symptom group descriptions from CAD dataset ................................................... 24
Table 3: PRF dataset variables ................................................................................................................ 25
Table 4. Potential uses of ambulance data analysis .................................................................................. 34
Table 5. Distribution of assault types in the CAD dataset ...................................................................... 35
Table 6. WMAS dataset initially requested by RAND Europe ................................................................ 41

viii
Acknowledgements
The authors would like to thank the many people who have supported this project. First and foremost, we would like to thank our research partners at the West Midlands Police and the Violence Prevention Alliance, including Superintendent Simon Inglis, Chief Inspector Dave Twyford, Ciaran Walsh and Andy Brumwell; and at the West Midlands NHS Ambulance Trust, Chris Kerr.
We also thank Dr Adrian Boyle and Dr Barak Arial for their guidance throughout the project, and our former RAND Europe colleague Dr Chris Giacomantonio, who managed the research study in its early stages.
We also thank the Police Innovation Fund for the opportunity to conduct this piece of research.
Finally, we are grateful to our Quality Assurance reviewers, Dr Zara Quigg from the Public Health Institute, Liverpool John Moores University and Dr James Fox from RAND Europe.
Using ambulance data to inform violence prevention
9
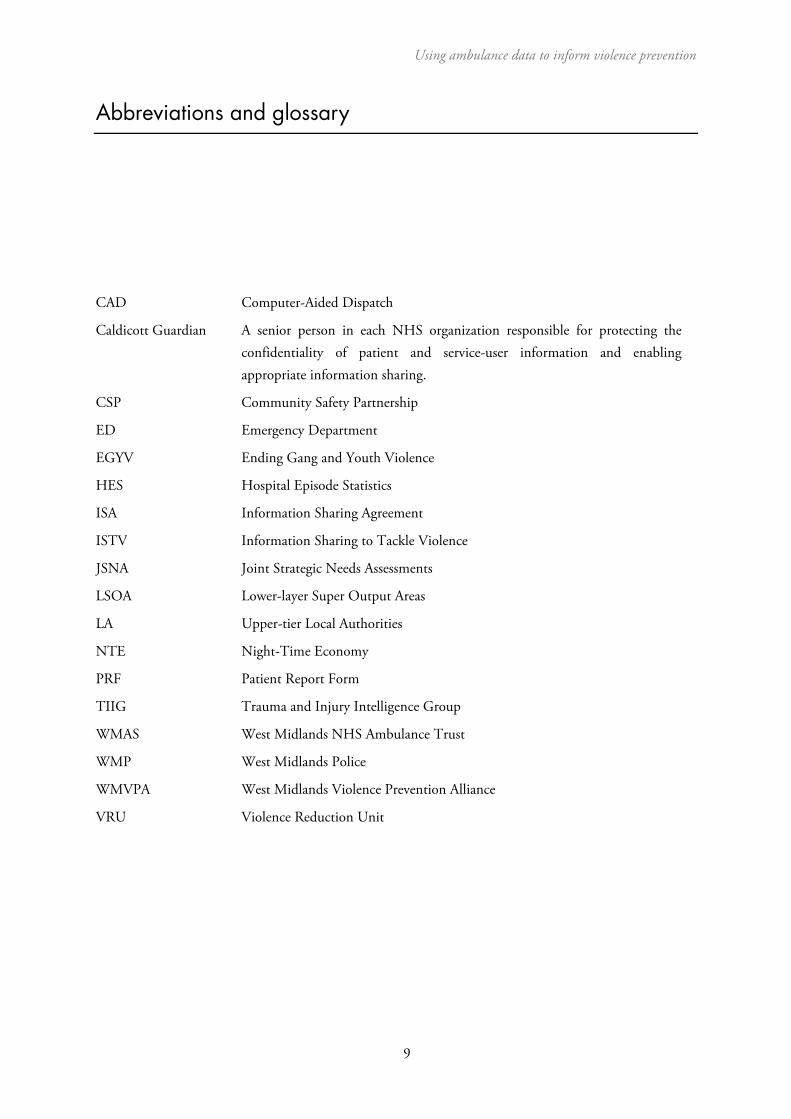
Abbreviations and glossary
CAD Computer-Aided Dispatch
Caldicott Guardian A senior person in each NHS organization responsible for protecting the confidentiality of patient and service-user information and enabling appropriate information sharing.
CSP Community Safety Partnership
ED Emergency Department
EGYV Ending Gang and Youth Violence
HES Hospital Episode Statistics
ISA Information Sharing Agreement
ISTV Information Sharing to Tackle Violence
JSNA Joint Strategic Needs Assessments
LSOA Lower-layer Super Output Areas
LA Upper-tier Local Authorities
NTE Night-Time Economy
PRF Patient Report Form
TIIG Trauma and Injury Intelligence Group
WMAS West Midlands NHS Ambulance Trust
WMP West Midlands Police
WMVPA West Midlands Violence Prevention Alliance
VRU Violence Reduction Unit
RAND Europe
10
Executive summary
‘There is nothing immutable or inevitable about violence.’
– Dr Sue Ibbotson, Director, Public Health England West Midlands
The use of ambulance data for crime reduction is a form of injury surveillance and an extension of the
practice pioneered in the Cardiff Model for Violence Prevention.5 Under this model, emergencydepartment (ED) data for assault-based injuries is shared with the police and Community Safety Partnerships (CSPs) to help them identify where violent crime is taking place, which in turn allows police to target their resources to reduce violent offending.
ED data has been shown to help police identify violent crime that goes unreported to police, and aid in problem-solving activities that have demonstrably reduced violence. ED data therefore provides a supplementary measure of violence in an area. Ambulance data is a parallel data source that can also be used to the same ends, but its utility has not been explored to the same extent as ED data.
This guidance is aimed at those interested in violence reduction and who do not currently use ambulance data, or wish to extend their current use of ambulance data, such as police analysts and community safety partners. It is based on the knowledge of practitioners who are currently involved in sharing ambulance
data, research into the uses of this data in the UK and internationally6 and expert opinion. It identifies anumber of potential uses of ambulance data as well as common issues associated with the sharing and use of this information, particularly in the UK.
5 Injury surveillance is a broader term encompassing a wide range of systematic tracking approaches to identify and prevent both intentional and unintentional injuries; see, for example, Holder et al. (2001). 6 A technical report, available at https://www.rand.org/pubs/research_reports/RR2216.html, provides the findings of the literature review, which focused on the uses of ED data in the UK and internationally. The technical report also outlines the methods used in the production of this guidance (for the literature review, interviews with practitioners and a workshop with practitioners).
Using ambulance data to inform violence prevention
11
The main messages from the guidance, which relate to data collection, data-sharing partnerships and using ambulance data for crime prevention, are outlined below. These messages are examined in further detail within the guidance.
The guidance is not exhaustive or comprehensive and practitioners are encouraged to share new and promising practice in this area through the West Midlands Violence Prevention Alliance (WMVPA), College of Policing and other available avenues such as POLKA, the online police collaboration tool.7
This guidance is not intended to alter existing practice where they are already considered effective. Additionally, while the guidance has focused on certain types of analysis based on existing practice and known limitations to the data, the guidance is not intended to discourage potentially innovative uses of health data that have not been considered by this guidance.
Data collection
The basic dataset collected by UK ambulances is called computer-aided dispatch (CAD) data, and includes the date and time of the incident and severity of injury.
Additional data may also be available, such as the Patient Report Form (PRF), but these can require additional work. However, PRFs contain significantly more detail than dispatch data about the nature of injuries sustained (and how). Similarly, some ambulance services (e.g. West Midlands) have recently moved to electronic PRF data collection, so this may make using this data source more appealing. (An example of a paper PRF is given in the Appendix.)
Data-sharing partnerships
The Information Commissioner’s Office has stated that health data can be shared within the provisions of the Data Protection Act, provided the data is used for crime prevention, not crime
detection.8 Data-sharing requires a good working relationship between agencies, facilitated both at
strategic and operational levels. This is evidenced by previous experience of ED data-sharing9 findings from the ‘Using Ambulance Data for Violence Prevention’ project with the West Midlands Police
(WMP), which funded this guidance10, and wider projects that have specifically used ambulance data
such as Trauma and Injury Intelligence Group (TIIG).11
Evidence from practice12 suggests that data sharing is more likely to succeed if there is a named individual at the ambulance service responsible for sending the data to a named individual at the
7
8
9
POLKA homepage (2017) http://www.college.police.uk/What-we-do/Research/polka/Pages/POLKA.aspx.
Communication reference 0288158, in Appendix E.
See, for example, Shepherd & Lisles (1998) and Giacomantonio et al. (2014). 10 Sutherland et al. (2017). RAND Report. 11See, for example, Trauma and Injury Intelligence Group homepage (2017) and Quigg et al. (2011). 12Giacomantonio et al. (2014).
RAND Europe
12
CSP, the police force, public health team or potentially a third-party service. This named individual from the CSP, police, public health or third-party will then be responsible for cleaning the data and preparing analytic products of interest for different partners, such as licensing teams, other analysts in the police force, CSP partnership analysts and area or tactical support commanders.
It is important to distinguish between this kind of data sharing, which is active surveillance of violence for crime prevention, and the exceptional circumstances where a clinician is obliged, in the public interest, to inform the police about a serious assault. The two processes are very different and should not be merged.
Once a data-sharing partnership to collect assault incident data has been established, the longer-term success of the partnership depends on mutual support and value being given to the work at regular intervals. Identifying and maintaining a data-sharing champion role within police forces, CSPs and ambulance services can add resilience to partnerships, while direct and regular feedback to ambulance staff reinforces the importance of data collection.
Common pitfalls among data-sharing partnerships include viewing different health bodies as one entity, using health data for unsuitable purposes such as crime detection (mission creep), assuming that health staff follow a command-and-control culture and undervaluing the data communications process.
Using ambulance data for injury surveillance
Basic CAD data on incident type, time, location and victim details can be analysed to validate or challenge existing knowledge, support police deployments, target resources and support problem-solving. For example, location data can help to identify hotspot areas for violent assaults that may not be recorded in police data.
Ambulance data can also be used as an outcome metric for evaluating violence reduction initiatives and strategies, such as licensing decisions. These more advanced uses of ambulance data generally require analytic skills such as regression modelling or knowledge of research design, and also need to take into account the limitations of ambulance data as a form of evidence. The added value here is that ambulance data is recorded independently of police data, meaning that changes in police recording practice that are known to affect police data do not affect ambulance data. This means that it is possible to assess the impact of police actions using multiple sources (police, ambulance and ED), providing more certainty about ‘impact’ in the absence of more rigorous research designs.
The limitations of ambulance data include issues around the geographic location of incidents, as where an ambulance attends and where an incident takes place may not be the same. Similarly, some ambulance services may be unwilling to provide specific (e.g. eastings and northings) location details for incidents at first (they might, however, provide full postcodes).
This guidance document is divided into five parts. Section 1 provides an introduction to the topic and use of the guidance; Section 2 provides guidelines on setting up maintaining an ambulance data-sharing partnership; Section 3 describes how to understand the datasets; and Section 4 provides guidelines on using ambulance data.

Using ambulance data to inform violence prevention
13
To facilitate ambulance data sharing, we also include two resources as part of Appendix C. The first is a basic checklist for setting up ambulance data sharing, the second is a mnemonic to assist ‘data champions’ to present the core arguments for the use of ambulance data in violence prevention.
RAND Europe
14
1. Introduction to the guidancePolice, public health and CSPs can make use of ambulance call-out data to identify where violent crime is taking place. In particular, the use of ambulance data can help forces identify violent crime that is unreported to the police. One study found that ‘[at] least one in every two police hotspots [of violent
crime] does not have an ambulance hotspot overlapping with it’,13 and another showed that less than 20
per cent of violent incidents in ambulance data were found in police data.14 This provides good evidence that ambulance data provides a unique source of intelligence on violence. RAND Europe has developed this guidance to help police forces, particularly in the UK, develop the capacity to include ambulance data to support violence prevention initiatives.
This document should serve as an introduction to the datasets that may be available from ambulance services, along with the kinds of analyses and initiatives that can be supported by ambulance data. It is written primarily for police analysts and other relevant practitioners in forces that are just starting to receive and use ambulance data, as well as in forces that are looking to expand or refine the ways in which they analyse and communicate such data. The guidance is written with minimal reference to external sources, but a supplementary technical report provides more detail on the literature, data and methods
used for the project.15
The background to this guidance is over 20 years of work on using health data for injury surveillance and violence prevention, originating from work by Professor Jonathan Shepherd at Cardiff University. The Cardiff Model for Violence Prevention is widely accepted as the model for best practice in England and
Wales in this area.16 The World Health Organization now promotes the sharing of ED data as part of the
public health approach to violence prevention.17 The Cardiff Model approach to ED data collection and sharing between health, police and other relevant community safety partners offers a framework on which further practice in this area can be built. This approach has been incorporated into the Information Standard to Tackle Violence (ISTV), which requires all EDs to collect, share and report injury
surveillance data.18
It is important to note that there is not yet the same evidence base supporting the use of ambulance data for violence prevention initiatives as with ED data, but there is strong evidence that ambulance data is a unique source of data for monitoring violence.
13 Ariel et al. (2015). 14 Sutherland et al. (2017). 15 Sutherland et al. (2017). 16 Shepherd (2007a). 17 WHO (2014). 18 See the original letter making the case for national adoption of ISTV: https://www.statisticsauthority.gov.uk/wp-content/uploads/2016/06/Letter-from-Jonathan-Shepherd-to-Adrian-Smith-8-April-2016.pdf, and dataset requirements: http://www.datadictionary.nhs.uk/data_dictionary/messages/supporting_data_sets/data_sets/information_sharing_to_tackle_violence_minimum_data_set_fr.asp?shownav=1
Using ambulance data to inform violence prevention
15
1.1. Why use ambulance data for violence prevention activities?
The main reason that the police should use ambulance data is that many violent incidents are not known to the police. This means that police and/or public health efforts to reduce violence may not be targeted as well as they could be. As an example, in the project this guidance is based on, we found as little as 10 per cent overlap in the location and timing of violent incidents between ambulance and police
data.19 What this tells us is that the optimum approach to injury surveillance is likely to integrate data from police, ambulance, EDs and hospital episode statistics (HES) for analysis.
Alongside this, ambulance data differs from ED data in that the volume of patients is higher for ambulance services, meaning there is more information available. This does not necessarily mean that ambulance data can be used to verify what police already know, because the overlap is low as noted above. Rather, as this data is collected routinely, and is not affected by factors that can influence police recorded crime, it means that ambulance data offer a genuine alternative source of intelligence on where high-volume hotspots for violence occur.
The use of ambulance data to inform interventions intended to reduce different types of crime has not yet been tested and it is not known whether they can be effective. However, these potential uses might be explored and developed further and offer the opportunity for police, CSPs, public health and other violence prevention partners to innovate. We know, for example, that ED data sharing has been successfully used to target policing and prevention activities related to city centre and alcohol-based
violence, primarily around problem-solving the so-called night-time economy (NTE).20 However, a number of other potential uses have been identified, such as prevention of knife crime, violence in schools, domestic violence and identification of gang-related violence. Given the higher volume of incidents in the ambulance data than in ED data, this sort of targeted prevention might be possible.
Complementing enforcement-led initiatives, injury surveillance data can identify opportunities for
violence prevention through safety measures.21 Such data can also inform decisions about public transport planning around city centre locations, such as fast food outlets where large volumes of people may congregate and violence might occur. For example, more frequent bus services in these locations
during busy periods may help to alleviate large crowds and reduce the likelihood of violence.22
Sharing ambulance data alone cannot generate reductions in violence. The act of data sharing alone cannot bring about changes in violence – the data has to be used to inform actions and those actions in turn need to be rigorously evaluated.
19 Sutherland et al. (2017). This is consistent with other health findings; see, for example, Boyle A, Kirkbride J, Jones P. Record linkage of domestic assault victims between an emergency department and the police. Journal of Epidemiology & Community Health 2005; 59: 909-910. 20 Shepherd (2007b). 21 Ibid. 22 Although based on ED data, this point is still relevant for ambulance services. See, for example, Ariel & Partridge (2016), Quigg et al. (2013), and Warburton & Shepherd (2004).
RAND Europe
16
Ensuring the police and CSPs have access to good-quality ambulance data may be valuable for violence reduction. Beyond that, it is also important that close professional relationships are established between relevant ambulance staff, police analysts and other violence prevention partners for these partnerships to have an impact on violence levels. Sharing ambulance data to the appropriate people and using them to support policing initiatives requires ongoing and active partnerships.
It is important to stress that this model is not designed to assist police in the investigation of specific offences and suspects. This point should be reiterated in discussions between stakeholders about sharing ambulance data.
1.2. Using this guidance
This guidance identifies a number of possible uses of ambulance data as well as common issues associated with the sharing and use of these data. However, the guidance is not intended to be exhaustive or comprehensive. Practitioners are encouraged to share new and promising practices in this area with one another through the College of Policing and any other available avenues. This guidance is not intended to alter existing practice where it is already considered effective, nor to limit potentially innovative uses of ambulance data that have not been considered by this review.
As noted above, data sharing on its own does not produce results. Rather, data sharing becomes valuable when it is used to support on-the-ground violence prevention initiatives. To that end, once data has been received, reviewed and analysed, it then needs to be communicated to the appropriate people. In forces and CSPs that are not currently or have only just started receiving these data, potential uses may not be entirely clear to all members or partners. As described in the following sections, part of making the most of ambulance data involves an ongoing process of raising awareness of this information source, educating partner agencies about the uses to which it can be put and reinforcing these messages with key internal and external partners.
Finally, many of the suggestions in this guidance have not yet been empirically validated as effective.
These guidelines are based on available evidence, but it should be understood that this is sometimes anecdotal. Without rigorous evaluation evidence of effectiveness, the initiatives identified here should be seen as potentially valuable approaches to the use of ambulance data, but not necessarily as best practice in the field of ambulance data sharing.
Where appropriate, debate about the value of certain approaches is highlighted in this document, but the guidance avoids being prescriptive about what approaches ought to be considered valuable. Police forces using ambulance data are encouraged to share their successes and challenges with others through available channels such as the Practice Bank on POLKA so that a wider body of evidence can be established.
Using ambulance data to inform violence prevention
17
2. Building and maintaining data-sharing partnerships
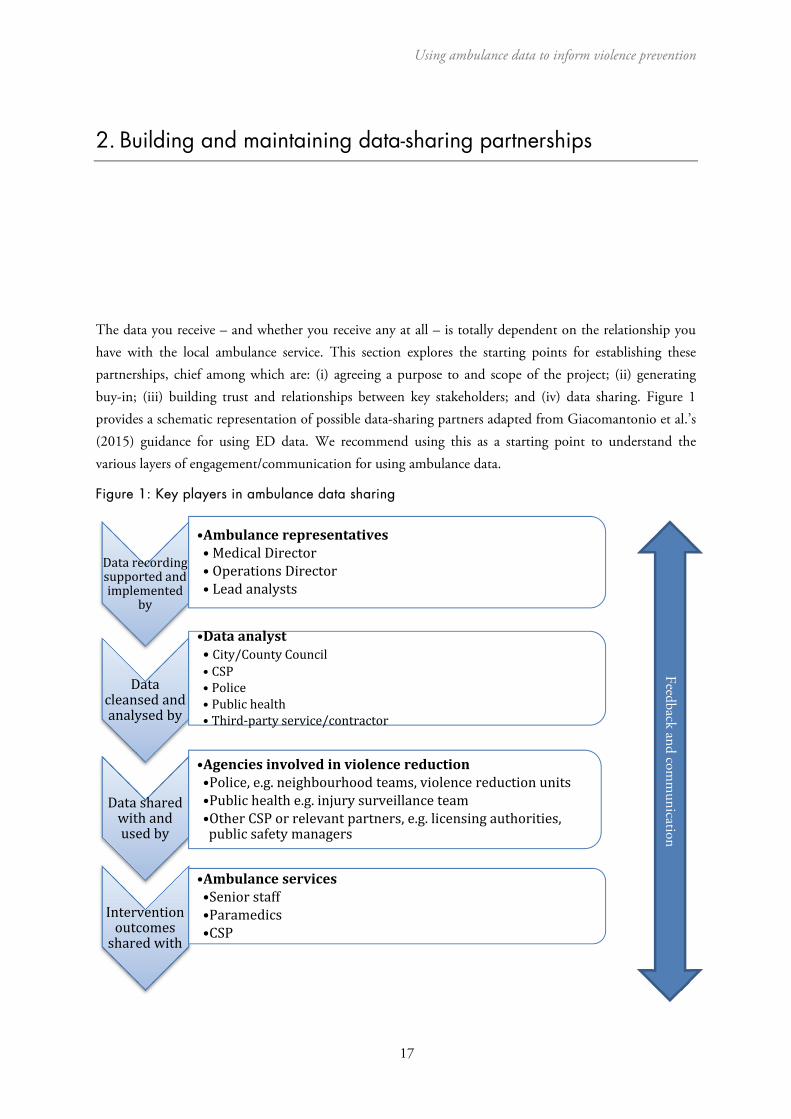
The data you receive – and whether you receive any at all – is totally dependent on the relationship you have with the local ambulance service. This section explores the starting points for establishing these partnerships, chief among which are: (i) agreeing a purpose to and scope of the project; (ii) generating buy-in; (iii) building trust and relationships between key stakeholders; and (iv) data sharing. Figure 1 provides a schematic representation of possible data-sharing partners adapted from Giacomantonio et al.’s (2015) guidance for using ED data. We recommend using this as a starting point to understand the various layers of engagement/communication for using ambulance data.
Figure 1: Key players in ambulance data sharing
Datarecordingsupportedandimplemented
by
•Ambulancerepresentatives• MedicalDirector• OperationsDirector• Leadanalysts
Datacleansedandanalysedby
•Dataanalyst• City/CountyCouncil• CSP• Police• Publichealth• Third‐partyservice/contractor
Datasharedwithandusedby
•Agenciesinvolvedinviolencereduction•Police,e.g.neighbourhoodteams,violencereductionunits•Publichealthe.g.injurysurveillanceteam•OtherCSPorrelevantpartners,e.g.licensingauthorities,publicsafetymanagers
Interventionoutcomessharedwith
•Ambulanceservices•Seniorstaff•Paramedics•CSP
Feedback and comm
unication
RAND Europe
18
2.1. Agreeing a purpose
Police and ambulance services have very different ‘missions’, so it is necessary to build an understanding of why the data sharing is required and to what end. Such a shared understanding is also necessary to ensure that the extent and detail of the data share is proportionate (i.e. that enough detail is shared to fulfil a given purpose, but no more). Initial discussions should afford clarity about what data is required and why. There is an extent of risk management in relation to data sharing and the level of detail being requested that organisations need to engage with and flesh out, as there may not be perfect alignment between organisations.
2.2. Generating buy-in
The route for securing cooperation and buy-in must be at a senior level in the first instance – meaning that both the police and ambulance service must be willing to engage at a senior level and ensure that the data-sharing initiative has the required leadership to succeed.
Before engaging with potential partners, it is important to develop a clear rationale for why sharing ambulance data might be beneficial. This means benefits to the community, police and ambulance service. In short, what does each group get out of the arrangement? The benefits to each group might also be over different timescales and relate to different outcomes. For example, a reduction in ambulance call-outs arising from police preventative work is an immediate benefit to an ambulance service, but to get to that requires a chain of decisions and actions involving both police and ambulance service.
Furthermore, a force must establish a clear pathway for ambulance data to be used by analysts in routine work. The receiving police force or CSP must have personnel and information technology resources in place to ensure that the data can be incorporated into police intelligence and strategic processes. An element of this pathway is the presence of champions and leadership to promote the use of the data and keep it prominently in the force’s agenda (this will be discussed further below).
2.3. Data sharing
Once there is agreement from all stakeholders about the data sharing process, these terms should be formalised in an information sharing agreement (ISA). The creation of the ISA is linked to a clear rationale for the data share and an understanding about what data might be available, what can be requested and in what format.
Other questions include:
• The length of the agreement• Protocols and resources for the secure reception and storage of the ambulance data• The actors who would send, receive and monitor the use of this data, solely for preventing
violent crime• The degree of and responsibility for the anonymisation of the data.
Using ambulance data to inform violence prevention
19
ED data is normally anonymised before it is shared with police forces, and a similar level of anonymisation is likely to be utilised for ambulance data. Nonetheless, it is recognised that the details included in these datasets could in some cases be converted into personal information in conjunction with data already held by police. However, as noted by the Information Commissioner’s Office,23 this should not be on its own a barrier to the appropriate sharing of personal information, so long as appropriate precautions are in place. The precautions would traditionally include an ISA that precludes use of the data outside of project scope and regular oversight by the relevant Caldicott Guardian (a senior person within each NHS organisation responsible for ensuring appropriate information sharing).
2.4. Building trust and relationships
Once a data-sharing partnership has been established, the long-term success of the project requires ongoing engagement and trust-building. ED data has been, and continues to be, shared in a safe and confidential manner within violence prevention partnerships across various areas in England and Wales. This has been possible through a conscientiously managed partnership approach that is replicable in the ambulance data context. Fundamental to this approach is compliance with the ISA by all parties and the continued security of the data. In addition, there are a number of other approaches to building resilient and trusting relationships within data-sharing partnerships.
Fostering collaboration between stakeholders
Previous research has suggested that beyond making the benefits of data sharing clear to all stakeholders, fostering collaboration may strengthen relationships. This may take a variety of forms, for example, through the involvement of health workers in CSPs. For the TIIG project, regular contact between the police, health and community safety officers involved was maintained, including through bimonthly
meetings to discuss the project and potential interventions using the shared data.24 Furthermore, project tasks were shared across the team: ED receptionists were trained by TIIG officers on completing data collection forms, an ED quality officer examined the data quality, and a TIIG officer cleaned and analysed the data. Regular meetings and training sessions, and using local champions, may also raise awareness of the project to relevant actors and encourage a partnership approach.
Appointing a data sharing champion
Practitioners have consistently identified the importance of appointing a named ambulance data-sharing ‘champion’ with dedicated responsibilities – and available time – to provide ongoing leadership in maintaining partnerships, data quality and analytic outputs from the use of ambulance data. Champions should be established from the partnership’s inception.
23 Communication reference 0288158, in Appendix E. 24 See: Quigg et al. (2011).
RAND Europe
20
Box 1. A variety of champions
Those involved in data-sharing partnerships have suggested that a champion can facilitate the buy-in of multiple partners and maintain interest in these kinds of initiatives, particularly during the establishment of the partnership as well as during periods of institutional change.
There is no set model for who should champion these initiatives. Different force areas have, either organically or by design, identified champions from all kinds of violence reduction partners. Champions may be licensing officers, police analysts, senior police officers, CSP or city council analysts, third-party data collection services or representatives of ambulance trusts.
It has been suggested that, ideally, each relevant partner will have its own internal champion, who will act as a point of contact for other partners as well as continue to promote the collection and use of the data within their own institution.
A champion’s role is to align partners with the core purpose of the data collection and to help all parties continue to see its value. This can be done through regular personal contact with key players; providing training to ambulance service personnel, police officers and analysts and CSP partners and staff; supporting colleagues in developing approaches to using the data; establishing long-term sustainability and resilience in data-sharing practices; and providing institutional memory for the partnership during changes in personnel. Practitioners report that even those partnerships that have been well established for a number of years still require a champion and users of the data are regularly required to ‘sell’ others on the value of the data.
A champion can also provide awareness of the causes of any complications in the partnership and act to communicate and resolve them. For example, analysts may experience delays in receiving the data. A champion may look into the cause of the issue and determine whether it is due to an IT problem, the addition of new staff unfamiliar with the relevant protocols or a broader issue such as reduced staff interest in data sharing.
Sharing data and feedback among relevant partners
Ensuring that the use of the data and analysis is translated into on-the-ground activity by police or other public services requires that partners understand what the data can tell them, and that it is targeted to their information needs. Ensuring that a dataset has been cleaned and, where possible, that pertinent issues have been highlighted before sharing may increase the likelihood that a partner will be able to take action based on the data.
In addition, regular feedback is seen by practitioners as an important tool to keep health staff engaged with the partnership, which may help to ensure regular and up-to-date data shares. Feedback may relate to uses of the analysis for specific interventions or evaluations, or identification of discrepancies between datasets to identify patterns of violence previously unknown to partners. Where the use of ambulance data can be linked to a reduction in violence in an area, this success should be communicated to the ambulance service staff providing the data.
Using ambulance data to inform violence prevention
21
3. Understanding the basic ambulance datasets
Underpinning the approaches set out in this guidance is ambulance call-out data generated automatically by dispatch systems. This section briefly reviews the basic CAD data collected by the West Midlands NHS Ambulance Trust (WMAS); data collection and recording systems may differ by ambulance service, and so local partners should explore the available data when establishing partnerships.
3.1. CAD dataset
The CAD dataset allocates each incident to a specific time and postcode. Given that each postcode covers approximately 15 addresses, the referencing is broadly at the same level of precision as geospatial coordinates, but the actual geospatial area covered by a postcode varies by the density of housing in a
given location (see Figure 2 for an example of postcode density in the Wolverhampton city centre).25
All reported violent incidents are classified by the WMAS as assault (domestic as well as public), stabbing or shooting, and distributed by severity. It is important to remember, however, that classification can vary by Ambulance Trust. For example, the North West Ambulance Service codes are: assault/sexual assault and stab/gunshot/penetrating trauma. Classification of severity has changed over time and its comparison is therefore limited, so it is important for those requesting severity data to ask about any changes over time
that may impact on interpretation/comparability.26
In terms of data quality, CAD data is very consistent as it is automatically generated during 999 calls for service (as with police calls for service). As an example, in the dataset collected for our work in West Midlands, no incidents were missing postcodes, type of incident or severity classification and, while there may be a delay between an incident happening and call for ambulance, the time of connecting the call is captured precisely, giving a good indication of when an incident happened.
25 The raw CAD data contains the easting and northing coordinate data, but that was not shared as part of this project. 26 Specifically, in 2012–2016, the categories were Red 1, Red 2, Green 1, Green 2 and Green 4. In 2016, they briefly changed to Red R, Amber R, Amber T, Amber F, Green T, Green F, Green H; and later that year were changed to Category 1 R, Category 2 R, Category 2 T, Category 3 R, Category 3 T, Category 4 T, Category 4 H. According to the CAD officials, there is no direct cross-walk available for the different categorisations.
RAND Europe
22
Data on gender and age were less consistently recorded in the West Midlands, with approximately 14.4 per cent and 34.5 per cent of data missing, respectively. Similarly, the ‘caller’ variable is often missing (in 44.2 per cent of cases). A significant unanswered question is whether ambulance pick-up location is the same or similar to the location of where the violent incident actually occurred; this question needs to be explored in future research activities.
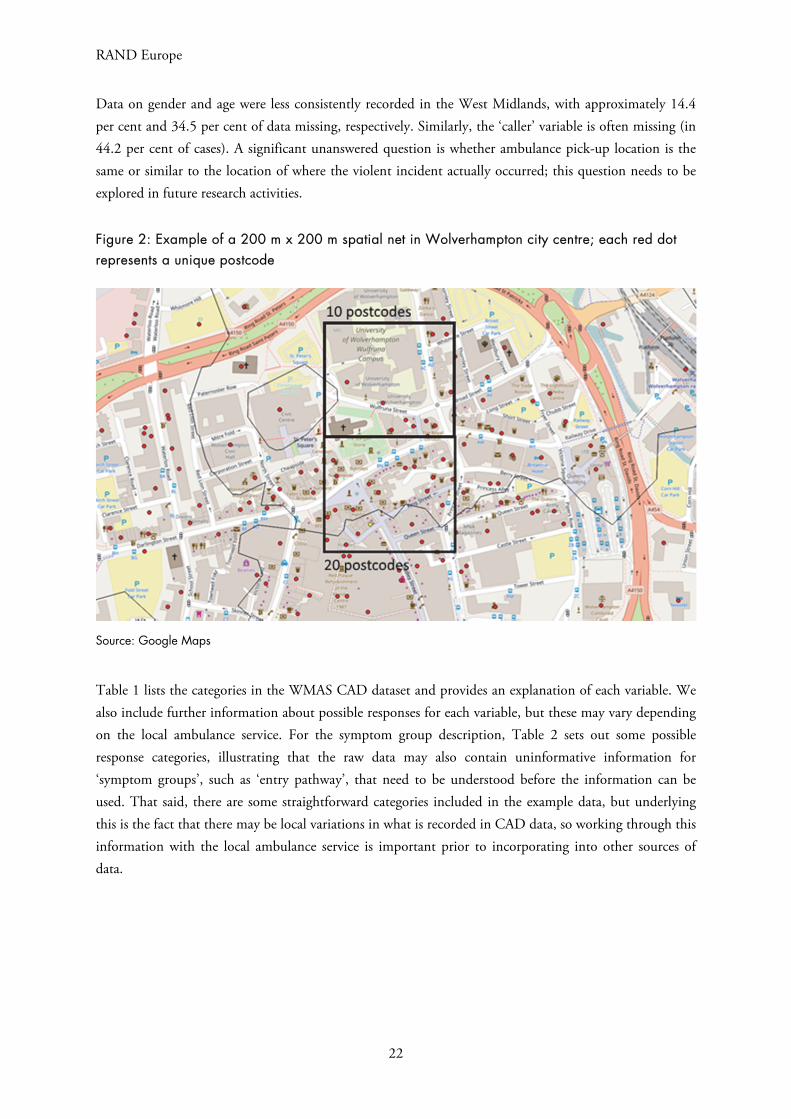
Figure 2: Example of a 200 m x 200 m spatial net in Wolverhampton city centre; each red dot represents a unique postcode
Source: Google Maps
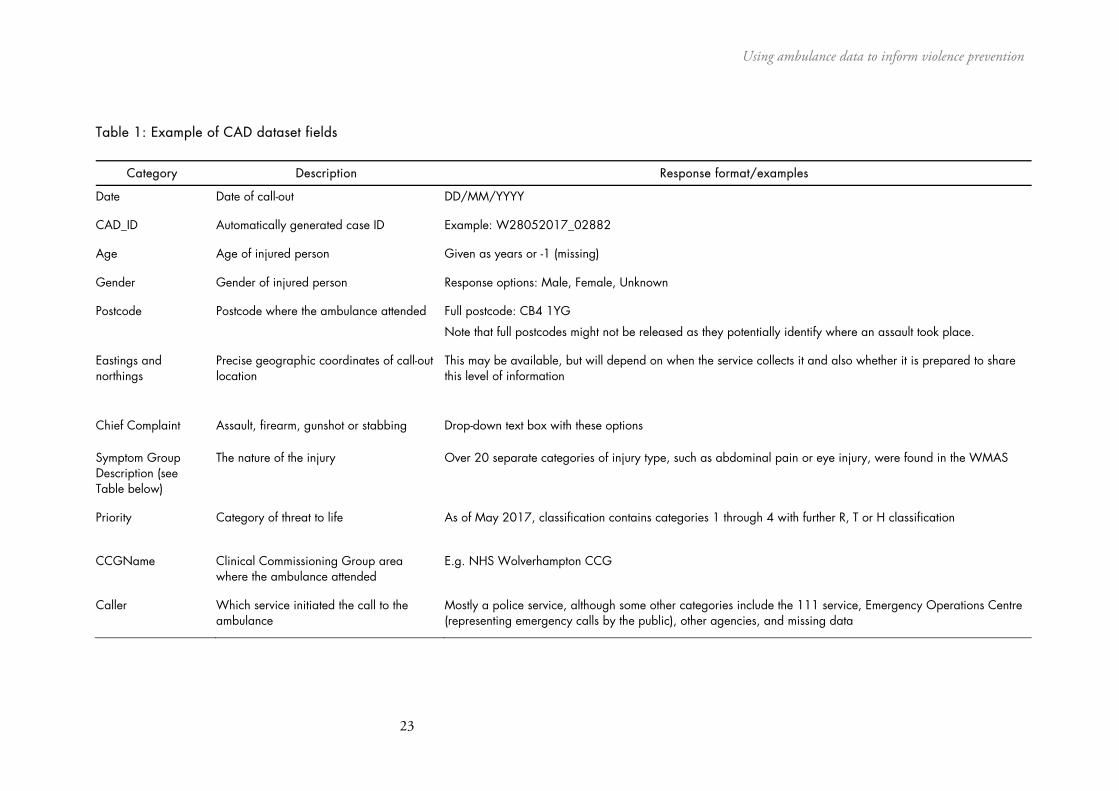
Table 1 lists the categories in the WMAS CAD dataset and provides an explanation of each variable. We also include further information about possible responses for each variable, but these may vary depending on the local ambulance service. For the symptom group description, Table 2 sets out some possible response categories, illustrating that the raw data may also contain uninformative information for ‘symptom groups’, such as ‘entry pathway’, that need to be understood before the information can be used. That said, there are some straightforward categories included in the example data, but underlying this is the fact that there may be local variations in what is recorded in CAD data, so working through this information with the local ambulance service is important prior to incorporating into other sources of data.
Using ambulance data to inform violence prevention
23
Table 1: Example of CAD dataset fields
Category Description Response format/examples
Date Date of call-out DD/MM/YYYY
CAD_ID Automatically generated case ID Example: W28052017_02882
Age Age of injured person Given as years or -1 (missing)
Gender Gender of injured person Response options: Male, Female, Unknown
Postcode Postcode where the ambulance attended Full postcode: CB4 1YG
Note that full postcodes might not be released as they potentially identify where an assault took place.
Eastings and northings
Precise geographic coordinates of call-out location
This may be available, but will depend on when the service collects it and also whether it is prepared to share this level of information
Chief Complaint Assault, firearm, gunshot or stabbing Drop-down text box with these options
Symptom Group Description (see Table below)
The nature of the injury Over 20 separate categories of injury type, such as abdominal pain or eye injury, were found in the WMAS
Priority Category of threat to life As of May 2017, classification contains categories 1 through 4 with further R‚ T or H classification
CCGName Clinical Commissioning Group area where the ambulance attended
E.g. NHS Wolverhampton CCG
Caller Which service initiated the call to the ambulance
Mostly a police service, although some other categories include the 111 service, Emergency Operations Centre (representing emergency calls by the public), other agencies, and missing data
RAND Europe
24
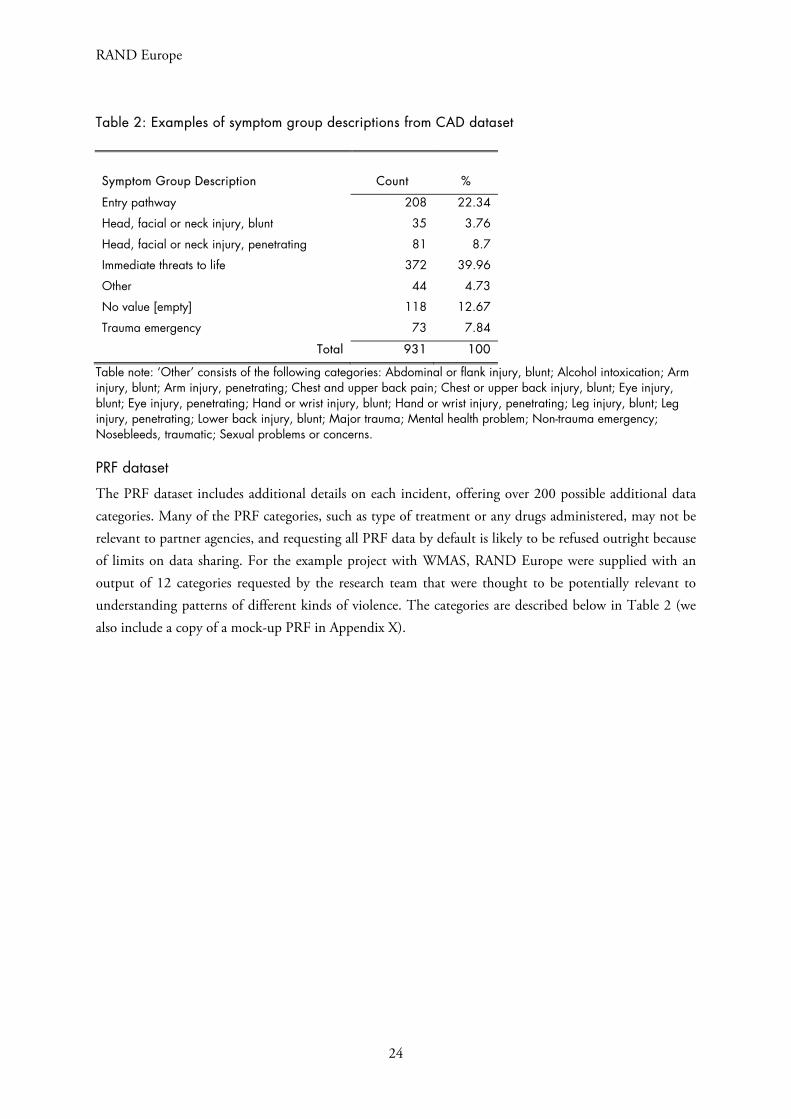
Table 2: Examples of symptom group descriptions from CAD dataset
Symptom Group Description Count %
Entry pathway 208 22.34
Head, facial or neck injury, blunt 35 3.76
Head, facial or neck injury, penetrating 81 8.7
Immediate threats to life 372 39.96
Other 44 4.73
No value [empty] 118 12.67
Trauma emergency 73 7.84
Total 931 100
Table note: ‘Other’ consists of the following categories: Abdominal or flank injury, blunt; Alcohol intoxication; Arm injury, blunt; Arm injury, penetrating; Chest and upper back pain; Chest or upper back injury, blunt; Eye injury, blunt; Eye injury, penetrating; Hand or wrist injury, blunt; Hand or wrist injury, penetrating; Leg injury, blunt; Leg injury, penetrating; Lower back injury, blunt; Major trauma; Mental health problem; Non-trauma emergency; Nosebleeds, traumatic; Sexual problems or concerns.
PRF dataset
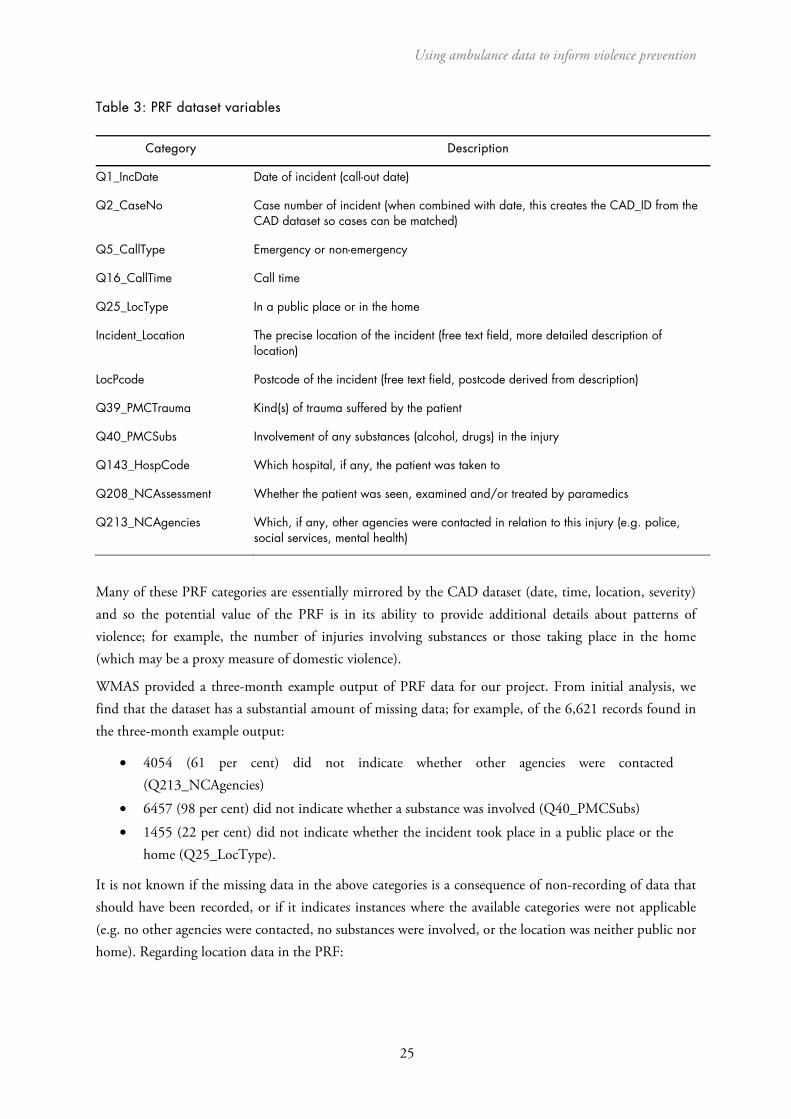
The PRF dataset includes additional details on each incident, offering over 200 possible additional data categories. Many of the PRF categories, such as type of treatment or any drugs administered, may not be relevant to partner agencies, and requesting all PRF data by default is likely to be refused outright because of limits on data sharing. For the example project with WMAS, RAND Europe were supplied with an output of 12 categories requested by the research team that were thought to be potentially relevant to understanding patterns of different kinds of violence. The categories are described below in Table 2 (we also include a copy of a mock-up PRF in Appendix X).
Using ambulance data to inform violence prevention
25
Table 3: PRF dataset variables
Category Description
Q1_IncDate Date of incident (call-out date)
Q2_CaseNo Case number of incident (when combined with date, this creates the CAD_ID from the CAD dataset so cases can be matched)
Q5_CallType Emergency or non-emergency
Q16_CallTime Call time
Q25_LocType In a public place or in the home
Incident_Location The precise location of the incident (free text field, more detailed description of location)
LocPcode Postcode of the incident (free text field, postcode derived from description)
Q39_PMCTrauma Kind(s) of trauma suffered by the patient
Q40_PMCSubs Involvement of any substances (alcohol, drugs) in the injury
Q143_HospCode Which hospital, if any, the patient was taken to
Q208_NCAssessment Whether the patient was seen, examined and/or treated by paramedics
Q213_NCAgencies Which, if any, other agencies were contacted in relation to this injury (e.g. police, social services, mental health)
Many of these PRF categories are essentially mirrored by the CAD dataset (date, time, location, severity) and so the potential value of the PRF is in its ability to provide additional details about patterns of violence; for example, the number of injuries involving substances or those taking place in the home (which may be a proxy measure of domestic violence).
WMAS provided a three-month example output of PRF data for our project. From initial analysis, we find that the dataset has a substantial amount of missing data; for example, of the 6,621 records found in the three-month example output:
• 4054 (61 per cent) did not indicate whether other agencies were contacted(Q213_NCAgencies)
• 6457 (98 per cent) did not indicate whether a substance was involved (Q40_PMCSubs)
• 1455 (22 per cent) did not indicate whether the incident took place in a public place or thehome (Q25_LocType).
It is not known if the missing data in the above categories is a consequence of non-recording of data that should have been recorded, or if it indicates instances where the available categories were not applicable (e.g. no other agencies were contacted, no substances were involved, or the location was neither public nor home). Regarding location data in the PRF:
RAND Europe
26
• All records had postcode (LocPcode) data, but most of these had formatting issues (e.g.additional spaces introduced) that would require correction before geospatial analysis couldbe conducted.
• Zero records had additional location (Incident_Location) data.
It is worth noting that WMAS reported that they were moving to an electronic data collection approach for PRF data. This means that, in time, PRF should be integrated into the CAD system so that a more comprehensive and complete dataset from each call may be available – the same may also be true of other ambulance services. This is particularly interesting since at least 64 per cent of the incidents in the PRF dataset were recorded as occurring in the home, and it may be possible to use this data as a proxy measure for domestic violence in an area (which is not possible with the CAD data alone).
It is worth noting that it may be time-consuming for ambulance services to provide collated PRF if they are using paper records and there may be data quality issues if there has been a recent switch to electronic records.
3.2. Data processing
As a first step in the analysis, the available data must be cleaned and recoded. The main data processing tasks consist of the following:
Conversion of geographical information was completed to allow postcode referencing and comparison between data sources for a given postcode. (If coordinate level data is available then this step is not necessary.) Each set of coordinates in the police data may be assigned a postcode using
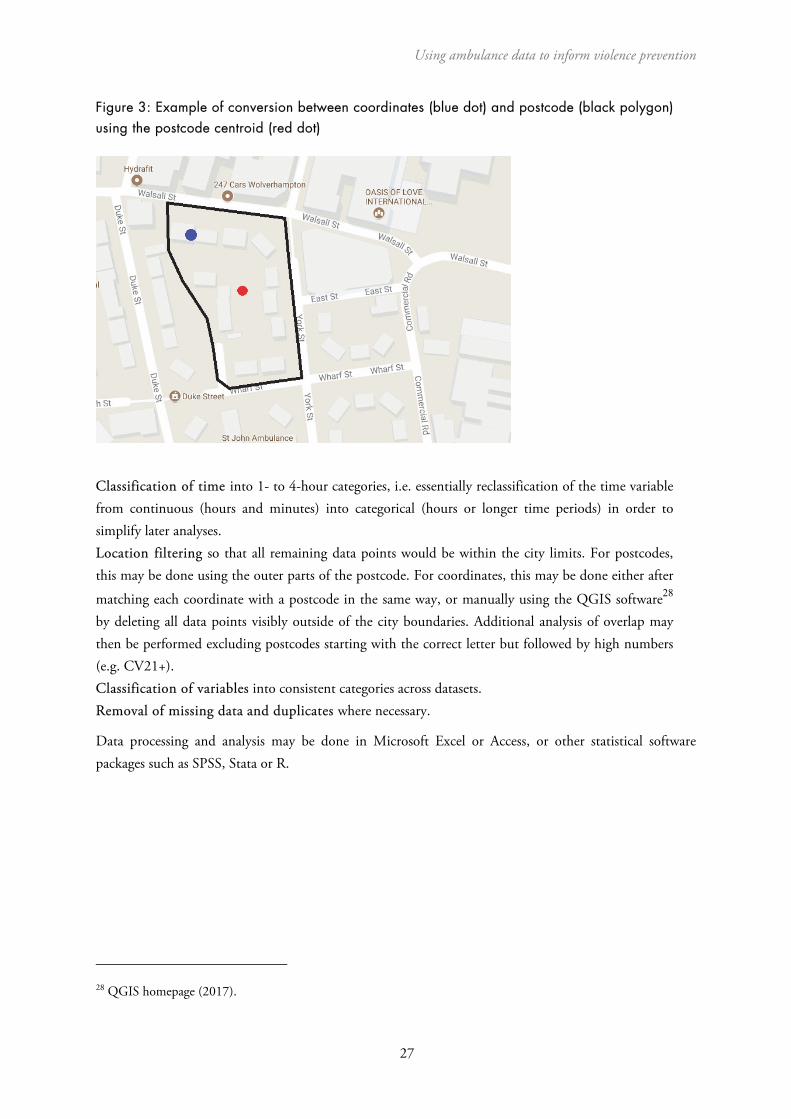
publicly available online resources27 and analogously each postcode in the ambulance data was assigned a set of geographical coordinates corresponding to its centre (where postcode information was available). This means that for every incident, postcode information and a single set of coordinates relating to the middle of the postcode the incident was recorded in is collected. These two approaches are demonstrated in Figure 3, in which an incident with precise geographical information captured using coordinates (blue dot) is assigned a postcode in which it lies (black polygon). Analogously an incident with postcode information (black polygon) is assigned a single set of geographical coordinates located in its centre (red dot).
27 See, for example, UK Grid Reference Finder homepage (2017), and Postcodes.io homepage (2017).
Using ambulance data to inform violence prevention
27
Figure 3: Example of conversion between coordinates (blue dot) and postcode (black polygon) using the postcode centroid (red dot)
Classification of time into 1- to 4-hour categories, i.e. essentially reclassification of the time variable from continuous (hours and minutes) into categorical (hours or longer time periods) in order to simplify later analyses. Location filtering so that all remaining data points would be within the city limits. For postcodes, this may be done using the outer parts of the postcode. For coordinates, this may be done either after
matching each coordinate with a postcode in the same way, or manually using the QGIS software28
by deleting all data points visibly outside of the city boundaries. Additional analysis of overlap may then be performed excluding postcodes starting with the correct letter but followed by high numbers (e.g. CV21+). Classification of variables into consistent categories across datasets. Removal of missing data and duplicates where necessary.
Data processing and analysis may be done in Microsoft Excel or Access, or other statistical software packages such as SPSS, Stata or R.
28 QGIS homepage (2017).
RAND Europe
28
4. How might ambulance data be used for violence prevention?
In this section, the guidance outlines potential analyses of ambulance data and the ways in which they can be used to support violence-reduction initiatives. As noted at the outset, this guidance represents available examples identified in discussion with practitioners and through a review of the existing literature. It is not intended to limit new and innovative uses of ambulance data for injury surveillance and violence-reduction initiatives. Where relevant, the guidance provides examples of analytic outputs – tables, maps and figures – that have been adapted from police and CSP reports. Rather than reproduce these directly, we have recreated them using a hypothetical dataset to avoid any issues related to the restricted nature of some analytic products.
4.1. Example analysis steps
There are obviously many ways to analyse a given dataset and this will be question/task specific. In what follows we set out three example analyses conducted using WMAS data. Analyses were undertaken in three steps: geographical analysis, analysis of frequencies and analysis of overlap.
The geographical analysis consists principally of data visualisation using the QGIS software. Analysis of frequencies then looked separately at the three sites (Birmingham, Wolverhampton and Coventry) as well as individual postcodes (or groups of postcodes) and showed the number of violent incidents across the following dimensions: time (day of week, time of day, month and year), location, type of incident, type of weapon used, severity of injuries and characteristics of the injured individuals. The number of incidents per location may then be used in identification of so-called ‘hot postcodes’ reported in the CAD dataset instead of in the police dataset within the same time period.
The analysis of overlap may be done in two ways: using postcode referencing and spatial nets (‘as the
crow flies’ distance matching).29 The matching variables consist of time, location and number ofobservations, but differed across iterations of the analysis:
• Time matching: Incidents that happened within the same 1-, 2- or 3-hour periods may beconsidered ‘matched’. Longer time periods – up to 24 hours either side of the incident – donot yield improved results and lead to increased probability of matching unrelated incidents.
29 Both analyses were done in Stata 13 using the ‘merge 1:1’ command, which looks for matching pairs of data in two specified datasets and records whether any data point in either of the two datasets was matched or not.
Using ambulance data to inform violence prevention
29
Additionally, look for incidents that happened at the same time but on the previous or next day (if not matched on the same day). This is because an incident in one dataset on Monday at 11.59 p.m. might appear in another as 12.01 a.m. on Tuesday.
• Number of observations: In both the police and CAD datasets, each incident is recordedseparately. In some cases, there may be more than one incident per specified timeframe andarea within a dataset; each of these may be assigned a unique identifier so that if there weremore matching cases in one dataset than in the other one, only the correct proportion wouldbe matched. In other words, for an incident A from the CAD dataset we may find twomatching incidents in the police dataset. Hence, one is considered matching and the otherone is not. If then another incident B appeared in the CAD dataset nearly at the same timeand place as A, the previously matched incident (to A) in the police dataset would no longerbe considered available for this matching.
• Distance matching: Incidents within the same postcode or within 30 m x 30 m, 100 m x100 m, and 200 m x 200 m spatial nets may be considered matched. Note that the 200 m x200 m areas are relatively large and may cover multiple postcodes particularly in denselypopulated areas. This is depicted in Figure 2, which shows an example of a 200 m x 200 marea in the Wolverhampton city centre. We can see that this particular cell in the spatial netcovers 20 individual postcodes so is too large to be useful.
Depending on the choice of geographical and time windows, any two records that happened at the same time and place (i.e. within the same spatial and time window) may be considered ‘matched’. Given that the police dataset should, in principle, contain all reported cases of assault, the matching should be done in one direction only, looking for cases in the police dataset matching those in the CAD dataset.
4.2. Analysis based on incident frequency, time, location and victim characteristics
4.2.1. Comparison of volumes between police, ambulance and ED data
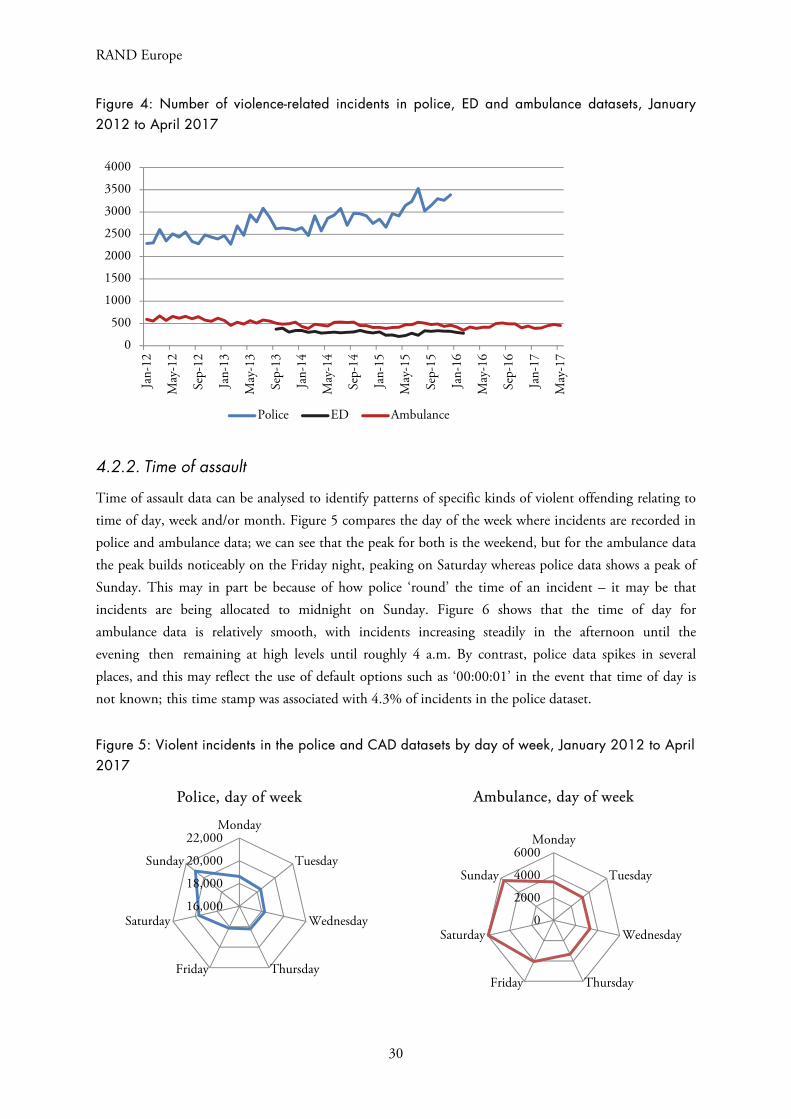
A very basic form of analysis is to compare the frequency of incidents across datasets over time. This allows for a quick comparison and ‘sense check’ of consistencies/inconsistencies in trends. Figure 4 illustrates this point in the West Midlands. Although there are large differences in the incident counts between police, ambulance and ED data, we can see that the police data trend is markedly upwards, whereas ambulance data suggests a slight decrease over time.
Another example of analysis might be to compare police and ambulance data for a specific location where police action has taken place so that there is an independent source of data to assess effectiveness of a crime prevention initiative. The real strength of this is that ambulance data is not affected by changes to counting rules that affect policing data.
RAND Europe
30
Figure 4: Number of violence-related incidents in police, ED and ambulance datasets, January 2012 to April 2017
4.2.2. Time of assault
Time of assault data can be analysed to identify patterns of specific kinds of violent offending relating to time of day, week and/or month. Figure 5 compares the day of the week where incidents are recorded in police and ambulance data; we can see that the peak for both is the weekend, but for the ambulance data the peak builds noticeably on the Friday night, peaking on Saturday whereas police data shows a peak of Sunday. This may in part be because of how police ‘round’ the time of an incident – it may be that incidents are being allocated to midnight on Sunday. Figure 6 shows that the time of day for ambulance data is relatively smooth, with incidents increasing steadily in the afternoon until the evening then remaining at high levels until roughly 4 a.m. By contrast, police data spikes in several places, and this may reflect the use of default options such as ‘00:00:01’ in the event that time of day is not known; this time stamp was associated with 4.3% of incidents in the police dataset.
Figure 5: Violent incidents in the police and CAD datasets by day of week, January 2012 to April 2017
0
500
1000
1500
2000
2500
3000
3500
4000Ja
n-12
May
-12
Sep-
12
Jan-
13
May
-13
Sep-
13
Jan-
14
May
-14
Sep-
14
Jan-
15
May
-15
Sep-
15
Jan-
16
May
-16
Sep-
16
Jan-
17
May
-17
Police ED Ambulance
16,000
18,000
20,000
22,000Monday
Tuesday
Wednesday
ThursdayFriday
Saturday
Sunday
Police, day of week
0
2000
4000
6000Monday
Tuesday
Wednesday
ThursdayFriday
Saturday
Sunday
Ambulance, day of week
Using ambulance data to inform violence prevention
31
Figure 6: Violent incidents in the police and CAD datasets by time of day (share of all incidents), January 2012 to April 2017
4.2.3. Injury severity and incident type
Ambulance data also captures data on severity and type of incident, but these classifications are quite different from police data. Figure 7 shows the different proportions of incidents according to whether they were a gunshot, stabbing or another type of assault. There should be a consistent tally between datasets in terms of the frequency of gunshot incidents owing to reporting requirements relating to this type of incident (i.e. ambulance services should report if treating a gunshot wound).
Figure 7: Type of offence in the CAD dataset, April 2016 to March 2017
0%10%20%30%40%50%60%70%80%90%100%
Assault Gunshot StabbingType of offence
0%
2%
4%
6%
8%0
12
34
5
6
7
89
1011
1213
1415
16
17
18
19
2021
2223
Ambulance, time of day
Ambulance
0%2%4%6%8%
10%0
12
34
5
6
7
89
1011
1213
1415
16
17
18
19
2021
2223
Police, time of day
Police
32
RAND Europe
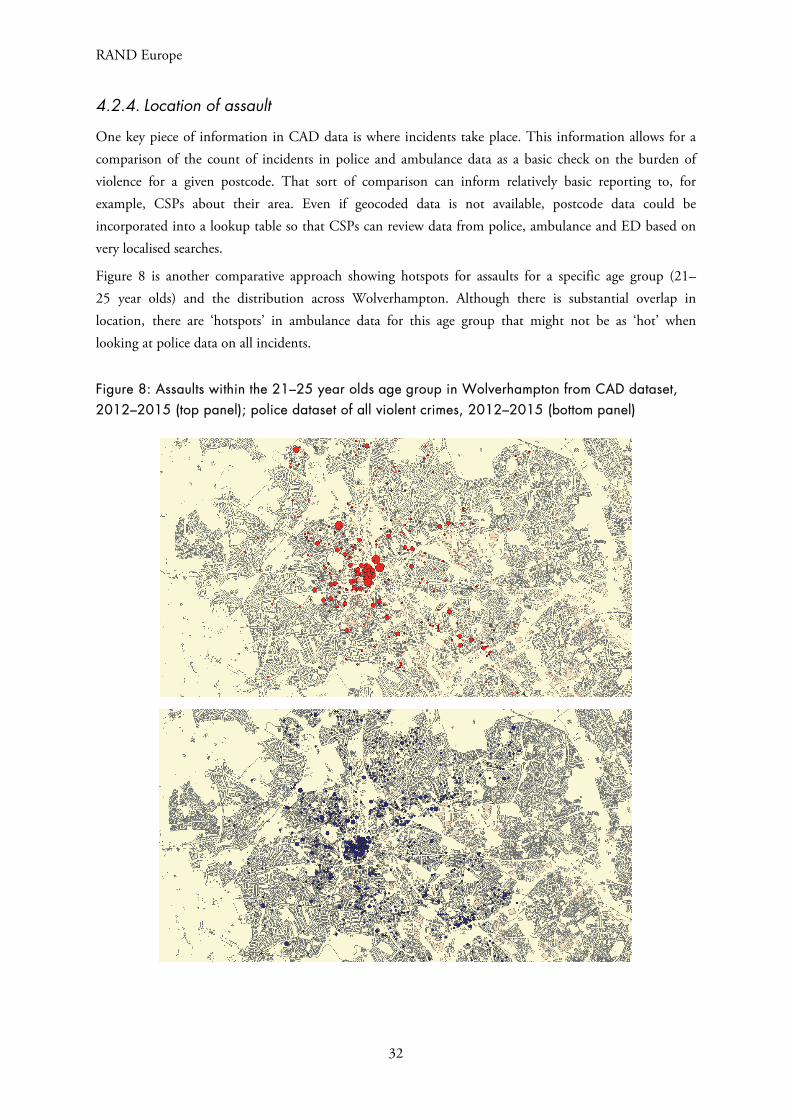
4.2.4. Location of assault
One key piece of information in CAD data is where incidents take place. This information allows for a comparison of the count of incidents in police and ambulance data as a basic check on the burden of violence for a given postcode. That sort of comparison can inform relatively basic reporting to, for example, CSPs about their area. Even if geocoded data is not available, postcode data could be incorporated into a lookup table so that CSPs can review data from police, ambulance and ED based on very localised searches.
Figure 8 is another comparative approach showing hotspots for assaults for a specific age group (21–25 year olds) and the distribution across Wolverhampton. Although there is substantial overlap in location, there are ‘hotspots’ in ambulance data for this age group that might not be as ‘hot’ when looking at police data on all incidents.
Figure 8: Assaults within the 21–25 year olds age group in Wolverhampton from CAD dataset, 2012–2015 (top panel); police dataset of all violent crimes, 2012–2015 (bottom panel)
Using ambulance data to inform violence prevention
33
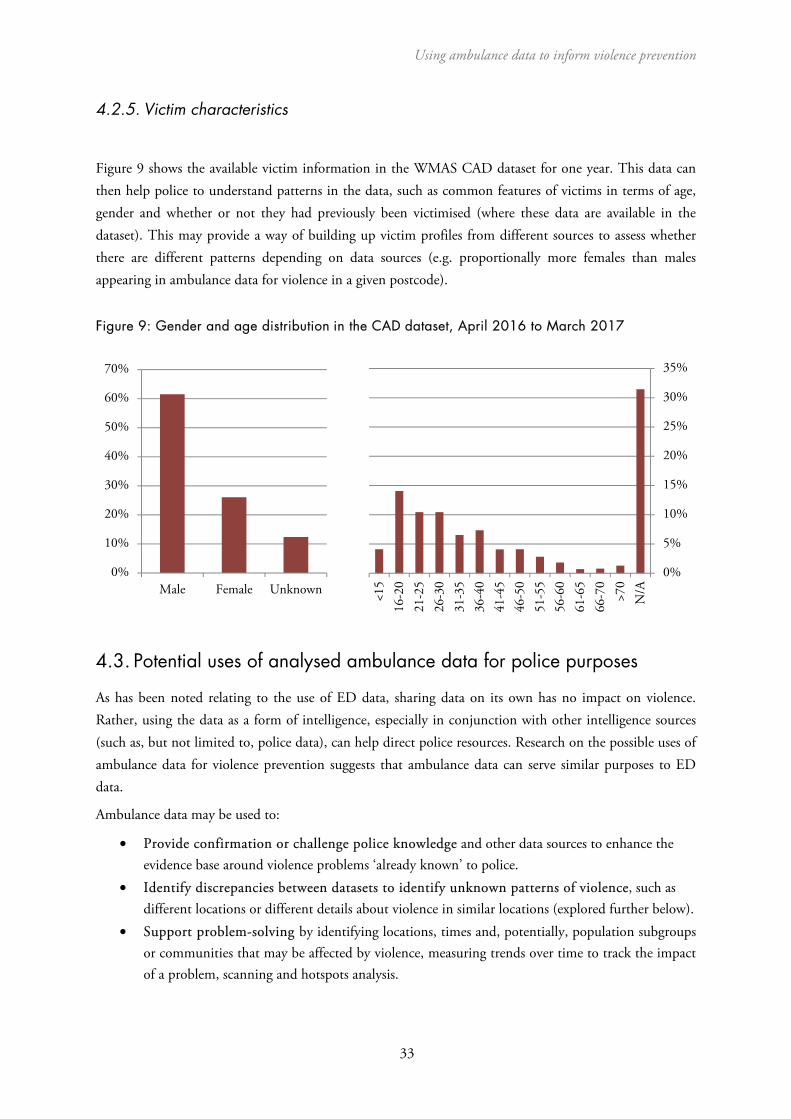
4.2.5. Victim characteristics
Figure 9 shows the available victim information in the WMAS CAD dataset for one year. This data can then help police to understand patterns in the data, such as common features of victims in terms of age, gender and whether or not they had previously been victimised (where these data are available in the dataset). This may provide a way of building up victim profiles from different sources to assess whether there are different patterns depending on data sources (e.g. proportionally more females than males appearing in ambulance data for violence in a given postcode).
Figure 9: Gender and age distribution in the CAD dataset, April 2016 to March 2017
4.3. Potential uses of analysed ambulance data for police purposes
As has been noted relating to the use of ED data, sharing data on its own has no impact on violence. Rather, using the data as a form of intelligence, especially in conjunction with other intelligence sources (such as, but not limited to, police data), can help direct police resources. Research on the possible uses of ambulance data for violence prevention suggests that ambulance data can serve similar purposes to ED data.
Ambulance data may be used to:
• Provide confirmation or challenge police knowledge and other data sources to enhance theevidence base around violence problems ‘already known’ to police.
• Identify discrepancies between datasets to identify unknown patterns of violence, such asdifferent locations or different details about violence in similar locations (explored further below).
• Support problem-solving by identifying locations, times and, potentially, population subgroupsor communities that may be affected by violence, measuring trends over time to track the impactof a problem, scanning and hotspots analysis.
0%
5%
10%
15%
20%
25%
30%
35%<1
516
-20
21-2
526
-30
31-3
536
-40
41-4
546
-50
51-5
556
-60
61-6
566
-70
>70
N/A
0%
10%
20%
30%
40%
50%
60%
70%
Male Female Unknown
RAND Europe
34
• Support deployments and resourcing of emergency services through helping to identify placesand times where levels of violence are highest.
• Support evaluation of police strategies and violence reduction initiatives, as an additional metricof violence levels in an area.
• Identify unknown cases of youth or gang-related violence where injury severity is low (thusnot warranting subsequent attendance at an ED), but where similar incidents are geographicallyconcentrated, perhaps indicating an ongoing rivalry or contested territory.
• Act as a form of soft intelligence that then requires police or other community safety partnersto ‘take a look’ at the area, time or population where problems are identified.
Other agencies, such as clinical commissioning groups, city councils and environmental health teams, may also use ambulance data to support planning and initiatives, for example in developing Joint Strategic Needs Assessments (JSNAs). While these other possible uses are referenced where appropriate, the primary focus of this section is on the ways in which police officers and analysts can directly use these data for violence prevention.
The analyses that appear appropriate are very similar to those for ED data, for example:
• Geospatial analyses (e.g. hotspots and heatmaps)
• Time-of-day and time-of-year analyses to identify trends
• Analyses around gender and age of victims of different types of violence, and severity ofinjuries from those (especially previously unknown) cases of violence
• Examining overlap with police data as a proxy for ‘unknown’ violence in an area.
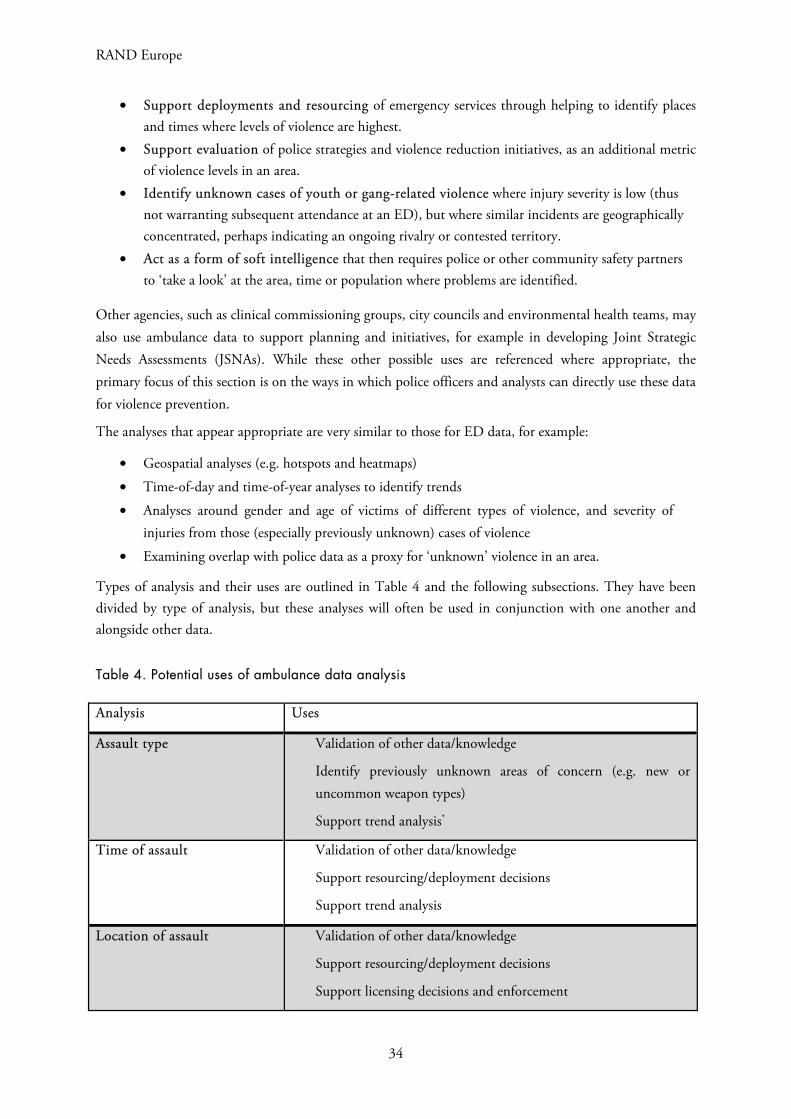
Types of analysis and their uses are outlined in Table 4 and the following subsections. They have been divided by type of analysis, but these analyses will often be used in conjunction with one another and alongside other data.
Table 4. Potential uses of ambulance data analysis
Analysis Uses
Assault type Validation of other data/knowledge
Identify previously unknown areas of concern (e.g. new or uncommon weapon types)
Support trend analysis*
Time of assault Validation of other data/knowledge
Support resourcing/deployment decisions
Support trend analysis
Location of assault Validation of other data/knowledge
Support resourcing/deployment decisions
Support licensing decisions and enforcement
Using ambulance data to inform violence prevention
35
Support trend analysis
Victim characteristics Validation of other data/knowledge
Support social marketing campaigns
Support trend analysis
*While ambulance data can support existing police data to make more informed trend analyses, they should not beviewed in isolation.
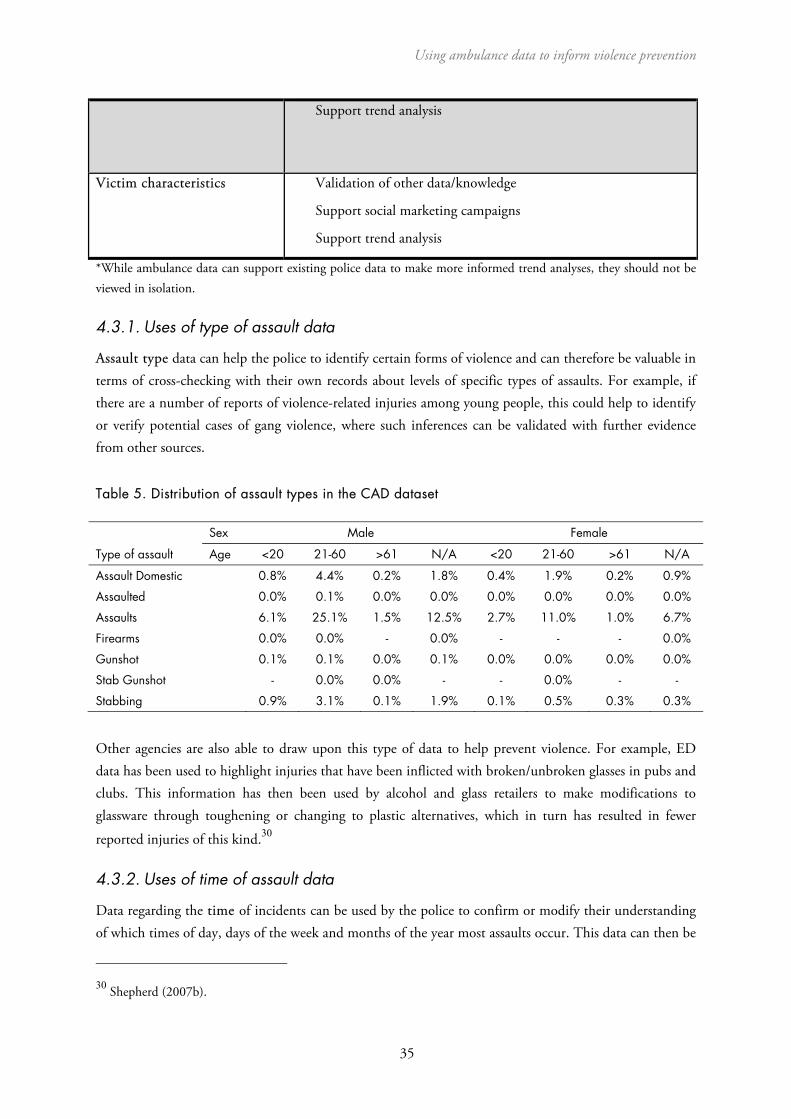
4.3.1. Uses of type of assault data
Assault type data can help the police to identify certain forms of violence and can therefore be valuable in terms of cross-checking with their own records about levels of specific types of assaults. For example, if there are a number of reports of violence-related injuries among young people, this could help to identify or verify potential cases of gang violence, where such inferences can be validated with further evidence from other sources.
Table 5. Distribution of assault types in the CAD dataset
Type of assault
Sex Male Female
Age <20 21-60 >61 N/A <20 21-60 >61 N/A
Assault Domestic 0.8% 4.4% 0.2% 1.8% 0.4% 1.9% 0.2% 0.9%
Assaulted 0.0% 0.1% 0.0% 0.0% 0.0% 0.0% 0.0% 0.0%
Assaults 6.1% 25.1% 1.5% 12.5% 2.7% 11.0% 1.0% 6.7%
Firearms 0.0% 0.0% - 0.0% - - - 0.0%
Gunshot 0.1% 0.1% 0.0% 0.1% 0.0% 0.0% 0.0% 0.0%
Stab Gunshot - 0.0% 0.0% - - 0.0% - -
Stabbing 0.9% 3.1% 0.1% 1.9% 0.1% 0.5% 0.3% 0.3%
Other agencies are also able to draw upon this type of data to help prevent violence. For example, ED data has been used to highlight injuries that have been inflicted with broken/unbroken glasses in pubs and clubs. This information has then been used by alcohol and glass retailers to make modifications to glassware through toughening or changing to plastic alternatives, which in turn has resulted in fewer
reported injuries of this kind.30
4.3.2. Uses of time of assault data
Data regarding the time of incidents can be used by the police to confirm or modify their understanding of which times of day, days of the week and months of the year most assaults occur. This data can then be
30 Shepherd (2007b).
RAND Europe
36
matched against, for example, holiday periods or other regular events, to identify the dates and times with the highest risks of assaults, which can be used to justify or alter resourcing decisions or can be used in
combination with location data to target patrols.31 For example, ambulance data may also be helpful inplanning for emergency responses to major sporting events. ED data has been used to illustrate the impact
of, for example, England playing in the football World Cup on local demand for services.32
4.3.3. Uses of location data
Location data can be used to identify concentrations of assaults in specific locations, as shown in the example hotspots maps above. This can help to inform decisions around targeted policing. The value of mapping data can be enhanced by increasing the specificity of the analysis – down to exact locations where possible – as well as by combining them with time and other incident data to inform not only where but also when and how police resources may be best deployed. The more detailed the location data are, the better police can optimise resources against levels of risk.
4.4. Potential limitations of ambulance data
Ambulance data is strong on reliability, validity, completeness and comprehensiveness.33 However, there are a number of potential limitations with using this data. Therefore, while ambulance data may be usefully analysed to identify trends in violence, analysts and others using the data should always seek to triangulate trend analysis with, for example, police crime data and ED data before drawing conclusions about overall trends of assault.
A significant unanswered question is whether the ambulance pick-up location is the same or similar to the location of where the violent incident actually occurred. This question needs to be explored in future research activities, for example, through a case-by-case comparison of police and ambulance data where both are attending, or smaller-scale work comparing call-out data with video footage from 360-degree cameras some ambulance services have installed on ambulance vehicles to help monitor crews.
Another potential issue with using ambulance data relates to the granularity of the location data being requested for this project. The data required for this kind of injury surveillance – at a level that could potentially be of use to police to support violence prevention activities – needs to include full location data (i.e. with full postcode or GPS coordinates), but can be otherwise anonymous. However, ambulance services may have concerns about patient identifiability and propose sharing data at a higher level of detail such as ‘postcode sector’ level (i.e. first half of the postcode plus one character). This level of data would not provide enough information for violence prevention interventions because postcode sectors cover many thousands of houses, meaning, for example, that police operations cannot be sufficiently well targeted.
31 Quigg et al. (2017). 32 Quigg et al. (2013). 33 For detailed discussion on the quality of ambulance data, see Sutherland et al. (2017).
Using ambulance data to inform violence prevention
37
It is also worth reflecting on how limitations to current data share in the West Midlands may prevent other types of action. One crucial element of how ED data has been used in the past is for licencing enforcement action. This was facilitated through the inclusion of premises names in the standard question set (and latterly in ISTV data). In this project, ambulance data currently being shared includes postcodes, but not names of premises. This means incidents can be related to an area rather than a specific premises, limiting the enforcement capability of licencing officers and CSPs. However, the additional data would allow for approaches on specific locations that may encompass several premises.
A particular set of limitations relates to categorisation and (re)classification of variables across and within the used datasets. These include potential errors introduced through comparison of incidents in the police dataset, which contains precise geographical information, and the CAD dataset, where each incident was only assigned a postcode. When looking for overlaps in the datasets using geospatial nets (i.e. looking for relevant incidents in the other dataset that happened within a given timeframe and close proximity to a given incident), assigning incident location to a centre of a postcode may move the boundary of the spatial net by a number of metres, which can lead both to the exclusion of relevant incidents in the other dataset, as well as the inclusion of other, unrelated incidents. Further, the algorithm searched for relevant incidents that would occur within a given timeframe (1, 2, 3 or 12 hours) before and after the precise recorded time of the incident.
Advice on case matching and dark figure analysis
Many of the kinds of analyses that can be conducted using ambulance data can also be conducted on police recorded crime data relating to assault. As such, ambulance data may be suitable for some direct comparisons with police data. This type of analysis can provide an indication of the levels of unreported violent crime in an area (the dark figure) and may also help analysts understand the differences between crimes that are reported and crimes that go unreported (e.g. differences in types of crime, areas where crimes take place or victim characteristics). This may point usefully to blind spots in police knowledge of violence in an area, or alternatively validate what is already known about local violent offending.
At a very basic level, it is possible to count up the number of assaults in a given neighbourhood using both sources of data and assess the difference between them. However, this does not inform analysts about which crimes are actually recorded in both sets of data, so the extent of overlap (or lack of overlap) cannot be assessed. To do this, more detailed data, normally including some non-anonymous data such as victim postcode or name, as well as the time of the incident, are required. With this information it is then possible to match police data with ambulance data to understand which specific assaults have been reported to police and which were previously unknown. However, the time and effort involved in this type of exercise may be considerable, particularly in high-volume crime areas, and may be more usefully conducted on an annual basis as a benchmarking exercise.
There is certainly value in case matching and dark figure analysis, since if ambulance data can identify any unknown violence, they can assist police in addressing it. However, it will be important for those using these data to ensure appropriate understanding of them among relevant partners, in particular to reinforce the notion that they should be treated as complementary to other available data and used alongside local police knowledge about violence in their area.
RAND Europe
38
5. Summary
Ambulance data is a source of intelligence for injury surveillance that may be effective in supporting violence-reduction initiatives. As noted at a number of points throughout the guidance, the collection of ambulance data is only a first step in violence reduction. Once a data sharing partnership has been established, the data then need to be used to identify areas for intervention and support the police in reducing violence. This requires not only good analysis of the data, but also an understanding among relevant partners about how the data can be used and interpreted.
This guidance has outlined some of the potential uses of ambulance data to support violence-reduction initiatives, such as: providing confirmation or challenging police knowledge and other data sources to enhance the evidence base around violence problems ‘already known’ to police; identifying discrepancies between datasets to identify unknown patterns of violence, such as different locations, or different details about violence in similar locations; and supporting problem solving by identifying locations, times and potentially population subgroups or communities that may be affected by violence, measuring trends over time to track the impact of a problem, scanning and hotspots analysis.
Ambulance data could also potentially be used to support deployments and resourcing of emergency services through helping to identify places and times where levels of violence are highest; support evaluation of police strategies and violence reduction initiatives, as an additional metric of violence levels in an area; and identify unknown cases of youth or gang-related violence where injury severity is low (thus not warranting subsequent attendance at an ED), but where similar incidents are geographically concentrated, perhaps indicating an ongoing rivalry or contested territory.
It is important to stress that many of the suggested interventions related to these uses have not been empirically tested to know if they are effective. Therefore, uses of ambulance data should be approached as potentially good practice rather than as proven best practice. Where these initiatives are implemented, their outcomes should be tracked and recorded to build an evidence base. Where the use of ambulance data can be linked to a reduction in violence in an area, this success should be communicated to the staff providing the data – to encourage their continued support of the partnership – as well as to the broader community of practitioners making use of these data through channels such as the College of Policing.
39
References
Ariel, B., Weinborn, C., & Boyle, A. 2015. ‘Can routinely collected ambulance data about assaults contribute to reduction in community violence?’ Emergency Medicine Journal 32: 308–13.
Ariel, B., & Partridge, H. 2016. ‘Predictable Policing: Measuring the Crime Control Benefits of Hotspots Policing at Bus Stops.’ Journal of Quantitative Criminology 33(4): 809–33. doi: http://dx.doi.org/10.1007/s10940-016-9312-y
Boyle, A., Kirkbride, J. & Jones, P. 2005. ‘Record linkage of domestic assault victims between an emergency department and the police.’ Journal of Epidemiology & Community Health 59: 909–910.
General Medical Council. 2017. ‘Confidentiality: reporting gunshot and knife wounds.’ GMC. 25 April 2017. As of 15 November 2017: https://www.gmc-uk.org/guidance/ethical_guidance/30677.asp
Giacomantonio, C., Sutherland, A., Boyle, A., Shepherd, J., Kruithof, K., & Davies, M. 2014. Injury Surveillance: Using A&E Data for Crime Reduction – Guidance for Police Analysts and Practitioners. Ryton-on-Dunsmore: College of Policing.
Holder, Y., Peden, M., Krug, E., Lund, J., Gururaj, G., & Kobusingye, O. 2001. Injury Surveillance Guidelines. Geneva: World Health Organization.
Ibbotson, S. 2015. ‘Preventing the disease of violence.’ Public Health England, 2 July 2005. As of 2 November 2017: https://publichealthmatters.blog.gov.uk/2015/07/02/preventing-the-disease-of-violence/
POLKA (Police OnLine Knowledge Area) (homepage). 2017. As of 15 November 2017: http://www.college.police.uk/What-we-do/Research/polka/Pages/POLKA.aspx
Postcodes.io (homepage). 2017. As of 3 November 2017: https://postcodes.io/
Public Health England. 2015. ‘Violence prevention partnership launched for West Midlands.’ PHE West Midlands press office, 26 June 2015. As of 2 November 2017: https://www.gov.uk/government/news/violence-prevention-partnership-launched-for-west-midlands
QGIS (homepage). 2017. As of 7 November 2017: http://www.qgis.org/en/site/
Quigg, Z., Hughes, K., & Bellis, M.A. 2011. ‘Data sharing for prevention: a case study in the development of a comprehensive emergency department injury surveillance system and its use in preventing violence and alcohol-related harms’. Inj Prev 18(5): 315–20. doi: 10.1136/injuryprev-2011-040159
RAND Europe
40
Quigg, Z., Hughes, K., & Bellis, M.A. 2013. ‘Effects of the 2010 World Cup football tournament on emergency department assault attendances in England.’ European Journal of Public Health 23(3): 383–5. doi: https://doi.org/10.1093/eurpub/cks098
Quigg, Z., McGee, C., Hughes, K., Russell, S., & Bellis, M.A. 2017. ‘Violence-related ambulance call-outs in the North West of England: a cross-sectional analysis of nature, extent and relationships to temporal, celebratory and sporting events.’ Emergency Medicine Journal 34(6): 364–9.
Shepherd, J., & Lisles, C. 1998. ‘Towards multi-agency violence prevention and victim support: an investigation of police-accident and emergency service liaison.’ The British Journal of Criminology 38(3): 351-70.
Shepherd, J. 2007a. Effective NHS contributions to violence prevention: the Cardiff Model. Cardiff: Cardiff University.
Shepherd, J. 2007b. ‘Preventing alcohol-related violence: a public health approach.’ Criminal Behaviour and Mental Health 17: 250-64. doi: 10.1002/cbm
Sutherland, A., Strang, L. Stepanek, M., Giacomantonio, C. & Boyle, A. 2017. Using Ambulance Data for Violence Prevention: Technical Report. Santa Monica, Calif.: RAND Corporation. RR-2216-WMP. As of 15 November 2017: https://www.rand.org/pubs/research_reports/RR2216.html.
Trauma and Injury Intelligence Group (homepage). 2017. As of 2 November 2017: http://www.cph.org.uk/tiig/
UK Grid Reference Finder (homepage). 2017. As of 3 November 2017: https://gridreferencefinder.com/
Warburton, A.L., & Shepherd, J.P. 2004. ‘Development, utilisation, and importance of accident and emergency department derived assault data in violence management.’ Emerg. Med. J. 21: 473-7.
West Midlands Violence Prevention Alliance (homepage). 2017. As of 2 November 2017: http://www.violencepreventionalliance.org/
WHO. 2014. ‘Review article: Emergency department data sharing to reduce alcohol-related violence: A systematic review of the feasibility and effectiveness of community-level interventions.’ Emergency Medicine Australasia. doi: 10.1111/1742-6723.12247
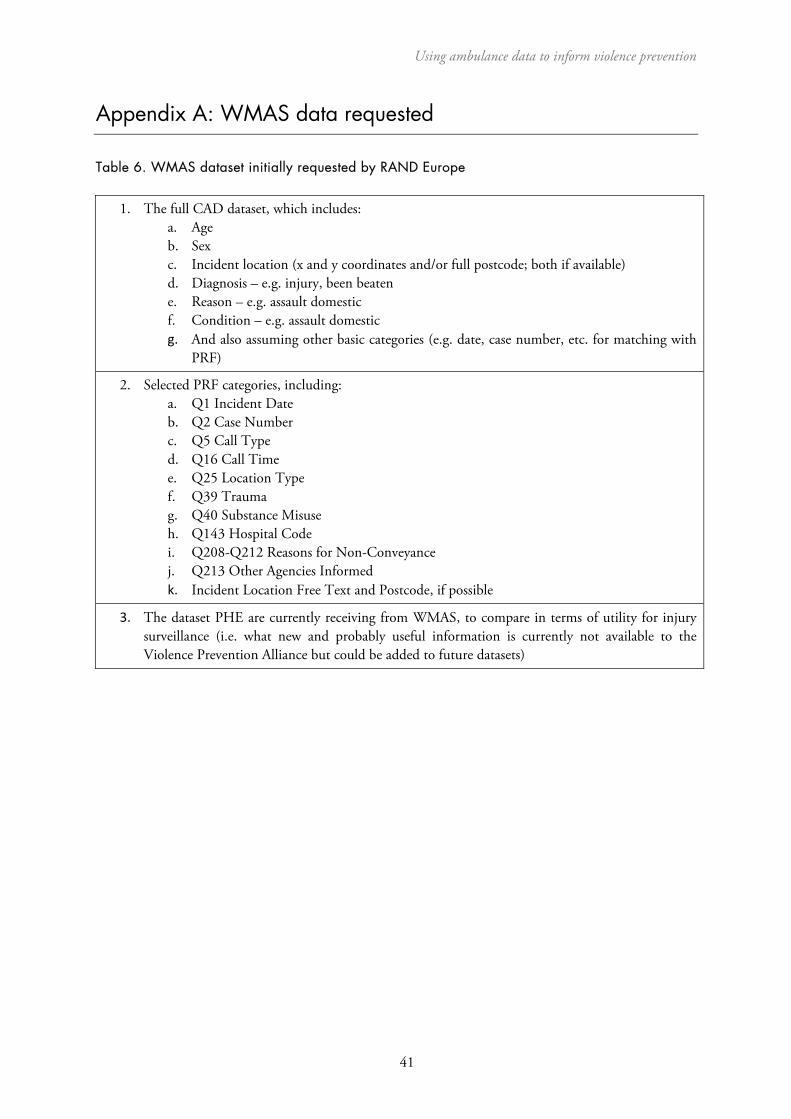
Using ambulance data to inform violence prevention
41
Appendix A: WMAS data requested
Table 6. WMAS dataset initially requested by RAND Europe
1. The full CAD dataset, which includes:a. Ageb. Sexc. Incident location (x and y coordinates and/or full postcode; both if available)d. Diagnosis – e.g. injury, been beatene. Reason – e.g. assault domesticf. Condition – e.g. assault domesticg. And also assuming other basic categories (e.g. date, case number, etc. for matching with
PRF)
2. Selected PRF categories, including:a. Q1 Incident Dateb. Q2 Case Numberc. Q5 Call Typed. Q16 Call Timee. Q25 Location Typef. Q39 Traumag. Q40 Substance Misuseh. Q143 Hospital Codei. Q208-Q212 Reasons for Non-Conveyancej. Q213 Other Agencies Informedk. Incident Location Free Text and Postcode, if possible
3. The dataset PHE are currently receiving from WMAS, to compare in terms of utility for injurysurveillance (i.e. what new and probably useful information is currently not available to theViolence Prevention Alliance but could be added to future datasets)
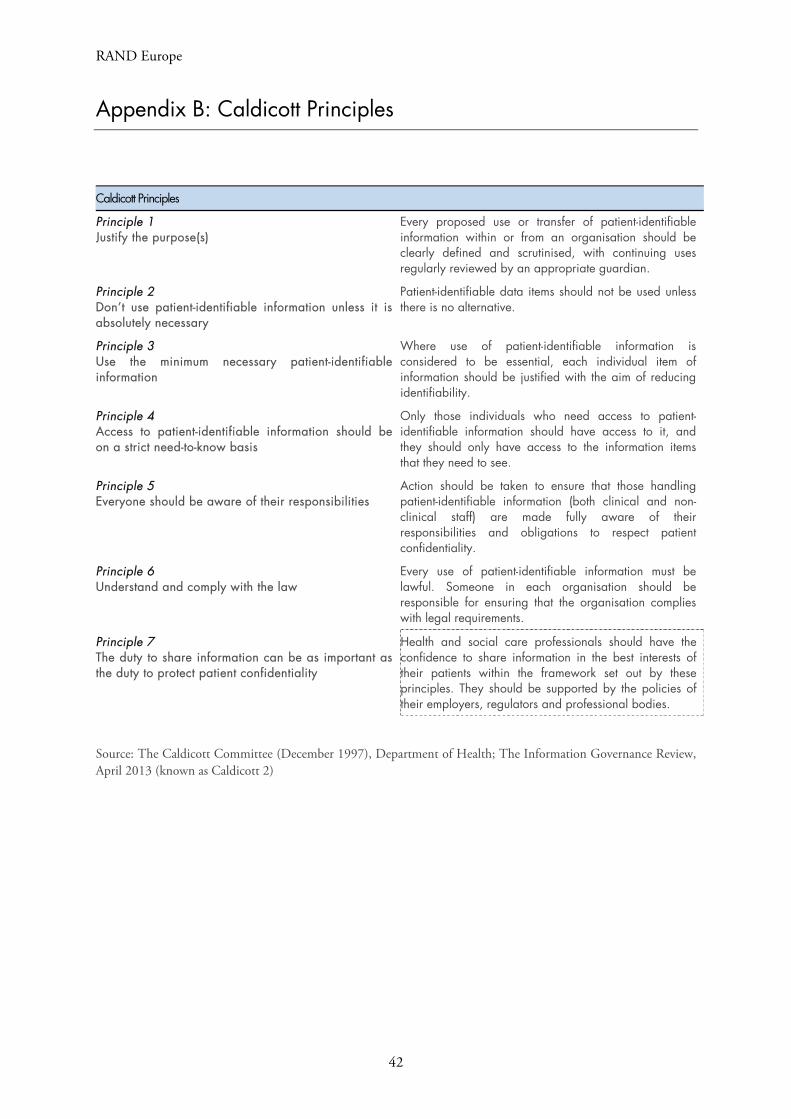
RAND Europe
42
Appendix B: Caldicott Principles
Caldicott Principles
Principle 1 Justify the purpose(s)
Every proposed use or transfer of patient-identifiable information within or from an organisation should be clearly defined and scrutinised, with continuing uses regularly reviewed by an appropriate guardian.
Principle 2 Don’t use patient-identifiable information unless it is absolutely necessary
Patient-identifiable data items should not be used unless there is no alternative.
Principle 3 Use the minimum necessary patient-identifiable information
Where use of patient-identifiable information is considered to be essential, each individual item of information should be justified with the aim of reducing identifiability.
Principle 4 Access to patient-identifiable information should be on a strict need-to-know basis
Only those individuals who need access to patient-identifiable information should have access to it, and they should only have access to the information items that they need to see.
Principle 5 Everyone should be aware of their responsibilities
Action should be taken to ensure that those handling patient-identifiable information (both clinical and non-clinical staff) are made fully aware of their responsibilities and obligations to respect patient confidentiality.
Principle 6 Understand and comply with the law
Every use of patient-identifiable information must be lawful. Someone in each organisation should be responsible for ensuring that the organisation complies with legal requirements.
Principle 7 The duty to share information can be as important as the duty to protect patient confidentiality
Health and social care professionals should have the confidence to share information in the best interests of their patients within the framework set out by these principles. They should be supported by the policies of their employers, regulators and professional bodies.
Source: The Caldicott Committee (December 1997), Department of Health; The Information Governance Review, April 2013 (known as Caldicott 2)
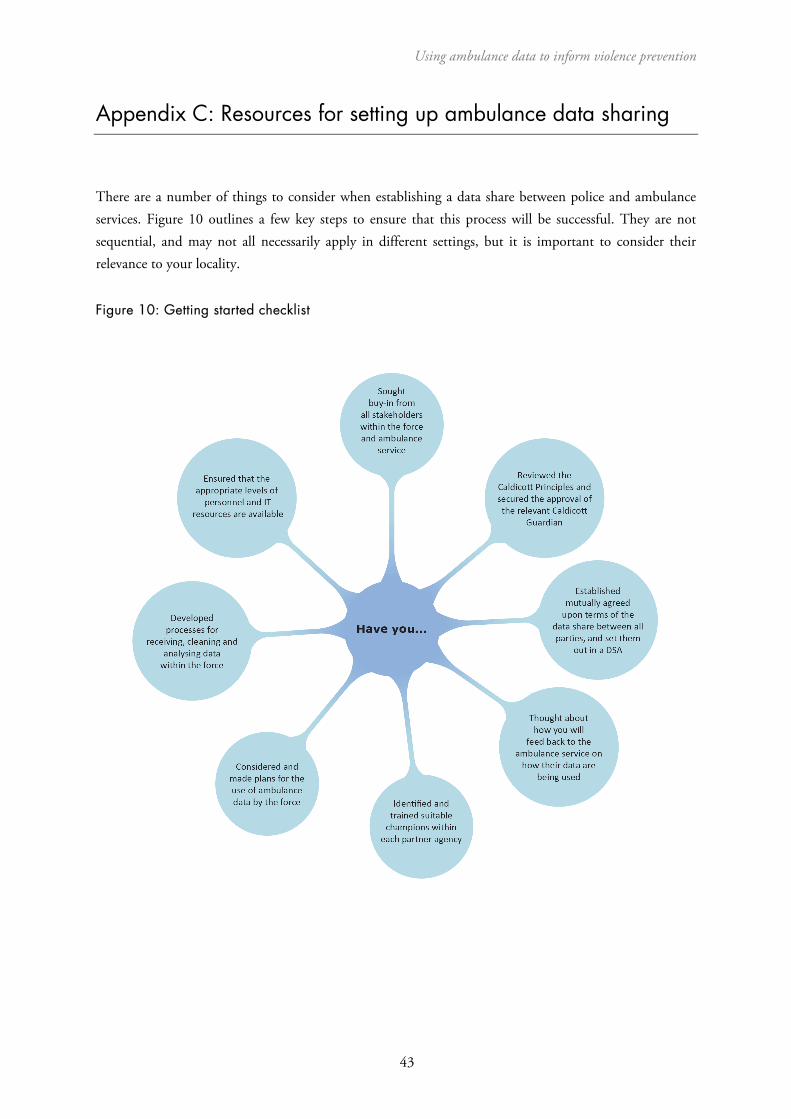
Using ambulance data to inform violence prevention
43
Appendix C: Resources for setting up ambulance data sharing
There are a number of things to consider when establishing a data share between police and ambulance services. Figure 10 outlines a few key steps to ensure that this process will be successful. They are not sequential, and may not all necessarily apply in different settings, but it is important to consider their relevance to your locality.
Figure 10: Getting started checklist
RAND Europe
44
Appendix D: How to make using ambulance data easier
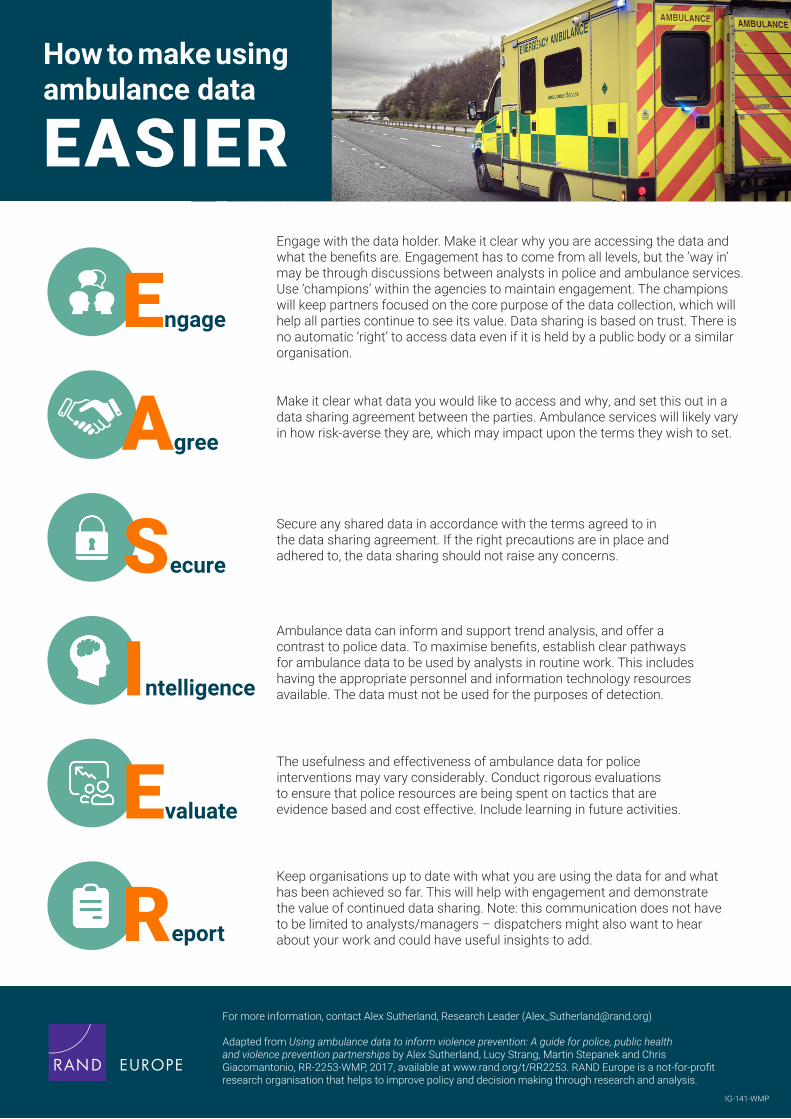
For more information, contact Alex Sutherland, Research Leader ([email protected])
Adapted from Using ambulance data to inform violence prevention: A guide for police, public health and violence prevention partnerships by Alex Sutherland, Lucy Strang, Martin Stepanek and Chris Giacomantonio, RR-2253-WMP, 2017, available at www.rand.org/t/RR2253. RAND Europe is a not-for-profit research organisation that helps to improve policy and decision making through research and analysis.
How to make using ambulance data
EASIEREngage with the data holder. Make it clear why you are accessing the data and what the benefits are. Engagement has to come from all levels, but the ‘way in’ may be through discussions between analysts in police and ambulance services. Use ‘champions’ within the agencies to maintain engagement. The champions will keep partners focused on the core purpose of the data collection, which will help all parties continue to see its value. Data sharing is based on trust. There is no automatic ‘right’ to access data even if it is held by a public body or a similar organisation.
Engage
Make it clear what data you would like to access and why, and set this out in a data sharing agreement between the parties. Ambulance services will likely vary in how risk-averse they are, which may impact upon the terms they wish to set.Agree
Secure any shared data in accordance with the terms agreed to in the data sharing agreement. If the right precautions are in place and adhered to, the data sharing should not raise any concerns.Secure
Ambulance data can inform and support trend analysis, and offer a contrast to police data. To maximise benefits, establish clear pathways for ambulance data to be used by analysts in routine work. This includes having the appropriate personnel and information technology resources available. The data must not be used for the purposes of detection.Intelligence
The usefulness and effectiveness of ambulance data for police interventions may vary considerably. Conduct rigorous evaluations to ensure that police resources are being spent on tactics that are evidence based and cost effective. Include learning in future activities.Evaluate
Keep organisations up to date with what you are using the data for and what has been achieved so far. This will help with engagement and demonstrate the value of continued data sharing. Note: this communication does not have to be limited to analysts/managers – dispatchers might also want to hear about your work and could have useful insights to add.Report
IG-141-WMP
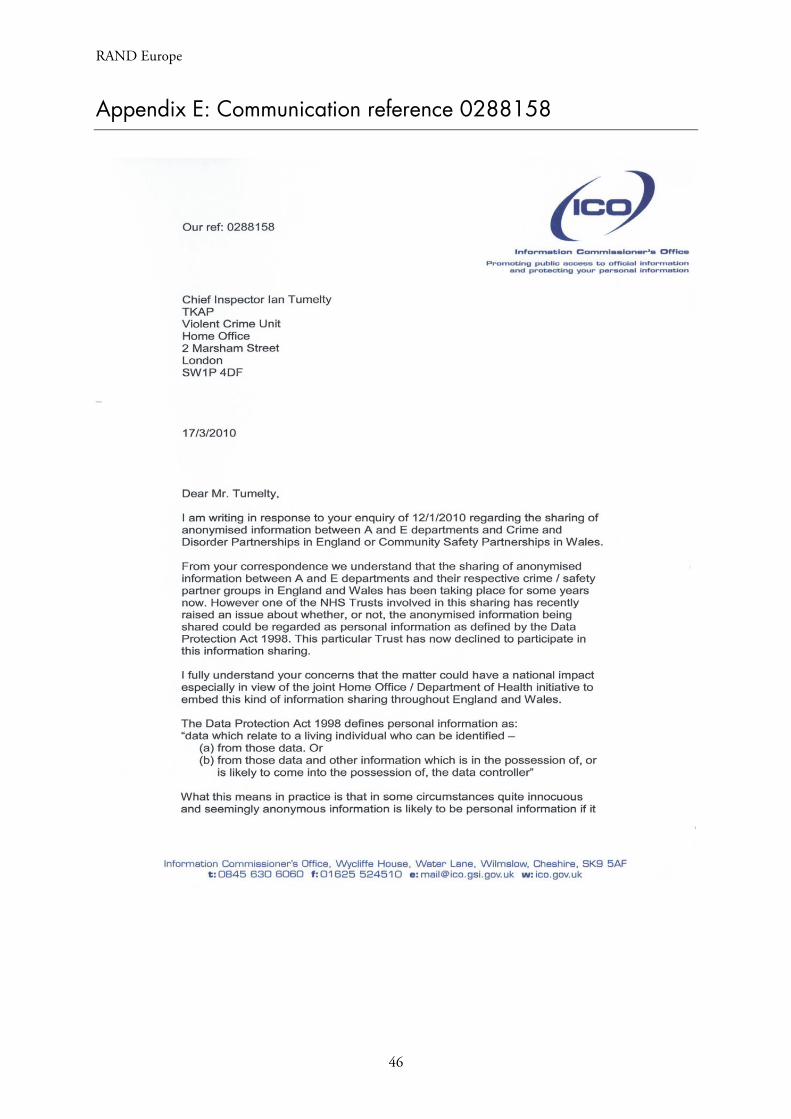
RAND Europe
46
Appendix E: Communication reference 0288158
Using ambulance data to inform violence prevention
47

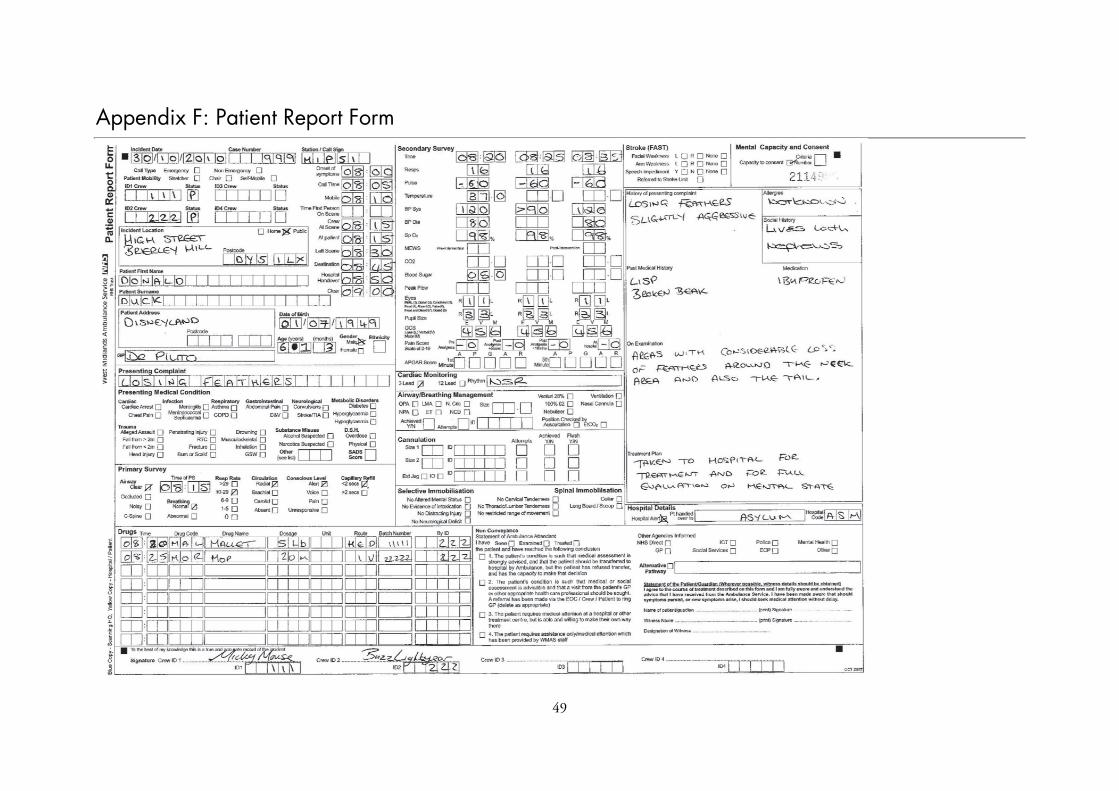
49
Appendix F: Patient Report Form


