Page 1
Using APSIM to Using APSIM to simulate crop-simulate crop-parasitic weed parasitic weed
interactionsinteractions
Plant Production and Plant Production and Agroecology of the Agroecology of the
Tropics and SubtropicsTropics and Subtropics
24.2.2005 – Dr. J. Grenz
contact: [email protected]
Page 2
Outline
•The Orobanche problem
•The Agricultural Production Systems Simulator
•Simulating Host-Parasite Interactions
•Applications of APSIM-Parasite
•Outlook
Page 3
O. cumanaO. crenata
O. minorO. ramosa / O. aegyptiaca
Economically important Orobanche species
The Orobanche problem - 1
Page 4
Orobanche crenata – crenate broomrape
• largest Orobanche species• common around the Mediterranean• mainly attacks Fabaceae, Apiaceae• yield losses from 5 to 100%
• individuals produce numerous highly persistent seeds
• yet no control method is sufficiently effective and practicableThe Orobanche problem -
2
Page 5
•Specificity: only attaches to potential hosts
•Destructivity: grows fully at expense of the host
•Fecundity: individuals can produce more than 200,000 seeds
•Longevity: seeds can remain viable in the soil for more than 10 years
•Mobility: tiny seeds adhere to machinery, seeds, animals, …
Aspects of the Orobanche Problem
The Orobanche problem - 3
Page 6
• Developed at the Agricultural Production Systems Research Unit, Toowoomba (Qld), Australia
APSIM simulates:• Growth and development of crops, pastures, trees, weeds• Key soil processes (water, N, P, carbon, pH)• Management options (tillage, sowing, irrigation,
fertilisation) • Surface residue dynamics• Soil erosion• Cropping systems• Rotations/fallowing/mixtures• Short or long term effects
The Agricultural Production Systems Simulator
APSIM - 1
more information @ www.apsru.gov.au
Page 7
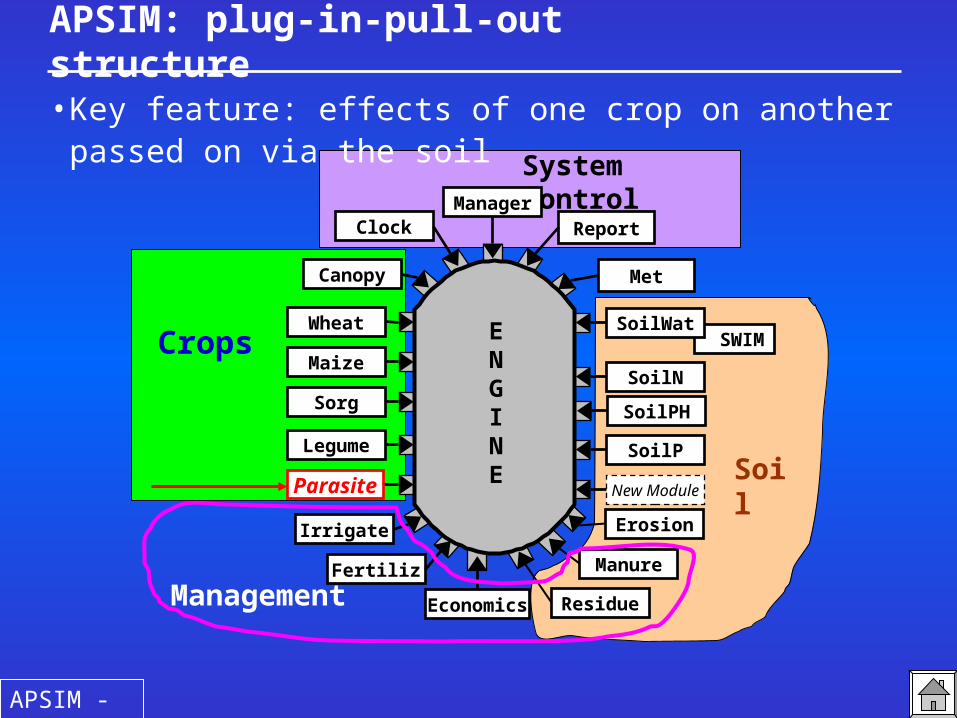
Crops
System Control
Soil
SWIM
ManagerReportClock
SoilWat
SoilN
SoilPH
SoilP
ResidueEconomics
Fertiliz
Irrigate
Canopy Met
Erosion
Maize
Sorg
Legume
Wheat
New Module
Manure
Management
ENGINEParasite
APSIM: plug-in-pull-out structure
APSIM - 2
•Key feature: effects of one crop on another passed on via the soil
Page 8
Quantifying faba bean – O. crenata interactions
• Experiments in Syria (1993-95)...
... and Turkey (2000-02)
Host-Parasite Interactions - 1
Page 9
DevelopmentGrowthFaba bean
Daily DM Production(PAR, Q, LUE, LAI)
DM Partitioning(Roots, Leaves, Stems,
Pods)
Senescence and Retranslocation
Rooting front, RLD, Senescence
Emergence
Pod setting
Seed filling
Physiological Maturity
Soil WaterDrainage, Evaporation,
Transpiration, Soil water content
Flowering
Leaves
Branches
Structure of the faba bean model
Host-Parasite Interactions - 2
Page 10
DevelopmentGrowth O. crenata
Assimilatepool
Pods
StemsRoots
Leaves
Bud
Tubercle
Shoot emergence
Host maturity
Potential growth rate of an
O. crenata plant (Temp. sum)
Total number of attachments (RLD, O. crenata seed density)
DM O. crenata
Faba bean emergence
Appressorium
Structure of the parasite model
Host-Parasite Interactions - 3
Page 11
The Cohorting Routine
11
Vegetative Crop Organs
Fruit Cohort Component
Physiological age
Parasite Module
Da
ily
pa
rasi
te c
oh
ort
s
Physiological age
1
2
3
34
PN = 8
. .
. .
. .
. .
. .
. .
. .
. .
. .
.
PN = 12
PN = 9
PN = 16
Da
ily f
ruit
co
ho
rts
1
2
12
. .. . . . . . . . .
FN = 60
FN = 28
FN = 12
CropModule
(biomasspool)
Physiological age
……
.
FN = 9
(I) (II)
(III)
(IV)
Leaf
Root
Stem
Host-Parasite Interactions - 4
Page 12
•Seed production = f (parasite biomass)
•Seed survival = f (soil moisture)•Vertical distribution = f (tillage)
Cropping System
Crop
Crop Hos
tCr
op
HostCrop
Crop
Crop
CropOrobanche soil seed bank
The seedbank model
Host-Parasite Interactions - 5
Page 13
Simulated (curves) and measured (points) leaf area index (LAI), shoot
(open circles) and pod biomass (closed circles) of faba bean grown
without Orobanche infestation in 1994-95; SD1 and SD2 indicate the
first (Nov. 7) and second (Dec. 12) sowing date, respectively.
Some calibration results
Host-Parasite Interactions - 6
Page 14
Crop phenology
Crop biomass
Crop yield
Parasite biomass
Some evaluation results
Host-Parasite Interactions - 7
Page 15
Single-season simulations
• faba bean cv. ILB 1814
• Weather records (1979-2000) from Adana and Tel Hadya
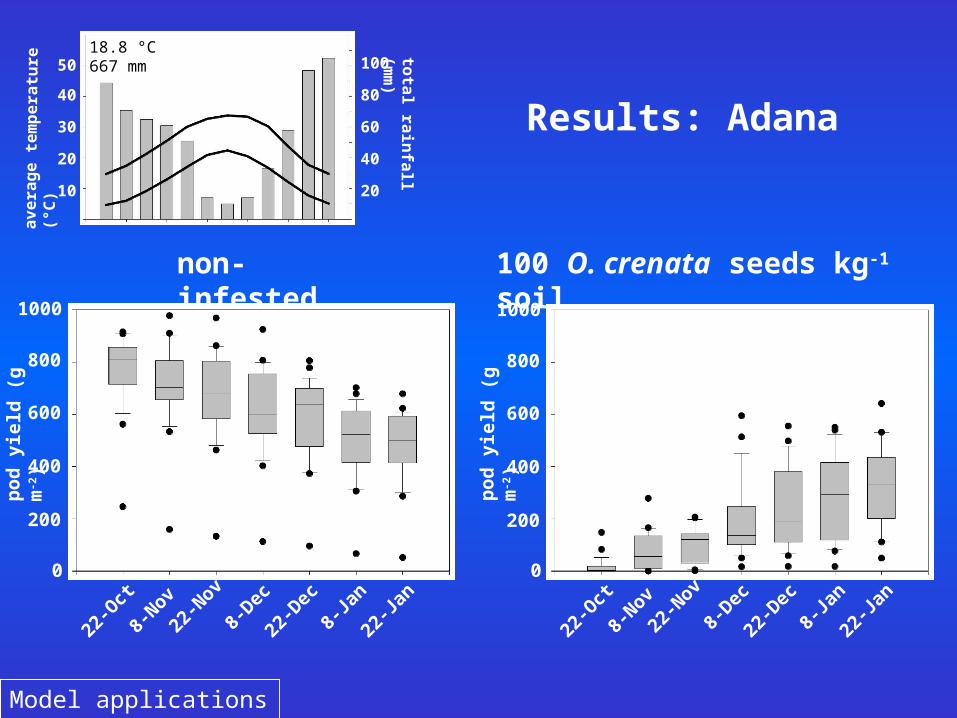
• 0 resp. 100 O. crenata seeds kg-1 soil (0-15 cm)
• 7 sowing windows:
Oktober January November December
22.10. 8.11. 22.11. 8.12. 22.12. 8.1. 22.1.
Optimal faba bean sowing windows
Model applications - 1
Page 16
Results: Tel Hadya
17.6 °C 339 mm
200
400
600
800
1000
200
400
600
800
1000
0 0
pod
yie
ld (
g m
-
2) pod
yie
ld (
g m
-
2)
22-O
ct
8-Nov
22-N
ov
8-Dec
22-D
ec
22-Ja
n
8-Ja
n
22-O
ct
8-Nov
22-N
ov
8-Dec
22-D
ec
22-Ja
n
8-Ja
n
10
20
30
40
50
avera
ge t
em
pera
ture
(°
C)
tota
l rain
fall
(mm
)
20
40
60
80
100
non-infested
100 O. crenata seeds kg-1 soil
Model applications - 2
Page 17
Results: Adana
18.8 °C 667 mm
200
400
600
800
1000
200
400
600
800
1000
0 0
pod
yie
ld (
g m
-
2)pod
yie
ld (
g m
-
2)
22-O
ct
8-Nov
22-N
ov
8-Dec
22-D
ec
22-Ja
n
8-Ja
n
22-O
ct
8-Nov
22-N
ov
8-Dec
22-D
ec
22-Ja
n
8-Ja
n
10
20
30
40
50
avera
ge t
em
pera
ture
(°
C)
tota
l rain
fall
(mm
)
20
40
60
80
100
non-infested
100 O. crenata seeds kg-1 soil
Model applications - 3
Page 18
Multi-Season Simulations
year
1980 1985 1990 1995 2000
faba
bea
n po
d yi
eld
(g m
-2)
0
200
400
600
800
1000 broomrape seed bank (seeds m
-2)
0
1x10⁶
2x10⁶
3x10⁶
4x10⁶
year
1980 1985 1990 1995 2000
faba
bea
n po
d yi
eld
(g m
-2)
0
200
400
600
800
1000 broomrape seed bank (seeds m
-2)
0
1x10⁶
2x10⁶
3x10⁶
4x10⁶
200
400
600
800
1000
0
Tel Hadya
Adana
yield of non-infested cropyield of infested crop
seed bank (0-15 cm)
0
pod
yie
ld (
g m
-
2) pod
yie
ld (
g m
-
2)
200
400
600
800
1000
0
1
2
3
4
0
1
2
3
4
seed
ban
k (m
illion
seed
s
m-2)
seed
ban
k (m
illion
seed
s
m-2)
•5-course rotation unfeasible at both locations
•more rainfall more biomass more parasite seeds
•high soil moisture level rapid seed decay
1980
1985
1990
1995
2000
1980
1985
1990
1995
2000
Model applications - 4
Page 19
• Evaluation of trap cropping, soil solarisation,
biological control and further measures
• Data collection for more mechanistic modeling of
seed bank decay
• Addition of a spatial component (cellular automaton)
• Application of the approach to further host-parasite
associations
• ... Your suggestions ?
Prospects for model improvement
Page 20
• On the APSIM approach and framework:- McCown, Hammer, Hargreaves, Holzworth, Freebairn (1996). Agric.
Syst. 50, 255-271.
- Keating, Carberry, Hammer et al. (2003). Eur. J. Agron. 18, 267-288.
- Wang, Robertson, Hammer et al. (2003). Eur. J. Agron. 18, 121-140.
• On Host-Parasite Simulation:- Manschadi, Sauerborn, Stützel (2001). Weed Res. 41, 311-324.
- Manschadi, Wang, Robertson, Meinke, Sauerborn (2003).
www.regional.org.au/au/asa/2003/c/18/manschadi.htm
- Manschadi, Hargreaves, Grenz, DeVoil, Meinke (2004).
www.regional.org.au/cs/2004/poster/ 2/8/1218_manschadi.htm
- Grenz, Manschadi, DeVoil, Meinke, Sauerborn (2004).
www.regional.org.au/cs/2004/poster/2/4/1/1236_grenz.htm
Selected references