senprojectscanservetoprepareengineeringundergraduatesforindustrialsettingswherespecializedprocesssimulators(e.g.,AspenPlus,CHEMCAD,HYSIM,andPROSIM)areusedextensively.[3-6]Steady-stateprocesssimulatorsinsepara-tionsand/ordesigncoursesarealreadyusedinmostchemi-calengineeringdepartments.[7,8]Recently,programssuchasAspenChromatographyallowstudentstomodelandsolveliquid-phaseionexchangesystemsthatareoftenoperatedasunsteady-stateprocesses.Commercialsimulatorsmodelthesesorptionprocessesthroughthesolutionofpartialdifferentialequations governing heat and mass transfer and algebraicequationsdescribingequilibriumandpressuredrop.[3]
Many chemical engineering students enter the field of biotechnologyandbioprocessingwheretheyareconfrontedwith difficult purification challenges. Monoclonal antibod-iesrepresentalargepercentageofnewbiopharmaceuticalsandthosecurrentlyinclinicaltrials.Thisimportantclassofproteinsoftenrequiresseveraldownstreamprocessingstepsincluding: clarification, protein A chromatography, anion exchangechromatographyfollowedbyhydrophobicinterac-tionchromatography(orcationexchangechromatography),virus filtration, and finally, ultrafiltration or diafiltration.[9]The elimination of even one of these steps can significantly reduceoperatingcosts.
Therecentuseofweakpartitioningchromatography(WPC)inthedownstreamprocessingofantibodiesbyWyethBioPharma(Andover, MA) has generated significant attention.[10-12]Inthatprocess,WPCisemployedtopurifymonoclonalantibodiesinanionexchangesystemsaspartofatwo-columnsepara-tionplatform(withProteinAchromatography)ascomparedto traditional three-column separation platforms.WPC isan isocratic chromatographic protein separation methodperformedundermobilephaseconditionswheretheproduct
Steven Evans received his chemical engineering and chemistry B.S. de-grees from the University of California, Irvine, his M.S. from the University of Wisconsin-Madison in chemical engineering, and completed his Ph.D. in chemical engineering at Rensselaer Polytechnic Institute. He joined MedImmune in Gaithersburg, MD, as process biochemistry scientist in the summer of 2009.
Xinqun Huang received his B.S. and M.S. from East China University of Science and Technology in chemical engineering and his Ph.D. in chemi-cal engineering from Rensselaer Polytechnic Institute. He is currently a process engineer at Covidien in St. Louis, MO.
Steven Cramer received his B.S. from Brown University in biomedical engineering and his M.S. and Ph.D. in chemical engineering from Yale University. He is currently the William Weightman Walker Professor at Rensselaer Polytechnic Institute. In addition to regularly teaching un-dergraduate and graduate Separations and Bioseparations courses he is also the editor of the journal Separation Science and Technology. His research interests include: design of chemically selective displacers for protein purification; multi-scale modeling of complex chromatographic behavior; molecular modeling of selectivity and affinity in mixed model chromatographic systems; spectroscopic/chromatographic investigation of protein-surface interactions; chromatography on a chip; novel separa-tion systems for proteomics; high-throughput screening for bioprocess development; and chemometrics for process analytical technology.
Using Aspen to Teach Chromatographic Bioprocessing:
a CasE sTuDy in wEak parTiTioning ChromaTography
for Biotechnology Applications
ChE curriculum
STeven T. evanS,1 Xinqun Huang,2 and STeven m. cramer1 1 Rensselaer Polytechnic Institute • Troy, NY 121802 Covidien • St Louis, MO, 63132
protein binds weakly to the resin, in contrast to flowthrough operations[12]wherenobindingoftheproductproteinoccurs.A major advantage of WPC is that it can enable significantly stronger binding of impurities, resulting in improved purifica-tion as compared to the flowthrough mode of operation.[12]Inaddition,productlossesarereducedbyloadinglargeramountsofproduct.Finally,ashortwashstepcanalsobeemployedtoattainevenhigherpurityandresincapacityusingWPC.
Inthispaperwedescribeaprojectthatwasusedinanad-vancedchromatographicseparationscourse(15weekslong,offered everySpring term) taught to seniorundergraduatestudentsandgraduatestudentsforthepastthreeyears.Thebiotechnology-related separations challenge was derivedfromtheWPCworkpresentedbyS.Vunnum[10]atthe2006nationalAmericanChemicalSocietyconferenceandrecentlypublishedinseveralpapers.[11-16]Manyofthedetailsofusingthecommercial simulatoremployed (AspenChromatogra-phy) and teaching courses with simulators integrated intolectureshavebeenreportedpreviously.[3,8]Thecourseprojectdescribedinthispaperwasdesignedtoinstructthestudentsin basic simulator operation and to enable them to applycoursematerial to an important separationchallenge fromthebiotechnologyindustry.
2. ThE projECT 2.1 Learning Objectives: The specific learning objec-
ate and interpret adsorption isotherm and partition coefficient plots,2)useasimulationtoolforchromatographicmodeling,3)explainthesubtletiesofanovelmodeofchromatography(WPC)throughvaryingcalculationsandsimulations,4)il-lustrate the benefit of fractional factorial simulations as a tool fordirectingexperiments,and5)applytheirchromatographicsimulation and optimization experience to modeling otherseparationprocesses.
2.2 Project Goal:Thestudentswereinstructedthattheirgoalwastooptimizetheproductyield(recovery) associated with the anion exchangestep while satisfying several constraints.Thefeed mixture for this system consisted of atherapeuticmonoclonalantibody(product)andtwocompoundsrepresentingtypical impuritiesinthesebiologicalmixtures(e.g.,nucleicacids,endotoxins,viruses,orhostcellproteins).Theseimpurities are in general more strongly boundthantheproductofinterestunderanionexchange
chromatographicconditions.[12,18,19]Theprocessmustresultinaproductyieldgreaterthan90%whilesatisfyinga95%purityconstraint.Further,theprocessmustmaximizetheproductionrate (amount purified per unit time) and be accomplished in lessthaneighthours(typicalworkshift).
2.3 Overview:Thisprojectisbasedonarecentpublicationdescribing theWPC process.[12] Students were introducedtokeyWPCconcepts,providedwithbatchadsorptiondata,instructedtoplotadsorptionisotherms,andthenrequiredtogenerate partition coefficient plots. Aspen Chromatography was then employed to guide the students through specific columnsimulations(varyingfeedloadingvolumeandsaltcounter-ionconcentration).Studentswerethenchargedwiththeopen-ended taskof optimizing this separation throughsimulationsvaryingparametersoftheirchoosing(factorialsimulation).
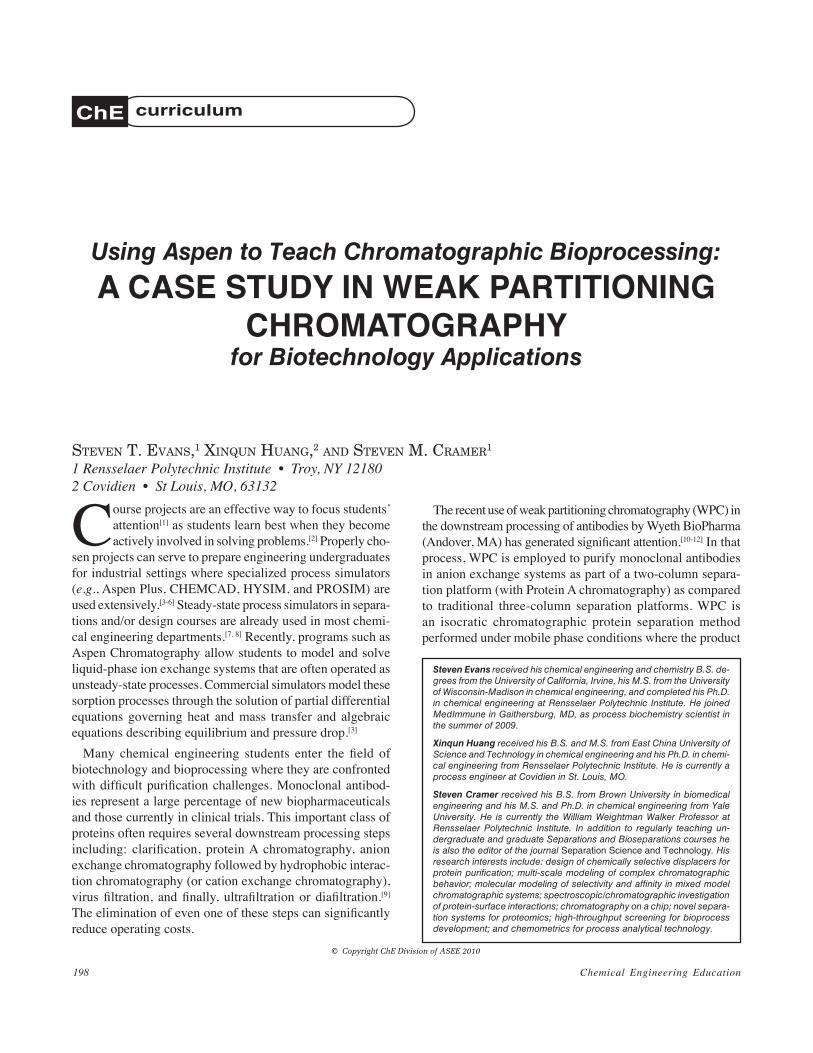
2.4 Introducing Students to the Problem: Thestudentsweregivenextensiveequilibriumadsorptiondatafortheprod-uctandtheimpuritiesatthreedifferentsaltconcentrations,someofwhichareshowninFigure1assymbols.Theywerethen asked to fit the isotherm data to an extended Langmuir isothermwithcounter-iondependence[Eq.(1)].ThisisothermisreadilyavailableinAspenChromatographyandwaschosenforitsabilitytorepresentnonlinearchromatographicbehavioratdifferentsaltconcentrations.
Q
IP IP c IPIP
ci i b ii
1
1 2 34
=( ) −( )( )
( )exp exp
bb ii
kkk b
nc
IPC
IPIP
+
( )
+ ( )=≠
∑5
31
1 exp 44
5
1k
b kkc IP
C+
( )
( )
InthisisothermequationQiistheamountofsoluteiboundtothestationaryphaseandCiistheamountofsoluteiinthemobile phase. The five isotherm parameters are represented byIP1ithroughIP5iforeachsolutei,cbisthesaltcounter-ion
Figure 1. Adsorption isotherms for the product (r), impurity 1 (d), and impurity 2 (j).
Isotherms are given for varying NaCl concentrations of 190 (dotted lines), 200 (dashed
Oncetheisothermplotsweregeneratedandtheisothermpa-rametersoftheproductandthetwoimpuritieswereobtained,thestudentsweretheninstructedtodeterminetheeffectofvaryingsaltconcentration(counter-ion,cb)upontheseiso-therms.Adsorptionisothermsforcounter-ionconcentrationsof190(dottedlines),200(dashedlines)and225mM(solidlines) are shown in Figure 1.The diamonds represent theproduct,thecirclesrepresentimpurity1,andthesquaresrep-resentimpurity2.Thestudentswereaskedtocommentuponthe relative binding affinity of the solutes, how the affinity ofeachsolutechangeswiththesaltconcentration,andwhattheirinitialthoughtsonpossibleseparationstrategiesmightbe.Additionallythestudentswereaskedtocommentonthesaltconcentrationatwhichtheisothermsofallofthesolutesbegintooverlapcorrespondingtoconditionsthatwouldmakeit very difficult to separate the product from the impurities. For the data given in this problem a salt concentration of270 mM was sufficient to compress the isotherms such that any process separation would be difficult. Figure 1 and all of the other figures presented in this text are representative of typicalstudentwork.
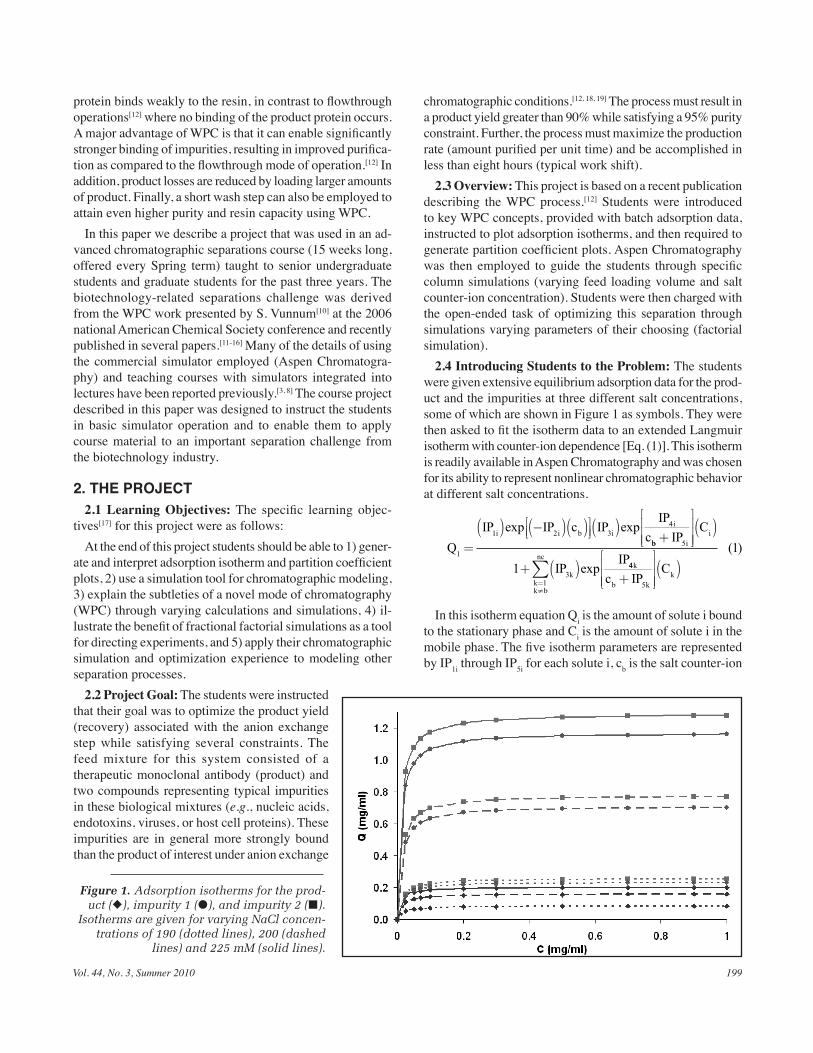
2.5 Partition Coefficient Plot and Weak Partitioning Chromatography:Thegenerationofpartitionordistributioncoefficient plots served to introduce students to the WPC mode of chromatographic separation. The partition coefficient [Eq. (2)] is defined as the ratio of solute bound to the stationary phase(Q)tothatinthemobilephase(C)astheconcentrationinthemobilephaseapproacheszero(correspondingtothelinearregimeoftheisotherm).Thecalculationofpartitioncoefficient values is straightforward using the isotherm [Eq. (1)] with the fitted parameters.
KQCP
C
=
→0
2( )
A partition coefficient plot is a log-log plot of Kpvs.Csalt.[12]
Tohelpthestudentsinterpretthisplottheywereinformedthatproteinionexchangeseparationsaretypicallyoperatedas either 1) bind-elute or 2) flowthrough separations. For bind-eluteseparationstheproductKpishighunderthecolumnloading condition (often >100) while for flowthrough separa-tionstheproductKpislow(usually<0.1).WPCseparationsdefine the regime in this plot that lies between bind-elute and flowthrough separations. Typical KpvaluesforWPCrangefrom0.1to20.
Each of these separation modes (bind-elute, flowthrough, andWPC)hasdistinctadvantagesanddisadvantages.Thechoiceofchromatographicoperationdependsuponthesolutesinaparticularsystem.Studentswereinstructedtocommenton the trends observed in their partition coefficient plots at bothhighandlowcounter-ionsaltconcentrations.Theywerealsoaskedtoratethepotentialutilityofthesethreesepara-tionmodesforthisparticularfeedmixture.Thisenabledthestudents to learnabout thebehaviorofWPCascomparedto more traditional modes of chromatography and satisfied learningobjective3.
2.6 Preliminary Project Student Reports:Priortoem-ployingAspenChromatographythestudentswererequiredtowritepreliminaryreportsthatincludedthefollowing:plottedadsorption isotherms, fitted isotherm parameters, isotherms at varying salt concentrations, partition coefficient plots, and written responses to the various fundamental and appliedquestionsmentionedabove.Thesereportsshouldhaveade-
taileddiscussionoftheisothermandpartition coefficient plots and should includethefollowingobservations:i)theproductisalwaystheleaststronglyboundcomponentofthefeedmixtureunder all salt conditions, ii) as thesaltconcentrationwasincreased,therelative decrease in the amount ofproductboundwaslessthanthatob-servedfortheimpurities,iii)superiorseparationsmaybepossibleathigher
Figure 2. A representative partition coefficient plot[12] of log Kp versus log Csalt for the product (r) and the most highly retained species, impurity 2 (j) for NaCl concentrations ranging from 150 to 300 mM.
Vol. 44, No. 3, Summer 2010 201
salt concentrations, and iv) flowthrough or WPC modes of chromatographymayresultinimprovedionexchangechro-matographicprocesses.Theseexercisesservedtomeetthefirst and third learning objectives.
Data and insight gathered were then used in theAspenChromatography simulation platform for optimizing thisanion exchange separation. From this point forward, eachstudent was told to use the isotherm parameters providedby the instructor (note: the use of inappropriate isothermparameterscouldresultinsimulatornon-convergencesincesolute profiles can become quite steep for these nonlinear isotherms[3]).Studentswerethenintroducedtothecommercialsimulator throughahands-oncomputer laboratory lecture.
3. aspEn ChromaTography 3.1 Process Flowsheet:TheAspenChromatographysoftware
wasusedtogenerateamodelusingtheisothermparametersandcolumnpropertiesgivenbelowalongwithappropriateSolverProperties(note:representativesolverpropertiesaregivenintheappendixforthoseunfamiliarwithAspen).Whilethecom-mercialsimulatorhasbeendescribedindetailelsewhere[3,8]itis instructive to briefly introduce it here.
TheTemplates and Demonstrations given in theAspensoftwarepackageareusefulforgainingfamiliaritywiththesimulation platform. Clicking on “File” then “Template” or “Demonstration” loads process flowsheets for sample problemsalreadystoredwithintheAspenchromatographysimulator. There are brief descriptions of each example flow-sheet.Afterrunningsthesimulation,resultscanbeviewedbyselecting “Tools,” “Report,” and then “Chromatography_Re-port.” These Template and Demonstration files help the user getacquaintedwiththesimulationplatformandareeasilyadaptedtoarangeofotherseparationproblems.
For the students to construct their flowsheets with cor-respondingmodels(Figure3)theywerealsoinstructedonhowtousetheCycleOrganizer.Byclickingonappropriate
TABLE 1Extended Langmuir With Counter-Ion Dependence
Isotherm ParametersIsotherm
ParametersProduct Impurity1 Impurity2
1 33.87 66.09 70.55
2 25.56 3.13 3.02
3 7.58 1.16 1.13
4 0.48 2.39 2.40
5 0 1.08*10-3 9.93*10-4
Figure 3. Aspen Chromatography graphical user interface and representative flowsheet.
Chemical Engineering Education202
directories in the “Exploring-Simulation” window on the left side of Figure 3, they can readily construct the flowsheet and assignappropriatemodels(e.g.,ionx_r_feed,ionx_r_column,andionx_r_product)tothecolumn.
3.2 Simulation Parameters:Forthepurposeofthesimula-tions a liquid chromatography column (length = 40 cm, Inner Diameter = 2 cm) with a stationary-phase resin (the same used forgeneratingthebatchadsorptiondataanddeterminingtheisotherm parameters) having the following properties wasused:inter-particlevoidageof0.40,intra-particlevoidageof0.70,bedcapacityof30M,and50micronradiussphericalparticles.
Thefollowingsimulationassumptionswereused: liquidviscosityof1cP,sphericalstationaryphaseresinparticleshaving SFac = 1 (measure of particle uniformity), constant mass transfer coefficients (MTC) of 100,000 min-1 for thesolutes,materialbalancesassumingconvectionwithdisper-sionbaseduponplatenumbers(400platesforthecounter-ionand 150 plates for each solute), a solid film model assumption, andalinearlumpedresistancekineticmodelassumed.Thesimulationsweresettoallowvaryingpressurewithconstantvelocity for the “Pressure Assumption.” The “BUDS” partial differentialequationdiscretizationmethodwith100nodeswas sufficient for the calculations.
Initially thestudentswere instructed tousea feed load-ing time of 25 minutes and a flow rate of 10 ml/min (about 2columnvolumes).Theconcentrationsoftheproductandimpuritiesinthefeedmixtureweresetto8mMproduct,1mMimpurity1,and1mMimpurity2.Whileitisagoodas-sumptionthattheproductcomprisesbetween90-95%oftheWPCfeed,theproductandimpuritiesconcentrationvalueswerechosenforeaseofillustrationduringinstruction.Thefeedstockcounter-ionconcentrationwasalwayssetequaltothatofthecolumnrunningbufferforeachWPCsimulationastheseseparationsarecarriedoutunderisocraticconditions.Throughthishands-oncomputerlaboratorylecturethestu-dentswerethenabletoindependentlyrunAspen,satisfyinglearningobjective2.
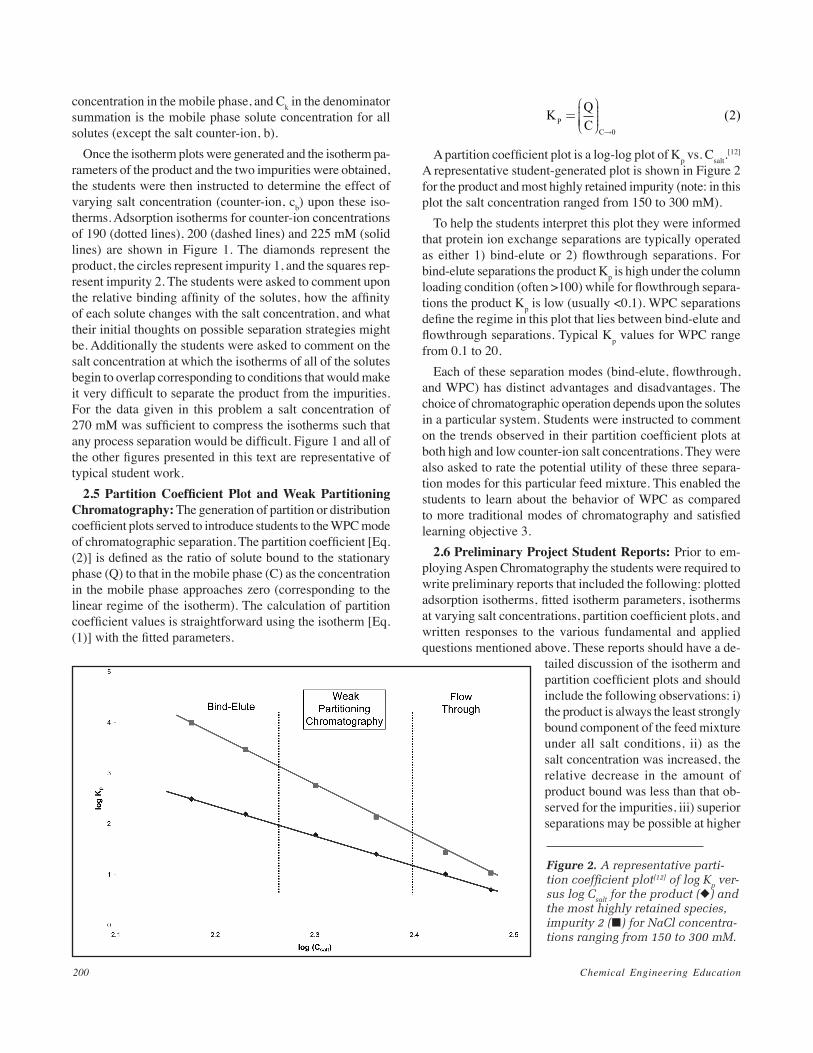
Figure 4, A through E. Simulated chromatograms for separations with varying feed volumes at constant inlet NaCl concentration of 210 mM (dashdot line), flow rate (10 ml/min), and feed concentrations [8 mM product (solid line), 1 mM impurity
1 (dashed line), 1 mM impurity 2 (dotted line)]. Feed loading varied from a) 25, b) 40, c) 50, d) 100, and e) 200 minutes.
A.
B.
C.
D. E.
Vol. 44, No. 3, Summer 2010 203
3.3 Factorial Simulations: After appropriately configuring the process flowsheet factorial simulations were employed to optimizetheseparation.Factorialsimulationsallowforthestudyofagivenfactor’seffectuponaresponsevariableaswellasinteractionsbetweenfactors.Ifthenumberofexperi-mentsforafullfactorialdesignistoohigh,afractionalfacto-rialdesignmaybeperformedinwhichsomeofthepossiblecombinations(usuallyatleasthalf)areomitted.
As outlined above the process specifications required 90% orgreaterproductrecovery(yield)withatleast95%purity.Theoptimalseparationprocessesshouldmaximizetheproductpurified per unit time while not exceeding a typical eight-hour shiftlimitation.Thestudentswererequiredtoperformfacto-rialsimulationsusingtheAspenChromatographysimulatortovarythefeedloadingvolumeandsaltconcentrationinthecol-umnrunningbuffer.Furtherparameters(feedconcentrationand flow rate) can also readily be examined and were included asanextra-creditoptioninthepresentformofthisproject.Studentswereinitiallyinstructedtoapproachtheprobleminanexplicitlyoutlinedmannerandlateraskedtooptimizetheprocess through more “open-ended” questions.
3.3.1 Varying Column Loading Volume:ThefollowingsimulationswereaimedatinstructingthestudentsofWPCseparation subtleties and illustrating the benefit of factorial simulations, addressing learning objectives 3 and 4. The first processvariablethestudentswereaskedtostudywastheef-fectofthefeedloadingvolumeupontheproductproductionrate. Constant pH, salt (210 mM), flow rate (10 ml/min), and feedconcentrations(8mMproduct,1mMofeachofthetwoimpurities)wereused.Foreachsimulationthesaltconcentra-tionintheloadingbufferwassetequivalenttotherunningbuffer.Simulationsusingfeedloadingtimesof25,40,50,100,and200minuteswererequiredofthestudents.Resultsfromthese simulations are shown in Figure 4 A-E. In these figures theconcentration(mM)oftheproduct(solidline),impurity1(dashedline),andimpurity2(dottedline)aregivenonthelefthandy-axis,thesalt(dash-dotline)concentration(mM)isgivenontherighthandy-axis,andtheseparationtimeisgivenonthex-axis(minutes).
Figure4AshowstheWPCseparationforafeedloadingtimeof25minutes.Inthisplotaninducedsaltwaveisobservedearlyinthechromatogramduetothedesorptionofsaltduringsolutebinding.Theproductdoesnotreachitsplateauconcen-tration and there is sufficient resolution between the product andeachofthetwoimpuritiesthatwouldallowtheprocessengineertofurtherincreasethefeedloadingtimewhilestillsatisfyingtheconstraintsontheprocess.
As thefeed loadingtimes increased(Figures4B-E) theproductpeakbegantobroaden(Figure4B,40-minutefeedload)anddevelopaspike(Figure4C,50-minutefeedload).Thisspikeisduetothecompetitivebindingoftheinducedsaltwaveandtheproduct.[20]Furtherincreasesinthefeedloadingtimeto100minutesresultedinbroadeningoftheconcentra-
3.3.2 Varying Salt Concentration:The students wereinstructedtostudytheeffectofvaryingthesaltconcentrationunderwhichtheWPCseparationsareperformed.Simulationsat specific salt concentrations (220, 210, 200, and 170 mM NaCl)were requiredof the students.Figures5A-D (nextpage)showchromatogramsforthesesimulationsthatwereperformedusingafeedloadingtimeof100minutes(note:thisfeedloadcorrespondedtotheconditionswheretheproductbegantooverlapwiththeimpuritiesinFigure4).StudentswereaskedtocommentonthechangesobservedfortheseparametricWPC simulations (breakthrough times of theproductandimpurities,timerequiredfortheentireseparation,shapesofthepeaksobtained,etc).
Asthesaltconcentrationisincreasedto220mM(Figure5A) and above, the separation becomes more of a flowthrough operationwithproductyielddiminishedduetoearlyelutingimpurities.Infact,thisillustratesthepotentialadvantageofWPC over more commonly used flowthrough operations. Asthesaltconcentrationisdecreased(Figures5B-C)WPCbecomes the dominate mode of separation with increasedresolutionbetweentheproductandimpurities.At200mMsaltcompleteseparationisachievedbetweentheproductandtheimpuritiesevenatthiselevatedfeedloadof100minutes.Furtherdecreaseinsaltconcentrationto170mM(Figure5D)resultedinevengreaterseparationbetweentheproductandimpurities at the cost of significantly longer separation times. A typical shift time for workers in a manufacturing plant(eight hours) would make such long separation processesimpractical.FurtherdecreaseintheisocraticoperatingsaltconcentrationwouldresultinproductKpvaluescharacteristicofbindandeluteseparations.Clearly,aswiththefeedloadingtime,thereexistsanoptimumsaltconcentrationforperform-ingWPCseparationofagivenfeedstock.
These simulations illustrated the benefits of factorial simula-tionsandenabledstudentstolearnaboutthebehaviorofWPCascomparedtomoretraditionalmodesofchromatography,satisfyinglearningobjectives3and4.
students were asked to use theAspen Chromatographysimulatortodeterminetheoptimumseparationconditions(maximizedproductyieldperunittimeforagivenpurityconstraint)forthissystemwhichdidnotexceedaneight-hourshiftlimitationtypicalinindustrialsettings.Resultsfrom a systematic fractional factorial design approachvaryingthefeedloadingvolume(11discretevalues)andsaltconcentration(5discretevalues)areoutlinedbelow.
ThemaximumproductivityforthesystemisgivenbyEq.(3)whereTTotalisthetotalruntimeforagivencolumnseparation,Mistheamountofproductproteinloaded(i.e.,VtimesC,whereVisthevolumeandCistheconcentra-tionofproteinloaded).Regenerationandre-equilibrationtimes are not included in this since it is expected thatthesewillbethesameforallWPCprocessesforagivenfeed/columnsystem.Eq.(3)canberewrittenintheformof Eq. (4) where F is the volumetric flow rate and Tloadingisthefeedloadingtime.
fM
TTotal
= ( )3
max : fT F C
Tloading
Total
=( )×( )×( )
( )4
The decision variables that can be used to maximizethis objective function are the flow rate, feed loading time, concentrationofthefeedcomponents,andthesaltcon-centrationusedfortheseparation.Thestudentswerenotgivenexplicitseparationconditionsfortheseseparationsbut were allowed to vary the parameters as they saw fit as long as the constraints were satisfied.
Simulationsperformedunderthesevariousconditionswerethenusedbythestudentstoproducegraphsoftheproductivity(massofproductpertime)asafunctionoffeed loading volume and salt concentration (Figure 6).In this representative productivity bar graph, the datarepresented by unfilled bars (purity) and half-filled (shift time)didnotsatisfytheconstraints,whiletheotherdata(fullbars)did.
Fromthisanalysis,thestudentswerethenaskedtoselectthe optimal operating conditions for the purification of this productfromtheimpurities.ForexampleinFigure6theoptimumresultwouldcorrespondtoasaltconcentration
Figure 5, A through D (all, left). Simulated chromatograms for separations with varying NaCl concentrations (dashdot line) at constant feed loading time (100 min), flow rate (10 ml/min), and inlet feed concentrations [8 mM product (solid line), 1 mM impurity 1 (dashed line), 1 mM impurity 2 (dotted line)]. Salt counterion concentrations were: a) 220, b) 210, c) 200, and d) 170 mM NaCl.
D.
C.
B.
A.
Vol. 44, No. 3, Summer 2010 205
of200mMandafeedloadtimeof250minutes.Studentswere also required to submit representative simulationsresults illustrating the trendsobserved in theirdataand tocommentuponhowtheoptimalconditionswereobtained.Additionallythestudentswereaskedtocommentupontheseparation conditions for which the constraints were notmet.Finally,inspiredstudentswereencouragedtotaketheiranalysis further by investigating the effect of varying theconcentrationofthefeedcomponents(keepingtherelativeconcentrations constant) and the flow rate (using appropriately modified mass transport coefficients) on the productivity of WPCseparations.
satisfied, provide student feedback to various aspects of the project,andprovideguidanceuponhowinstructorscanassessstudents through this project. The specific learning objec-tives[17] for thisprojectwereasfollows:At theendof thisprojectstudentsshouldbeableto1)generateandinterpretadsorption isotherm and partition coefficient plots, 2) use a simulation tool for chromatographic modeling, 3) explainthe subtleties of a novelmodeof chromatography (WPC)through varying calculations and simulations, 4) illustratethe benefit of fractional factorial simulations as a tool for directingexperiments,and5)apply theirchromatographicsimulation and optimization experience to modeling otherseparationprocesses.Projectdescriptionhandoutsprovidedto the students contained information on current biotech-nologyseparationchallengesand taught themaboutWPC(objective3).Thetaskstheywererequiredtoperformtaughtthemhowtogenerateandinterpretadsorptionisothermandpartition coefficient plots (objective 1) and introduced them to the use of simulation toolsfor chromatographic modeling(objective 2). Further, as thestudentsperformedtherequired
simulationsundervaryingconditions(e.g.,feedloadandsaltconcentration)thesubtletiesofWPCseparationsbecameap-parent(objective3).Thestudentswerealsoabletoobservetrade-offsbetweenmaximizingproductivitywhileminimizingtheoverallprocesstimeandsatisfyingprocessconstraints.The students learned the benefits of fractional factorial simula-tions(objective4)duringtheoptimizationoftheirprocesses.Bytheendoftheproject,thestudentswerecomfortableandproficient Aspen Chromatography users (objective 5) and they indicatedthattheyfelttheyhadlearnedthenecessaryskillstomodelotherseparationprocesses(objective5).
The student response to the addition of this simulation-basedprojectintothecoursewasquitefavorable.Whilethestudents had not previously usedAspen ChromatographytheyhadsomefamiliaritywithAspensoftwarethroughpre-vious chemical engineering courses. The first year that the projectwasused in thecourse, the students indicated thatmoreexperiencewiththeAspensimulatoringeneralwouldhavebeenusefulpriortotheassignment.Thiswasaddressedin the following year by including a hands-on computerlaboratoryinthelecturesequence.Inthisstudioformat,thestudentswereabletogetassistancefromtheinstructorandtheir peers as problems arose, significantly improving the students’experience.Studententhusiasmwasapparent,sincetheentireclassstayedwellaftertheinstructionalperiodhadendedinordertocontinuelearninghowtoproperlyusethechromatographicsimulator.
Students commented that they enjoyed visualizing theseparationsthattheyhadbeenstudyingearlierinthecourseand that these exercises significantly strengthened their un-derstandingofchromatographicseparations.Theyalsocom-mentedthatthisprojectenabledthemtobetterunderstandtheimplementationofmanyofthecourseconceptsandtheories
Figure 6. Representative productivity bar graph for varying feed loading time and NaCl concentrations.
For each feed loading time shown on the xaxis results are given at 5 NaCl concen
trations of 170, 200, 210, 220, and 250 mM from left to
right. The data represented by unfilled bars (purity) and
halffilled (shift time) did not satisfy these particular
constraints, while the other data (full bars) satisfied all
constraints.
Chemical Engineering Education206
for an actual separation process. Finally, several studentscommented that this simulationmodulewas their favoritepartofthecourse.
Studentassessmentwasbasedontwowrittenreportsthattheywererequiredtosubmit,onepriortousingAspenandoneafter.Thestudentswereassessedfortheirabilitytogeneratethe required data and figures (e.g.,isothermplots,partitioncoefficient plots, required simulated outlet chromatograms, andsimulationsperformedfortheoptimizationofthepro-cess)aswellasfortheirunderstandingoftheseprocessesasevidencedbythediscussionsinthesereports.
5. ConClusions The commercial simulatorAspen Chromatography was
employedtostudyandoptimizeanimportantnewindustrialseparationprocess,weakpartitioningchromatography.Thiscase study on antibody purification was implemented in a chromatographicseparationscourse.Studentsinitiallywereaskedtomanipulateadsorptiondatatodetermineadsorptionisothermparameters and to study the effect of salt on theisothermbehavior.Apreliminaryreportwasturnedinatthispointthatalsoincludedtheirresponsestoanumberofques-tionstoprobetheirknowledgeofthesubjectmatter.
Thestudentswerethenrequestedtocarryoutdetailedsetsofparametricsimulationstoinvestigatetheeffectofoperat-ing parameters (e.g., feed load, salt concentration) on theproductivityandyieldofthisseparationprocess.Thecourseproject served to teachstudentsbasic simulatoroperation,apply course material to a separation challenge from thebiotechnologyindustry,andencourageopen-endedproblemexplorationforprocessoptimization.
aCknowlEDgmEnTs This research was supported by NIH Grant 5R01
Chemical Engineering Course Design,” Jisuanji Yu Yingyong Huaxue,21(5),781(2004)
5.Smith,C.A.,andF.W.Villaescusa,“SimulatingChromatographicSepa-rations in the Classroom,” J. of Chem. Educ.,80(9),1023(2003)
6.Haddad, P.R., M.J. Shaw, J.E. Madden, and G.W. Dicinoski, “AComputer-BasedUndergraduateExerciseUsingInternet-AccessibleSimulationSoftwarefortheStudyofRetentionBehaviorandOptimi-zation of Separation Conditions in Ion Chromatography,” J. of Chem. Educ.,81(9),1293(2004)
7. Rockstraw, D.K., “Aspen Plus in the ChE Curriculum,” Chem. Eng. Educ.,39(1),68(2005)
8.Wankat,P.C.,“IntegratingtheUseofCommericalSimulatorsinLectureCourses,” J. of Eng. Educ.,91(1),19(2002)
9. Kelley, B., “Very Large Scale Monoclonal Antibody Purification: The Case for Conventional Unit Operations,” Biotechnology Progress,23(5),995(2007)
10.Vunnum,S.,M.Switzer,R.Godavarti,T.Iskra,P.R.Brown,S.Tobler,J.Coffman,B.Costigan,C.Kha,D.Wright,K.Sterl,andB.Kelley,“Anion Exchange Purification of Monoclonal Antibodies: Principals of Weak Partitioning Chromatography,” Abstracts of Papers,232ndACSNationalMeeting,SanFrancisco,CA(2006)
11.Tobler,S.A.,A.Noyes,P.R.Brown,M.Switzer,andB.Kelley,“Re-movalofHMWSpeciesUsingAEXintheWeakPartitioningModefor Antibodies and Related Proteins,” Abstracts of Papers,234thACSNationalMeeting,Boston,MA(2007)
12.Kelley,B.D.,S.A.Tobler,P.Brown,J.L.Coffman,R.Godavarti,T.Iskra,M.Switzer,andS.Vunnum,“WeakPartitioningChromatog-raphy for Anion Exchange Purification of Monoclonal Antibodies,” Biotechnology and Bioengineering,101(3)553(2008)
13.Coffman,J.L.,J.F.Kramarczyk,andB.D.Kelley,“High-throughputscreening of chromatographic separations: I. Method developmentand column modeling,” Biotechnology and Bioengineering, 100(4)605(2008)
14.Kramarczyk,J.F.,B.D.Kelley,andJ.L.Coffman,“High-ThroughputScreeningofChromatographicSeparations:II.HydrophobicInterac-tion,” Biotechnology and Bioengineering,100(4),707(2008)
15.Wensel, D.L., B.D. Kelley, and J.L. Coffman, “High-ThroughputScreeningofChromatographicSeparations:III.MonoclonalAntibod-ies on Ceramic Hydroxyapatite,” Biotechnology and Bioengineering,100(5),839(2008)
16.Kelley,B.D.,M.Switzer,P.Bastek,J.F.Kramarczyk,K.L.Molnar,T.N.Yu,andJ.Coffman,“High-ThroughputScreeningofChromatographicSeparations: IV. Ion-exchange,” Biotechnology and Bioengineering,100(5),950(2008)
17. Felder, R.M., and R. Brent, “Objectively Speaking,” Chem. Eng. Educ.,31(3),178(1997)
19.Van Dyk, D.D., D.R. Misztal, M.R.Wilkins, J.A. Mackintosh,A.Poljak, J.C. Varnail, E. Teber, B.J. Walsh, and P.P. Gray, “Identification ofCellularChangesAssociatedWithIncreasedProductionofHumanGrowth Hormone in a Recombinant Chinese Hamster Ovary Cell Line,” Proteomics,3(2),147(2003)
20.Gallant, S.R.,A. Kundu, and S.M. Cramer, “Modeling NonlinearElution of Proteins in Ion-Exchange Chromatography,” J. of Chroma-tography A,702(1-2),125(1995)
INTEGRATOR(Integrationmethod:Gear;Maximumor-der:5;Absoluteintegrationerrortolerance:0.0005;absolutetearerrortolerance:1e-005;relativeintegrationerrortoler-ance:0.0005;relativetearerrortolerance:1e-005);Uncheckincludesensitivityerrors;Uncheckreconvergetornvariables;Select that the integration error test includes States only;Variable Initial stepsizeof0.001;Minimumvariablestepsize:0.0001;Maximumvariablestepsize:0.1;Variablestepreductionfactor:0.5;UncheckAlwaysenforceminimumstepsize;CheckInterpolatecommunicationtime;UncheckLocatemodeldiscontinuities;UncheckRe-initializeaftervariablestep-change;CheckUseinitialstepsizeaftervariablestep-change;Show0highestintegrationerrors;Show0highesttearintegrationerrors).
LINEARSOLVER(Name:MA48;Droptolerance:0;Re-analyzethreshold:2;Pivottolerance:0;Re-analyzeFLOPSwindow size: 0; Re-pivot every 0 factorizations; Solversearches3columnsforpivots;Uncheckusetranspose).
NONLINEARSOLVER(Mode:Standard;Method:Mixed
Newton;Convergencecriterion:Residual;Maximumdiver-gent steps: 20; Maximum step reductions: 20; Maximumiterations: 500; Maximum fast Newton steps: 8; UncheckDoglegmethod;Maximumrangefractiontolerance:0;Maxi-mumapproachtobound:1;Absoluteperturbation:1e-005;Singularityperturbation:0.01;Maximumvariablestep:50;Clipfactor:1e-006;Highestvariablesteps:0;highestresidu-alsabovetolerance:0;Printlinearalgebraforgroupsofsize>0;UncheckEnabledhomotopy).