East Tennessee State University Digital Commons @ East Tennessee State University Electronic eses and Dissertations Student Works 12-2015 Using Basic Quality Tools to Improve Production Yields and Product Quality in Manufacturing Steve E. Black East Tennessee State University Follow this and additional works at: hps://dc.etsu.edu/etd Part of the Other Engineering Commons is esis - Open Access is brought to you for free and open access by the Student Works at Digital Commons @ East Tennessee State University. It has been accepted for inclusion in Electronic eses and Dissertations by an authorized administrator of Digital Commons @ East Tennessee State University. For more information, please contact [email protected]. Recommended Citation Black, Steve E., "Using Basic Quality Tools to Improve Production Yields and Product Quality in Manufacturing" (2015). Electronic eses and Dissertations. Paper 2594. hps://dc.etsu.edu/etd/2594
Transcript
East Tennessee State UniversityDigital Commons @ East
Tennessee State University
Electronic Theses and Dissertations Student Works
12-2015
Using Basic Quality Tools to Improve ProductionYields and Product Quality in ManufacturingSteve E. BlackEast Tennessee State University
Follow this and additional works at: https://dc.etsu.edu/etd
Part of the Other Engineering Commons
This Thesis - Open Access is brought to you for free and open access by the Student Works at Digital Commons @ East Tennessee State University. Ithas been accepted for inclusion in Electronic Theses and Dissertations by an authorized administrator of Digital Commons @ East Tennessee StateUniversity. For more information, please contact [email protected].
Recommended CitationBlack, Steve E., "Using Basic Quality Tools to Improve Production Yields and Product Quality in Manufacturing" (2015). ElectronicTheses and Dissertations. Paper 2594. https://dc.etsu.edu/etd/2594
Using Basic Quality Tools to Improve Production Yields and Product Quality in Manufacturing
_________________________
A thesis
presented to
the faculty of the Department of Technology
East Tennessee State University
In partial fulfillment
of the requirements for the degree
Master of Science in Technology with a concentration in Engineering Technology
_________________________
by
Steve Black
December 2015
_________________________
Dr. Mohammad Moin Uddin (Chair)
Dr. Keith Johnson
Dr. Hugh Rogers
Keywords: Quality Tools, Quality Improvement Project, 5 Why, and Root Cause Analysis
2
ABSTRACT
Using Basic Quality Tools to Improve Production Yields and Product Quality in Manufacturing
by
Steve Black
As the U.S. and world economies emerge from years of recession, the hardwood flooring market
is currently enjoying strong growth. With this growth come new challenges for hardwood
flooring manufacturers. Strong competition from foreign markets and rising log prices are
reducing product margins and forcing companies to think lean, while improving product quality.
QEP Wood Flooring division, who struggled through the worst of the U.S. economic down turn
is now regaining ground as a strong competitor in the hardwood flooring market. This
turnaround is due to internal changes to decrease waste and increase product quality. This is
accomplished by using the quality control department as a tool to aid manufacturing.
To accomplish these changes, QEP implemented the use of quality tools and employee
awareness training; as a result QEP increased overall product quality and yields while reducing
customer claim pay outs.
3
TABLE OF CONTENTS Page ABSTRACT .................................................................................................................................................. 2 LIST OF ACROMYMS ................................................................................................................................ 5 LIST OF KEY WORDS ............................................................................................................................... 6 LIST OT TABLES ........................................................................................................................................ 7 LIST OF FIGURES ...................................................................................................................................... 8
In National Wood Flooring Association’s Technical Publication No. A100, drying lumber
to a moisture content between 6-9 percent before milling is a commonly accepted practice in the
wood flooring industry (National Wood Flooring Association, 1996), QEP uses this standard to
gauge moisture content in their raw materials prior to milling. During the test sampling process
for chip-out, several samples from each wood species, some with chip-out, and some without,
were tested for moisture content.
QEP uses ASTM4442-07, Standard Test Method for Direct Moisture Content
Measurement of Wood and Wood-Based Materials (method B) as an industry guide to determine
moisture content in their wood panels prior to milling them into flooring (ASTM4442-92, 2003).
One inch-by-one inch samples are cut from wood flooring panels and weighed (green weight),
then placed in a drying oven using an electric heating element set to 103 degrees Fahrenheit.
The samples are dried for 24 hours, during which time periodic weight checks are made to
determine when the samples stops loosing moisture weight. At this time the samples are
considered void of all moisture and their weight (dry weight) is measured.
The formula used to determine moisture content (MC) as a percentage of overall sample
weight is as follows: MC% = (A-B) / B x 100 where A = original mass (green weight), and B =
over dried mass (dry weight). In Table 5 the results of the samples tested for moisture as being a
contributing factor to chip-out are listed. Results of the data show that moisture content being
too high or too low is not a contributing factor to chip-out and thus, material as a cause of chip-
out is eliminated.
30
Corrective Actions for Chip-Out
Once results of the cause-and-effect diagram were analyzed it was determined that corrective
action procedures for chip-out were focused in the following areas.
• People – Operator Set-up, and Training
• Machine – Dull Cutter Heads (Although not a main cause, but still a contributing factor)
When considering operator set-up as a contributing factor to chip-out, it was determined that
operators use different methods for setting-up and adjusting machinery for the milling process.
The main contributing factor discovered during operator set-up was placement of the three
cutting heads, used to mill different parts of the tongue and groove profile, in relation to the
material being milled. Operators incorrectly setting up the second and third cutting head directly
contributed to excessive chip-out during the milling process as follows.
Three cutting heads as shown in Figure 7 are used to mill the various parts of the tongue and
groove profile on the ends of the flooring. It was determined by watching the set-up process that
operators were using head number 3 to cut a larger portion of the final profile than the head was
designed to cut, this left less material for cutting head number two to cut.
31
A: Proper Cutting Head Set-up
Blue – Milled by head #1
Red – Milled by head #2
Green – (Bevel) Milled by head #3
B: Cutting Head Set-up before Improvement Project
Blue – Milled by head #1
Red – Milled by head #2
Green – Milled by head #3
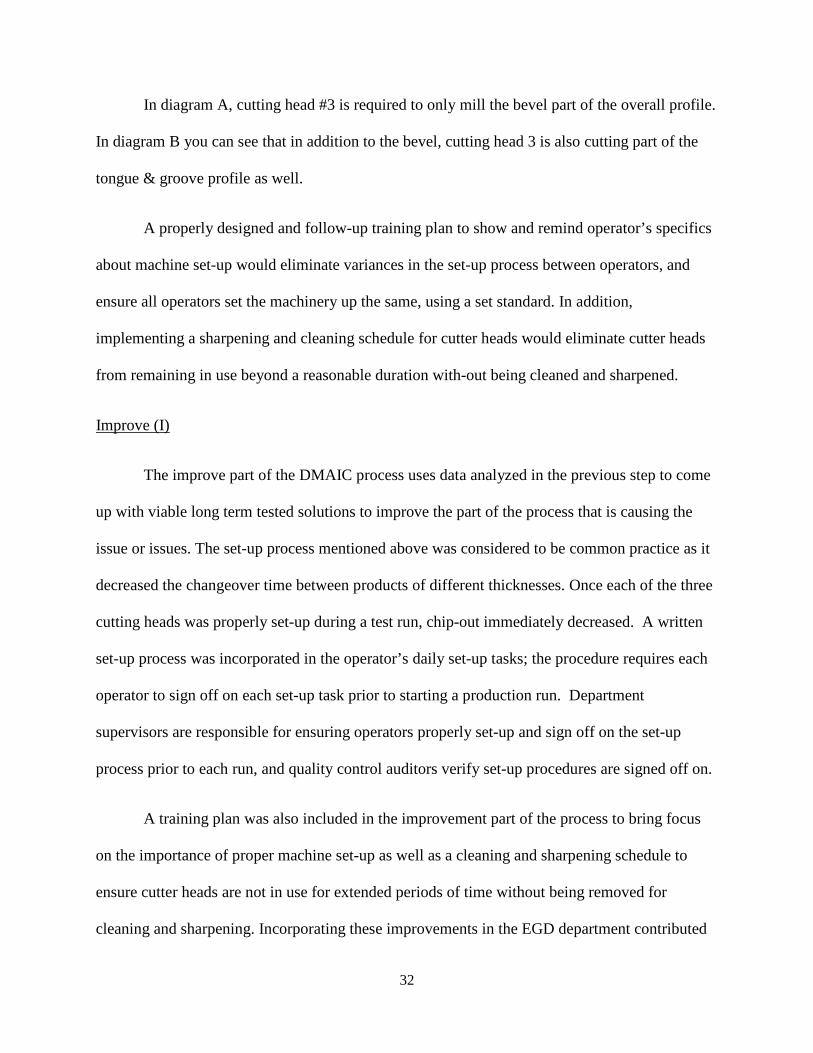
Figure 7: Cutting Heads 1-3 Milling Profile
For privacy reasons, this diagram is intended to give a simplified visual indication of how
various parts of the tongue and groove profile are milled by each cutting head and is not an exact
representation of the actual profile drawing. Various colors indicate specific areas of the tongue
and groove profile that are cut by cutting heads 1-3. Notice the difference in the amount of
material cutting heads 2 and 3 mill between diagram A and B.
32
In diagram A, cutting head #3 is required to only mill the bevel part of the overall profile.
In diagram B you can see that in addition to the bevel, cutting head 3 is also cutting part of the
tongue & groove profile as well.
A properly designed and follow-up training plan to show and remind operator’s specifics
about machine set-up would eliminate variances in the set-up process between operators, and
ensure all operators set the machinery up the same, using a set standard. In addition,
implementing a sharpening and cleaning schedule for cutter heads would eliminate cutter heads
from remaining in use beyond a reasonable duration with-out being cleaned and sharpened.
Improve (I)
The improve part of the DMAIC process uses data analyzed in the previous step to come
up with viable long term tested solutions to improve the part of the process that is causing the
issue or issues. The set-up process mentioned above was considered to be common practice as it
decreased the changeover time between products of different thicknesses. Once each of the three
cutting heads was properly set-up during a test run, chip-out immediately decreased. A written
set-up process was incorporated in the operator’s daily set-up tasks; the procedure requires each
operator to sign off on each set-up task prior to starting a production run. Department
supervisors are responsible for ensuring operators properly set-up and sign off on the set-up
process prior to each run, and quality control auditors verify set-up procedures are signed off on.
A training plan was also included in the improvement part of the process to bring focus
on the importance of proper machine set-up as well as a cleaning and sharpening schedule to
ensure cutter heads are not in use for extended periods of time without being removed for
cleaning and sharpening. Incorporating these improvements in the EGD department contributed
33
to an immediate improvement on the overall milling process, thus reducing the number of chips
the graders defect out of a typical production run. The reduction in chip-out also allows graders
more time to look for other defects.
Control (C)
The final step in the DMAIC process requires controlling changes and improvements
made to the process. This requires continuous monitoring of newly implemented processes to
ensure gains made are sustained over time. To sustain the improvements made in the EGD
department, three follow-up actions are implemented.
1. Operator set-up check lists, and cutter head cleaning and sharpening scheduled check
sheets.
2. Daily Supervisor checks – Supervisors are required to make frequent checks to ensure
operators are performing proper set-up procedures.
3. Quality control auditors make frequent checks of the process to ensure proper set-up
and documentation procedures are followed.
Chip-Out Improvement Project Results
As seen in Table 6 and 7 below, at the beginning of the chip-out project, the average
amount of chip-out during a given production run was 11.7% on the insert end of the line and
11.6% for the non-insert end. Results after the chip-out improvement project show the average
amount of chip-out dropped to 2.4% on the insert end of the line and 1.9% on the non-insert end
of the line. This is an overall 20.5% reduction in chip-out on the insert end and 16.4% reduction
on the non-insert end. Percent’s for specific species are listed below.
34
Table 6: Results Before and After Data Collected During the Chip-Out Project
Insert End
Hickory Red Oak Maple Walnut Average
Before 14.7% 14.1% 10.1% 7.8% 11.7%
After 2.4% 2.8% 2.1% 2.4% 2.4%
Overall Reduction in Chip-Out 20.5%
Non-Insert End
Hickory Red Oak Maple Walnut Average
Before 14.8% 13.7% 9.5% 8.4% 11.6%
After 1.3% 2.0% 1.8% 2.3% 1.9%
Overall Reduction in Chip-Out 16.4%
35
Table 7: Reduction in Chip-Out on Insert and Non-Insert End of Flooring
0
2
4
6
8
10
12
14
16
Hickory Red Oak Maple Walnut
% C
hip-
out W
ith-i
n Sp
ecif
ic S
peci
e
Chips Counted (Insert End)
Before
After
0
2
4
6
8
10
12
14
16
Hickory Red Oak Maple Walnut
% C
hip-
out W
ith-i
n Sp
ecif
ic S
peci
e
Chips Counted (Non-Insert End)
Before
After
36
PRODUCT OFF-COLOR IMPROVEMENT PROJECT
Problem Description
Due to the difference in how line operators view color, as well as operators not having a
standard process to follow when setting up productions runs for staining products, off-color runs
are the leading cause of product defects from the pre-finish department. The second of three
improvement projects QEP focused on to eliminate waste and improve the quality of their
products was to eliminate the human element, to the extent possible, when comparing proper
color match to established color standards during production runs.
Background
Pre-finish department line operators use experience, and trial and error to match flooring
stain colors to established color board standards (Figure 8). Color board standards are built once
product development teams approve new stain colors for customer products; material used for
color board standards are pulled from the actual approved test runs. During the initial color set-
up of a new product, detailed notes are kept as to what dyes are added to a base stain in order to
achieve a specific color. Once a specific color is finalized, the detailed notes are filed in an
electronic data base, as the stain recipe, for use in all future productions runs for that particular
product.
Pre-finish production runs are started when line operators feel the stain color they set-up
correctly matches the given color board standard. Due to natural color variation in wood
products, it is standard practice to make small color adjustments to the original stain recipe, by
the pre-finish operator, using dyes and solvents. The color is then compared to color board
37
standards previously approved by the product manager specialist. These color adjustments are
made using experience and many times trial and error on the part of the line operator.
(a)
(b)
Source: Photo Courtesy of QEP
Figure 8: (a) Color Standard Storage Rack, (b) Typical Color Standard
38
Variances in how operators perceive color such as, viewing angle, their position in
reference to the color standard, and own personal opinion, all play a role in whether or not an
operator feels they have correctly matched stain color to the established color board standard.
Complicating this process, each color standard has a light to dark color flow from left to right
across the standard. This light to dark range establishes the color range operators must set each
color with-in, in order to start a production run.
Product Off-Color Project Details
Maintaining a consistent color match between production runs (lot numbers) reduces
customer claims by ensuring a consistent flowing color throughout different flooring lot
numbers. For this project, in order to determine if product off-color is a top quality concern as it
is suspected of being, the top five defects in the pre-finish department were selected using a
pareto analysis. A pareto analysis consist of listing causes of occurrences in order of frequency
from most to least creating a pareto distribution, then plotting the results on a graph called a
pareto diagram (Table 8).
39
Table 8:Pre-Finish Line Top Five Defects Found During Quality Audits
Data gathered from months of quality audits is used for pareto analysis; and displayed in
a pareto diagram. A pareto diagram is one of the seven basic quality tools used for process
improvement projects. After plotting data, it is clearly visible that product off-color is an issue
needing addressed (Table 8). Addressing this issue requires determining why product off-color is
such an issue.
The 5-Why Technique
By using another of the seven basic quality tools, the 5-Why technique, it was determined
that ultimately it is the operator’s decision regarding color match that prompts the pre-finish line
to start a production run. If stain color during the production run does not match the color
standard then the finished product is considered defective; this contributes to lost production
time, lost product, and if not caught before being boxed, pay-out in the form of customer claims.
0
2000
4000
6000
8000
10000
12000
14000
Off Color Rough Finish Adhesion Chatter Gloss
Squa
re F
eet
Pre-Finish Line Leading Flooring Defects
40
The 5-Why technique uses a series of five questions, each starting with “why”, in
reference to the current issue. This technique helps redefine the problem statement as a series or
causes and effects, and helps identify the source of the problem. The following in Figure 8 are
results from using the 5-Why technique to attempt to discover the root cause of why off-color in
the pre-finish department has such a high frequency of occurrences.
Figure 9: The 5 Why Process used to determine Root Cause for Starting Production Runs with
Product Off-Color
QEP
Pre-Finish Department
5-Why Process to determine why production runs are started off-color
• Why is the product defective? Because the stain color formulated by the line operators does not match the color standard
• Why does the stain color not match the color standard? Line operators, in their opinion, feel the stain color matches the color standard.
• Why do operators think the stain color matches the color standard? Line operators stand in different locations in the color room until the lighting is correct to make the color look correct.
• Why do operators move to different locations in the color room until the color looks correct? Operators see color slightly different when standing in a single location vs. viewing color from multiple locations and angles.
• Why do operators see color differently? This question could not be directly answered due to various opinions; however some input from the operators were that height of the operator, reflection from the color room lights on the color standard, and personal opinion all contributed to various reasons why line operators feel the color match was correct to the color standard to where they are comfortable starting a production run.
41
Although results from the 5-Why process did not point to a single specific root cause, the
process did reveal some facts that were not known prior to the process. It was determined that
operator opinions, coupled with pressure to get production lines running as fast as possible
causes variation between operator color-sets. It was decided the best way to eliminate variation
between line operators was to take the operator out of the decision making process by using an
electronic color spectrometer to read each stain color setup.
Removing the human element from the final decision making process when establishing
color-sets matching a given color board standard, a Color Spectrophotometer (Spectro-Guide
45/0) was introduced into the color-set process (Figure 10a). By removing the operator from the
decision making process, variations in perceived color between various operators are minimized
to the point that color-sets remain very consistent across lot numbers of the same product.
Color Spectrophotometer & Hunter Color Scale
Although this thesis will not go into the inner workings of the Color Spectrophotometer,
some basic information on it and the Hunter Color Scale is needed as these two items are used
together to determine correctness of color match as well as determining needed color
adjustments. The Spectro-Guide 45/0 measures the amount of light, in wavelengths, as it passes
through a medium and displays the results in the form of numeric outputs.
42
(a)
(b)
Source: Photo Courtesy of QEP
Figure 10: (a) Color Spectrophotometer (Spectro-Guide 45/0, (b) L,a,b readings
43
The Hunter L, a, b Color Scale (Figure 11) is a diagram used in conjunction with the
Color Spectrophotometer to assist operators in determining the correct direction to adjust stain
color in order to match a given color standard. The three color axis’s used by operators on the
color spectrophotometer are L, a, and b (Figure 10b), these readings correspond to the three
axis’s used on the Hunter Color Scale.
On the Hunter Color Scale, “L” corresponds to the light-to-dark range; a “L” reading
equal to 100 represents a perfect reflecting diffuser, and a “L” reading equal to 0 represents
black. No numeric value range is assigned to “a” or “b”, however, positive “a” represents red,
Date Operator Product SKU Green Range: Start / Continue Run
Time Run # Product Color Yellow Range: Continue Run & adjust color back into green range
(L) Light to Dark
Red Range: Immediately stop run & reset color back into green range
1 2 3 4 5 6 7 8 9 10 11 12
Pre
Con
trol
Cha
rt
Red Zone: 21.34
Yel
low
Ran
ge
19.20
Gre
en R
ange
17.05
Yel
low
Ran
ge
14.91
Red Zone: 12.76
Figure 12: Color Standard Control Chart (L)
49
QEP Pre-Finish Control Chart
Date Operator Product SKU Green Range: Start / Continue Run
Time Run # Product Color Yellow Range: Continue Run & adjust color back into green range
(a) Red to Green
Red Range: Immediately stop run & reset color back into green range
1 2 3 4 5 6 7 8 9 10 11 12
Pre
Con
trol
Cha
rt
Red Zone: 25.40
Yel
low
Ran
ge
23.94
Gre
en R
ange
22.48
Yel
low
Ran
ge
21.03
Red Zone: 19.57
Figure 13: Color Standard Control Chart (a)
50
QEP Pre-Finish Control Chart
Date Operator Product SKU Green Range: Start / Continue Run
Time Run # Product Color Yellow Range: Continue Run & adjust color back into green range
(b) Yellow to Blue
Red Range: Immediately stop run & reset color back into green range
1 2 3 4 5 6 7 8 9 10 11 12
Pre
Con
trol
Cha
rt
Red Zone: 22.44
Yel
low
Ran
ge
20.20
Gre
en R
ange
17.96
Yel
low
Ran
ge
15.72
Red Zone: 13.48
Figure 14: Color Standard Control Chart (b)
51
Corrective Actions for Off-Color Project
Prior to starting a production run, operators must follow the steps in (Figure 15) when
setting color. These steps were developed to guide operators through a standardized systematic
process that reduces guessing when setting color. Due to natural color variation and unique
characteristic’s with-in and between various wood species, deviations to the color-set steps are
sometimes required. When it is necessary to deviate from these steps, the Quality Manager, Line
Supervisor, and Line Operator are all required to work together and agree upon the final color
match, while using the Color Spectrophotometer to the extent possible.
Figure 15: Operator Color-Set Procedures
QEP
Pre-Finish Department
Line Operator Color-set Procedures
1. Mix initial stain color from color recipe. 2. Run 5 character neutral sample boards down the line for staining. 3. Check color with Color Spectrophotometer. 4. Compare sample color numeric values (L, a, b) to color standard L, a, b
charts. 5. If sample color numeric values fall with-in the green range of the color
standard L,a,b charts, start production run. If not, proceed to step 6. 6. Make color adjustment to initial stain mix, in the direction of color
needed based on sample color numeric values and Hunter Color Scale. 7. After color adjustment is made, run 5 more character neutral sample
boards down the line. 8. Check color with color meter and repeat above steps 4-7 until sample
color falls with-in green range of color standard L,a,b charts. 9. Start Production run; check and document color readings (L,a,b) every
15 minutes. Adjust color as needed to stay with-in the green range.
52
Off Color Improvement Project Results
Prior to the off-color improvement project it was common practice for pre-finish line
operators to start productions runs when color-sets were close to matching the color standards
visually, based on the operator’s opinion. After implementing the use of the Color
Spectrophotometer and an established process check list, production runs cannot proceed until
color set-ups fall within a given range on the color standard. These process changes reduced off-
color customer claims by an average of 10% between the years 2011-2012 and 2013-2014 as can
be seen from Figure 24 below. This decrease represents a cost savings of $13,928 annually.
Table 11: Off Color Improvement Project; Chart shows an Average Reduction in Claim Payouts
of 10% Between the Years of 2011-2012 and 2013-2014
0
5,000
10,000
15,000
20,000
25,000
30,000
35,000
40,000
45,000
2011 2012 2013 2014
Dol
lar A
mou
nt (
$)
Year
Off Color Claims Cost
53
Inconsistent Grading Project
Problem Description
The third and final improvement project involves inconsistent product grading. In the
EGD Department, there are three flooring grader positions (Figure 16 and 17), in grader position
one and two graders are required to identify and mark, with chalk, defects and unwanted natural
character in each piece of flooring that passes them.
Source: Photo Courtesy of QEP
Figure 16: EGD Grading Stations One and Two
54
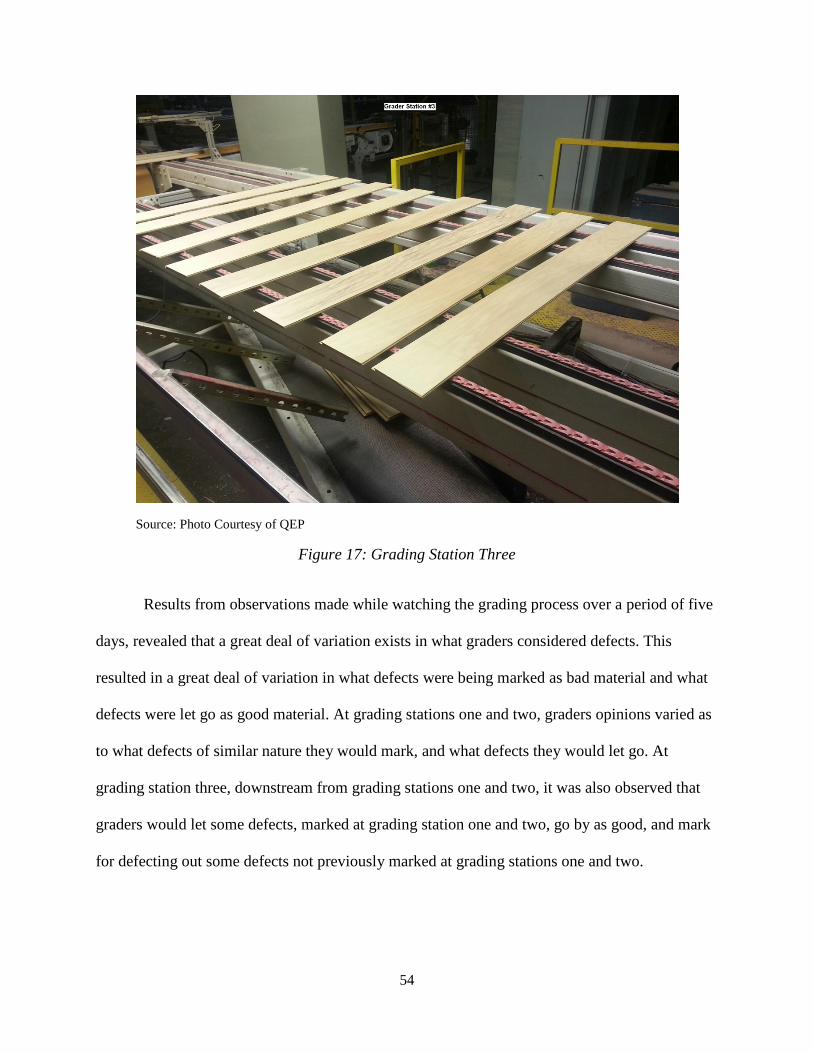
Source: Photo Courtesy of QEP
Figure 17: Grading Station Three
Results from observations made while watching the grading process over a period of five
days, revealed that a great deal of variation exists in what graders considered defects. This
resulted in a great deal of variation in what defects were being marked as bad material and what
defects were let go as good material. At grading stations one and two, graders opinions varied as
to what defects of similar nature they would mark, and what defects they would let go. At
grading station three, downstream from grading stations one and two, it was also observed that
graders would let some defects, marked at grading station one and two, go by as good, and mark
for defecting out some defects not previously marked at grading stations one and two.
55
Background
The EGD department uses a standard set of grading rules for graders to follow. Specific
size limits, in inches and/or fractions of an inch, are listed for graders to use when determining if
a defect exceeds a specific limit for a given product. Grading rules are broken down into three
distinct sections; section one covers product grading for premium (high end products), section
two covers medium grade (less costly products), and section three covers scraped and textured
(specialty products).
During the above mentioned observations, it was discovered that not only did graders
opinions of what constitutes a defect vary, but all graders had a tendency to grade all products
the same, without distinguishing between the three product grades. As a result of this variation in
grading, and the general tendency of graders to grade all products the same, it was discovered
that most products were being over graded, thus reducing production yields.
Although listed in the grading rules with specific dimensions, the following three defects
were most commonly over graded by graders than any other defects; splits, knot holes, and
raised grain in the face of the flooring (Figure 18 through 20). An additional observation noticed
while observing the grading process was the position at which the graders marked defects to be
cut out. Marking defects with chalk too far away from the actual defect causes waste as well,
since the defects are cut at the location of the chalk mark (Figure 21).
There is no documented training program for graders, nor is there a training plan in place
to teach and monitor the state of the EGD grading process. The goal of the inconsistent grading
project is to improve product yields in EGD department through initial grader and reoccurring
training. This will be accomplished by using past yield rates for the EGD department as a base
56
line for determining if establishing a grader training program will improve product yields in the
EGD department. A one week adjustment period is given for training before yield data is
collected and evaluated.
Source: Photo Courtesy of QEP
Figure18: Knot Holes in the Face
57
Source: Photo Courtesy of QEP
Figure 19: Splits in the Face
Source: Photo Courtesy of QEP
Figure 20: Raised Grain in the Face
58
Source: Photo Courtesy of QEP
Figure 21: Chalk Mark Location too far Away from the Actual Defect
Inconsistent Grading Project Details
Two steps were involved in determining the successfulness of the inconsistent grading
project. In step one, since no structured grading program is in place, current production yield
trends in EGD were used as a base line to gage the effects of the newly established grader
training program (Table 12). If successful, an increase in EGD production yields is expected at
or above the goal of 80%. Step two, in order to achieve the largest gain in production yield
possible with minimal effort, the top three most common defects were selected as the focus of
the grader training process (splits, open knots, and raised grain). Although not a defect but still a
contributing cause of yield loss, defect location marking is also included in grader training.
59
Table 12: EGD Panel Yield (6 Month Period Prior to Grader Training)
Inconsistent Grading Project Corrective Actions
Training was accomplished by meeting with all EGD graders to discuss and establish
commonalities in the grading process based on current grading specifications. This process
proved to be very helpful as many of the graders requested, for visual reference, that samples of
defects be run down the pre-finish line and brought back to them to show what defects, if let go,
will meet pre-finish grading specifications and which ones will not.
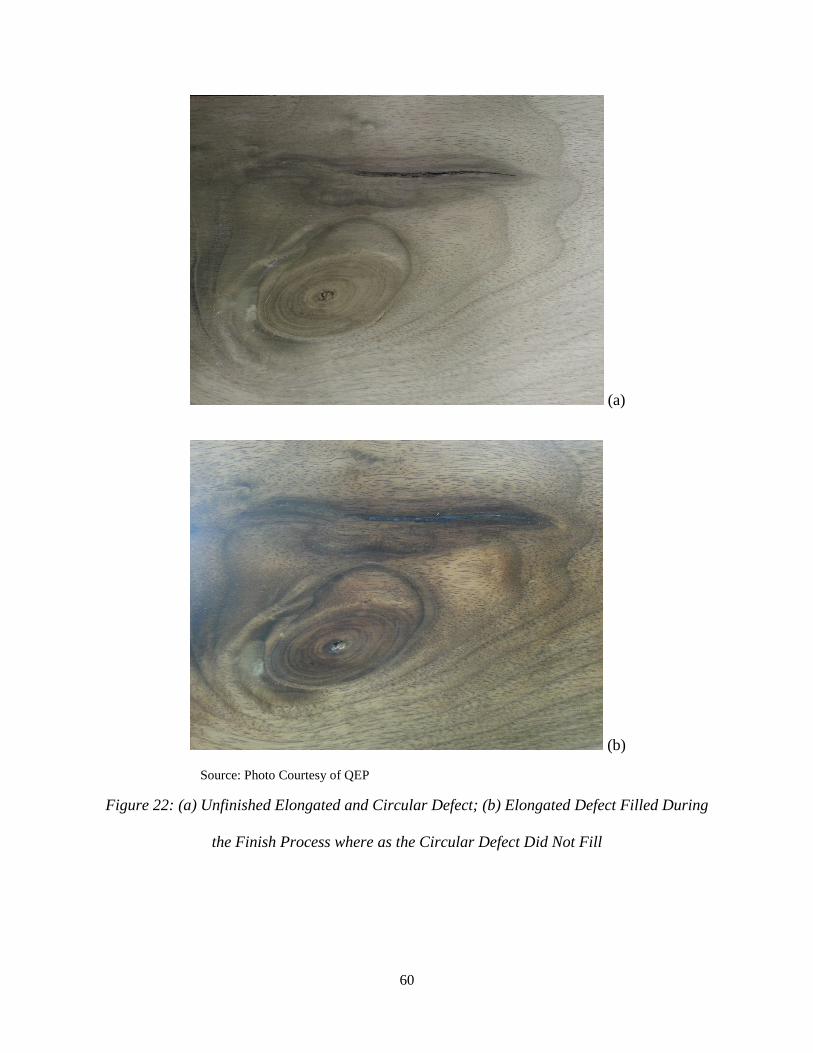
Figures 22 through 24 show common examples of defects that once thought to be too
large to let go, and marked to be defected out, actually meet the minimum pre-finish grading
specifications. In Figures 22 through 24 the upper photo was taken prior to the finishing process
to show the defects as the graders see them, while the lower photo was taken after the finishing
process. These visual samples also serve to help the graders relate visual defects with numeric
size limits.
76.50%
77.00%
77.50%
78.00%
78.50%
79.00%
79.50%
80.00%
80.50%
May-14 Jun-14 Jul-14 Aug-14 Sep-14 Oct-14
Pane
l Yie
lds
in P
erce
nt
EGD Panel Yield
Yield
Yield Goal
60
(a)
(b)
Source: Photo Courtesy of QEP
Figure 22: (a) Unfinished Elongated and Circular Defect; (b) Elongated Defect Filled During
the Finish Process where as the Circular Defect Did Not Fill
61
(a)
(b)
Source: Photo Courtesy of QEP
Figure 23:(a) Unfinished Open Knot Defect;(b) Open Knot Defect Filled During the Finish
Process
62
(a)
(b)
Source: Photo Courtesy of QEP
Figure 24:(a)Unfinished Small Split in the Face;(b) Small Split Filled During the Finishing
Process
63
The grader training process was conducted by meeting with the graders as a group, first
on a weekly basis for 3 weeks, then bi-weekly for another 3 weeks, ending in an ongoing
monthly meeting. Defect sample boards were also built and are used during the grader training
sessions; the sample boards are stored at the grading stations for use as a quick reference
example. These efforts highlighted the fact that grading in EGD is an important job and if not
performed properly can result in waste, low yield, and increased cost. During training meetings,
graders offer input on various situations that others in the group learn from thus bonding the
graders in EGD as a cohesive team that now work together.
Inconsistent Grading Improvement Project Results
In the past, product grading or grader training was not looked at with any serious focus so
historical data for EGD production yields are considered to be a good baseline for past grader
performance. At the completion of the inconsistent grading project, data collected over a
relatively short period of time showed an immediate improvement in EGD panel yield. Overall
panel yield increased on average by 1.7% as shown in Table 13 below. This increase in panel
yield represents a $167,500 dollar savings annually for QEP.
Table 13: EGD Panel Yield Increase of 1.7%
76.00%
77.00%
78.00%
79.00%
80.00%
81.00%
Pane
l Yie
lds
in P
erce
nt
EGD Panel Yield
Yield
Yield Goal
64
CHAPTER 4
BEST PRACTICES
QEP’s Johnson City facility has been in business for over 100 years, and during this time
many established cultures have come and gone. In 2012, at the start of the improvement projects
outlined in this thesis, the culture that existed at QPE limited their ability to become more
productive and provide better quality products, this is because little to no standardized processes
were in place for employees to follow. The lack of these processes, and the fact that product
quality was being maintained by non-traditional methods, did not allow for continuous
improvement opportunities to be realized.
Talking with supervisors and hourly workers at QEP, it become apparent that overall
yields, defect reduction, and product quality could easily be improved; in some areas, as much as
20%. The chip-out project decreased defects by 20.5%, and customer claim payout cost
decreased by 38%. Details of these improvements were established and formally documented as
best practices to follow and improve-upon going forward. These improvements also paved the
way for continuous improvement projects, and the development of a quality control manual.
Best practices are important to a company because it makes known the willingness of the
company to identify deficiencies in their processes and to show what improvements work and are
adopted to overcome these deficiencies. The best practices adopted at QEP and outlined in this
thesis are a culmination of some traditional quality methods as well as standards in use by ISO
9000. A natural step moving forward in the continuous improvement process for QEP is to work
to become ISO 9000 certified. This achievement will establish QEP among many other
companies that have chosen to adopt proven industry standards to operate within.
65
CHAPTER 5
CONCLUSION
While U.S. and World Markets continue to recover from the resent recession, U.S. based
hardwood flooring companies are learning to operate more efficiently in order to stay
competitive in the market place. QEP is one of those companies; through the use of simple but
effective quality tools, QEP developed a strategy to reduce waste, while improving yields and
overall product quality.
The three improvement projects (chip-out, off-color, and inconsistent grading) QEP
initially focused their efforts on proved to be successful in reducing waste, while improving
yields and product quality. These improvement projects also served as stepping stones to future
continuous improvement projects.
From 2008-2010 QEP’s Johnson City Facility averaged 6,700,000 square feet of EGD
flooring sales, in 2014 they sold just under 11 million square feet of EGD flooring, and thus far
for 2015 they are on track to sell at least11 million square feet. QEP is currently securing a deal
with Home Depot to continue to supply innovative flooring designs to over 1,900 of their U.S.
based stores. This is partly due to the confidence Home Depot has in QEP’s ability to supply
quality flooring products at competitive prices.
Limitations
While working on the three improvement projects listed in this thesis, one factor that
continually plays a role in limiting consistent project results is raw materials received for
processing. As wood is a natural grown product, environmental factors such as geographical
66
growing and harvest locations, weather, length of growing seasons, and so on all contribute in
making the raw materials used in manufacturing hard wood flooring anything but consistent.
Unlike man made materials, natural color variation, wood character, fiber structure,
species etc. vary from truck load to truck load. This natural variation continually plays a role in
how flooring will mill and how the materials natural color will affect stains and top coats when
they are applied. As a result of this, consideration is given to all final tests results when
considering variation as a factor to consistent project test results.
Future Recommendations
An observation that was noted in each improvement project was the absence of daily
involvement from department supervisors in the monitoring of manufacturing processes. Efforts
by department supervisors to continually monitor manufacturing processes in order to identify
negative process shifts are needed in order to prevent stagnation of continuous improvement
ideas as well as employee motivation.
Setting monthly, bi-monthly and/or even quarterly manufacturing improvement goals,
starting with easily achievable goals in order to show initial improvement, is a valuable tool in
motivating employees to continuously strive to improve processes. Employees who perform
daily manufacturing tasks are in the best position to make improvement suggestions. Offering
rewards for improvement suggestions can have a positive impact on sustained continuous
improvement and employee motivation with-in departments. Daily supervisor involvement can
play a significant role in continuous improvement out comes with-in departments and should be
exploited to the fullest extent possible.
67
BIBLIOGRAPHY
Catalina Report, 2014. Executive summary, Section 1, US Wood Flooring Industry Trends, Pg. 1 http://c.ymcdn.com/sites/member.nwfa.org/resource/resmgr/Docs/CatalinaReport_April2014.pdf Retrieval date: October 2014.
Harris Wood, 2015. Harris Wood History http://www.harriswoodfloors.com/company.php?s=history. Retrieval date: January 2015.
Berardinelli, Carl F. 2012 November. Quality Progress, Back to the Basics, To DMAIC or not to DMAIC. http://asq.org/quality-progress/2012/11/back-to-basics/to-dmaic-or-not-to-dmaic.html. Retrieval date: December 2014.
Tague, Nancy R., 2005. The Quality toolbox, Second Edition, ASO Quality Press, pages 247-249.
National Wood Flooring Association Technical Publication No. A100, 1996. Water and Wood, How Moisture Affects Wood Flooring, page5. https://c.ymcdn.com/sites/member.nwfa.org/resource/resmgr/tech_chapters/water_and_wood.pdf?hhSearchTerms=%22Wood+and+Flooring+and+Moisture+and+Content%22. Retrieval date: February 2015.
National Wood Flooring Association, 2015. NWFA/NOFMA Grade Photos. http://www.nwfa.org/nofma-grade-photos.aspx. Retrieval date: December 2014.
ASTM4442-92, American Society for Testing and Materials, 2003. Standard Test Method for Direct Moisture Content Measurement of Wood, and Wood-Based Materials, Pages 507-509. http://law.resource.org/pub/us/cfr/ibr/003/astm.d4442.1992.pdf. Retrieval date: December 2014.
Hunter L,a,b Color Scale, Insight on color, vol.8, no. 9, 2008. http://www.hunterlab.se/wp-content/uploads/2012/11/Hunter-L-a-b.pdf. Retrieval date: February 2015.