Cloud of Science. 2015. Volume 2. Issue 3 http://cloudofscience.ru ISSN 2409-031X 419 Using Big Data for the Optimization of Internal Supply Chains of Multinational Companies I. Tikhonov Bauman Moscow State Technical University Baumanskaya 2-ya, 5, Russia, Moscow, 105005 e-mail: [email protected]Abstract. In the modern global economy the rise of globalization accentuates the problems of effective management of international companies. The models of after tax profit maximization are widely studied. There are several ap- proaches to this problem. We point out their shortcomings and propose an approach based on the graph of production and logistics system of the com- pany. This approach of model formation allows to generate models for com- panies with any number of stages and with any number of distribution cen- ters in the supply chain. We showcase the platform on which the future model can be realized. Key words: optimization of internal supply chains, multinational company, transfer prices, decomposition of subsidiaries, volume of data, Hadoop, SAP HANA. 1. Introduction One of the main trends in the global economy is the rise of globalization, which grows faster than global GDP. One of the artifacts of such trens is that small and medi- umsized companies are entering foreign markets. There are many multinational compa- nies. A characteristic feature of multinational companies is the desire to increase profits by means of differences in the legislation of different countries and different tax rates. Although tax authorities carefully monitor financial flows, they leave a small gap for var- ying of prices so that it is possible to increase profits. Currently the issues of optimization of logistics and taxation are solved sequentially. Firstly, linear problem of minimizing the production and logistics costs is solved with the help of one of the APS from SAP, Oracle, JDA, or other vendors, , and then through vari- ation of transfer prices profits are maximized for the scheme of trade flows with the help of the Global Tax Planning THOMPSON REUTERS product or through in-house devel- opment consulting companies. The result of such optimization is not optimal. In most cases the maximum profit is located outside the range of values of the parameters of the logistics and production prob- lems, ensuring a minimum cost. Only when optimizing trade flows and transfer prices simultaneously, it is possible to find the case of a supply chain which will provide the maximum profit.
Transcript
Cloud of Science. 2015. Volume 2. Issue 3 http://cloudofscience.ru
ISSN 2409-031X
419
Using Big Data for the Optimization of Internal Supply Chains of Multinational Companies
I. Tikhonov
Bauman Moscow State Technical University Baumanskaya 2-ya, 5, Russia, Moscow, 105005
Abstract. In the modern global economy the rise of globalization accentuates the problems of effective management of international companies. The models of after tax profit maximization are widely studied. There are several ap-proaches to this problem. We point out their shortcomings and propose an approach based on the graph of production and logistics system of the com-pany. This approach of model formation allows to generate models for com-panies with any number of stages and with any number of distribution cen-ters in the supply chain. We showcase the platform on which the future model can be realized. Key words: optimization of internal supply chains, multinational company, transfer prices, decomposition of subsidiaries, volume of data, Hadoop, SAP HANA.
1. Introduction
One of the main trends in the global economy is the rise of globalization, which
grows faster than global GDP. One of the artifacts of such trens is that small and medi-
umsized companies are entering foreign markets. There are many multinational compa-
nies. A characteristic feature of multinational companies is the desire to increase profits
by means of differences in the legislation of different countries and different tax rates.
Although tax authorities carefully monitor financial flows, they leave a small gap for var-
ying of prices so that it is possible to increase profits.
Currently the issues of optimization of logistics and taxation are solved sequentially.
Firstly, linear problem of minimizing the production and logistics costs is solved with the
help of one of the APS from SAP, Oracle, JDA, or other vendors, , and then through vari-
ation of transfer prices profits are maximized for the scheme of trade flows with the help
of the Global Tax Planning THOMPSON REUTERS product or through in-house devel-
opment consulting companies.
The result of such optimization is not optimal. In most cases the maximum profit is
located outside the range of values of the parameters of the logistics and production prob-
lems, ensuring a minimum cost. Only when optimizing trade flows and transfer prices
simultaneously, it is possible to find the case of a supply chain which will provide the
maximum profit.
I. Tikhonov
Using Big Data for the Optimization of Internal
Supply Chains of Multinational Companies
420
The urgency of the problem is underlined by many authors, particularly by professor
Tan Miller (Rider University, USA) and Renato de Matta (University of Iowa, USA): the
Encyclopedia of Business Analytics and Optimization for 2014 under the editorship of
John Wang (Montclair State University, USA):
«We believe that the implementation of global profit maximization models repre-
sents a potentially significant unrealized opportunity worthy of serious consideration by
many firms. This methodology remains heavily underutilized in private industry. Further,
as previously noted, the investment and resources required to develop this capability
within a firm are relatively modest, and the potential return on investment is extremely
high.» [1].
2. Mathematical model
2.1. Models development history
The first formulation of the mathematical problem of optimization of global supply
chain that maximized the after tax profit of multinational company was offered by
L. Nieckels in 1976 [2]. Optimization was implemented by means of varying trade flows
between subsidiaries and also by varying of the transfer prices. The formulated model had
several assumptions. That is, it was assumed that the multinational company has a central
distribution center from which all products are transported to subsidiaries. Bill of Materi-
als (BOM) which quantified the use of raw materials for the production of finished prod-
ucts was not included in the model, and transportation costs were always allocated to the
customer.
The first model, which takes into account the variety of existing multinational com-
panies, was proposed by C. J. Vidal and M. Goetschalckx in 2001 [3]. In the model the
problem of maximization of the global after tax profit was formulated, the possibility of
supply of raw materials from external global suppliers was realized, cost of inventories
was considered, and the possibility of allocation of transportation costs between the par-
ticipants of the supply chain was also provided. This model also considers terms of trans-
actions, defined as INCOTERMS, and provides various options for the transfer pricing.
The model considered cases when duties were paid on FOB (free on board) and CIF (cost
insurance and fright) values. The model was formulated as a bilinear problem with linear
objective function.
Model [3] has become the framework for many articles. In 2008 S. Perron, P. Han-
sen, S. Le Digabel and N. Mladenovic [4] proposed a new formulation of the problem.
They managed to reduce about 65% of the bilinear constrains. That resulted in reduction
of calculation time and thus the possibility of dealing with models of increased dimen-
sion. In [5] the model [4] has been modified in order to take into account the present Rus-
BIG DATA AND CLOUD COMPUTING TECHNOLOGY
Cloud of Science, 2(3), 2015
421
sian economy taxation, VAT, MET and export duties. In [6], the authors informed that on
the basis of the model presented in [3] they developed a model for multinational compa-
nies that perform two stages: firstly, the production of semifinished products from raw
materials, and then the production of finished products from semi-finished products. Un-
fortunately, the mathematical description of this model was not presented because of its
large volume.
In 2008 T. Miller and R. de Matta [7] presented a bilinear model of maximization of
the global after tax profits of multinational companies, which allows to determine the op-
timal strategy of the production, distribution and procurement plans and also the values of
the transfer prices. The model takes into account taxes and exchange rates in each coun-
try, as well as the valid ranges of transfer prices. The disadvantage of this model is that
the unit of planning is a country, not a single plant or distribution center. For big coun-
tries like Russia, China, USA, Canada, the definition of the transportation price without
being tied to the actual location of the plant leads to significant errors. Due to the absence
of efficient methods of solving large-scale bilinear problems, in order to apply the model
in practice, the authors offered several assumptions and approximated the model, ob-
tained as a result a linear model. Later on, in [8], the authors proposed a method of solv-
ing the bilinear problems, but didn’t overcome the detail at the country level, so the key
problem was not solved.
2.2. Disadvantages of the existing approaches of formulation of models
In all the presented models rigid system of sets and indices was used so that the flow
of goods was allowed in one direction only: from suppliers to manufacturing plants, from
plants to distribution centers of finished products and from the centers to the market(1
stage). If there are two stages in the production chain then one more echelon of distribu-
tion centers and one more echelon of plants are added. However, in practice there are
many other options of production and logistics scheme:
Iron and steel companies are three stage production (production of iron, pro-
duction of steel, rolled products). The gas chemistry includes even bigger
number of process stages.
There are companies who have mixed production: Part of finished products
are produced and sold to customers by one-stage scheme, and the other part
by two-stage scheme.
In some chains there are not one, but two or more echelons of distribution
centers between different stages or between plants and consumers. For ex-
ample, in a sea port on the side of the manufacturer and in another sea port
on the side of the market area.
I. Tikhonov
Using Big Data for the Optimization of Internal
Supply Chains of Multinational Companies
422
Shipment of goods to the factory of the next stage or market area can be
made directly from the factory, without any intermediate distribution cen-
ters.
In some companies and industries there may be peculiarities of logistic scheme that
require:
Return of consumer goods which exhausted their resources and their recy-
cling, as we see today in many countries for tires and batteries.
Return to company FMGS from which consumers rejected after purchase.
Suggested approach of formulation models.
We propose to step away from the rigid system of sets and indices in the definition
of a model and to base it on the graph of production and logistics system of the company.
As in the models [3–6] we use four types of objects: Supplier, Manufacturing Factory,
Distribution Centre, Customers (market area) and transport routes between these ele-
ments. Notation used in Fig. 1.
Figure 1. Notation
Each element in the notation matches a different set of constraints taking into ac-
count all incoming and outgoing transportation routes:
For external suppliers: production capacity.
For domestic suppliers: financial balance, capacity , the allocation of trans-
portation costs.
For plants: the financial balance, material balance and capacity, the distribu-
tion of transportation costs.
For Distribution Centers: fiscal balance, material balance and capacity, limit
the amount and distribution of transportation costs.
For clients: amount of consumption.
To transport routes: throughput.
The approach of model formation that is based on graph of production and logistic
schemes allows to generate models for companies with any number of stages and with
any number of distribution centers in the supply chain. It is also possible to take into ac-
BIGDATAANDCLOUDCOMPUTINGTECHNOLOGY
Cloud of Science, 2(3), 2015
423
count the horizontal movement of goods between DCs of one echelon and the adjacent ones. Overlay of the objects C and S in a graph and the possibility to specify the orienta-tion of the reverse transportation routes will allow to optimize the activities of the enter-prises, considering the return of goods and recycling of overage products.
Another distinguishing feature of the proposed approach is the use of decomposition of subsidiaries in the model. In previous publications [3–8] each subsidiary was consid-ered as a whole entity. Expected profit was received from the perspective accounting bal-ance. We propose to distinguish for each supplier, plant, distribution center several ele-ments, depending on their functions, and to compute total profit on prospective data of controlling. Examples of the decomposition are presented in Fig. 2.
Figure 2. Examples 1–3 decomposition subsidiaries
In the first example in Fig. 2 the supplier company was decomposed into an actual
supplier and a DC of raw materials, from which a shipment is made. In the Example 2 the plant is decomposed into a plant, two DCs of input of raw materials of different groups and three DCs of output for finished products of different groups.
Separation of DCs by groups of products must be carried out on the basis of actual different storage conditions, methods of loading and unloading, storage options for vari-ous types of products in the DC, adapted for the production of another group. According-ly, the constrains should be taken into account for each DC, such as storage capacity, fixed and variable costs, and DCs capacity for receiving and shipping. In the third exam-ple in Figure 1 Distribution Centre was decomposed into three independent DCs. The number of independent DCs for decomposition, can be quite big. For example, a regional Terminal of an Oil Company contains DCs for motor gasoline, diesel fuel (dark petrole-um), aviation fuel, DC for oil supplied in bulk and DC for containers.
More sophisticated examples of decomposition are presented in Fig. 3. In the fourth example shown in Fig. 3, the following subsidiary is a two-stage pro-
duction. At first manufacturing plant MP1 processes raw materials coming from DC1 and DC2 and sends the production to DC3, DC4 and DC5. And then an independent plant MP2 (or group of plants) processes products from the warehouse DC3 into a new product, which is sent to the warehouse DC6. In general capacity of MP2 does not depend on the
I. Tikhonov
Using Big Data for the Optimization of Internal Supply Chains of Multinational Companies
424
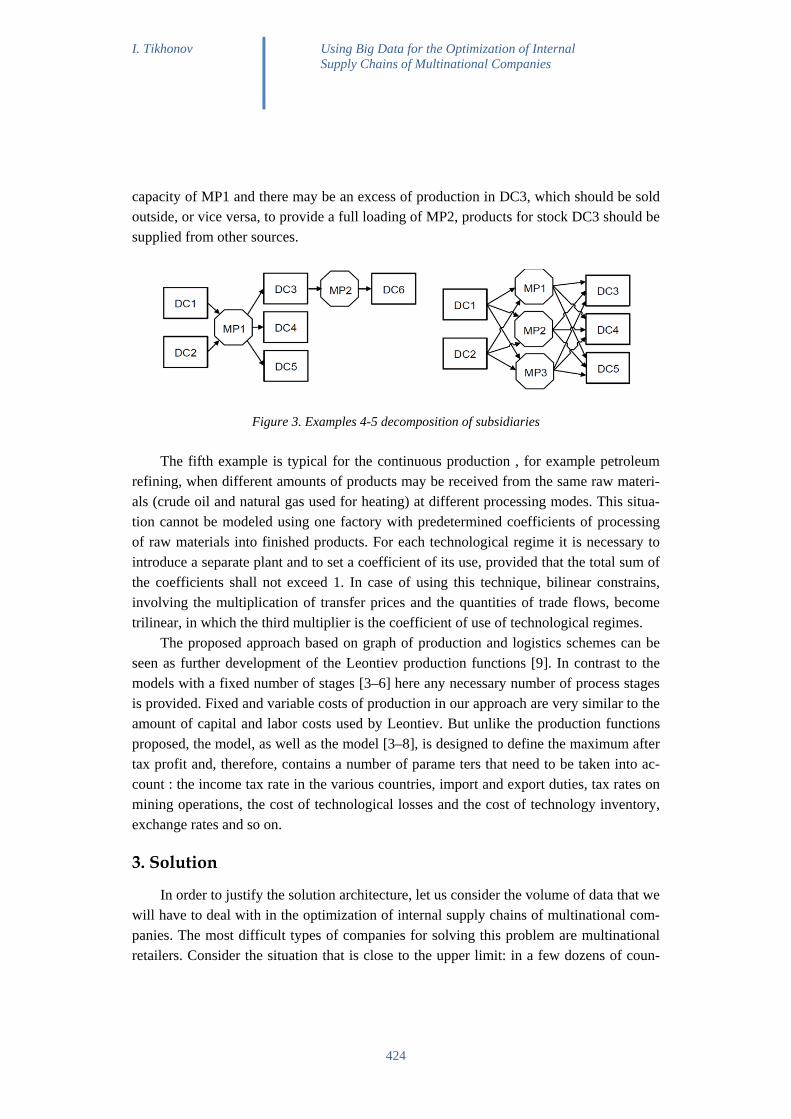
capacity of MP1 and there may be an excess of production in DC3, which should be sold outside, or vice versa, to provide a full loading of MP2, products for stock DC3 should be supplied from other sources.
Figure 3. Examples 4-5 decomposition of subsidiaries
The fifth example is typical for the continuous production , for example petroleum
refining, when different amounts of products may be received from the same raw materi-als (crude oil and natural gas used for heating) at different processing modes. This situa-tion cannot be modeled using one factory with predetermined coefficients of processing of raw materials into finished products. For each technological regime it is necessary to introduce a separate plant and to set a coefficient of its use, provided that the total sum of the coefficients shall not exceed 1. In case of using this technique, bilinear constrains, involving the multiplication of transfer prices and the quantities of trade flows, become trilinear, in which the third multiplier is the coefficient of use of technological regimes.
The proposed approach based on graph of production and logistics schemes can be seen as further development of the Leontiev production functions [9]. In contrast to the models with a fixed number of stages [3–6] here any necessary number of process stages is provided. Fixed and variable costs of production in our approach are very similar to the amount of capital and labor costs used by Leontiev. But unlike the production functions proposed, the model, as well as the model [3–8], is designed to define the maximum after tax profit and, therefore, contains a number of parame ters that need to be taken into ac-count : the income tax rate in the various countries, import and export duties, tax rates on mining operations, the cost of technological losses and the cost of technology inventory, exchange rates and so on.
3. Solution
In order to justify the solution architecture, let us consider the volume of data that we will have to deal with in the optimization of internal supply chains of multinational com-panies. The most difficult types of companies for solving this problem are multinational retailers. Consider the situation that is close to the upper limit: in a few dozens of coun-
BIG DATA AND CLOUD COMPUTING TECHNOLOGY
Cloud of Science, 2(3), 2015
425
tries about 100 subsidiaries can be located, the number of items in such a network could
reach 2 × 10⁵. In this case, there could be about 1000 transport routes between 100 com-
panies in the logistics network. We take into account only the most significant ones for
the evaluation. For each possible route we need four variables: the transfer price, the val-
ue of goods traffic and distribution of transport costs between the location and the desti-
nation, as well as one column in the matrix is needed for the product of transfer price and
trade flow. When planning for one year, divided by weeks, we need more than
52 × 5 × 103 × 2 × 10
5 ≈ 5 × 10
10 columns. Furthermore, we have not yet taken into ac-
count the variables to represent the capacity of each product in each DC, the production
capacity for each product at each plant, and other less significant variables according to
their quantitative value. As a result, the matrix needed to represent the data has more than
1021
terms (5 × 10¹⁰
columns and about 2 × 10¹⁰
rows).
It will take at least 8 × 10²¹
bytes (8 ZB) to store such a matrix in the standard form.
Storage in the form of special sparse matrix will reduce the memory requirements, but
each non-zero element requires twice as much memory because except for the value it
needs to keep two indices. Due to the fact that the model is based on the year divided into
weeks, the matrix has a block structure. The number of filled blocks is 1/52 ≈ 0.02.
When the non-empty block filled by 1% , the required amount of memory to repre-
sent the matrix is 3.2 EB.
In large multinational oil companies, the number of items is much smaller, such as
104, but the number of subsidiaries in them often exceeds 1000. Accordingly, the number
of possible transportation routes could reach 104 or more. So we get approximately the
same memory requirements as in the case of large multinational retailers.
For smaller companies that are not leaders in the industry, significantly less memory
to represent the model may be required, and, thus, a smaller cluster. But it does not mean
that , we do not need to take into account the limiting options when developing the mod-
el.
The solution for optimization of internal supply chains for large multinational com-
panies requires processing power and memory capacity which are on the limit of modern
equipment. At the same time, to be widely distributed as a corporate application the pre-
sented solutions should be created on the technology platform, which has wide distribu-
tion in the market. This will allow to remain in the sphere of massively used decision-
making product in the companies without needing to present solutions focused on the
unique supercomputers. The only technology platform which is used in the corporate en-
vironment and which is able to provide the necessary technical characteristics is Hadoop.
Algorithm and technical solutions to be applied for bilinear and trilinear optimiza-
tions using Hadoop clusters are discussed in more detailed report of D. S. Lakhvich pre-
sented at the same conference.
I. Tikhonov
Using Big Data for the Optimization of Internal
Supply Chains of Multinational Companies
426
Nowadays the limit that can be achieved in distributed cluster of Hadoop, with up to
105 physical nodes, each of which is an 8-processor server based on Intel Xeon. In each
such server up to 12 TV and 16 RAM HDD 2.5 "4 TV can be set. Each processor con-
tains 15 cores. In general, such a configuration would contain 12 × 106 processor cores
and 6.4 EB of memory. It is approximately a 1000 times more by number of processor
cores and a 5,000 times more by amount of memory than the maximum configuration of
SAP HANA used in practice [10].
To reduce the cost of future operation, the solution needs to be integrated into the
general architecture of the corporate system. It is recommended that the data is gathered
in the model from functional ERP and SCM systems, then the optimization problem is
solved, and the result is sent back to ERP and SCM systems for the realization of the re-
sulting optimal plan. The most common enterprise applications for large companies in the
world are business application SAP. This was the justification that in the future develop-
ing solutions should be integrated with SAP ERP SAP APO.
Architects recommend not to integrate directly with SAP business applications com-
ponents implemented on Hadoop, but integrate through SAP HANA [11]. In our case, the
use of SAP HANA to form a model is waranted due to another reason: as a result of de-
composition of the structure of subsidiaries, the total production and logistic scheme used
to build the model differs from the one that is in the ERP and APO. In order not to decide
on the early stages the labor-intensive task of integration, it is decided to develop a sepa-
rate application that allows to construct the model and to perform calculations. After sev-
eral successful implementations and confirmation of economic efficiency of the proposed
solution, it will be possible to consider the development of integration tools. The overall
architecture of the developed solutions is presented in Fig. 4.
PC
SAP HANA Enterprise Cloud
Таблицы
Da
ta
Таблицы
Data tables showing the
structure of the
mathematical model
Data tables for
calculating
Hadoop cluster
SAP ERP
SAP APO
Internal data tables
Sqoop
...
...
...
Internal data tables
Figure 4. The architecture of the developed solutions integrated with SAP business applications
BIG DATA AND CLOUD COMPUTING TECHNOLOGY
Cloud of Science, 2(3), 2015
427
In the case of simulation of very large companies, if the amount of memory in SAP
HANA is not sufficient to represent all of the data, the model can be formed and transmit-
ted to Hadoop in parts.
Reference
[1] Miller T., de Matta R. (2014) Profit Maximization Modeling for Supply Chain Planning. En-
cyclopedia of Business Analytics and Optimization. John Wang (Ed.). 5 Volumes. IGI Global,
pp. 1910–1921. Doi: 10.4018/978-1-4666-5202-6.
[2] Nieckels L. (1976) Transfer Pricing in Multinational Firms: A Heuristic Programming Ap-
proach and a Case Study. New York: John Wiley.
[3] Vidal C. J., Goetschalckx M. (2001) A global supply chain model with transfer pricing and
transportation cost allocation. European Journal of Operational Research, 129:134–158.
[4] Perron S., Hansen P., Le Digabel S., Mladenovic N. (2008) Transfer Pricing in a Global Sup-
ply Chain. GERAD, G–2008–17.
[5] Sukhobokov A. A. (2009) Issledovanie i razrabotka modelej i arhitektury sredstv kontrol-linga
dlja mezhregional'nyh predprijatij v sostave sistem klassa ERP II. PhD Thes. MGTU Bauma-
na, 2009. (In Rus)
[6] Goetschalckx M., Vidal C. J., Hernández J. I. (2012) Measuring the impact of transfer pricing
on the configuration and profit of an international supply chain: perspectives from two real
cases. Congreso Latino-Iberoamericano de Investigacion Operativa, Simposio Brasileiro de
Pesquisa Operacional. Rio de Janeiro, Brazil, pp. 1659–1669.
[7] Miller T., de Matta R. (2008) A global supply chain profit maximization and transfer pricing
model. Journal of Business Logistics, 29(1):175–199.
[8] Miller T., de Matta R. (2015) Formation of a strategic manufacturing and distribution network
with transfer prices. European Journal of Operational Research, 241(2, 1): 435–448.
[9] Danilov N. N., Inozemceva L. P. Osnovy matematicheskoj jekonomiki. Uchebnik po ma-
tematicheskoj jekonomike s teoriej i zadacham. http://www.math.kemsu.ru/kmk/subsites
/matekon/zaglav.html
[10] Sukhobokov A.A Lakhvich D.S (2015) Impact tools BigData on the development of scientific
disciplines related to the simulation. // Science and Education. MSTU N. E. Bauman, 3:207–
240. http://technomag.edu.ru/doc/761354.html (In Rus)
[11] Burdett D., Tripathi R. (2013) CIO Guide. How to Use Hadoop with Your SAP® Software
Landscape. SAP AG. URL: http://hortonworks.com/wpcontent/uploads/2013/09/
Аннотация. Рост современной мировой экономики способствует появле-нию мультинациональных компаний. Такие компании стремятся увели-чить свою прибыль, что требует эффективного управления, в том числе и в трансфертном ценообразовании. Существует множество подходов увеличения прибыли мультинациональных компаний после уплаты налогов, но все они имеют описанные в статье недостатки. В статье пред-лагается новый подход оптимизации, основанный на графе производ-ственно-логистической схемы компании. Этот подход позволяет генери-ровать модели для компаний с любым количеством переделов и с любым количеством распределительных центров в цепочке поставок. В статье описана платформа, позволяющая реализовать этот подход. Ключевые слова: оптимизация внутренних цепочек поставок, мультинаци-ональные компании, трансфертные цены, декомпозиция дочерних ком-паний, Big Data, Hadoop, SAP HANA.
Литература
[1] Miller Т., de Matta R. Profit Maximization Modeling for Supply Chain Planning // Encyclo-
pedia of Business Analytics and Optimization. 5 Vol. — IGI Global, 2014. P. 1910-1921.
[2] Nieckels L. Transfer Pricing in Multinational Firms: A Heuristic Programming Approach and
a Case Study. — New York: John Wiley, 1976.
[3] Vidal C. J., Goetschalckx M. A global supply chain model with transfer pricing and transpor-
tation cost allocation // European Journal of Operational Research. 2001. Vol. 129. No. 1.
P. 134–158.
[4] Perron S., Hansen P., Le Digabel S., Mladenovic N. Transfer Pricing in a Global Supply
Chain // GERAD, G–2008–17, February 2008.
[5] Сухобоков А. А. Исследование и разработка моделей и архитектуры средств контрол-
линга для межрегиональных предприятий в составе систем класса ERP II : дисс. …
канд. техн. наук. — М. : МГТУ им. Баумана, 2009.
[6] Goetschalckx M., Vidal C. J., Hernández J. I. Measuring the impact of transfer pricing on the
configuration and profit of an international supply chain: perspectives from two real cases //
BIG DATA AND CLOUD COMPUTING TECHNOLOGY
Cloud of Science, 2(3), 2015
429
Congreso Latino-Iberoamericano de Investigacion Operativa, Simposio Brasileiro de Pesquisa
Operacional — Rio de Janeiro, Brazil, 2012, pp. 1659–1669.
[7] Miller T., de Matta R. A global supply chain profit maximization and transfer pricing model //
Journal of Business Logistics. 2008. Vol. 29. No. 1. P. 175–199.
[8] Miller T., de Matta R. Formation of a strategic manufacturing and distribution network with
transfer prices // European Journal of Operational Research. 2015. Vol. 241. No. 2, 1.
P. 435–448.
[9] Данилов Н.Н., Иноземцева Л.П. Основы математической экономики: учебник по мате-
матической экономике с теорией и задачами [Электронный ресурс]