Using Capital Markets as Market Intelligence: Evidence from the Pharmaceutical Industry Dmitri G. Markovitch, Joel H. Steckel and Bernard Yeung * March 3, 2005 Fifth Submission to Management Science * Dmitri G. Markovitch is Assistant Professor, Marketing Department, HEC School of Management, 1, rue de la Libération, 78351 Jouy en Josas cedex, France, Ph. 33.1.39.67.73.06, Fax 33.1.39.67.70.87, [email protected]. Joel H. Steckel is Professor, Marketing Department, Leonard N. Stern School of Business, New York University, Ph. 212-998-0521, Fax 212-995-4006, [email protected]. Bernard Yeung is Abraham Krasnoff Professor of Global Business, Economics and Strategy/Management, Leonard N. Stern School of Business, New York University, Ph. 212-998-0425, Fax 212-995-4221, [email protected]. The authors thank Peter Golder, Russell Winer, Daniel Wolfenzon, two anonymous reviewers and a Management Science Associate Editor for their helpful comments.
Transcript
Using Capital Markets as Market Intelligence: Evidence from the Pharmaceutical Industry
Dmitri G. Markovitch, Joel H. Steckel and Bernard Yeung*
March 3, 2005
Fifth Submission to Management Science
* Dmitri G. Markovitch is Assistant Professor, Marketing Department, HEC School of Management, 1, rue de la Libération, 78351 Jouy en Josas cedex, France, Ph. 33.1.39.67.73.06, Fax 33.1.39.67.70.87, [email protected]. Joel H. Steckel is Professor, Marketing Department, Leonard N. Stern School of Business, New York University, Ph. 212-998-0521, Fax 212-995-4006, [email protected]. Bernard Yeung is Abraham Krasnoff Professor of Global Business, Economics and Strategy/Management, Leonard N. Stern School of Business, New York University, Ph. 212-998-0425, Fax 212-995-4221, [email protected]. The authors thank Peter Golder, Russell Winer, Daniel Wolfenzon, two anonymous reviewers and a Management Science Associate Editor for their helpful comments.
Using Capital Markets as Market Intelligence: Evidence from the Pharmaceutical Industry
Abstract
Financial theory posits that capital markets convey through stock prices their expectation of the
firm’s future performance. We use concepts from Principal-Agent Theory and Prospect Theory to provide
a theoretical explanation for the role stock price variation plays in managerial decision-making. We then
empirically investigate what specific decisions managers undertake in response to stock price variation.
We perform our empirical analyses in the context of the pharmaceutical industry. We find that drug firms
whose stock under-performed the industry react differently than drug firms with high performing stocks.
Specifically, laggards tend to implement more changes to their current product portfolio and distribution
than high performing firms. And, the more laggards under-perform, the more they implement acquisitions
aimed to produce immediate improvement in the firm’s product portfolio. In contrast, drug firms whose
stocks out-perform the industry tend to make fewer changes to their current portfolio and distribution.
Instead, they focus more on long-term R&D and marketing of existing products. We interpret these
findings in light of industry key success factors.
Wyeth “has many issues to resolve before it can realize… bright future, Essner [Wyeth’s Executive VP] admits. He lists the following: remaining an independent company, settling the diet-drug litigation, attracting good people, and maintaining stock performance at the top.” (Pharmaceutical Executive 2000, p.68). 1. Introduction
Just as viewers of the evening news perceive changes in major stock indices, such as the Dow
Jones Industrial Average, as information about the overall health of the U.S. economy, so firms may use
changes in their stock price to make inferences about their health. Indeed, under the assumption of
investor rationality, the value of a firm’s equity (or stock price, if expressed in per share terms) is the
expected sum of its appropriately discounted cash flows.
In theory, the relationship between current stock price and future earnings implies that stock
valuations play an important informational role. Specifically, capital markets convey through stock price
their expectation of a firm’s future prospects given that firm’s current and anticipated strategies
(Rappaport 1998). For example, an increase in a firm’s stock price indicates that the market believes that
its strategies are likely to be successful. Similarly, a stock price decrease suggests smaller cash flows than
previously expected.
This paper extends current literature by examining whether and how firms use stock prices in
making marketing decisions. Specifically, we make the following two contributions. First, we use
concepts from Principal-Agent Theory and Prospect Theory to provide a theoretical explanation for the
role stock price variation plays in managerial decision-making. Second, we empirically investigate
specific predictions from this theory about what specific decisions (if any) managers undertake in
response to stock price variation.
We perform our empirical investigations in the context of the pharmaceutical industry. Unlike
larger firms in other industries, modern pharmaceutical firms derive the bulk of their revenues from sales
from the same product categories. In this respect, pharmaceutical firms constitute a meaningful
reference group for each other in terms of stock price performance and marketing decisions. Moreover,
key success factors in this industry are well understood. They are new product development and intensive
1
marketing, including brand building, detailing, and promotion (e.g., A.T. Kearney, Inc. 1999; Best
Practices, LLC 2000). Therefore, pharmaceutical firms can use these success factors to better interpret
signals from the stock market.
This study reveals that, on average, drug firms whose stock under-performed the industry average
react differently than drug firms with high performing stocks. Specifically, laggards tend to implement
more changes to their current product portfolio and distribution than high performing firms. And, the
more laggards under-perform, the more likely they are to make acquisitions aimed at producing
immediate improvement in the firm’s product portfolio. In contrast, drug firms whose stock out-
performed the industry tend to make fewer changes to their current portfolios and distribution networks.
Instead, they focus more on long-term R&D and marketing existing products.
The rest of this paper is organized as follows. First, we review relevant literatures that examine
the informational content of stock prices and the relationship between stock prices and marketing actions.
Next, we present our theoretical framework and develop specific hypotheses that we empirically address
in the context of the pharmaceutical industry. We conclude by summarizing results, pointing out
limitations, and suggesting directions for future research.
2. Literature Review 2.1. Stock Prices as Indicators of Firm Value
The efficient market hypothesis (EMH) states that stock prices fully reflect all publicly available
information and are unbiased indicators of firm value (Fama 1976). Although the debate over the extent
of market efficiency continues (e.g., Barberis and Thaler 2003), the EMH largely survives the criticisms
leveled at it over the past three decades (e.g., Fama 1991). Overall, the extant body of research seems to
indicate that U.S. capital markets are “very efficient” (Bodie et al. 2002, p. 374). Even critics of market
efficiency find that, whereas the broad market can have pockets of inefficiency, most individual stocks
are efficient (e.g., Jung and Shiller 2002). Thus, to the extent that stock prices accurately reflect future
cash flows, they can serve a vital economic function by providing feedback when they change in response
to firm actions.
2
2.2. The Stock Market’s Reaction to Marketing Actions
Considerable research has investigated stock market reactions to marketing actions. In particular,
the market reacts favorably to new branding initiatives. However, evidence with respect to new product
activity is mixed.
Branding initiatives that elicit a positive reaction from the stock market include company name
changes (Horsky and Swyngedouw 1987), increases in customer service (Nayyar 1995), winning a quality
award (Hendricks and Singhal 1996), the use of celebrity endorsers (Agrawal and Kamakura 1995) and
corporate Olympic sponsorship (Miyazaki and Morgan 2001). Moreover, the market exhibits a positive
reaction to improvements in a firm’s customer-based brand equity, as evidenced in improved customer
quality perceptions (e.g., Aaker and Jacobson 1994), and brand attitude (Aaker and Jacobson 2001).
Past research also finds that the stock market displays a mixed reaction to announcements of new
product introductions, depending on the industry and innovation characteristics. Specifically, Chaney at
al. (1991) report that the value of a new product announcement is greatest for the most technologically
based industries, including pharmaceuticals. Additionally, more recent research shows that investor
reaction to new product introductions grows over time as useful information becomes available after
product launch (Pauwels et al. 2004).
In related research, Lane and Jacobson (1995) find that the stock market’s response to brand
extension announcements depends on brand attitude and familiarity. These authors find the stock market
reacting positively to extensions of brands in the food industry that are either both well-regarded and
well-known or both relatively poorly regarded and unknown. However, leveraging brands with disparate
levels of brand attitude and familiarity does not significantly help the firm’s stock price.
In their investigation of the stock market’s reaction to marketing actions, Mizik and Jacobson
(2003) report that the stock market, in general, reacts favorably to firms’ shifting their strategic emphasis
from value creation (i.e. innovation and product development activities) to value appropriation (i.e.
extracting profits in the marketplace through more intensive product marketing). However, this result is
moderated by the firm’s past financial performance, the past level of its strategic emphasis, and industry
3
characteristics. With respect to high-tech industries, such as pharmaceuticals, Mizik and Jacobson find
that the stock market reacts favorably to value appropriation when firms have strong profitability. That is,
firms that have successful products on the market are encouraged to put greater emphasis on extracting
profits from their innovations.
In sum, this research collectively demonstrates that marketing actions impact stock prices. Our
focus, though, is the reverse. We are concerned with how stock prices impact marketing actions.
3. Theoretical Framework
Our general thesis is that managers would look to stock market returns for information, actively
respond to that information, and respond differently depending on whether the information represented
“good news” or “bad news.” Therefore, in developing our theoretical framework we draw from three
literature streams. The first stream, the informational content of stock returns, explains why managers
would use stock returns in their decision making. The second stream, Principal-Agent Theory, describes
the mechanism that makes managers responsive to changes in stock price. The third stream, Prospect
Theory, helps explain why managers of firms with high-performing stocks react differently to stock
returns than managers of firms with lagging stocks.
3.1. Stock Returns as Market Intelligence
Given market efficiency, one would expect that stock prices incorporate all available information
(Fama 1976, 1991), where informed risk arbitrageurs actually uncover important information that affects
firm value, and their trading impounds such public and private information into stock prices (Grossman
and Stiglitz 1980; Shleifer and Vishny 1997). Specifically, this mechanism works as follows. Over time,
investors acquire firm-related information. Assuming no “memory” loss, we can argue that the
information set available to market participants at time t+1 includes the information set available to them
at time t plus newly available information. Change in the investors’ information set may be associated
with (a) investors becoming aware of managerial actions as they are revealed to the public and/or (b) the
arrival of other information, such as economic news or new information about the performance of past
4
strategies. In either case, new information allows investors to update their expectation of the firm’s future
cash flow prospects.
A change in investors’ information set leads to change in stock price, or stock returns, as new
information is impounded into stock price. Stated differently, stock returns [Pt+1 – Pt + Dividendst] / Pt are
due to the arrival of new information, both private and public. Whether stock returns are driven by news
of managerial actions or other information, they are informative, and therefore, can serve as valuable
input for managerial decisions (e.g, Dye and Sridhar 2002; Salpukas 1987). For example, a positive stock
price movement would imply a better than expected evaluation of future prospects and/or a greater degree
of approval of managerial actions. A negative move would suggest the opposite.
However, by itself, stock price informativeness may not be sufficient to induce managers to use
stock returns in decision making, especially if managers believe that they are better informed than the
stock market. The principal-agent relationship between managers and investors and the associated
disciplinary mechanism of the stock market provides that inducement, as outlined in the next section.
3.2. The Principal-Agent Mechanism
Investors employ managers to run a company on their behalf with the stated objective of
maximizing shareholder value. This objective requires that managers implement strategies to preserve and
enhance firm market value. Thus, managers are pressed to observe and react to changes in their
company’s stock price.
There are at least three mechanisms to discipline public corporations’ managers and to induce
them to work for shareholders. First, executive compensation is often tied to firm market value.
Managers, therefore, have an incentive to act when firm market value declines. Second, public
companies’ boards and institutional investors monitor executives and can threaten non-performing
managers’ job security. In fact, the monitors themselves are also under pressure to safeguard their firm’s
market value. Third, the market for corporate control is a threat to a firm’s managers—non-performing
corporations can become hostile takeover targets. All of these mechanisms invite using stock prices as a
performance metric.
5
In other words, managers are required and fully expected to be responsive to shareholder value.
In that sense, the stock market imposes a disciplinary mechanism. Indeed past research shows that
managers can be penalized, even dismissed, for poor stock price performance (e.g., Warner et al. 1987).
Based on our development, our general proposition is that firms react to their stock returns. We
state it formally as follows:
P1: Firms react to stock return variation by making changes to their marketing strategies.
Next we discuss what we view as a general pattern in firms’ reactions to stock returns.
3.3. Expected Differences in Firm Reactions to Stock Returns
We hypothesize that top stock price performers will respond differently to feedback from the
stock market than bottom performers for at least two reasons. (We will call top performers those firms
that had above industry-average return in the previous year and laggards those that had below industry-
average return.) The first reason is economic: strong stock price performance is positively associated with
greater access to capital and, therefore, top performers may have strategic options at their disposal that are
not feasible for laggards. The second, psychological, reason stems from Prospect Theory (Kahneman and
Tversky 1979). Prospect Theory suggests that managers, like any individual, will exhibit risk aversion in
the domain of gains and risk-seeking behavior in the domain of losses (e.g., Bazerman 1998). In our set-
up, top performers are in the domain of gains and laggards are in the domain of losses. Therefore, we
hypothesize that top performers will exhibit risk aversion in their strategy selection, whereas laggards will
be risk-seeking.
Moreover, people are more sensitive to losses than to gains of the same magnitude. In this sense,
people are loss-averse. “One implication of loss aversion is that individuals have a strong tendency to
remain in the status quo, because the disadvantages of leaving it loom larger than advantages” (Kahneman
et al. 1991, p. 197). Specifically, top performers are likely to feel the pressure not to degrade their
successful current strategies. Top performers’ strong relative stock returns would indicate that the market
has a positive outlook for their cash flows and thus approves of their current marketing strategies.
6
Therefore, top performers, in general, may feel reluctant to make changes in currently successful
strategies. Indeed, this tendency is likely to be greater for the best performers.
This is not to say that above average stock returns necessarily lead to passive firm behavior. Top
performers will instead focus more on those actions that are strategically important but that are less risky
and do not upset their status quo. In other words, we anticipate top performers to emphasize those actions
that have only limited downside and may be reversible. An example of such action would be detailing
effort. Detailing essentially goes toward building sales of existing products. There is little downside.
Furthermore, if an increase in detailing did not produce desired results, the increase could be scaled back.
Another example is investing in long-term R&D, which can produce some basic learning and thus
improve the firm’s overall R&D capabilities apart from the success or failure of any particular product.
In contrast, it is likely that laggards will seek to reverse losses and to change their negative status
quo. In this respect, their behavior will be more risk-seeking. Specifically, the stock market’s disciplinary
mechanism insures that laggards are under much greater pressure than top performers to improve their
results—their strategic options, shareholder relations, and their managers’ compensation and job
prospects are closely related to stock returns. Therefore, we posit that laggards will focus relatively more
attention on riskier strategies. This tendency is likely to be greater for the worst performers.
Furthermore, to the extent that laggards have greater resource constraints, they are likely to
implement fewer low-risk actions as a result. Strategies that enhance the product line in the short run
(e.g., acquisitions, in-licensing of products, etc.) are high-risk simply because if the new product fails, the
firm essentially finds itself in a much more critical situation and is stuck with another unsuccessful
product. This differs from long-term R&D and technology alliances, which can produce some basic
learning and thus improve the firm’s overall R&D capabilities apart from the success or failure of any
particular product.
We formally summarize this discussion in the following:
P2: On average, top performers implement fewer risky actions and more low-risk actions than
laggards.
7
P3: Top performers react to stock returns by implementing fewer high-risk actions the better their
stock price performance.
P4: Laggards react to stock returns by implementing more high-risk actions the worse their stock
price performance.
P5: Top performers react to stock returns by implementing more low-risk actions the better their
stock price performance.
P6: Laggards react to stock returns by implementing fewer low-risk actions the worse their stock
price performance.
4. What are Drug Firms’ Marketing Reactions to Relative Stock Returns?
Although a firm can react to the stock market in a number of different ways, it is rather likely that
firms will react by primarily addressing weaknesses and developing strengths in areas that are key for
success in their specific business environments. It is generally known that the two major key success
factors in the pharmaceutical industry are new product development and intensive marketing that includes
brand building, detailing and promotion (e.g., A.T. Kearney, Inc. 1999; Best Practices, LLC 2000).1 The
20-year limit on patent protection for pharmaceutical compounds makes new products the life-blood of
pharmaceutical firms. The 20-year time limit also implies that drug firms must rapidly ramp up product
sales upon FDA approval and aggressively market drugs throughout their life cycle. Furthermore, most
major drug manufacturers now concentrate their efforts in a handful of therapeutic areas, such as
cardiovascular, respiratory and central nervous system, and develop products that have similar benefits
(e.g., A.T. Kearney, Inc. 1999). Since many therapeutic classes are getting increasingly crowded,
intensive marketing has become critical for any drug’s commercial success.
In the following section, we discuss product- and marketing-focused activities performed in and
develop hypotheses for the pharmaceutical industry.
1 For example, Robert Luciano, chairman and CEO of Schering-Plough, summarized that “growth at Schering-Plough has been due… to a dynamic combination of acquisitions, alliances, divestitures, creative research-and-development pursuits, and marketing and sales savvy” (PR Newswire 1992).
8
4.1. Marketing Activities and Specific Hypotheses
To the best of our knowledge, there is no extant description or classification of marketing
activities employed in the pharmaceutical industry. To develop one, we content-analyzed the business
press coverage for Schering-Plough. We chose Schering-Plough primarily because it enjoyed more
extensive press coverage during 1980-2000 than the other major drug firms. We identified the most
commonly reported classes of actions for the 21-year period. These various activities may be further
categorized into two rather general groups: product-/R&D-focused activities, and sales-/marketing-
focused activities. We verified the accuracy of our categorization and its completeness through personal
interviews with an industry marketing consultant.
Additionally, we categorized the marketing actions according to their level of risk. This
categorization is based on two criteria— reversibility and the extent of associated downside. Not easily
reversible actions associated with substantial downside, i.e. potential loss of investment or substantial
negative impact on profits, were characterized as high-risk. Actions that did not possess both of those
characteristics were treated as low-risk.
Pharmaceutical firms employ six basic approaches to build their product pipeline and to modify
their product portfolio. These include:
Changes in R&D expenditures;
Enhancement of overall R&D capabilities through personnel additions, construction of new research
facilities, acquisition of new research equipment and so on;
Technology alliances with other research organizations;
Commercialization alliances to enhance the firm’s product portfolio or pipeline through in-licensing
of development-stage compounds or in-sourcing of FDA-approved products for co-marketing or
exclusive distribution;
Acquisitions of other firms to boost the firm’s product portfolio and pipeline; and
Out-licensing agreements and divestitures of products and R&D that no longer fit objectives.
9
The first three activities have limited downside and can be viewed as relatively low-risk in the
pharmaceutical industry. Specifically, all drug firms have to invest in R&D and new technologies in order
to insure long-term survival. Investments in pharmaceutical R&D and infrastructure are substantial and
not easily reversible, but they do produce tangible benefits, such as eventual products or learning. As
such, the downside is limited. In contrast, commercialization alliances, acquisitions and divestitures are
relatively high-risk. They are not easily reversible, can be very costly, and typically involve a higher
probability of a substantial loss of investment (e.g., Drug Week 2003; Financial Times 2003b).
We also identified the following four2 types of activities aimed at marketing of finished products:
Changes in advertising expenditures;
Changes in detailing expenditures;
Various brand building initiatives. Examples include campaigns to educate consumers, event
sponsorship, the use of celebrity endorsers and so on; and,
Changes to product distribution, such as geographic expansion, addition of new distributors or
changes in distribution arrangements with current partners.
All these sales- and marketing-focused actions are likely to have immediate impact on firm sales
and profits. However, most of these actions, except for distribution changes, appear to be relatively low-
risk, easily reversible actions.
Tables 1 and 2 here please
Table 1 provides detailed operationalizations and abbreviated notation for all the activities.
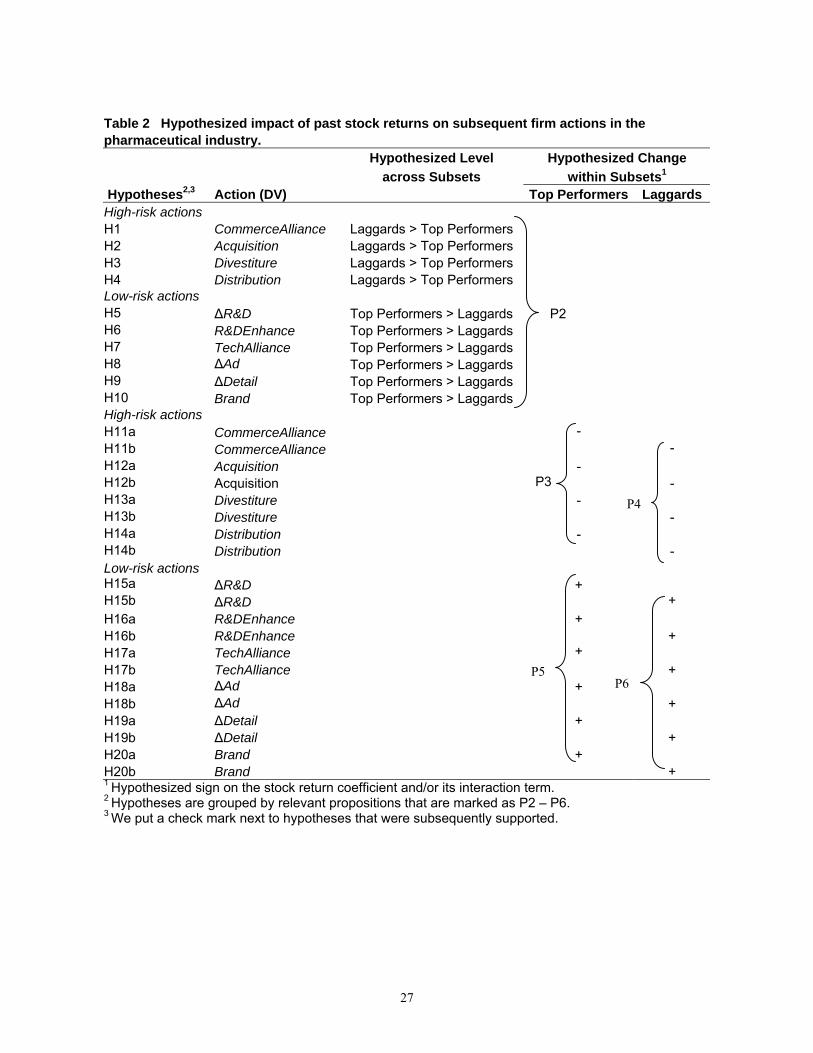
Applying the propositions from the Theoretical Framework to the specific actions employed by
pharmaceutical firms, we arrive at the hypotheses summarized in Table 2.
2 We also identified change in advertising agencies as one of the actions drug firms implement as part of their marketing strategy. Unfortunately, the sparsity of our data set with respect to this decision variable prevented us from evaluating it.
10
4.2. Method
4.2.1. Independent Variables. Our main independent variable with respect to predicting change in the
ten activities is a measure of a firm’s annual stock return. In the past, researchers either used the annual
change in the ratio of market valuation to capital, or Tobin’s q (e.g., Barro 1990), or annual change in
abnormal returns relative to the broad market (Morck et al. 1990). However, industry return may provide
firms valuable information about their own performance. For example, Bristol-Myers Squibb states on its
web site under “Industry Benchmarking” that “we [BMS] regularly compare our performance with our
peer companies.” Indeed, it has been shown that industry averages serve as benchmarks for financial
goals of many companies (e.g., Lev 1969).
We use a simple transformation of stock return for firm i in year t less industry average return in
the same year = (*itR ∑
=
−n
jjt
tit R
nR
1
1) to construct a continuous stock return variable that is positive if the
firm’s stock return is above industry average and negative if it is below.
The principal-agent mechanism suggests that a firm’s marketing reaction to stock returns may
differ depending on the length of time its stock under-performed its peers. Specifically, the probability of
a disciplinary action against the firm’s management is likely to increase with the length of time the firm
under-performed. Consequently, a firm whose stock return under-performed the industry for two straight
years may exhibit more urgency in changing its strategies in the third year than a firm whose stock under-
performed the industry for only one year. To this end, we construct an interaction variable as follows:
It is clear that a firm’s actions may be influenced by the frequency or intensity of similar actions
in the near past. Therefore, we control for inertia or momentum in the actions reflected in the dependent
variable by including a right-hand side variable that summarizes the level of such actions in the previous
11
two years: e.g., the control for ΔR&Dt is the sum of R&D expenditures at t-1 and t-2. The value of
controlling for actions in years t-3 and earlier is likely to be small, because a firm is likely to take less
than two years to work through most actions we address in this research. In addition, to the extent that
stock returns reflect the implications of past decisions for (expected) performance, stock returns also
control for past decisions.
We control for possible competitive influences on firm marketing actions by including a variable
that models equivalent competitive actions undertaken by the firm’s top competitor.3 For example, if the
dependent variable is , the equivalent control is DR &∆ DR &∆ of its top competitor. We identified each
firm’s top competitor as follows. First, we identified each firm’s top selling product for each year from
1980 through 2000. Next, we identified the product’s therapeutic class and action using medical
formularies. Then, we obtained a list of all drugs in that class and identified the highest selling
competitive product on the list. The maker of this competing product was designated the firm’s top
competitor. Since a firm’s competitive landscape changes over time, its top competitor is time-variant.
Past research has shown that it is important to control for cash flows in explaining firm actions
(e.g., Morck et al 1990). We follow the approach commonly used in financial economics to compute net
cash flows as net income plus depreciation. Additionally, because a firm’s size can influence its capacity
for multiple alliances, acquisitions and other actions, we control for firm size by including the log of its
dollar value of assets. Finally, we include year dummy variables to control for any effects that are due to
general economic conditions affecting the industry.
4.3. Analysis, Models and Estimation
For each decision variable, we conduct two-sample t-tests to examine basic differences (1)
between top performers and laggards, and (2) between consistent top performers, consistent laggards and
firms that had less consistency in their results over the previous two years.
Next, we estimate the following model:
12
,
**
1019817
65*
2*
14*
13
1
2
1
110
ititititit
ititiititit
T
tt
n
iiiit
eAssetsCashCashCompet
CompetDVControlIRRRYearFirmDV
++∆+∆++
++++++=
−−
−−−
−−
=∑∑
ββββ
βββββββ
where
itDV = Decision variable
iFirm = Firm i indicator dummy variable Yeart = Year dummy variable
*1−itR = Return of firm i in year t-1 adjusted by subtracting industry average return
iI = Indicator variable for firm i as described in the “Variables” section
itDVControl = Control variable for firm i's actions as described in the “Independent Variables” section
itCompet = Equivalent strategic action of firm i's top competitor in year t
itCash∆ = Change in cash flows of firm i in year t
itAssets = Natural log of a firm’s dollar value of assets at the beginning of year t.
We first used OLS regression to estimate the model for DR &∆ , Detail∆ and
Additionally, there is a possibility that firms do not change strategies in isolation. For example, if a firm
changes its R&D expenditures, it may also realign its advertising or sales force expenditures. If this is the
case, errors in our regressions will be correlated. A standard approach to handle such dependence in
continuous data is through a system of equations, such as seemingly unrelated regressions (SUR).
Therefore, we use SUR to estimate models for
.Ad∆
DR &∆ and Detail∆ . Deficiencies of our advertising
data, as discussed in the Data section below, prevent us from estimating Ad∆ with SUR. However, R&D
and detailing expenditures essentially reflect the duality of a firm’s strategic activities of value creation
(R&D) and value appropriation (advertising and detailing) (Mizik and Jacobson 2003). Therefore, if there
is such dependence between our dependent variables, our SUR regression with DR &∆ and
should prove a better alternative to separate OLS regressions.
Detail∆
The data for our other decision variables are in the form of counts. Poisson and negative binomial
distribution (NBD) regression models provide methods of modeling such events. We use an NBD model
3 To the extent that a firm may make decisions in reaction to or anticipation of its top competitor’s actions, there may be endogeneity between the decision variables and top competitor’s equivalent actions in a manner that makes the errors correlated. We address this in the “Robustness Checks” section below.
13
in our analyses for two reasons. First, NBD does not have the restrictive property of Poisson models that
the variance of the dependent variable equal its mean. Second, unlike Poisson, the NBD model includes a
random disturbance term that allows for omitted explanatory variables (Long 1997). The expression for
negative binomial distribution with mean µ and dispersion parameter k is as follows:
yk
i kkyyk
kkyP ⎟⎟
⎠
⎞⎜⎜⎝
⎛+Γ
+Γ⎟⎠⎞
⎜⎝⎛ +=
−
µµµµ
)(!)(1),(
where µµ =),( kyE and k
kyVar2
),( µµµ += . The regression model is completed by setting
).
**exp(
19817
65*
2*
14*
13
1
2
1
110
itititit
ititiititit
T
tt
n
iiiit
eCashCashCompet
CompetDVControlIRRRYearFirm
+∆+∆++
++++++=
−−
−−−
−−
=∑∑
βββ
βββββββµ
We employ an unconditional negative binomial estimator with dummy variables for fixed effects
to estimate the NBD model (Allison and Waterman 2002).4 Since we posit that top stock price performers
and laggards will react differently to feedback from the stock market, we estimate our models separately
for the two subsets. We construct the subsets by a mean split of our dataset by stock return in each
calendar year.
4.4. The Data
We identified 19 major U.S. and foreign-based pharmaceutical firms that were publicly traded in
the United States during at least one calendar year between 1980 and 2000. The pharmaceutical industry’s
composition changed over the years due to mergers, acquisitions, and new American Depository Receipt
listings of foreign firms on the NYSE. Therefore, the number of firms in our dataset also varies from year
to year.
We obtained annual R&D and advertising expenditure data, as well as net cash flows, for most of
the 19 firms from COMPUSTAT and detailing expenditures from Verispan. After making appropriate
transformations to construct variables as outlined earlier, our sample contained 203 usable cross-sectional
4 This procedure is programmed in SAS’ PROC GENMOD.
14
time-series observations on , 227 usable observations on DR &∆ Detail∆ and 117 usable observations
on for the period from 1980 through 2000. We have substantially fewer Ad∆ Ad∆ observations, because
some pharmaceutical firms stopped reporting advertising expenditures in 1994. This limited our modeling
options with respect to : when a system of equations is estimated by SUR, firm-years that have
missing values in any of the models are dropped from every model in the system. This loss of data made
inclusion of in a system of equations impractical.
Ad∆
Ad∆
We used Lexis-Nexis, Dow-Jones Interactive, ABI/Inform, SDC Platinum and Company Annual
Reports to collect our data on the other marketing strategies only for the period from 1988 through 2000.
These data are substantially less available before 1988. We searched these data sources by firm name and
retrieved all news items referencing the firm in question. We then content-analyzed the items for
references to actions that fall in any of the nine categories of marketing strategies. Relevant references
were coded by activity, and entered in the dataset as counts. This gave us 170 firm-years of discrete count
data on each marketing action. We verified the coding accuracy by having an independent rater re-code a
sample of news items. This sample was constructed by stratified random sampling: we randomly drew
one year for each of the firms in our sample. Inter-coder agreement was 97.4 percent.
We used R&D, detailing and advertising expenditures as reported for each fiscal year. However,
we introduced a one-month forward shift in our data on the other seven strategies to correct for clustering
of announcements in January after a quiet spell in December associated with Christmas holidays and end-
of-year events. For example, we recorded all actions announced between February 1, 1988 and January
31, 1989 as initiated in 1988. Given the involved nature of the actions we are investigating, it is almost
certain that actions reported in January were indeed initiated in prior months.
4.5. Results
We examine the results in two stages. First, we address whether laggards made different decisions
than top performers. Then, we estimate our regression models to see how stock price variation impacts
decisions within each of the two groups.
15
4.5.1. Laggards vs. Top Performers. Table 3 shows descriptive statistics for our decision variables for
all firms, the subsets of top performers and laggards, the subsets of firms that were top performers two
years in a row (Top-Top), laggards two years in a row (Bottom-Bottom), and a subset of firms that were
top performers in year t-1 and laggards in year t-2 or vice versa (Other).
High-Risk Decisions:
Over the 13-year period from 1988 to 2001, laggards averaged directionally more
commercialization alliances (p < 0.15), acquisitions, R&D enhancements, and significantly more
divestitures (p < 0.10), and distribution changes (p < 0.05) than top performers. We thus find strongest
support for H3 and H4.
These results generally hold when we examine the differences between the Top-Top, Bottom-
Bottom and “Other” subsets. Specifically, firms in the Bottom-Bottom subset implemented more
commercialization alliances, acquisitions, distribution changes (p < 0.01) and R&D enhancements than
firms in the Top-Top and the “Other” subsets. However, firms in the “Other” subset divested more
products than firms in the Top-Top subset (p < 0.01) or the Bottom-Bottom subset (p = 0.1).
Low-Risk Decisions:
Drug firms on the whole increased their annual R&D expenditures on average by 15%, which is
5% higher than their average annual increase in advertising and detailing expenditures. We find that,
directionally, top performers invested more in R&D than laggards. They also implemented directionally
more technology alliances and brand building initiatives. Moreover, top performers on average increased
their annual detailing expenditures 6% more than laggards (p < 0.05). This supports H9. We also observe
a statistically significant difference in between the Top-Top and Other subsets (p < 0.10). Thus,
not only do laggards spend more on high-risk actions, but top performers spend more on low-risk actions.
Detail∆
Summary:
Supported hypotheses are shown in Table 3 in bold font. Our directional and significant results
collectively suggest that laggards react to poor stock returns by emphasizing higher risk activities that can
immediately enhance their product portfolio, pipeline and product-market focus, such as
16
commercialization alliances, divestitures and distribution changes. In contrast, top stock price performers
make fewer changes in these areas than laggards. Instead, they appear to be more focused on extracting
value from existing products through such relatively low-risk activities as greater detailing and brand
building efforts.
Tables 3 and 4 here please
4.5.2. The Effect of Stock Price Variation within Subsets. Table 4 shows SUR coefficients for DR &∆
and (OLS coefficients are essentially the same), OLS coefficients forDetail∆ Ad∆ , and NBD
coefficients for all the other marketing actions. Each model in Table 4 was estimated separately for the
subsets of top stock price performers and laggards. Our primary interest is in the sign of regression
coefficients on lagged relative stock return and its interaction term * * . Overall, our
regression results are consistent with descriptive statistics reported in Table 3.
*1−itR *
1−itR *2−itR iI
High-Risk Decisions:
We find that the main effect of in the CommerceAlliance regression is zero in both subsets,
but its interaction term is significantly negative for top performers (
*1−itR
4β = -7.86, p < 0.10). Thus, given
that a firm was a top stock price performer in years t-1 and t-2, the expected number of commercialization
alliances it implements in year t is negatively related to the firm’s stock price performance in the earlier
years. This result supports H11a. The corresponding hypothesis for laggards, i.e. that they undertake more
such alliances the worse their stock performance (H11b) was not supported.
We did not find evidence for the hypothesis that top performers implement fewer acquisitions the
better their stock returns (H12a). However, the results for laggards’ acquisitions ( 3β =0; 4β = -34.19, p <
0.05) suggest that they make more acquisitions the worse their relative performance over the previous two
years. This supports H12b.
17
Additionally, we obtain a significant result for Divestiture in the subset of top performers ( 3β = -
1.86, p < 0.10). Supporting H13a, this result indicates that top performers make fewer divestitures the
better their stock price performance in the previous year. H13b for laggards was not supported.
We can further interpret NBD coefficients on for firms that were top performers in year t-1
and laggards in year t-2 as follows. Holding the other variables constant, one standard deviation (0.11)
increase in such top performers’ relative stock return is associated with a 19 percent decrease in the
expected number of divestitures they will implement: exp(-1.86*0.11) = 0.81. For firms that were top
performers in the previous two years, the main effect can be computed and interpreted at the mean of
return in year t-2,
*1−itR
*2−itR , as follows: exp[( 3β + 4β
*2−itR )*(Change in factor of interest)]. All the other
NBD coefficients can be interpreted analogously.
Finally, we found no support for relationships between distribution changes and stock price
performance within groups (H14a and H14b).
Low-Risk Decisions:
We find that the interaction term * * in the *1−itR *
2−itR iI DR &∆ and Detail∆ regressions for
top performers is positive and significant in both regressions (SUR 4β = 1.02, p < 0.05 and 1.37, p < 0.10,
respectively). This implies that given that a firm was a top stock price performer in years t-1 and t-2, it
invests more in R&D and detailing in year t the higher its relative stock return in the previous two years.
These results support H15a and H19a, respectively. However, we find no support for hypotheses
involving R&D enhancements, technology alliances and brand building initiatives in the subset of top
performers (H16a, H17a and H20a, respectively).
Our results for the variable in the laggards’ subset suggest that “consistent” laggards
invest less in detailing the worse their performance in the previous two years (SUR
Detail∆
4β = 2.92, p < 0.05).
This result supports H19b.
18
Furthermore, we find no support for the hypotheses that laggards focus less on ∆R&D (H15b),
R&D enhancements (H16b), advertising (H18b), and brand building (H20b) the worse their stock
performance. Additionally, we note that the result for H17b is the opposite of what we hypothesized ( 3β
= 0; 4β = -12.50, p < 0.10). The results involving H15b, H16b and H17b are not entirely surprising when
one considers the nature of the pharmaceutical industry. Because product development activities are
among key success factors for drug firms, laggards must be reluctant to cut back on them. Moreover, to
the extent that tech alliances are highly visible, relatively inexpensive (in the range of $1 million to $5
million per multi-year alliance) and can produce valuable results, laggards may find such alliances
attractive, maybe more so the less they can afford to increase their overall R&D spending.
Summary:
We find that major drug firms appear to react to relative stock returns. Overall, laggards show
greater focus on changing their status quo through high-risk actions. Specifically, they implement more
divestitures and make more distribution changes than top performers. Furthermore, firms that were
laggards in year t-1 and t-2 take dramatic steps to improve their product portfolio and pipeline—they
make more acquisitions the worse their relative stock returns in both those years. Additionally, laggards
over two years seem to de-emphasize some low-risk actions, such as detailing effort. This may be driven
by resource constraints.
In contrast, top performers seem to focus more on low risk actions. We find that, on average top
performers implement greater percent increases in detailing than laggards. Top performers two years
running invest more in R&D and detailing, but implement fewer commercialization alliances the higher
their stock returns in both previous years. Also, top performers tend to implement fewer divestitures the
higher their relative stock return at time t-1. Supported hypotheses are shown in bold in Table 4.
4.5.3. Robustness Checks
We conduct multiple tests to ascertain the robustness of our results. Specifically, we determined
that neither multicollinearity nor serial correlation were factors in our models. In addition, there may be
19
endogeneity in our models with respect to cash flows, competitive actions, and DVControl (the latter only
in the case of , and , due to the value at t-1 being present both in the DV and the
DVControl, albeit in different forms). We conducted Hausman-type exogeneity tests with respect to those
variables. The tests did not detect endogeneity. However, we admit that we have only weak instruments
for the potentially endogenous variables, which may have affected our ability to detect endogeneity.
Finally, we evaluated models with raw rates of return, instead of relative returns. Those results were
largely consistent with our findings presented here.
DR &∆ Detail∆ Ad∆
4.5.4. Robustness of Interpretation
We interpret the association between a firm’s lagged stock return and its marketing strategies as
managers reacting to their firm’s stock returns. Our results can also be consistent with a “prescient stock
market” or a “prescient manager” view. We now explain these alternative perspectives.
A prescient stock market anticipates certain types of actions from top performers and other types
of actions from laggards and impounds these expectations into stock prices. The result is that past stock
returns could be correlated with future firm actions in the manner reported in Tables 3 and 4, without
managers actually reacting to stock returns. The explanation is straightforward in the case of past positive
stock returns anticipating further value enhancing marketing strategies in the future. The explanation is
not as straightforward in the case of past negative stock returns anticipating future value enhancing
strategies. The argument would have to be that the stock market recognizes mistakes of past strategies and
revises firm value downward, but not fully, because it anticipates corrective strategic actions. At the same
time, in the future, the corrective strategic actions would generate no stock price reactions, unless the
correction is more value enhancing than expected. With that said, we cannot preclude the possibility of
the prescient stock market explanation.
The “prescient manager” view involves the stock market and managers independently reacting to
the same information. Specifically, managers and the market simultaneously learn news relevant for
predicting the firm’s future performance. Both will react accordingly. For example, the market
immediately exhibits a negative reaction when newly arrived information suggests that the firm has
20
implemented a poor strategy. Simultaneously, prescient managers react to the information and plan
corrective strategies that are revealed to the public when implemented. This mechanism implies a
spurious correlation between past stock returns and future managerial reactions. We cannot preclude the
possibility of this view either.
Our current data set constrains our ability to further discriminate among the three views. We,
therefore, leave that for future research. In our view, to tackle the empirical problem, it might be useful to
supplement systematic data analyses with clinical information. In this spirit, we sought out comments
from senior executives at GlaxoSmithKline, Pharmacia and Wyeth on the stock market reaction model
and our specific results. They found them reasonable.5
5. Conclusions: Contribution, Summary and Limitations
5.1. Summary
Many authors have underscored the importance of research that broadens our understanding of
the marketing – finance interface (e.g., Day and Fahey 1988; Srivastava et al. 1998). Our research extends
this literature by addressing the linkage between past changes in share value and changes in marketing
strategies. We also believe that, by examining this relationship, our research extends the marketing
literature on managerial decision-making. Specifically, our work involves first developing a theoretical
framework that describes how and why stock price variation plays a role in managerial decision-making.
Then, we hypothesize and empirically address what specific decisions managers undertake in response to
stock price variation. To this end, we examine a range of major pharmaceutical firms’ marketing actions
reported in company financial statements and the general press.
We find that:
1. Top performers make fewer relatively risky changes to their product portfolio and pipeline (through
commercialization alliances or divestitures) the better their stock price performance.
5 Records of these conversations are available upon request.
21
2. Top performers implement more relatively low-risk actions, such as greater increases in R&D
expenditures the better their stock price performance.
3. Top performers show greater emphasis on sales and marketing of existing products (a low risk
strategy) the better their stock returns.
4. On average, laggards seek to change the status quo in their product portfolio, pipeline and distribution
more than top performers.
5. The worse laggards perform, the more they implement high-risk actions, such as acquisitions, that can
help them immediately improve their current product portfolio and pipeline.
6. Laggards over two previous years de-emphasize some, but not all low-risk activities—they invest less
in detailing, but enter more technology alliances the worse their stock returns.
Our findings suggest that stock market returns lead changes in strategies. Moreover, strategy
changes are different between firms with leading and lagging past stock price performance. The former
emphasize more low-risk strategies while the latter emphasize high-risk strategies.
Our first result is consistent with the view that top performers exhibit loss aversion. That is, top
performers tend not to make high-risk changes, such as commercialization alliances or divestitures, that
have higher downside and may be costly to reverse. That top performers make fewer commercialization
alliances the better their past stock performance suggests that higher performers are more satisfied with
their current portfolio and pipeline strategies.
These findings do not imply that top performers rest on their laurels. Our combined results for top
performers suggest that the better their stock price performance, the more they implement low risk actions
that can be quite beneficial both in the near term and in the long term. Specifically, our second result
shows that more successful top performers are willing to make greater investments in R&D. Our third
result shows that, in a complementary strategic move, more successful drug firms spend more on direct
sales effort in order to extract greater value from their existing products. This result is consistent with
implications of earlier research that the market encourages strong performers to focus more on value
appropriation (Mizik and Jacobson 2003).
22
To the extent that poor stock returns suggest a decline in expected future cash flows, the stock
market sends a signal that laggards need to improve their product portfolio and pipeline. Our combined
results for laggards indicate that (1) they respond to the stock market’s feedback, and that (2) they react
by implementing high-risk actions, such as acquisitions, that can have an immediate impact on their
profitability. Additionally, that “consistent” laggards tend to enter more technology alliances the worse
their stock price performance in the previous two years reinforces our interpretation that laggards refocus
on product portfolio and pipeline.
The spirit of our findings is consistent with actual events observed in the pharmaceutical and
other industries (Salpukas 1987). For example, the high-performing Wyeth stated that it would “continue
to focus on R&D…” (Pharmaceutical Executive 2000, p. 68). In contrast, the lagging “Merck &
Company said… that it planned to acquire… Aton Pharma… The move is the latest in a series of
acquisitions being made by Merck as it seeks to acquire new experimental products to offset the loss of
revenue from existing drugs that are losing patent protection” (New York Times 2004, p. C4).
We do not claim that change in marketing strategy depends on change in stock price only.
Moreover, our results do not necessarily suggest that drug firms make a direct effort to react to stock
returns. On the contrary, we believe that managers’ use of information contained in stock returns is rather
subtle and paramorphic. It is more likely that the board and institutional owners apply pressure on
managers that stimulates (corrective) actions in key success areas. Indeed, this explanation was offered as
plausible in our discussions of these results with senior executives with GlaxoSmithKline, Pharmacia, and
Wyeth.
5.2. Limitations and Directions for Future Research
One cannot help but notice from Tables 3 and 4 that fewer than half of our hypotheses were
supported. This brings a methodological issue into focus; i.e., an imperfect correspondence between
constructs and measures. The theoretical development in section 3.3 leading to propositions P2 through
P6 focuses on decision risk; i.e. the presence or absence of high and low risk decisions. We
operationalized these constructs by classifying marketing variables as either high or low risk. In that
23
sense, we have several separate measures of high and low decision risk. However, a firm can implement
high risk decisions without employing each and every high risk marketing variable. This leads to greater
difficulty in finding significance in the models we examined. In that sense we believe that our findings
and their prima facie support for our theory are conservative. Nevertheless, the development of composite
measures of decision risk would enable alternative analyses.
In line with this, our dependent variable is really multivariate in that it reflects various marketing
decisions firms implement in reaction to stock returns. These decisions are not likely to be made
completely independently from each other. Therefore, it makes sense to examine the impact of each
marketing decision on the others. This can be accomplished through the vector autoregressive (VAR)
framework. We could not use a VAR approach in this research because of data constraints. For example,
we do not have a continuous time series for each company within each performance (i.e. top vs. laggard)
domain. Nevertheless, the importance of examining the separate marketing decisions as functions of each
other in the context of feedback from the stock market is clear and remains as future research.
Another limitation of our work is that it relies on only 13 years of annual time series data,
although three of our most important variables: R&D, detailing and advertising cover 21 years for most
firms. The limited data preclude the employment of techniques such as the Granger causality test. Given
data constraints, we are forced to draw causal inference from essentially cross-sectional regression results.
We admit that there may be other explanations of our findings. Specifically, we have discussed
the prescient stock market interpretation and the prescient manager interpretation. While our current
results are not powerful enough to further differentiate the validity of our view (managerial reaction to
stock market information) and these views, we draw comfort from the fact that our explanation is
consistent with the aforementioned Wyeth and Merck examples, and the comments from executives at
GlaxoSmithKline, Pharmacia, and Wyeth. Still, we hope that future research efforts can provide direct
and systematical empirical evidence that differentiates these alternative interpretations.
Apart from our study’s limitations, there are other opportunities for future research. Specifically,
we addressed marketing reactions to stock returns only in one industry that is characterized by substantial
24
transparency in financial reporting and known key success factors. It would be instructive to verify our
findings across a range of industries. Additionally, we believe it would be instructive to determine those
characteristics of stock returns, such as the shape of the stock return function, that make managers more
responsive to returns. Furthermore, it would be important to assess whether marketing decisions and firm
performance may benefit from managers’ being more responsive to changes in the firm’s market value.
Finally, we believe that it would be interesting to uncover the characteristics of firms, e.g., ownership
structure and board composition, whose strategy changes more closely follow change in stock value.
25
Table 1 Operationalizations of marketing actions and abbreviated notation.
Action (Notation) Operationalization
High-risk
Commercialization Alliances (CommerceAlliance)
Strategic alliances that enhance a firm’s product pipeline or product portfolio through in-sourcing of specific compounds or products. Two types of in-sourcing agreements fall in this category: (1) in-licensing agreements of finished products or R&D-stage compounds; or (2) distribution agreements for exclusive or joint marketing of other firms’ products.
Acquisitions (Acquisition)
Acquisitions by a firm of other firms, other firms’ products, or product lines.
Out-licensing and Divestitures (Divestiture)
Strategic actions that result in reductions in a firm’s product line. This includes (1) out-licensing agreements whereby a firm transfers to its partner exclusive marketing rights, but not full ownership of some of its products, and stops marketing the products by its own sales force; and (2) divestitures by a firm of its products, product lines or wholly- or majority-owned subsidiaries.
Distribution Changes (Distribution)
Changes in a firm’s distribution channels, such as geographic expansion, or changes in distribution arrangements with individual distributors.
Low-risk
Change in R&D Expenditures ( ) DR &∆
Annual percentage change in R&D expenditures.
R&D Enhancements (R&DEnhance)
Enhancements to a firm’s overall R&D function, such as substantial personnel additions, construction or acquisition of research facilities, and substantial acquisitions of productivity aids, such as supercomputers, high-throughput screening systems, etc.
Technology Alliances (TechAlliance)
Strategic alliances that enhance a firm’s product pipeline or research capabilities in a specific therapeutic area, but do not involve specific drug candidates. Four types of alliances fall in this category: (1) agreements involving in-licensing of new drug discovery or drug delivery technologies in specific therapeutic areas; (2) agreements allowing access to genetic or chemical compound libraries; (3) joint research with one or more independent entities; and (4) contract research done by an independent entity for a firm.
Change in Advertising Expenditures ( ) Ad∆
Annual percentage change in advertising expenditures.
Change in Detailing Expenditures ( ) Detail∆
Annual percentage change in direct sales force expenditures specifically targeting doctors’ offices.
Brand Building Initiatives (Brand)
Strategic and tactical initiatives aimed at brand building, such as repackaging and repositioning of old products; educational initiatives tied to a firm’s product(s); enhancements to a firm’s extended product(s), e.g. the launch of a product web site; new ad campaigns for old products; signing of celebrities as product spokespersons; event sponsorship; etc.
26
Table 2 Hypothesized impact of past stock returns on subsequent firm actions in the pharmaceutical industry. Hypothesized Level Hypothesized Change across Subsets within Subsets1 Hypotheses2,3 Action (DV) Top Performers Laggards High-risk actions H1 CommerceAlliance Laggards > Top Performers H2 Acquisition Laggards > Top Performers H3 Divestiture Laggards > Top Performers H4 Distribution Laggards > Top Performers Low-risk actions H5 ∆R&D Top Performers > Laggards P2 H6 R&DEnhance Top Performers > Laggards H7 TechAlliance Top Performers > Laggards H8 ∆Ad Top Performers > Laggards H9 ∆Detail Top Performers > Laggards H10 Brand Top Performers > Laggards High-risk actions H11a CommerceAlliance - H11b CommerceAlliance - H12a Acquisition - H12b Acquisition P3 - H13a Divestiture - H13b Divestiture - H14a Distribution - H14b Distribution - Low-risk actions H15a ∆R&D + H15b ∆R&D + H16a R&DEnhance + H16b R&DEnhance + H17a TechAlliance + H17b TechAlliance + H18a ∆Ad + H18b ∆Ad + H19a ∆Detail + H19b ∆Detail + H20a Brand + H20b Brand + 1 Hypothesized sign on the stock return coefficient and/or its interaction term. 2 Hypotheses are grouped by relevant propositions that are marked as P2 – P6. 3 We put a check mark next to hypotheses that were subsequently supported.
P5
P6
P4
27
Table 3 Descriptive statistics for marketing actions across firms and years.
Top Half Bottom Half (t-1)1 (t-1)
Top(t-1)& Top(t-2)
Bottom(t-1)&Bottom(t-2)
Other(t-1)&(t-2)
Relevant Hypothesis4 Action (t) Mean SEM2 Mean SEM Mean SEM Mean SEM Mean SEM Mean SEM
H10 Brand 1.30 0.16 1.47 0.20 1.18 0.26 1.46 0.27 0.93 0.29 1.47 0.271 Statistics for actions in year t for firms that were top stock price performers in year t-1, based on a mean split by return in each year. Bottom half is analogous. 2 SEM = Standard Error of the Mean 3 Changes in R&D, Ad and Detailing Expenditures are expressed in percent/year, all the other variables are in counts/year. 4 Supported hypotheses are in bold font.
28
Table 4 Select coefficients and (standard errors) from SUR (∆R&D and Detail∆ ), OLS ( ) and NBD regressions in the subsets of top performers and laggards.1
1Superscript a, b, and c denotes statistical significance at the 10%, 5%, and 1% levels, respectively. 2The goodness-of-fit measure in NBD regressions is the ratio of Deviance/Degrees of freedom. In OLS regressions marked with ‘*’, the fit measure is adjusted R2; in SUR regressions marked with ‘**’, the fit measure is system-weighted R2. 3In cases where the number of observations is different, it is given in parentheses next to the appropriate regression. 4 Supported hypotheses are in bold font.
29
References
A.T. Kearney, Inc. 1999. Maximizing Pharmaceutical Health in the Next Millennium. Available from
http://atkearney.com.
Aaker, D. A., R. Jacobson. 1994. The Financial Information Content of Perceived Quality. J. Marketing
Res. 38 (4) 485-493.
Aaker, D. A., R. Jacobson. 2001. The Value Relevance of Brand Attitude in High-Technology Markets. J.
Marketing Res. 31 (2) 191-201.
Agrawal, J., W. A. Kamakura. 1995. The Economic Worth of Celebrity Endorsers: An Event Study
Analysis. J. Marketing 56 (3) 56-62.
Allison, P. D., R. Waterman. 2002. Fixed effects negative binomial regression models. Ross Stolzenberg