16 Koekemoer A.M., Grogin N.A., Schreier E.J., 2002, ApJ 567, 657 Lehmann, I., Hasinger, G., Schmidt, M., et al., 2001, A&A 371, 833 Lehmann I., Hasinger G., Murray S.S, Schmidt M., 2002, astro-ph/0109172 Mainieri V., Bergeron J., Rosati P., et al., 2002, astro-ph/0202211 Miyaji, T., Hasinger, G., Schmidt, M., 2000, A&A 353, 25 Mushotzky, R.F., Cowie L.L., Barger, A.J., Arnaud, K.A., 2000, Nature 404, 459 Norman C., Hasinger G., Giacconi R., et al. 2002, ApJ 571, 218 Rosati P., Tozzi P., Giacconi R., et al., 2002, ApJ 566, 667 Schmidt, M., Schneider, D.P. \& Gunn J.E., 1995, AJ 114, 36 Schmidt, M., Hasinger, G., Gunn, J.E., et al., 1998, A&A 329, 495 Schneider, D.P., Schmidt, M., Hasinger, G., et al., 1998, AJ 115, 1230 Shaver P.A. et al., 1996, Nature 384, 439 Steidel C.C., Adelberger K.L., Giavalisco M., Dickinson M., Pettini M., 1999, ApJ 519, 1 Stern D., Moran E.C., Coil A.L., et al., 2002, ApJ 568, 71 Szokoly, G., Hasinger G., Rosati, P. et al., 2002 (in prep.) Vandame et al. 2001, astro-ph/0102300 Vignati P., Molendi S., Matt G., et al., 1999, A&A 349, L57 Arnouts S., Vandame B., Benoist C., et al., 2001, A&A. 379, 740 Barger, A. J., Cowie, L. L., Mushotzky, R. F., Richards, E. A., 2001, AJ 121, 662 Brandt W.N., Alexander D.M., Bauer, F.E., Hornschemeier A.E., 2002, astro- ph/0202311 Cimatti, A., Daddi E., Mignoli M., et al., 2002, A&A 381, L.68 Comastri, A.; Setti, G.; Zamorani, G.; Hasinger, G., 1995, A&A 296, 1 Fabian A.C., Barcons X., Almaini O., Iwasawa K., 1998, MNRAS 297, L11 Fadda D., Flores H., Hasinger G., 2002, A&A 383, 838Fiore F., La Franca F., Giommi P., et al., 1999, MNRAS 306, 55 Franceschini A., Fadda D., Cesarsky C., et al., 2002, ApJ 568, 470 Gebhardt K., Bender R., Bower G., et al., 2000, ApJ 539, 13Giacconi, R., Rosati P., Tozzi P., et al., 2001, ApJ 551, 624 Gilli, R., Salvati, M., Hasinger, G., 2001, A&A 366, 407 Granato G.L., Danese L., Francheschini A., 1997, ApJ 486, 147 Haiman, Z. & Loeb A., 1999, ApJ 519, 479 Hasinger, G., Burg, R., Giacconi, R., et al., 1998, A&A 329, 482 Hasinger, G., Altieri, B., Arnaud, M., et al., 2001, A&A 365, 45 Hornschemeier, A.E., Brandt, W.N., Gar- mire, G.P., et al., 2000, ApJ 541 Hughes D.H., Serjeant S., Dunlop J., et al., 1998, Nature 394, 241 faintest optical counterparts (Koeke- moer et al., 2002). The whole CDFS will soon be covered by an extensive set of pointings with the new Advanced Camera for Surveys (ACS) in BVIz to “near HDF” depth. Following up the deep EIS survey in the CDFS, ESO has started a large program to image the GOODS area with the VLT to obtain deep JHKs images in some 32 ISAAC fields. The first imaging data covering the central 50 arcmin 2 have recently been made public. Optical spectros- copy across the whole field will be ob- tained with very high efficiency using VIRMOS on the VLT. The multiwavelength coverage of the field will be complemented by deep radio data from the VLA at 6 cm (al- ready obtained) and ATCA at 20 cm. The CDFS/GOODS will therefore ulti- mately be one of the patches in the sky providing a combination of the widest and deepest coverage at all wave- lengths and thus a legacy for the future. References Alexander D.M., Aussel H., Bauer F.E., et al., 2002, ApJ 568, L85 Using color-magnitude diagrams and spectroscopy to derive star formation histories: VLT observations of Fornax CARME GALLART 1 , Andes Prize Fellow, Departamento de Astronomía, Universidad de Chile, and Department of Astronomy, Yale University ROBERT ZINN, Department of Astronomy, Yale University FREDERIC PONT 2 , Departamento de Astronomía, Universidad de Chile EDUARDO HARDY, National Radio Astronomy Observatory GIANNI MARCONI, European Southern Observatory ROBERTO BUONANNO, Osservatorio Astronomico di Roma kel 1979; Aaronson & Mould 1980), Carina (Cannon, Niss & Norgaard-Niel- sen 1981) and other dSph (Aaronson, Olszewski & Hodge 1983). However, only in the last few years have these intermediate-age populations been shown beautifully in the wide-field, ex- tremely deep CMDs of a number of dSph galaxies. There is the extreme case of Leo I (Caputo et al. 1999; Gal- lart et al. 1999a,b), which has formed over 80% of its stars from 6 to 1 Gyr ago, and the intermediate cases of Ca- rina (Smecker-Hane et al. 1996; Hur- ley-Keller et al. 1998; Castellani et al. 2001) and Fornax (Stetson et al. 1997; Buonanno et al. 1999), with prominent intermediate-age populations. There are also predominantly old systems like Draco (Aparicio et al. 2001) and Ursa Minor (Carrera et al. 2002). These CMDs offer qualitative first glances at the star formation histories (e.g. in the case of Carina, one can see that there have been three major events of star formation), but their quantitative determination requires a detailed comparison of the distribution of stars in the CMD with that predicted by model CMDs. CMDs reaching the old main-sequence turnoffs are particu- larly useful for these comparisons be- cause there are few uncertainties in the theory for this stage of a star's life and there is less age-metallicity degenera- cy. We have shown that with this method, it is possible to break the clas- sical age-metallicity degeneracy in stel- lar populations for systems with low levels of metal enrichment like Leo I (Gallart et al. 1999b). However, in the case of a more complicated chemical 1. Star formation and chemical enrichment histories of the Milky Way satellites During the last decade, the varied star formation histories of the dSph gal- axies satellites of the Milky Way have been revealed to us in detail, dramati- cally changing our perception from the early idea that they were predominant- ly old systems. Some hints on the pres- ence of, at least, an intermediate-age population had been provided previ- ously by the peculiarity of the variable star populations of dSph galaxies (Nor- ris & Zinn 1975) and the discovery of Carbon stars in Fornax (Demers & Kun- 1 Currently: Ramon y Cajal Fellow. Instituto de Astrofísica de Canarias. 2 Currently: Observatoire de Genève.
mire, G.P., et al., 2000, ApJ 541Hughes D.H., Serjeant S., Dunlop J., et al.,
1998, Nature 394, 241
faintest optical counterparts (Koeke-moer et al., 2002). The whole CDFS willsoon be covered by an extensive set ofpointings with the new AdvancedCamera for Surveys (ACS) in BVIz to“near HDF” depth. Following up thedeep EIS survey in the CDFS, ESO hasstarted a large program to image theGOODS area with the VLT to obtaindeep JHKs images in some 32 ISAACfields. The first imaging data coveringthe central 50 arcmin2 have recentlybeen made public. Optical spectros-copy across the whole field will be ob-tained with very high efficiency usingVIRMOS on the VLT.
The multiwavelength coverage ofthe field will be complemented by deepradio data from the VLA at 6 cm (al-ready obtained) and ATCA at 20 cm.The CDFS/GOODS will therefore ulti-mately be one of the patches in the skyproviding a combination of the widestand deepest coverage at all wave-lengths and thus a legacy for the future.
Using color-magnitude diagrams and spectroscopyto derive star formation histories: VLT observations of Fornax CARME GALLART 1, Andes Prize Fellow, Departamento de Astronomía, Universidad de
Chile, and Department of Astronomy, Yale UniversityROBERT ZINN, Department of Astronomy, Yale UniversityFREDERIC PONT 2, Departamento de Astronomía, Universidad de ChileEDUARDO HARDY, National Radio Astronomy ObservatoryGIANNI MARCONI, European Southern ObservatoryROBERTO BUONANNO, Osservatorio Astronomico di Roma
kel 1979; Aaronson & Mould 1980),Carina (Cannon, Niss & Norgaard-Niel-sen 1981) and other dSph (Aaronson,Olszewski & Hodge 1983). However,only in the last few years have theseintermediate-age populations beenshown beautifully in the wide-field, ex-tremely deep CMDs of a number ofdSph galaxies. There is the extremecase of Leo I (Caputo et al. 1999; Gal-lart et al. 1999a,b), which has formedover 80% of its stars from 6 to 1 Gyrago, and the intermediate cases of Ca-rina (Smecker-Hane et al. 1996; Hur-ley-Keller et al. 1998; Castellani et al.2001) and Fornax (Stetson et al. 1997;Buonanno et al. 1999), with prominentintermediate-age populations. Thereare also predominantly old systems likeDraco (Aparicio et al. 2001) and UrsaMinor (Carrera et al. 2002).
These CMDs offer qualitative firstglances at the star formation histories(e.g. in the case of Carina, one can seethat there have been three majorevents of star formation), but theirquantitative determination requires adetailed comparison of the distributionof stars in the CMD with that predictedby model CMDs. CMDs reaching theold main-sequence turnoffs are particu-larly useful for these comparisons be-cause there are few uncertainties in thetheory for this stage of a star's life andthere is less age-metallicity degenera-cy. We have shown that with thismethod, it is possible to break the clas-sical age-metallicity degeneracy in stel-lar populations for systems with lowlevels of metal enrichment like Leo I(Gallart et al. 1999b). However, in thecase of a more complicated chemical
1. Star formation and chemicalenrichment histories of theMilky Way satellites
During the last decade, the variedstar formation histories of the dSph gal-axies satellites of the Milky Way havebeen revealed to us in detail, dramati-cally changing our perception from theearly idea that they were predominant-ly old systems. Some hints on the pres-ence of, at least, an intermediate-agepopulation had been provided previ-ously by the peculiarity of the variablestar populations of dSph galaxies (Nor-ris & Zinn 1975) and the discovery ofCarbon stars in Fornax (Demers & Kun-
1Currently: Ramon y Cajal Fellow. Instituto deAstrofísica de Canarias.
2Currently: Observatoire de Genève.
17
used the VLT with FORS1 to obtainphotometry reaching the oldest main-sequence turnoffs and CaII triplet spec-troscopy of a sample of red giantbranch stars in the same fields. The ob-servations and the main results aredescribed below.
2. Wide field color-magnitude diagrams
We obtained old main-sequenceturnoff photometry in three fields at twogalactocentric distances in the dSphFornax, using FORS1 at the VLT. Theobservations were performed in servicemode in July 2000, with the require-ment of seeing ≤ 0.6″, which is key toperform photometry in fields affected bystellar crowding. In some of the frames,
by the units. The extraordinary multi-plexing capability of FLAMES at theVLT will certainly cause a breakthroughin this field in the near future.
A more economical – though less in-formative – way of obtaining metallicityinformation involves low resolutionspectroscopy. The Ca II triplet offers thepossibility of obtaining global [Fe/H]values for individual stars with relative-ly high precision (≤ 0.2 dex), and thistechnique has developed into the mostpopular way of using low-resolutionspectra to estimate the abundances ofstars in globular clusters and dSphgalaxies.
We undertook a study of the star for-mation and chemical enrichment histo-ry of the Fornax dSph galaxy with thetwofold approach described above: we
evolution, the age-metallicity degenera-cy may be more difficult to break(Gallart, Aparicio & Bertelli 2002), andin these cases, obtaining independentconstraints on the age-metallicity rela-tionship Z(t ) may be key to retrievingunambiguously the star formation his-tory.
Spectroscopic studies that wouldprovide direct information on the metal-licities of the stars in these galaxies arescarce, due to the large investment oflarge-aperture telescope time required.Only a few high dispersion spectro-scopic studies of stars in dSph galaxieshave been published so far, either fromKeck-HIRES (e.g. Shetrone, Côté &Sargent 2001 and references therein)or from VLT-UVES (Bonifacio et al.2000), and all count the measured stars
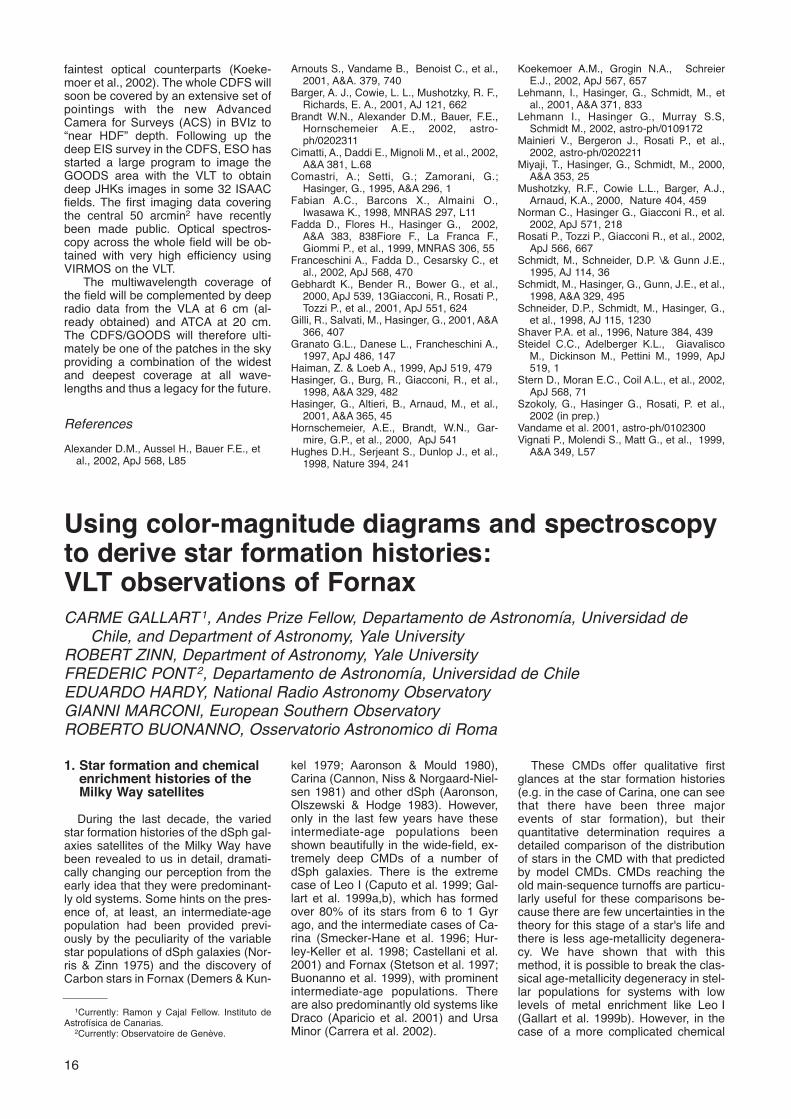
Figure 1: Image of the central field in Fornax obtained by combining the V and FORS1 I images. Cluster 4 is in the bottom left corner. Theoutline of the WFPC2 camera shows the pointing from which the photometry in Figure 2c was obtained. North is up and East is to the left.
18
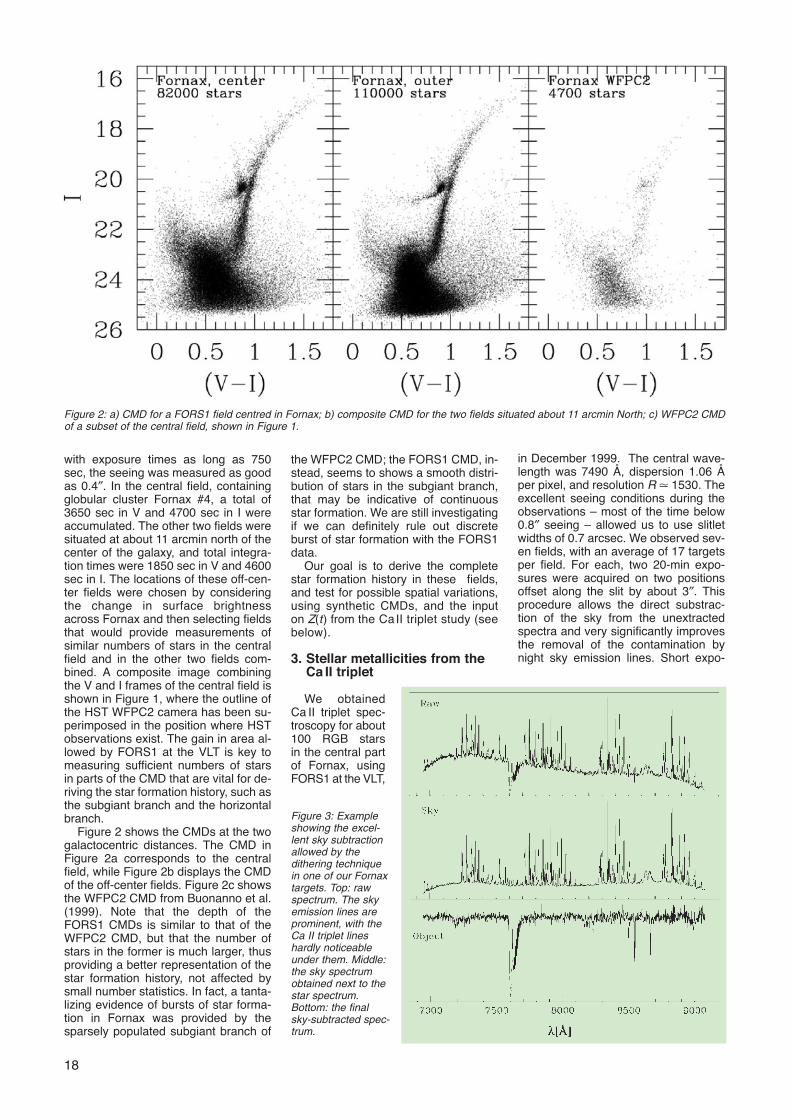
in December 1999. The central wave-length was 7490 Å, dispersion 1.06 Åper pixel, and resolution R � 1530. Theexcellent seeing conditions during theobservations – most of the time below0.8″ seeing – allowed us to use slitletwidths of 0.7 arcsec. We observed sev-en fields, with an average of 17 targetsper field. For each, two 20-min expo-sures were acquired on two positionsoffset along the slit by about 3″. Thisprocedure allows the direct substrac-tion of the sky from the unextractedspectra and very significantly improvesthe removal of the contamination bynight sky emission lines. Short expo-
the WFPC2 CMD; the FORS1 CMD, in-stead, seems to shows a smooth distri-bution of stars in the subgiant branch,that may be indicative of continuousstar formation. We are still investigatingif we can definitely rule out discreteburst of star formation with the FORS1data.
Our goal is to derive the completestar formation history in these fields,and test for possible spatial variations,using synthetic CMDs, and the inputon Z(t) from the CaII triplet study (seebelow).
3. Stellar metallicities from theCa II triplet
We obtainedCa II triplet spec-troscopy for about100 RGB starsin the central partof Fornax, usingFORS1 at the VLT,
with exposure times as long as 750sec, the seeing was measured as goodas 0.4″. In the central field, containingglobular cluster Fornax #4, a total of3650 sec in V and 4700 sec in I wereaccumulated. The other two fields weresituated at about 11 arcmin north of thecenter of the galaxy, and total integra-tion times were 1850 sec in V and 4600sec in I. The locations of these off-cen-ter fields were chosen by consideringthe change in surface brightnessacross Fornax and then selecting fieldsthat would provide measurements ofsimilar numbers of stars in the centralfield and in the other two fields com-bined. A composite image combiningthe V and I frames of the central field isshown in Figure 1, where the outline ofthe HST WFPC2 camera has been su-perimposed in the position where HSTobservations exist. The gain in area al-lowed by FORS1 at the VLT is key tomeasuring sufficient numbers of starsin parts of the CMD that are vital for de-riving the star formation history, such asthe subgiant branch and the horizontalbranch.
Figure 2 shows the CMDs at the twogalactocentric distances. The CMD inFigure 2a corresponds to the centralfield, while Figure 2b displays the CMDof the off-center fields. Figure 2c showsthe WFPC2 CMD from Buonanno et al.(1999). Note that the depth of theFORS1 CMDs is similar to that of theWFPC2 CMD, but that the number ofstars in the former is much larger, thusproviding a better representation of thestar formation history, not affected bysmall number statistics. In fact, a tanta-lizing evidence of bursts of star forma-tion in Fornax was provided by thesparsely populated subgiant branch of
Figure 2: a) CMD for a FORS1 field centred in Fornax; b) composite CMD for the two fields situated about 11 arcmin North; c) WFPC2 CMDof a subset of the central field, shown in Figure 1.
Figure 3: Exampleshowing the excel-lent sky subtractionallowed by thedithering techniquein one of our Fornaxtargets. Top: rawspectrum. The skyemission lines areprominent, with theCa II triplet lineshardly noticeableunder them. Middle:the sky spectrumobtained next to thestar spectrum.Bottom: the finalsky-subtracted spec-trum.
Figure 6: Observed CMDfor the outer Fornax field(left) and model color-magnitude diagram (right)obtained assuming a fitto the Z(t) displayed inFigure 5, a constant starformation rate from 12 to0.6 Gyr ago, and a givenbinary fraction (see textfor details). A few linesaround the upper mainsequence, and a fewglobular cluster RGB locifrom Da Costa & Ar-mandroff (1990) havebeen drawn to guide theeye. Note that the differ-ent density of stars in dif-ferent areas of the CMDmay be due to the factthat the star formationrate has been assumedconstant (we did not tryto model it a this stage).Also the simulation of ob-servational errors is somewhat preliminary and an underestimate of the errors may cause thedifferent width of the main-sequence and the different shape of the red-clump.
19
patible with parts of the CMD other thanthe RGB? The Fornax CMD containsnumerous features associated with aparticular age and metallicity, namely ahorizontal branch, an important redclump with a long tail at the bright end,and a main sequence extending to MI ~–0.5. These features indicate respec-tively the existence of an old, metal-poor population, a significant intermedi-ate-age population, and a very recentpopulation, as young as �500 Myr old.All of these are qualitatively compatiblewith the picture obtained from the RGBand the Ca II triplet, which indicates theneed for a substantial amount of youngpopulation to account for the blue colorof the metal-rich stars.
The locations of these evolutionaryphases in the CMD depend on themetallicities and the ages of the stars(thus on Z(t )), while the numbers ofstars in each phase depend on the life-time of the phase and the star formationhistory of Fornax. To test if the derivedZ(t) produces stars in the right positionsin the CMD, we computed a syntheticmodel of the Fornax CMD assumingthat Z(t) and a constant star formationrate starting 12 Gyr ago and stopping600 Myr ago, to account for the ab-sence of a very bright main sequence inthe CMD. Z(t) was approximated by alinear interpolation between (Gyr ~ z) =(15.0,0.0001), (10,0.0011), (2, 0.0036),(1, 0.0057) and (0, 0.008). We used thesynthetic CMD code ZVAR (Bertelli etal. 2002) with the Bertelli et al (1994)generation of Padova stellar evolution-ary models. A Kroupa, Tout & Gilmore(1993) IMF has been assumed, and abinary fraction β = 0.25, with mass frac-tion q > 0.7 and flat IMF for the sec-ondary stars. For a description of theseparameters and the way they are usedin the ZVAR code, the reader is referred
on the RGB pro-vides a constrainton its age, andtherefore, a welldelineated age-metallicity relationcan be obtained,especially for themore metal-rich,young stars. Thecolors of mostmetal-rich RGBstars are muchbluer than thoseof an old globularcluster of thesame metallicity,and lead to theconclusion thatthey must bemuch younger.Indeed, while for
each given metallicity, stars older than� 3 Gyr have a small range in color, theyounger stars are substantially and in-creasingly bluer with decreasing age. InFigure 5 we display a preliminary ver-sion of the Fornax age-metallicity rela-tion obtained by Pont et al. (2002).
Finally, using theoretical evolutionarymodels, we investigated the relationbetween the stellar population repre-sented in the fraction of the RGB thathas been spectroscopically observed,and the total population of the galaxy.
4. Combining CaII triplet spectroscopy with thecolor-magnitude diagram: a coherent picture of the Fornax star formation history
The Z(t) shown in Figure 5 was ob-tained by combining the spectroscopicmetallicity with the position of the starson the RGB. But is our picture com-
sures were also obtained on selectedred giants of three nearby globular clus-ters of known metallicity for calibrationpurposes.
Figure 3 show the excellent sky sub-straction that can be achieved with thedithering technique discussed above.Figure 4 shows three examples of thequality of the spectra obtained for oneof the brightest, faintest and intermedi-ate-brightness stars in our sample.
We find a large metallicity dispersionin Fornax, with about 20% of the ob-jects having low abundances (–2.5 ≤[Fe/H] ≤ –1.3), and about 35% havingabundances greater than 47 Tuc([Fe/H] = –0.7). The peak of the metal-licity distribution occurs at [Fe/H] �–0.9. The most metal rich stars haveCa II triplet equivalent widths W(Ca) asstrong as the average of the metal-rich-er LMC population in Cole et al. (2000).This allows us to put an upper limit tothe metallicity of the stars in Fornax,which lie in a somewhat uncertain areaof the W (Ca)-[Fe/H] calibration (seePont et al. 2002 for a thorough discus-sion of this point).
The combination of the spectroscop-ic metallicity for each star with its color
Figure 4: Representative spectra for three stars spanning the lumi-nosity range of our targets.
Figure 5: Age-metallicity relation obtainedfor Fornax from Ca II triplet spectroscopyand RGB photometry. See text for details.
20
Buonanno, R., Corsi, C.E., Castellani, M.,Marconi, G., Fusi Pecci, F. & Zinn, R.1999, AJ, 118, 1671
Cannon, R.D., Niss, B. & Norgaard-Nielsen,H.U. 1981, MNRAS, 196, 1
MNRAS, 262, 545 Norris, J. & Zinn, R. 1975, ApJ, 202, 335Pont, F., Zinn, R., Gallart, C., Winnick, R.,
Hardy, E. 2002, in preparationShetrone, M.D., Côté, P. & Sargent, W.L.W.
2001, ApJ, 548, 592 Smecker-Hane, T. A., Stetson, P. B., Hesser,
J. E. & van den Bergh, D. A. 1996 in Fromstars to galaxies..., eds.
C. Leitherer, U. Fritze-van Alvensleben & J.Huchra. ASP Conf Ser, 98, 328
Stetson P. B., Hesser, J. E. & Smecker-Hane, T. A. 1998,
PASP, 110, 533
Tuc, from Da Costa & Armandroff(1990). Notice that the model RGB issomewhat redder than the observedone. This disagreement, which is largerfor the fainter RGB stars, is known toexist from other comparisons betweenobservations and the Padova stellarevolutionary models. It has no effect onour major conclusion that the Z(t )shown in Figure 5 is compatible withthe morphology of the Fornax CMD. Aquantitative derivation of the star for-mation history from a thorough fit of theCMD will add further confidence in thereconstruction of the history of Fornax.It will be presented in Gallart et al.(2002).
Acknowledgements. This researchis part of a Joint Project betweenUniversidad de Chile and YaleUniversity, funded partially by theFundación Andes. C.G. acknowledgespartial support from Chilean CONICYTthrough FONDECYT grant number1990638. R.Z. was supported by NSFgrant AST-9803071 and F.P. by theSwiss National Science Fund andFONDECYT grant number 3000056.
References
Aaronson, M., Olszewski, E.W. & Hodge,P.W. 1983, ApJ, 267, 271
Aaronson, M. & Mould, J. 1980, ApJ, 240, 804Aparicio, A., Carrera, R. & Martínez-Del-
gado, D. 2001, AJ, 122, 2524Bertelli, G., Bressan, A., Chiosi, C., Fagotto,
F. & Nasi, E. 1994, A&AS, 106, 275 Bertelli, G. et al. 2002, in preparation Bonifacio, P., Hill, V., Molaro, P., Pasquini,
L., Di Marcantonio, P., & Santin, P. 2000,A&A, 359, 663
to Gallart et al. (1999b). The complete-ness and error simulation has beenperformed using a preliminary crowdingtest table obtained from the deep VLTimaging for Fornax presented in Gallartet al. (2002).
The resulting synthetic CMD is dis-played in Figure 6, to the right of the ob-served CMD. The synthetic CMD suc-cessfully reproduces the major mor-phological features of the observedCMD, namely the RGB, the horizontalbranch, the red-clump and the main-se-quence. Particularly important is theagreement between locations of theyoung main-sequence stars (a set oflines have been drawn in both the ob-served and model CMDs to guide theeye). Its position is very sensitive tometallicity of the stars younger thanabout 2 Gyr. If their metallicity werelower than that given by the Z(t) rela-tion, for example, lower than [Fe/H] ≤–0.7, as one could deduce from the col-or of the RGB without correction for theyoung ages of the stars, then the posi-tion of this part of the main sequencewould be substantially too blue. Thereis also striking agreement between themodel and observed CMDs for theplume of stars above the red-clump,which is composed of metal rich youngstars (younger than 1 Gyr and with Z �0.006–0.008) undergoing their He-burning loop phase of stellar evolution.The most obvious disagreement be-tween the model and the observedCMDs is in the color of the RGB. To il-lustrate this we have plotted in both di-agrams the fiducial RGBs of the globu-lar clusters M15, M2, NGC 1851 and 47
The ups and downs of a stellar surface: Nonradialpulsation modelling of rapid rotatorsTHOMAS RIVINIUS, DIETRICH BAADE, ESO, Garching b. München, GermanySTANISLAV ŠTEFL, Astronomical Institute, Academy of Sciences Ondřejov, Czech Republic, MONIKA MAINTZ, Landessternwarte Heidelberg, GermanyRICHARD TOWNSEND, University College London, United Kingdom
1. Introduction
Usually one thinks of stars as stableobjects, taking at least millions of yearsto evolve significantly. While it is truethat stars take such timescales to age,they need not be “stable” in a staticsense over all that time. Many stars infact undergo pulsations on timescalesbetween minutes and years, as for in-stance the Be stars Baade, Riviniusand Štefl reported about in a recentMessenger issue (No. 107, p. 24). Themost obvious pulsation mode is theradial one, where the star becomes big-ger and smaller periodically, and like
any expanding/compressing gas alsocooler and hotter again. We seethese stars varying in brightness andcolour, and their spectra cyclically ap-proaching and receding. The wellknown Mira in the constellation CetusP = 330 day), or the Cepheids (P =1…50 day), which help in measuringextragalactic distances, are such ob-jects. Stars may not only pulsate radial-ly, however. Imagine a free-floatingblob of water in a Space Shuttle, or abig soap bubble. Before reaching astable spherical shape (or popping)they undergo damped wobbles. This,in a sense, is externally excited non-
radial pulsation (nrp) in a multitude ofmodes.
Nonradially pulsating stars behavesimilarly. But since these pulsations areexcited from inside the star and are go-ing on for millions of cycles, they ap-pear more ordered as most modes aredamped, and typically only one or fewhigh-amplitude modes are excited in annrp star. The excitation process resem-bles a Carnot process (as in an idealsteam engine) where the role of thevalve is played by a layer inside the starthat turns opaque with increasing tem-perature due to ionization processesand becomes transparent again during