Using crystal size distribution analysis to evaluate the thermal evolution of plagioclase- bearing MORB A manuscript in preparation by Ben Wernette 1. Abstract Crystal size distribution (CSD) analysis and available sample chemistry of plagioclase-bearing MORB from different spreading centers (Cocos-Galapagos, Cocos-Nazca, Knipovich, Mohns, Mid- Atlantic, Southwest Indian Ridge, Juan de Fuca, and Blanco), representing different stages of rift development, are used to assess variations in heat loss and plagioclase residence times. CSDs suggest rapid cooling during the initial stages of rift development (e.g., Cocos-Galapagos spreading). Where large crystals are present (~ 1 cm), CSDs are characteristically concaved upward. The growth of larger crystals is consistent with the maturation of a spreading center and slower conductive heat loss or longer crystal residence times. These observations are true for both megacryst (> 1 mm) and microlite (< 1 mm) populations, suggesting that thermal differences between spreading domains extend from upper mantle to crustal levels. For plagioclase ultra-phyric lavas (PUB, > 15 vol. % plagioclase), a three-stage process is used to explain the size distribution of plagioclase crystals. First, magmas cool and begin to nucleate plagioclase. Second, larger plagioclase crystals grow at the expense of smaller crystals (Oswald ripening). Finally, the nucleation of microlites during magma ascent to seafloor acts to ‘erase’ much of the expected crystal coarsening signature. In agreement with other workers, host-glass major element variations indicate that the eruption of phyric lavas is dependent on either limited conductive heat loss, rapid ascent velocities, or both. 2. Introduction Mid-ocean ridge volcanism accounts for the majority of extrusive volcanic activity globally. As a result, much of our current understanding of igneous processes, and the Earth’s upper mantle, is informed by the study of mid-ocean ridge basalt (MORB). Crustal thickness and axial ridge depth is proportional to the total flux of melt extracted from the mantle melting column (Klein and Langmuir, 1987; Langmuir et al., 1992; Plank et al., 1995). This provides qualitative information about the thermal conditions beneath a given ridge segment. Christie and Sinton (1981) predicted that during the initial stages of rift
Transcript
Using crystal size distribution analysis to evaluate the thermal evolution of plagioclase-
bearing MORB
A manuscript in preparation by Ben Wernette
1. Abstract
Crystal size distribution (CSD) analysis and available sample chemistry of plagioclase-bearing
MORB from different spreading centers (Cocos-Galapagos, Cocos-Nazca, Knipovich, Mohns, Mid-
Atlantic, Southwest Indian Ridge, Juan de Fuca, and Blanco), representing different stages of rift
development, are used to assess variations in heat loss and plagioclase residence times. CSDs suggest
rapid cooling during the initial stages of rift development (e.g., Cocos-Galapagos spreading). Where large
crystals are present (~ 1 cm), CSDs are characteristically concaved upward. The growth of larger crystals
is consistent with the maturation of a spreading center and slower conductive heat loss or longer crystal
residence times. These observations are true for both megacryst (> 1 mm) and microlite (< 1 mm)
populations, suggesting that thermal differences between spreading domains extend from upper mantle to
crustal levels. For plagioclase ultra-phyric lavas (PUB, > 15 vol. % plagioclase), a three-stage process is
used to explain the size distribution of plagioclase crystals. First, magmas cool and begin to nucleate
plagioclase. Second, larger plagioclase crystals grow at the expense of smaller crystals (Oswald ripening).
Finally, the nucleation of microlites during magma ascent to seafloor acts to ‘erase’ much of the expected
crystal coarsening signature. In agreement with other workers, host-glass major element variations
indicate that the eruption of phyric lavas is dependent on either limited conductive heat loss, rapid ascent
velocities, or both.
2. Introduction
Mid-ocean ridge volcanism accounts for the majority of extrusive volcanic activity globally. As a
result, much of our current understanding of igneous processes, and the Earth’s upper mantle, is informed
by the study of mid-ocean ridge basalt (MORB). Crustal thickness and axial ridge depth is proportional to
the total flux of melt extracted from the mantle melting column (Klein and Langmuir, 1987; Langmuir et
al., 1992; Plank et al., 1995). This provides qualitative information about the thermal conditions beneath a
given ridge segment. Christie and Sinton (1981) predicted that during the initial stages of rift
development, crustal-level conductive heat loss is rapid owing to magma moving into cold crust. As
magmatic spreading is established and crustal rocks are heated, the conductive heat loss is minimized and
a variety of melt compositions are expected to mix at crustal levels, obscuring primary mantle melt
compositions (Christie and Sinton, 1981; Sinton and Detrick, 1992; Rubin and Sinton, 2007). How the
oceanic crust acts to modify magmas prior to eruption has been referred to as the “crustal filter” (Rubin et
al., 2009).
The mode and chemical composition of the crystal cargo of erupted basalts provides information
about processes that occur at depth beneath a spreading center prior to eruption on the seafloor (e.g.,
Hellevang and Pederson, 2008; Zellmer et al., 2010; Lange et al., 2013a; Drignon et al., 2018). Many such
studies have shed light on the time-scale of eruption events (Zellmer et al., 2010; Costa et al., 2010), melt
pathways (Wanless and Shaw, 2012; Bennett et al., 2019), and magma mixing events (Rhodes et al.,
1979). Experimental studies indicate that crystallization of basaltic liquids can results in crystal
agglomeration and coarsening (Pupier et al., 2008; Ni et al., 2014; Giuliani et al., 2020). This suggests
that the thermal conditions of a given ridge will be reflected in the size and distribution of crystals carried
in erupted lavas. However, phyric MOR lavas are relatively rare (Lange et al., 2013), as is the occurrence
of phyric lavas from spreading centers representing different stages in rift development.
Here, we examine plagioclase-phyric lavas from locations representing different stages in
spreading center development to assess whether expected changes in thermal conditions are reflected in
the size and distribution of crystal cargo and host lava chemistry. We find that during the initial stages of
rift development, phyric lavas are rare and the maximum length of plagioclase crystals is small. As
magmatic spreading is established, the maximum length of plagioclase increases as predicted by
theoretical and experimental studies. Even among larger crystal populations (> 1 mm), there are
noticeable differences in the size distribution of crystals among spreading centers representing different
stages of development. This is likley indicative of changes in conductive heat loss and crystal growth
kinematics.
3. Crystal Size Distribution - Theory
Crystal size distribution analysis (CSD) was first applied to geologic systems by Marsh
(1988) and specifically to igneous petrology by Cashman and Marsh (1988). Since, CSD analysis has
enjoyed application to a variety of geologic sub-disciplines including planetary geology (Neal et al.,
2015), volcanology (Morgan et al., 2013), igneous petrology (Cashman and Marsh, 1988; Higgins, 1996;
Boorman et al., 2004), and metamorphic petrology (Cashman and Ferry, 1988). CSD analysis is
particularly attractive because it is a non-destructive technique that provides researchers with quantitative
data allowing for the interpretation of geologic processes including closed system fraction, crystal
accumulation, and magma mixing (Marsh, 1988). The following overview borrows heavily from the work
of Marsh (1988), Cashman and Marsh (1988), and Higgins (1996; 2006). For more information, readers
are directed to the work of these authors.
Crystal size population density is the total number of crystals, 𝑛, within a given crystal size range,
𝐿, per unit volume. Graphically, population density equates to the slope of a line plotting crystal size
against total number of crystals:
𝑁(𝐿) = ∫ 𝐿0𝑛(𝐿)𝑑𝐿
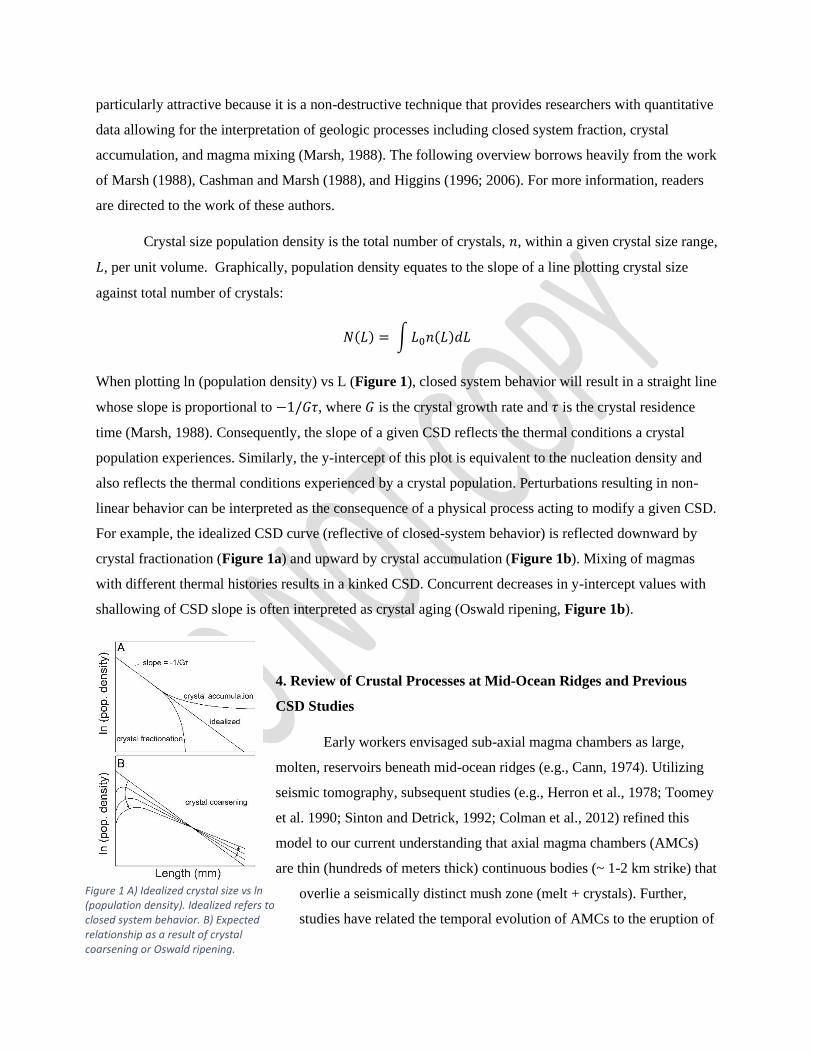
When plotting ln (population density) vs L (Figure 1), closed system behavior will result in a straight line
whose slope is proportional to −1/𝐺𝜏, where 𝐺 is the crystal growth rate and 𝜏 is the crystal residence
time (Marsh, 1988). Consequently, the slope of a given CSD reflects the thermal conditions a crystal
population experiences. Similarly, the y-intercept of this plot is equivalent to the nucleation density and
also reflects the thermal conditions experienced by a crystal population. Perturbations resulting in non-
linear behavior can be interpreted as the consequence of a physical process acting to modify a given CSD.
For example, the idealized CSD curve (reflective of closed-system behavior) is reflected downward by
crystal fractionation (Figure 1a) and upward by crystal accumulation (Figure 1b). Mixing of magmas
with different thermal histories results in a kinked CSD. Concurrent decreases in y-intercept values with
shallowing of CSD slope is often interpreted as crystal aging (Oswald ripening, Figure 1b).
4. Review of Crustal Processes at Mid-Ocean Ridges and Previous
CSD Studies
Early workers envisaged sub-axial magma chambers as large,
seismic tomography, subsequent studies (e.g., Herron et al., 1978; Toomey
et al. 1990; Sinton and Detrick, 1992; Colman et al., 2012) refined this
model to our current understanding that axial magma chambers (AMCs)
are thin (hundreds of meters thick) continuous bodies (~ 1-2 km strike) that
overlie a seismically distinct mush zone (melt + crystals). Further,
studies have related the temporal evolution of AMCs to the eruption of
Figure 1 A) Idealized crystal size vs ln (population density). Idealized refers to closed system behavior. B) Expected relationship as a result of crystal coarsening or Oswald ripening.
lavas on the seafloor (e.g., Xu et al., 2014) and established that the existence of AMCs is positively
correlated with ridge spreading rate.
Like the processes informed by geophysical data, the crystal cargo of erupted basalts provides
information about the processes that act to modify magmas prior to eruption. Lange et al. (2013)
established that diverse 87Sr/86Sr ratios are preserved in plagioclase crystals found in plagioclase ultra-
phyric basalts (PUB), that contain > 15 % plagioclase (Lange et al., 2013a) and that this variability is
equal to that observed in lavas at the scale of first-order ridge segments. A wide range in liquid
compositions have also been reported for mineral-hosted melt inclusions (Nielsen et al., 1995; Michael et
al., 2002; Danyushevsky et al., 2003; Danyshevsky et al., 2004; Drignon et al., 2018). Further, olivine-
and plagioclase-hosted melt inclusion studies (Wanless and Shaw, 2012; Drignon et al., 2018; Bennet et
al., 2019) have revealed that the crystal cargo carried by basalt can be scavenged from depths well beyond
the local MOHO. Indeed, Hellevang and Pederson (2008) attribute diverse crystal morphologies in a
single sample to complicated melt pathways that scavenge crystals (xenocrysts) from different depths. Sr
diffusion in plagioclase microlites (e.g., Zellmer et al., 2010) yields microlite residence times on the order
of days to months for ultra-slow to intermediate spreading ridges, suggesting that magma ascent in the
oceanic crust is a geologically ‘fast’ process. The presence of highly-phyric lavas appears to be restricted
to intermediate, slow, and ultra-slow spreading centers leading researchers to conclude that the physical
processes at these ridge systems are more amenable to the transport of plagioclase crystals to the seafloor
(Lange et al., 2013a; Lange et al., 2013b; Drignon et al., 2018). One such hypothesis is that the presence
of axial magma chambers at fast spreading centers acts to decrease magma ascent velocities allowing
crystals to settle out of ascending melt (Lange et al., 2013a, b).
CSD analysis of MORB is made difficult by the paucity of crystals in most MORB samples (e.g.,
Batiza and Niu, 1992). Those few CSD studies that do exist have been used to examine a wide variety of
processes in MORB. For MORB popping rocks, linear vesicle CSDs allowed Sarda and Graham (1990) to
conclude that bubble nucleate continuously during magmas ascent. For PUB from Mohns and Knipovich
ridges, flat CSDs at larger crystal sizes led Hellevang and Pederson (2008) to conclude that plagioclase
crystals accumulate at crustal depths and are then carried to the surface sometime later. Experimental
studies of crystal growth in basaltic liquids with decreasing temperature (e.g., Pupier et al., 2008; Ni et al.,
2014; Giuliani et al., 2020) show that time spent above the liquidus impacts crystal nucleation and that the
growth of larger crystals with decreasing temperature commonly occurs at the expense of smaller crystals
by the process of crystal aging.
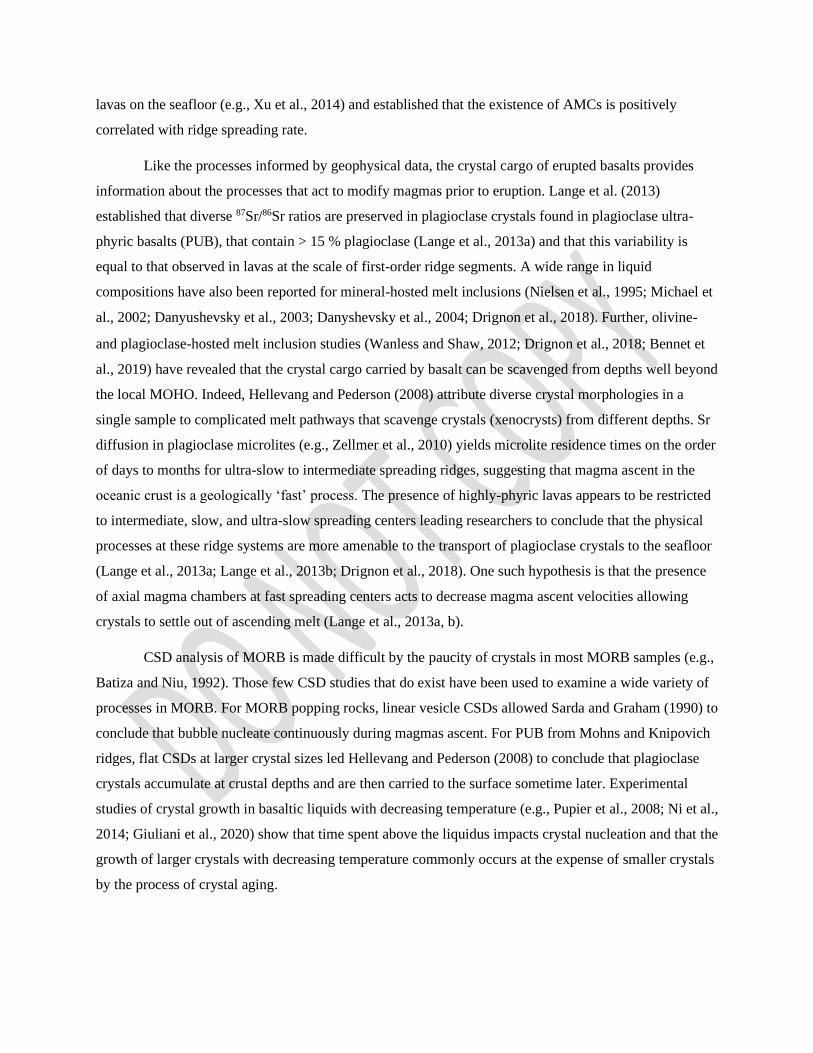
5. Cocos-Nazca Spreading Center and Lava Samples
The Cocos-Nazca Spreading Center is a v-shaped propagating ridge whose tip is located just east
of the fast-spreading EPR (Lonsdale, 1988). The Spreading Center is propagating at a rate that is equal to
the EPR half spreading rate, or ~ 60 mm/year (Hey, 1978; Lonsdale, 1988). A series of second-order
ridge segments act to separate the Cocos plate from the Galapagos microplate and Nazca plate,
respectively (Hey, 1978; Lonsdale, 1988; Smith and Schouten, 2018; Smith et al., 2020). Axial ridge
thickness increase with distance from the gore tip (Smith et al., 2020). Changes from Cocos-Galapagos to
Cocos-Nazca spreading are also reflected in a 10-degree change in ridge-axis orientation (087° vs 097°,
Smith et al., 2020) and coincide with a noticeable increase in plagioclase crystal content and variability
between individual samples. Lavas from the Spreading Center are limited in their overall chemical
variability characteristically and have been interpreted to have formed by partial melting of a depleted
mantle source (see Chapter 2 or Wernette et al., 2020), in both a local (EPR) and global sense (Global
MORB, Gale et al., 2013). Changes in spreading domain, Cocos-Galapagos spreading vs Cocos-Nazca
spreading, reflect the transition from tectonic rifting to magmatic seafloor spreading. This transition, from
Cocos-Galapagos spreading to Cocos-Nazca spreading, is unique and allows for the evaluation of existing
models of mid-ocean ridge development with time.
Samples were collected
April-May 2018 aboard the R/V
Sally Ride (Leg 1806). For the
Cocos-Nazca Spreading Center,
the occurrence of aphyric and
phyric lavas broadly coincides
with the two spreading domains
(Cocos-Galapagos, Cocos-
Nazca). The phenocryst content
variability also coincides with
axial ridge depth and spreading
rate (see Figure 2). It is important to
note that aphyric lavas are also
Figure 2 Bathymetry of the Cocos-Nazca Spreading Center and the surrounding region. Sample locations are also given. Bubble size corresponds to plagioclase volume percent.
sampled from the Cocos-Nazca Spreading Center and that this dataset focuses only on the phyric lavas
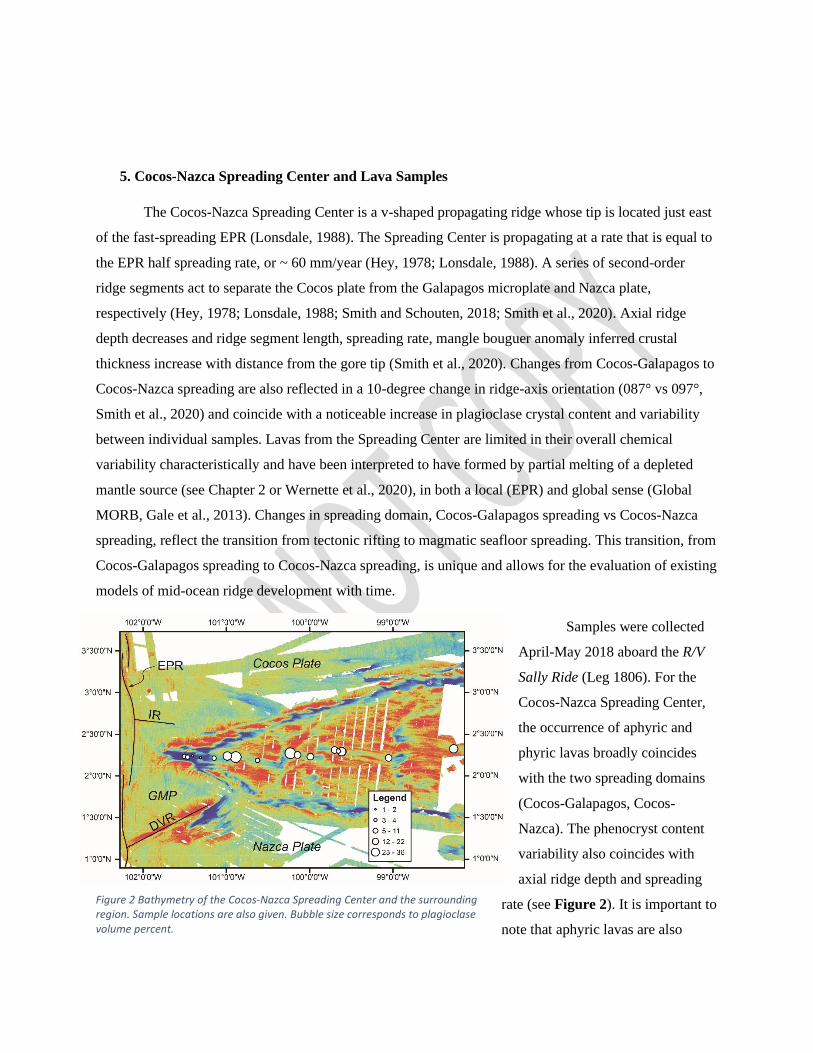
from each spreading domain. Phyric lavas are generally fresh with little alteration and minimal
vesicularity. The majority of samples have glassy rinds and plagioclase is the only crystalline phase
present in these samples (see Figure 3).
A select group of samples from Lange et al. (2013) and
Hellevang and Pederson (2008) are included in this study. Samples
from Lange et al. (2013) are from the Juan de Fuca ridge, the Mid-
Atlantic Ridge, the Southwest Indian Ridge, and the Blanco fracture
zone. Samples from Hellevang and Pederson (2008) are from the
Knipovich and Mohns ridges. Lavas from each study are plagioclase
ultraphyric basalts (PUB, > 15 vol. % plagioclase, Lange et al., 2013a).
6. Methods
Cut slabs were scanned and imported into the image processing
software ImageJ (Schneider et al., 2012). Plagioclase phenocrysts were
identified by color and measured. Partial crystals along the margins
were excluded. Crystals with a measured area of < .01 mm were also
excluded. Following the methods of Boorman et al. (2002), we
imported the measured feret major and minor axes into the program
CSDSlice (Morgan and Jerram, 2006) to determine the best-fit short,
intermediate, and long axes for conversion from 2- to 3D. The feret
major axis is the greatest measured distance between two points of a
given crystal while the feret minor axis is the minimum distance
between two points of a given crystal. For all samples, the best-fit modelled 3-D shape has R2 ≥ 0.70 with
mean R2 ≈ 0.85. Examples of the modelled 3-D fit to input data are given in the Supplementary
Information.
For 3-D size distribution calculations, plagioclase measurements (feret major, feret minor) were
imported into the program CSD Corrections (Higgins, 2000; Higgins, 2002) with the best-fit short,
intermediate, and long axes determined by CSDSlice. For all CSD calculations, we use the standard
default of 5 bins per log unit and a roundness of 0.6. Roundness is determined by ImageJ and is equal to
1/aspect ratio, where aspect ratio is the major axis/minor axis. Size intervals with 1 crystal are not
statistically significant and introduce errors in CSD regression calculation. Consequently, these crystals
Figure 3 Examples of plagioclase-phyric lavas sampled from the Cocos-Nazca Spreading Center. Scale bar is 1 cm. Additional information for each sample is given in Table 1.
are intentionally removed from the dataset. Similarly, size bins with a 2σ of infinity are also excluded due
to a limited number of crystals present in that particular size range. Data accuracy was assessed by
comparing plagioclase volume measured by intersection data (point counting) to plagioclase volume
determined by CSD (R2 = 0.95, Figure 4).
Following the methods of Klein et al. (1991),
major elements and high-abundance trace elements
(V, Cr, Co, Ni, Zn, Sr, Y, Zr, and Ba) were measured
using a Fisons Spectraspan 7 Direct Current Plasma
Emission Spectrometer (DCP) following a LiBO2
flux-fusion. Low-abundance trace elements were
measured using a Thermo-Fisher VG PlasmaQuad 3
Inductively Coupled Plasma Mass Spectrometer
(ICP-MS) following a two-acid (HF-HNO3)
digestion.
PUB CSD data was collected using published
hand sample and thin section images (Hellevang et al., 2008; Lange et al., 2013a) following the methods
outlined above. Geochemical data for PUB are from Hellevang et al. (2008) and Nielsen et al. (2020).
Where mentioned, relative ages of mid-ocean ridges are as follows: 1. Cocos-Galapagos (< 2 Ma,
and Pederson, 2008), and 4. MAR, EPR, JdF, SWIR, Blanco > 7 Ma.
7. Results
7.1 Crystal Size Distribution
Crystal size distribution plots (size vs ln population density) of plagioclase are shown in Figure
5. All show a characteristic concave upward curvature, becoming more pronounced in the samples with
larger plagioclase grains. Thus, the phyric samples from the Cocos-Galapagos spreading regime (Figure
5a) have the smallest grain sizes (0.5 – 4 mm) and are the only group that is approximately log-linear with
similar slope. In contrast, the PUB lavas from Lange et al. (2013) extend to crystal sizes similar to that
Figure 4 Correlation between true plagioclase volume and CSD calculated plagioclase volume.
observed for the Cocos-Nazca
spreading regime with one sample
with crystals as large as 20 mm
(TT170-47-11, Figure 5c).
It is important to note that
due to the curved nature of
individual CSDs, we separate each
sample into two size bins (> 1 mm
and < 1 mm) with roughly linear
distributions. CSD slope and
intercept values are calculated for
each size bin and denoted with
either > 1 mm or < 1 mm. All samples
from this study as well as those from
Lange et al. (2013) and Hellevang and
Pederson (2008) described above show a broad negative correlation between CSD slope and CSD
intercept (Figure 6a). Calculated residence times for the volumetrically dominate > 1 mm size population
show a broad correlation with plagioclase mode (R2 = 0.56, Figure 6b).
7.2 Geochemistry
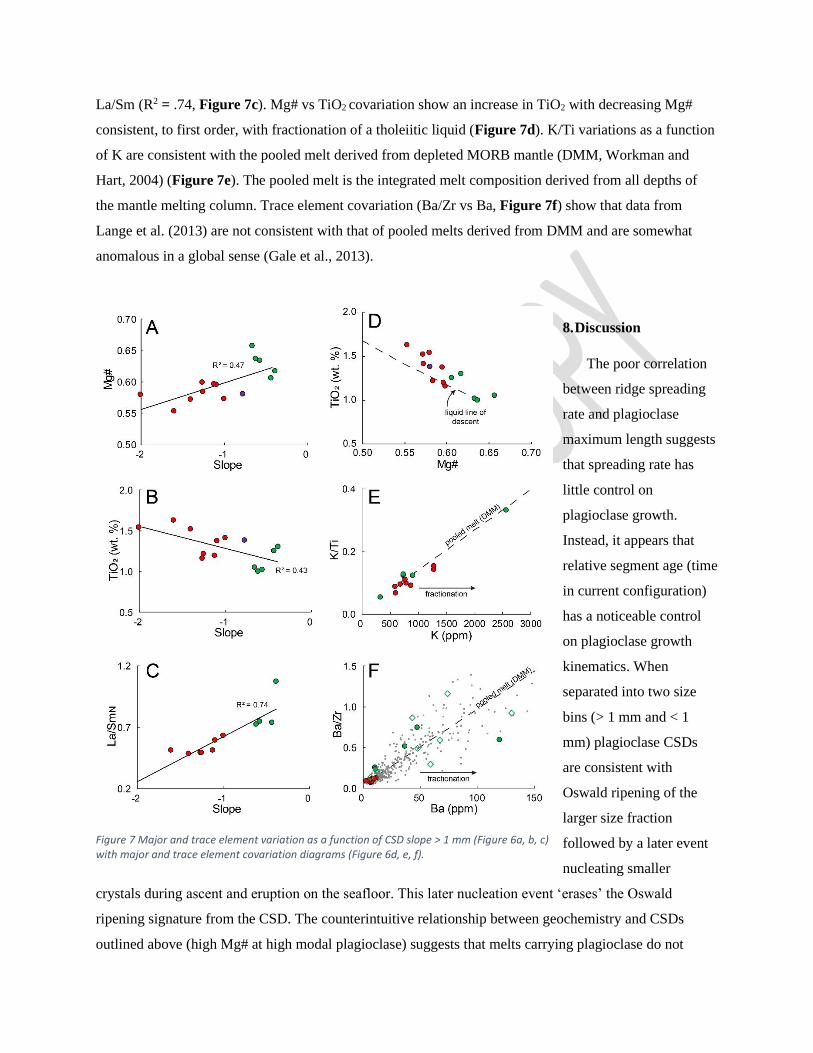
Figure 7 shows major and trace element variation in the volcanic
glass or ground mass fraction as a function of CSD slope > 1 mm
(Figure 7a, b, c) as well as major and trace element covariations in
the glass or ground mass (Figure 7d, e, f). Overall, flattening of the
plagioclase CSD slope > 1 mm (i.e., more larger crystals associate
with flatter slopes) is accompanied by a broad increase in Mg# (R2 =
0.47, Figure 7a) and decrease in TiO2 (R2 = 0.43, Figure 7b).
Correlations between CSD slope < 1 mm and Mg# and TiO2 are
similar with R2 values of .53 and .27, respectively. Increases in the
Mg# are also weakly correlated with greater plagioclase modal
abundance (R2 ≈ 0.41, not shown). Shallowing of CSD slope > 1
mm is also accompanied by an increase in chondrite-normalized
Figure 5 Size distribution plots for plagioclase from the Cocos-Galapagos spreading regime (A), the Cocos-Nazca spreading regime (B), and select samples from Lange et al. (2013) and Hellevang and Pederson (2008) (C).
Figure 6 A) CSD slope vs CSD intercept for both the > 1 mm size fraction (filled symbols) and < 1 mm size fraction (hollow symbols). B) CSD slope > 1 mm vs plagioclase crystal maximum length (mm).
La/Sm (R2 = .74, Figure 7c). Mg# vs TiO2 covariation show an increase in TiO2 with decreasing Mg#
consistent, to first order, with fractionation of a tholeiitic liquid (Figure 7d). K/Ti variations as a function
of K are consistent with the pooled melt derived from depleted MORB mantle (DMM, Workman and
Hart, 2004) (Figure 7e). The pooled melt is the integrated melt composition derived from all depths of
the mantle melting column. Trace element covariation (Ba/Zr vs Ba, Figure 7f) show that data from
Lange et al. (2013) are not consistent with that of pooled melts derived from DMM and are somewhat
anomalous in a global sense (Gale et al., 2013).
8. Discussion
The poor correlation
between ridge spreading
rate and plagioclase
maximum length suggests
that spreading rate has
little control on
plagioclase growth.
Instead, it appears that
relative segment age (time
in current configuration)
has a noticeable control
on plagioclase growth
kinematics. When
separated into two size
bins (> 1 mm and < 1
mm) plagioclase CSDs
are consistent with
Oswald ripening of the
larger size fraction
followed by a later event
nucleating smaller
crystals during ascent and eruption on the seafloor. This later nucleation event ‘erases’ the Oswald
ripening signature from the CSD. The counterintuitive relationship between geochemistry and CSDs
outlined above (high Mg# at high modal plagioclase) suggests that melts carrying plagioclase do not
Figure 7 Major and trace element variation as a function of CSD slope > 1 mm (Figure 6a, b, c) with major and trace element covariation diagrams (Figure 6d, e, f).
evolve. Consequently, these correlations might represent variations in magma ascent velocity, conductive
heat loss, or both.
8.1 CSD and Plagioclase Bearing Basalts
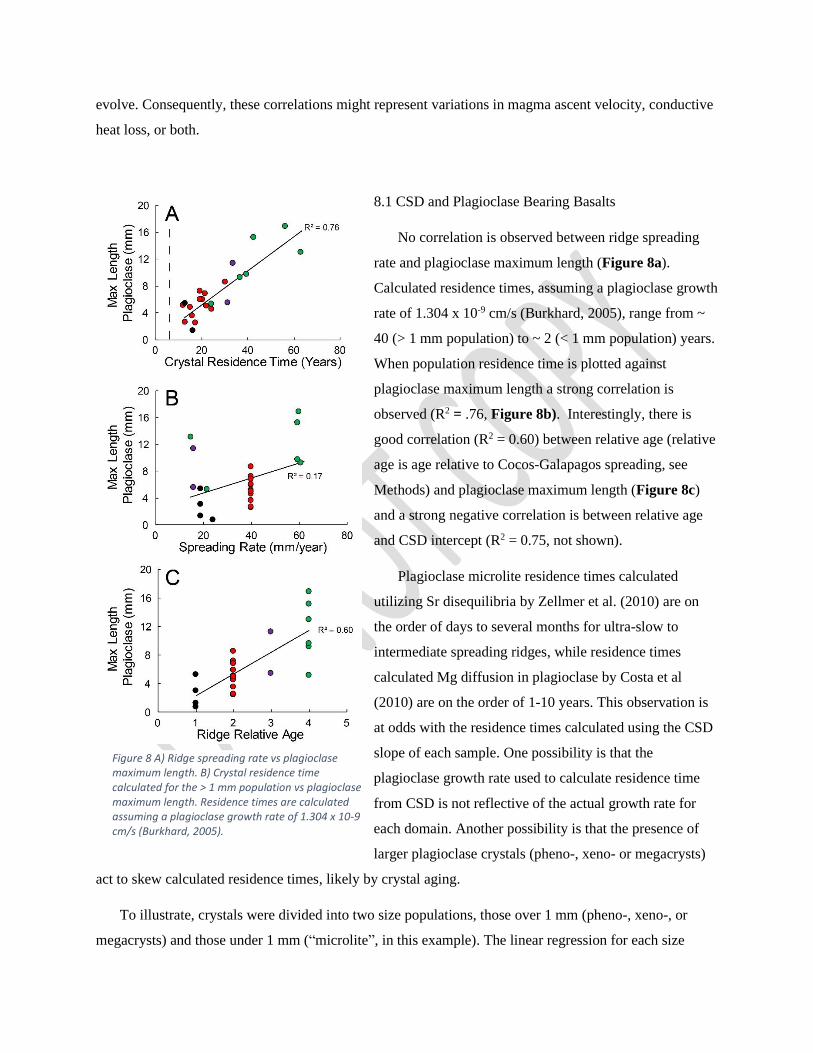
No correlation is observed between ridge spreading
rate and plagioclase maximum length (Figure 8a).
Calculated residence times, assuming a plagioclase growth
rate of 1.304 x 10⁻⁹ cm/s (Burkhard, 2005), range from ~
40 (> 1 mm population) to ~ 2 (< 1 mm population) years.
When population residence time is plotted against
plagioclase maximum length a strong correlation is
observed (R2 = .76, Figure 8b). Interestingly, there is
good correlation (R2 = 0.60) between relative age (relative
age is age relative to Cocos-Galapagos spreading, see
Methods) and plagioclase maximum length (Figure 8c)
and a strong negative correlation is between relative age
and CSD intercept (R2 = 0.75, not shown).
Plagioclase microlite residence times calculated
utilizing Sr disequilibria by Zellmer et al. (2010) are on
the order of days to several months for ultra-slow to
intermediate spreading ridges, while residence times
calculated Mg diffusion in plagioclase by Costa et al
(2010) are on the order of 1-10 years. This observation is
at odds with the residence times calculated using the CSD
slope of each sample. One possibility is that the
plagioclase growth rate used to calculate residence time
from CSD is not reflective of the actual growth rate for
each domain. Another possibility is that the presence of
larger plagioclase crystals (pheno-, xeno- or megacrysts)
act to skew calculated residence times, likely by crystal aging.
To illustrate, crystals were divided into two size populations, those over 1 mm (pheno-, xeno-, or
megacrysts) and those under 1 mm (“microlite”, in this example). The linear regression for each size
Figure 8 A) Ridge spreading rate vs plagioclase maximum length. B) Crystal residence time calculated for the > 1 mm population vs plagioclase maximum length. Residence times are calculated assuming a plagioclase growth rate of 1.304 x 10⁻⁹ cm/s (Burkhard, 2005).
population is given in Figure 9. Figure 9 suggests that even when separated into two crystal size ranges,
there are noticeable differences in the CSD plots between the sample populations. For the size populations
> 1 mm (Figure 9a), CSD patterns and especially the rotation from the steeper trend of the smaller grains
is consistent with crystal coarsening and maturation of the system. Indeed, the same pattern is observed in
experimental studies and attributed to crystal coarsening (Pupier et al., 2008; Ni et al., 2014). These
observations suggest that one explanation exists where,
as relative age and presumably melt flux increase,
conductive cooling slows resulting in the growth of large
plagioclase crystals in PUB lavas. In this way, PUB lavas
from the Cocos-Nazca Spreading Center differ from
those from other spreading domains (JdF, Blanco, MAR)
and together likely reflects the thermal maturation of a
spreading regime with time as proposed by Christie and
Sinton (1981).
For crystals < 1 mm (Figure 9b), samples from the
Cocos-Galapagos spreading regime, where spreading
rates are as low as 19 mm/year, have the steepest slopes
suggestive of faster cooling rates. Recalculated residence
times using the regression slope for the < 1 mm
population yields residence times as short as ~ 2 years, or
the upper limit of residence times for ultra-slow to
intermediate spreading centers determined by Zellmer et
al. (2011) and within the range proposed by Costa et al.
(2010). Samples from the Cocos-Nazca spreading
regime, where spreading rates are on the order of 40 mm/year, are similar to those from the slow
spreading Cocos-Galapagos spreading regime suggesting that the formation of microlites between the two
domains is similar. For PUB, shallowing of < 1 mm CSD slope and a decrease in CSD intercept is
consistent with the crystal coarsening process (Oswald ripening) described by Marsh (1988) and Higgins
(1999; 2006).
Figure 9 Crystal size distribution vs population density for crystals > 1 mm (A) and < 1 mm (B). Given lines are the linear regression calculated using the size bins present in each range.
8.2 Geochemistry
PUB formation has been attributed to plagioclase flotation (Galapagos archipelago, Cullen et al.,
1989) and injections of primitive melts that entrain crystals as xenocrysts (Lange et al., 2013a, b). The
correlation between Mg# (or TiO2) and CSD slope suggests that the temporal association of PUB with
injections of primitive melts is a reasonable model. However, Cocos-Nazca liquid densities calculated
using PELE (Boudreau, 1999) and DensityX (Iacovino and Till, 2019) indicate that some lavas (𝜌 ≈
2.73 𝑔/𝑐𝑚3) are denser than the average plagioclase crystal (average An85, 𝜌 = 2.72 𝑔/𝑐𝑚3 at MgO = 8
wt. %) erupted in MORB data compiled by Lange et al. (2013), suggesting that some combination of
flotation and suspension in migrating melts might occur for these lavas.
Geochemical interpretations are complicated by the fact that this dataset consists of samples from
different first- and second-order ridge segments with different magmatic histories. However, general
observations can inform our interpretations of CSDs and the evolution of mid-ocean ridges more broadly.
The counterintuitive relationship between CSD slope > 1 mm and Mg# and TiO2 (Figure 6a and b) would
suggest that the most phyric samples, and presumably the most evolved samples, are also the most
primitive. Fractionation of a tholeiitic liquid at cotectic proportions would lead to the fractional
crystallization of both plagioclase and olivine leading to a decrease in liquid Mg#. Consequently, this
relationship requires an alternative explanation. One possibility is that migrating melts do not cool and
must be capable of carrying plagioclase crystals. The trends observed in Figure 6a and 6b might represent
variations in conductive heat loss, magma ascent velocities, or some combination of the two. The elevated
Ba/Zr values at a given Ba value from samples from Lange et al. (2013) and Nielsen et al. (2020) differ
from those expected for pooled melts sourced from DMM (Figure 6f) and differ from the vast majority of
global MORB data compiled by Gale et al. (2013). One possibility is that variations in Ba/Zr represent
what is expected for global MORB. Another possibility is that migrating melts scavenged plagioclase
from an evolved mush resulting in anomalous Ba/Zr values. Absence of this geochemical signature does
not preclude PUB formation as several samples from the Cocos-Nazca Spreading Center are PUB without
anomalously high Ba/Zr. Instead, this difference might reflect crustal aggregation of compositionally
diverse melts for more developed ridge systems that is absent for the Cocos-Nazca Spreading Center.
8.3 Evolution of Plagioclase CSDs
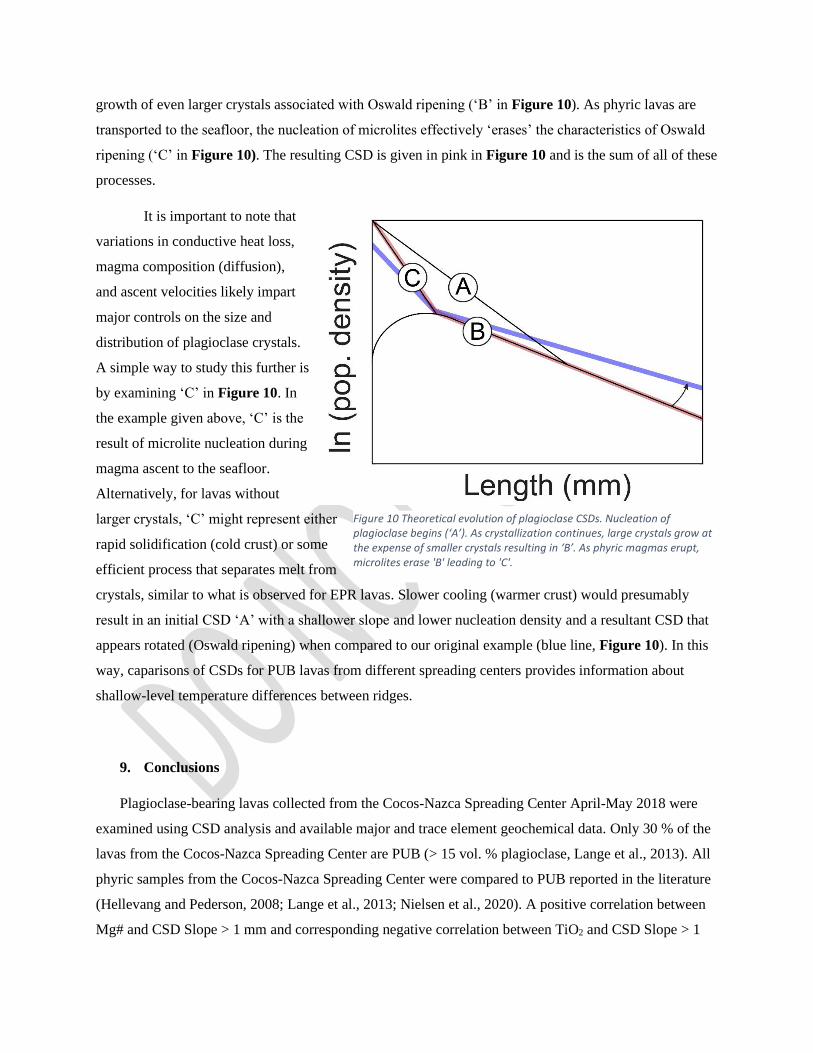
Figure 10 is a cartoon illustrating how PUB lava CSDs evolve with time. Here, magmas begin to
nucleate plagioclase at upper-mantle or crustal levels (‘A’ in Figure 10). As crystallization proceeds,
large crystals grow at the expense of smaller crystals leading to the characteristic downturn and the
growth of even larger crystals associated with Oswald ripening (‘B’ in Figure 10). As phyric lavas are
transported to the seafloor, the nucleation of microlites effectively ‘erases’ the characteristics of Oswald
ripening (‘C’ in Figure 10). The resulting CSD is given in pink in Figure 10 and is the sum of all of these
processes.
It is important to note that
variations in conductive heat loss,
magma composition (diffusion),
and ascent velocities likely impart
major controls on the size and
distribution of plagioclase crystals.
A simple way to study this further is
by examining ‘C’ in Figure 10. In
the example given above, ‘C’ is the
result of microlite nucleation during
magma ascent to the seafloor.
Alternatively, for lavas without
larger crystals, ‘C’ might represent either
rapid solidification (cold crust) or some
efficient process that separates melt from
crystals, similar to what is observed for EPR lavas. Slower cooling (warmer crust) would presumably
result in an initial CSD ‘A’ with a shallower slope and lower nucleation density and a resultant CSD that
appears rotated (Oswald ripening) when compared to our original example (blue line, Figure 10). In this
way, caparisons of CSDs for PUB lavas from different spreading centers provides information about
shallow-level temperature differences between ridges.
9. Conclusions
Plagioclase-bearing lavas collected from the Cocos-Nazca Spreading Center April-May 2018 were
examined using CSD analysis and available major and trace element geochemical data. Only 30 % of the
lavas from the Cocos-Nazca Spreading Center are PUB (> 15 vol. % plagioclase, Lange et al., 2013). All
phyric samples from the Cocos-Nazca Spreading Center were compared to PUB reported in the literature
(Hellevang and Pederson, 2008; Lange et al., 2013; Nielsen et al., 2020). A positive correlation between
Mg# and CSD Slope > 1 mm and corresponding negative correlation between TiO2 and CSD Slope > 1
Figure 10 Theoretical evolution of plagioclase CSDs. Nucleation of plagioclase begins (‘A’). As crystallization continues, large crystals grow at the expense of smaller crystals resulting in ‘B’. As phyric magmas erupt, microlites erase 'B' leading to 'C'.
mm suggests that melts carrying the largest proportion of plagioclase crystals do not evolve.
Consequently, this correlation represents either variability in the conductive heat loss for each spreading
center, variations in magma ascent velocity, or both. This hypothesis is not unlike that proposed by Lange
et al. (2013). A simple theoretical CSD evolution model is used to inform mid-ocean ridge crustal
processes and the eruption of phyric lavas. Significantly, the thermal evolution of mid-ocean ridges is
observed in plagioclase size distributions and host lava geochemistry.
Ariskin, A.A., 1999, Phase equilibria modeling in igneous petrology: use of COMAGMAT model for
simulating fractionation of ferro-basaltic magmas and the genesis of high-alumina basalt. J Volc
Geotherm Res, Vol. 90, 1-2, 115-162
Ariskin, A.A., Frenkel, M.Y., Barmina, G.S., and Nielsen, R.L., 1993, Comagmat: a Fortran program
to model magma differentiation process. Computers and Geosciences, Vol. 19, 8, 1155-1170
Batiza, R., and Y. Niu, 1992, Petrology and Magma Chamber Processes at the East Pacific Rise ~
9°30’N. Journal of Geophys Res, Vol. 97, B5, 6779-6797
Bennett, E.M., Lissenberg, C.J., and Cashman, K.V., 2019, The significance of plagioclase textures in