Using demographic analysis to assess the population size of shark species: a test using the White Shark (Carcharodon carcharias) sub-population off central California, USA Gregor M. Cailliet 1 , Kenneth J. Goldman 2 , , Henry F. Mollet 1,3 1 Moss Landing Marine Laboratories, Moss Landing CA 95039-9647, USA 2 Alaska Department of Fish and Game, 3298 Douglas Place, Homer, AK 99603 USA 3 Monterey Bay Aquarium, 886 Cannery Row, Monterey, CA 93940-1023 USA Squillante in Ebert (2003) Acknowledgements: Karyn Brewster-Geisz, Steve Campana, Jason Cope, Enric Cortes, Dave Ebert, Malcolm Francis, Selina Heppell, Lynn McMassters, Chris Perle, Colin Simpfendorfer, Based upon:
Transcript
Using demographic analysis to assess the population size of shark species: a test using the White Shark
(Carcharodon carcharias) sub-population off central California, USA
Gregor M. Cailliet1, Kenneth J. Goldman2 ,, Henry F. Mollet1,3
1Moss Landing Marine Laboratories, Moss Landing CA 95039-9647, USA2 Alaska Department of Fish and Game, 3298 Douglas Place, Homer, AK
99603 USA3 Monterey Bay Aquarium, 886 Cannery Row, Monterey, CA 93940-1023 USA
Squillante in Ebert (2003)
Acknowledgements: Karyn Brewster-Geisz, Steve Campana, Jason Cope, Enric Cortes, Dave Ebert, Malcolm Francis, Selina Heppell, Lynn McMassters, Chris Perle, Colin Simpfendorfer,
Based upon:
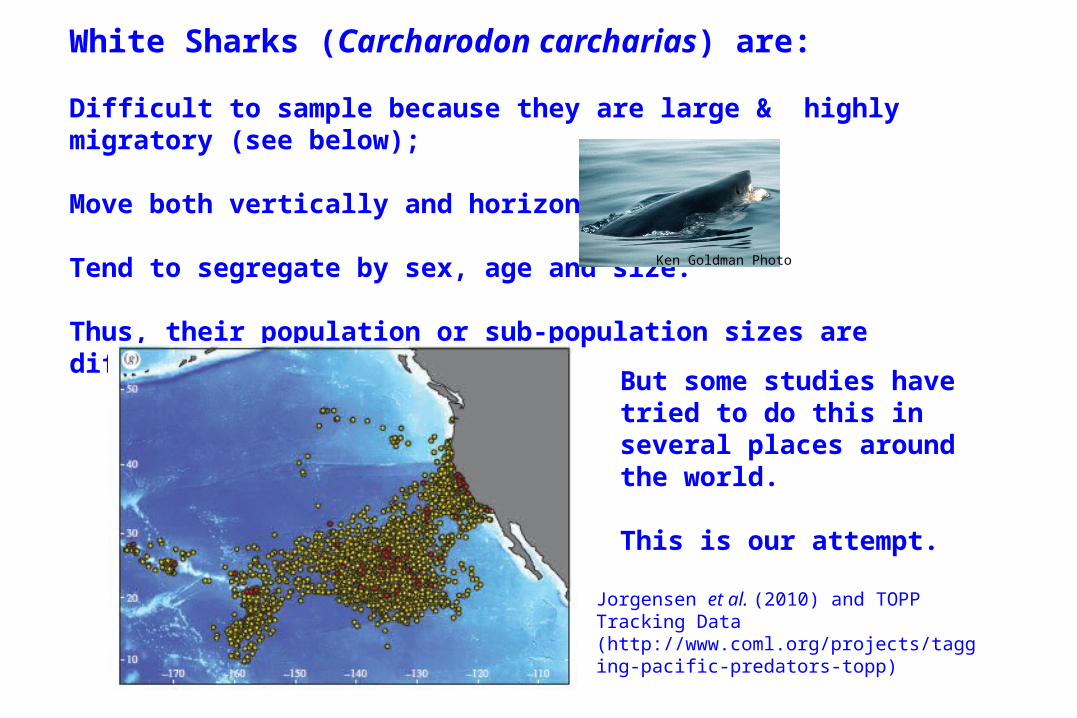
White Sharks (Carcharodon carcharias) are:
Difficult to sample because they are large & highly migratory (see below);
Move both vertically and horizontally; and
Tend to segregate by sex, age and size.
Thus, their population or sub-population sizes are difficult to estimate.
Jorgensen et al. (2010) and TOPP Tracking Data (http://www.coml.org/projects/tagging-pacific-predators-topp)
But some studies have tried to do this in several places around the world.
This is our attempt.
Ken Goldman Photo
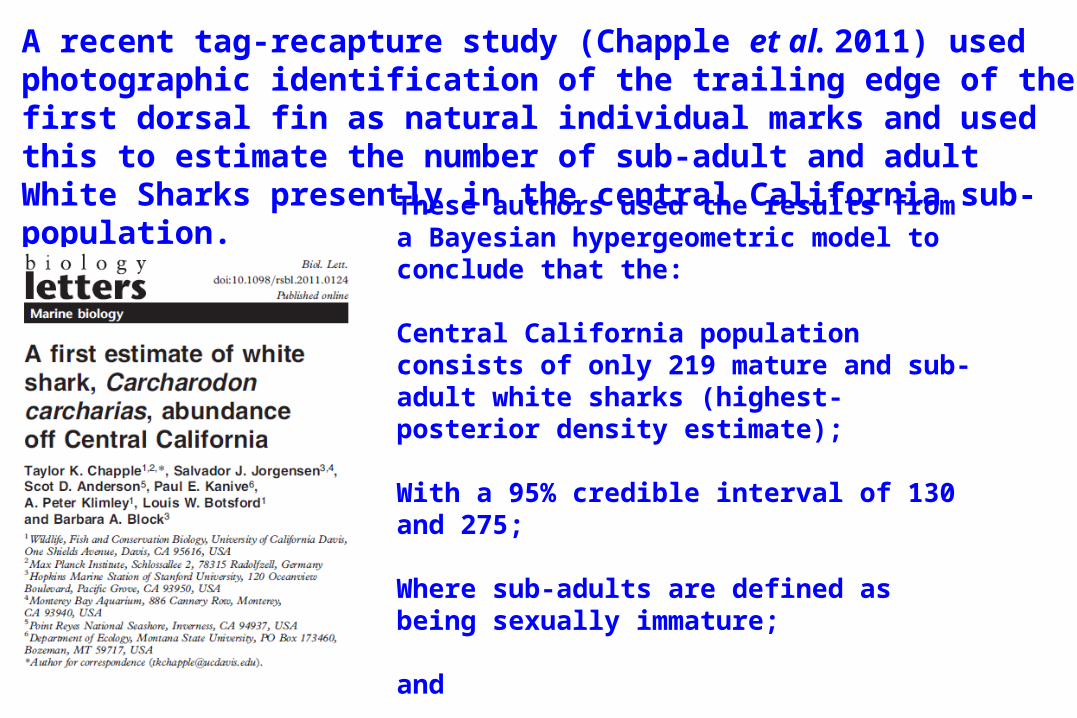
A recent tag-recapture study (Chapple et al. 2011) used photographic identification of the trailing edge of the first dorsal fin as natural individual marks and used this to estimate the number of sub-adult and adult White Sharks presently in the central California sub-population.
These authors used the results from a Bayesian hypergeometric model to conclude that the:
Central California population consists of only 219 mature and sub-adult white sharks (highest-posterior density estimate);
With a 95% credible interval of 130 and 275;
Where sub-adults are defined as being sexually immature;
and
Older juveniles are found with adults in aggregation areas.
Chapple et al. (2011) further concluded that:
This represented ~50% of the mature and sub-adult White Sharks for the entire eastern North Pacific Ocean (ENP); and
When all life stages were considered, the total population of white sharks was “far lower” than that of other apex predators.
This very low estimate created serious concern about the status of the California White Shark population, and consequently resulted in petitions to consider white sharks as a candidate for the U.S. (Federal Register / Vol. 77, No. 189 / Friday, September 28, 2012 / Proposed Rules) and State of California endangered species (ESA) lists.
Under the Federal Endangered Species Act, an endangered species is defined as “any species which is in danger of extinction throughout all or a significant portion of its range.”
We wanted to re-assess this population estimate and demonstrate the utility of demographic analyses and age distribution as useful methods for estimating population sizes in sharks.
Demography has been applied to several species of sharks, including White Sharks (Mollet & Cailliet 2002).
For this purpose, one needs a reasonable idea of age structure, often gained from size structure, and some age-specific population parameters.
DEMOGRAPHIC ANALYSIS
Was based upon an evaluation of existing and new life history information on the White Shark, Carcharodon carcharias:
DEMOGRAPHIC POPULATION MODEL ESTIMATESFOR ALL AGE CLASSES
We used demographic parameters to assess the size of the White Shark (Carcharadon carcharias) population off central California because recent studies provided appropriate data but did not utilize a demographic approach.
We aimed to estimate a new minimum total population estimate for White Sharks off California coast using demographics, life history matrix information, and a conservative extension of Chapple et al.’s (2011) estimate to include age classes that were either poorly sampled, or not sampled at all, by their methodology.
We did not attempt estimate the total population of White Sharks throughout the ENP as there are insufficient length, age and abundance data on which to base demographic models for the entire region.
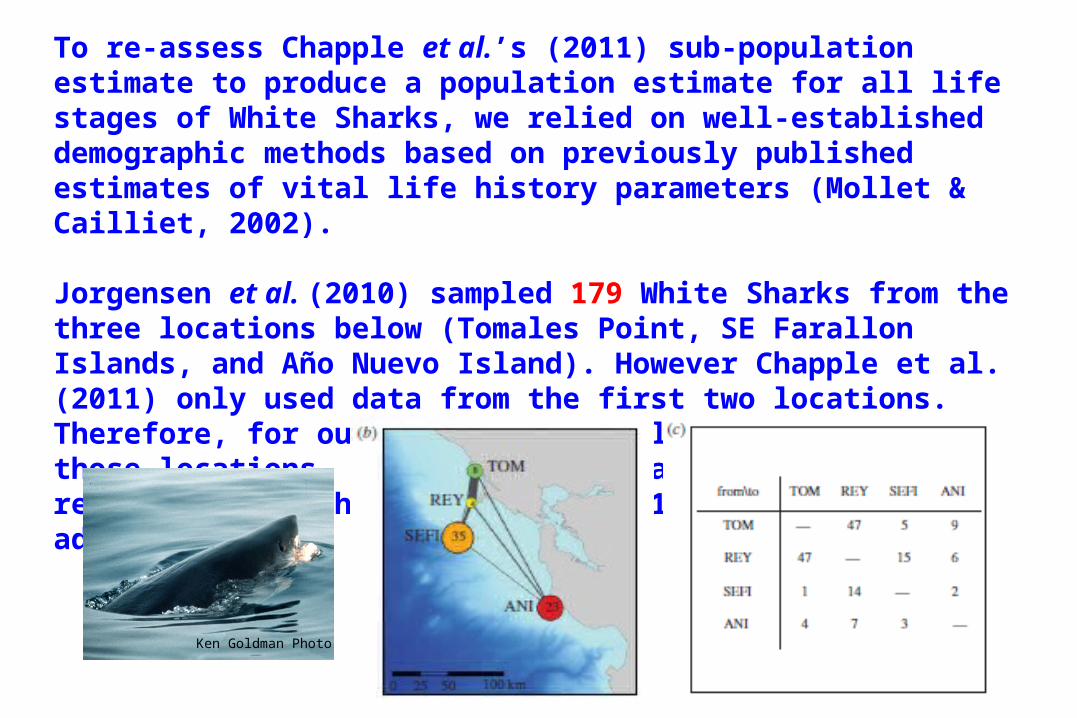
To re-assess Chapple et al.’s (2011) sub-population estimate to produce a population estimate for all life stages of White Sharks, we relied on well-established demographic methods based on previously published estimates of vital life history parameters (Mollet & Cailliet, 2002).
Jorgensen et al. (2010) sampled 179 White Sharks from the three locations below (Tomales Point, SE Farallon Islands, and Año Nuevo Island). However Chapple et al. (2011) only used data from the first two locations. Therefore, for our analysis, we only used data from those locations, not Año Nuevo Island, most closely reflecting how their estimate of 219 mature and sub-adult sharks was derived.
Ken Goldman Photo
AGE- & SIZE-BASED FREQUENCIES
The size-frequency and sex of the sharks sampled by Chapple et al. (2011)can be inferred from Jorgensen et al. (2010) as both studies were run in parallel.
We generated sex-specific size frequencies for the 130 White Sharks enumerated by Jorgensen et al. (2010), assuming that these are the same sharks sampled by the parallel study of Chapple et al. (2011), for which no data on individual sharks were provided. See the next slides for the data…
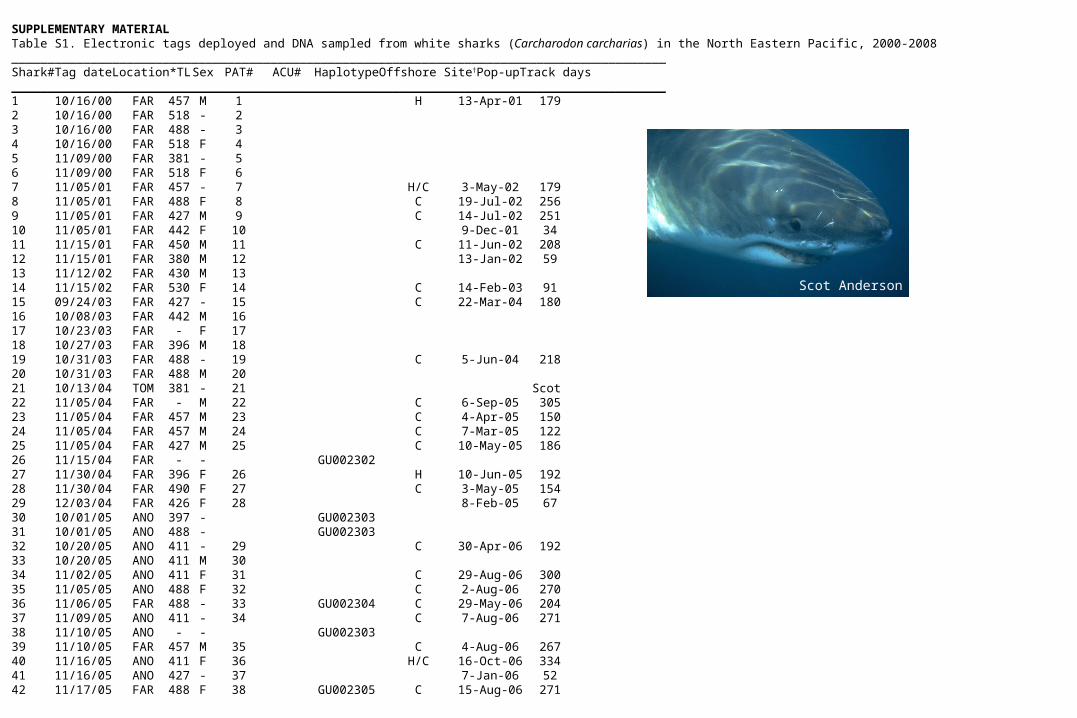
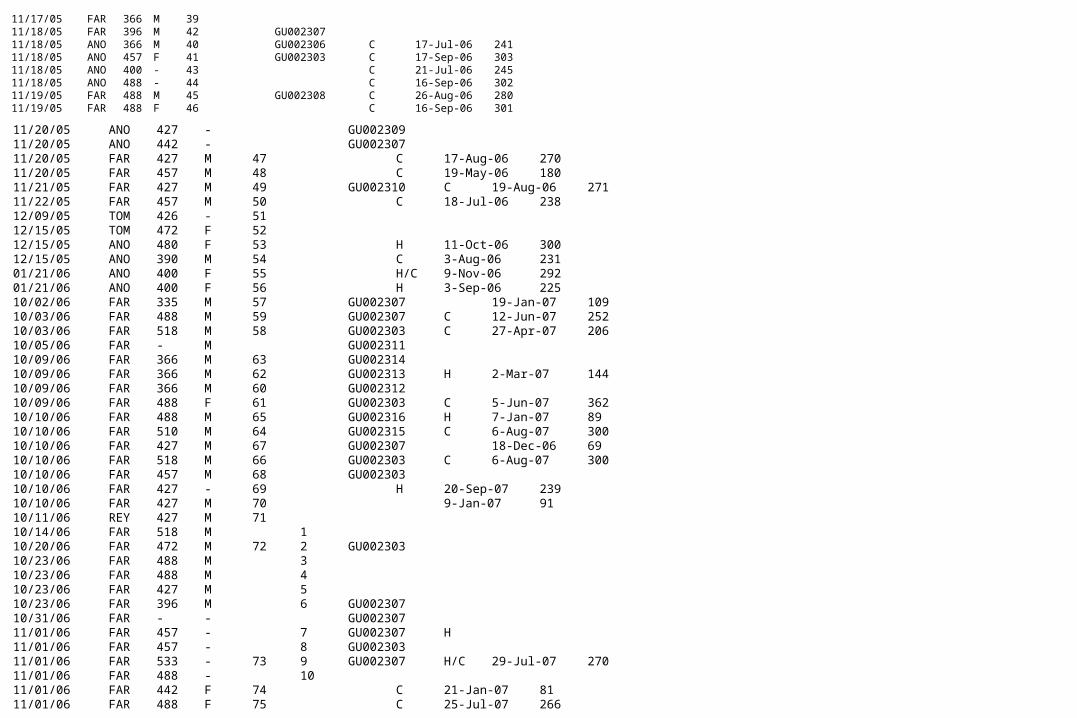
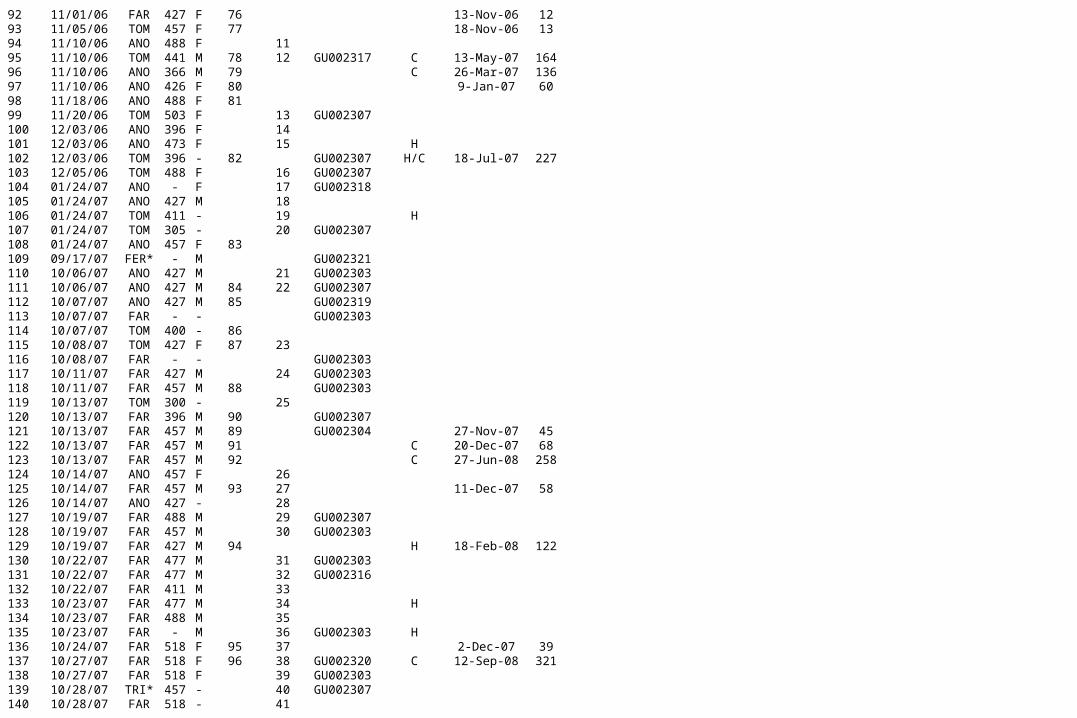
SUPPLEMENTARY MATERIALTable S1. Electronic tags deployed and DNA sampled from white sharks (Carcharodon carcharias) in the North Eastern Pacific, 2000-2008 ___________________________________________________________________________________________Shark# Tag date Location* TL Sex PAT# ACU# Haplotype Offshore Site† Pop-up Track days ___________________________________________________________________________________________1 10/16/00 FAR 457 M 1 H 13-Apr-01 1792 10/16/00 FAR 518 - 23 10/16/00 FAR 488 - 34 10/16/00 FAR 518 F 45 11/09/00 FAR 381 - 56 11/09/00 FAR 518 F 67 11/05/01 FAR 457 - 7 H/C 3-May-02 1798 11/05/01 FAR 488 F 8 C 19-Jul-02 2569 11/05/01 FAR 427 M 9 C 14-Jul-02 25110 11/05/01 FAR 442 F 10 9-Dec-01 3411 11/15/01 FAR 450 M 11 C 11-Jun-02 20812 11/15/01 FAR 380 M 12 13-Jan-02 5913 11/12/02 FAR 430 M 1314 11/15/02 FAR 530 F 14 C 14-Feb-03 9115 09/24/03 FAR 427 - 15 C 22-Mar-04 18016 10/08/03 FAR 442 M 1617 10/23/03 FAR - F 1718 10/27/03 FAR 396 M 1819 10/31/03 FAR 488 - 19 C 5-Jun-04 21820 10/31/03 FAR 488 M 2021 10/13/04 TOM 381 - 21 Scot 22 11/05/04 FAR - M 22 C 6-Sep-05 30523 11/05/04 FAR 457 M 23 C 4-Apr-05 15024 11/05/04 FAR 457 M 24 C 7-Mar-05 12225 11/05/04 FAR 427 M 25 C 10-May-05 18626 11/15/04 FAR - - GU00230227 11/30/04 FAR 396 F 26 H 10-Jun-05 19228 11/30/04 FAR 490 F 27 C 3-May-05 15429 12/03/04 FAR 426 F 28 8-Feb-05 6730 10/01/05 ANO 397 - GU00230331 10/01/05 ANO 488 - GU00230332 10/20/05 ANO 411 - 29 C 30-Apr-06 19233 10/20/05 ANO 411 M 3034 11/02/05 ANO 411 F 31 C 29-Aug-06 30035 11/05/05 ANO 488 F 32 C 2-Aug-06 27036 11/06/05 FAR 488 - 33 GU002304 C 29-May-06 20437 11/09/05 ANO 411 - 34 C 7-Aug-06 27138 11/10/05 ANO - - GU00230339 11/10/05 FAR 457 M 35 C 4-Aug-06 26740 11/16/05 ANO 411 F 36 H/C 16-Oct-06 33441 11/16/05 ANO 427 - 37 7-Jan-06 5242 11/17/05 FAR 488 F 38 GU002305 C 15-Aug-06 271
Scot Anderson
43 11/17/05 FAR 366 M 3944 11/18/05 FAR 396 M 42 GU00230745 11/18/05 ANO 366 M 40 GU002306 C 17-Jul-06 24146 11/18/05 ANO 457 F 41 GU002303 C 17-Sep-06 30347 11/18/05 ANO 400 - 43 C 21-Jul-06 24548 11/18/05 ANO 488 - 44 C 16-Sep-06 30249 11/19/05 FAR 488 M 45 GU002308 C 26-Aug-06 28050 11/19/05 FAR 488 F 46 C 16-Sep-06 301
51 11/20/05 ANO 427 - GU00230952 11/20/05 ANO 442 - GU00230753 11/20/05 FAR 427 M 47 C 17-Aug-06 27054 11/20/05 FAR 457 M 48 C 19-May-06 18055 11/21/05 FAR 427 M 49 GU002310 C 19-Aug-06 27156 11/22/05 FAR 457 M 50 C 18-Jul-06 23857 12/09/05 TOM 426 - 5158 12/15/05 TOM 472 F 5259 12/15/05 ANO 480 F 53 H 11-Oct-06 30060 12/15/05 ANO 390 M 54 C 3-Aug-06 23161 01/21/06 ANO 400 F 55 H/C 9-Nov-06 29262 01/21/06 ANO 400 F 56 H 3-Sep-06 22563 10/02/06 FAR 335 M 57 GU002307 19-Jan-07 10964 10/03/06 FAR 488 M 59 GU002307 C 12-Jun-07 25265 10/03/06 FAR 518 M 58 GU002303 C 27-Apr-07 20666 10/05/06 FAR - M GU00231167 10/09/06 FAR 366 M 63 GU00231468 10/09/06 FAR 366 M 62 GU002313 H 2-Mar-07 14469 10/09/06 FAR 366 M 60 GU00231270 10/09/06 FAR 488 F 61 GU002303 C 5-Jun-07 36271 10/10/06 FAR 488 M 65 GU002316 H 7-Jan-07 8972 10/10/06 FAR 510 M 64 GU002315 C 6-Aug-07 30073 10/10/06 FAR 427 M 67 GU002307 18-Dec-06 6974 10/10/06 FAR 518 M 66 GU002303 C 6-Aug-07 30075 10/10/06 FAR 457 M 68 GU00230376 10/10/06 FAR 427 - 69 H 20-Sep-07 23977 10/10/06 FAR 427 M 70 9-Jan-07 9178 10/11/06 REY 427 M 7179 10/14/06 FAR 518 M 180 10/20/06 FAR 472 M 72 2 GU00230381 10/23/06 FAR 488 M 382 10/23/06 FAR 488 M 483 10/23/06 FAR 427 M 584 10/23/06 FAR 396 M 6 GU00230785 10/31/06 FAR - - GU00230786 11/01/06 FAR 457 - 7 GU002307 H87 11/01/06 FAR 457 - 8 GU00230388 11/01/06 FAR 533 - 73 9 GU002307 H/C 29-Jul-07 27089 11/01/06 FAR 488 - 1090 11/01/06 FAR 442 F 74 C 21-Jan-07 8191 11/01/06 FAR 488 F 75 C 25-Jul-07 266
92 11/01/06 FAR 427 F 76 13-Nov-06 1293 11/05/06 TOM 457 F 77 18-Nov-06 1394 11/10/06 ANO 488 F 1195 11/10/06 TOM 441 M 78 12 GU002317 C 13-May-07 16496 11/10/06 ANO 366 M 79 C 26-Mar-07 13697 11/10/06 ANO 426 F 80 9-Jan-07 6098 11/18/06 ANO 488 F 8199 11/20/06 TOM 503 F 13 GU002307100 12/03/06 ANO 396 F 14101 12/03/06 ANO 473 F 15 H102 12/03/06 TOM 396 - 82 GU002307 H/C 18-Jul-07 227103 12/05/06 TOM 488 F 16 GU002307104 01/24/07 ANO - F 17 GU002318105 01/24/07 ANO 427 M 18106 01/24/07 TOM 411 - 19 H107 01/24/07 TOM 305 - 20 GU002307108 01/24/07 ANO 457 F 83109 09/17/07 FER* - M GU002321110 10/06/07 ANO 427 M 21 GU002303111 10/06/07 ANO 427 M 84 22 GU002307112 10/07/07 ANO 427 M 85 GU002319113 10/07/07 FAR - - GU002303114 10/07/07 TOM 400 - 86115 10/08/07 TOM 427 F 87 23116 10/08/07 FAR - - GU002303117 10/11/07 FAR 427 M 24 GU002303118 10/11/07 FAR 457 M 88 GU002303119 10/13/07 TOM 300 - 25120 10/13/07 FAR 396 M 90 GU002307121 10/13/07 FAR 457 M 89 GU002304 27-Nov-07 45122 10/13/07 FAR 457 M 91 C 20-Dec-07 68123 10/13/07 FAR 457 M 92 C 27-Jun-08 258124 10/14/07 ANO 457 F 26125 10/14/07 FAR 457 M 93 27 11-Dec-07 58126 10/14/07 ANO 427 - 28127 10/19/07 FAR 488 M 29 GU002307128 10/19/07 FAR 457 M 30 GU002303129 10/19/07 FAR 427 M 94 H 18-Feb-08 122130 10/22/07 FAR 477 M 31 GU002303131 10/22/07 FAR 477 M 32 GU002316132 10/22/07 FAR 411 M 33133 10/23/07 FAR 477 M 34 H134 10/23/07 FAR 488 M 35135 10/23/07 FAR - M 36 GU002303 H136 10/24/07 FAR 518 F 95 37 2-Dec-07 39137 10/27/07 FAR 518 F 96 38 GU002320 C 12-Sep-08 321138 10/27/07 FAR 518 F 39 GU002303139 10/28/07 TRI* 457 - 40 GU002307140 10/28/07 FAR 518 - 41
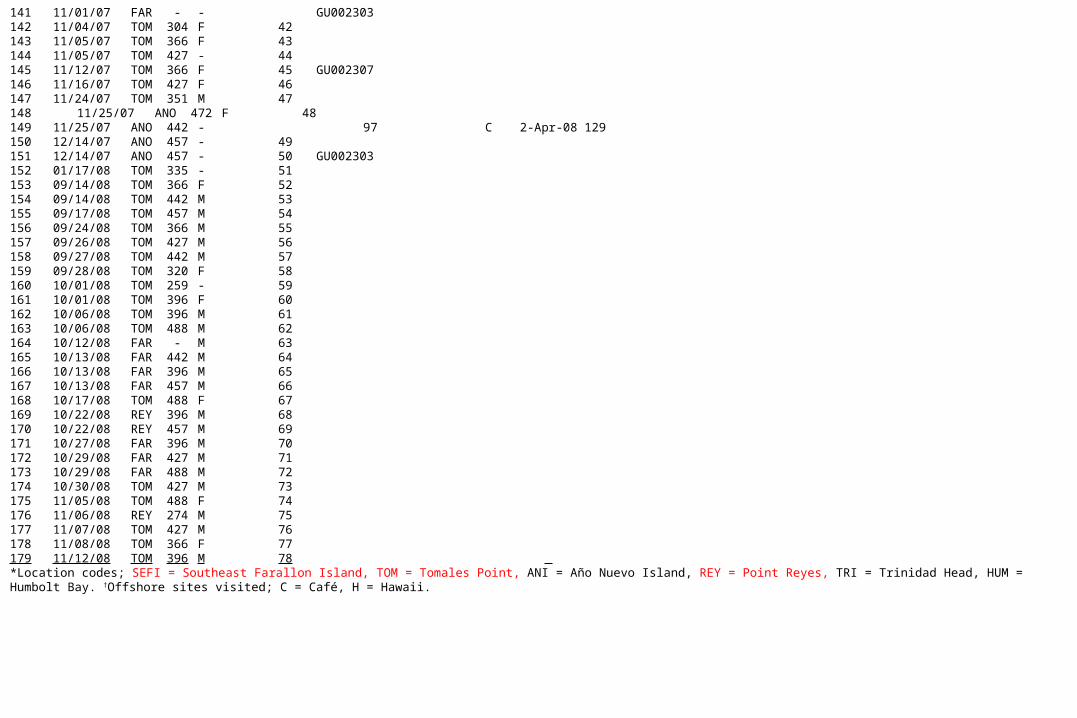
141 11/01/07 FAR - - GU002303142 11/04/07 TOM 304 F 42143 11/05/07 TOM 366 F 43144 11/05/07 TOM 427 - 44145 11/12/07 TOM 366 F 45 GU002307146 11/16/07 TOM 427 F 46147 11/24/07 TOM 351 M 47148 11/25/07 ANO 472 F 48149 11/25/07 ANO 442 - 97 C 2-Apr-08 129150 12/14/07 ANO 457 - 49151 12/14/07 ANO 457 - 50 GU002303152 01/17/08 TOM 335 - 51153 09/14/08 TOM 366 F 52154 09/14/08 TOM 442 M 53155 09/17/08 TOM 457 M 54156 09/24/08 TOM 366 M 55157 09/26/08 TOM 427 M 56158 09/27/08 TOM 442 M 57159 09/28/08 TOM 320 F 58160 10/01/08 TOM 259 - 59161 10/01/08 TOM 396 F 60162 10/06/08 TOM 396 M 61163 10/06/08 TOM 488 M 62164 10/12/08 FAR - M 63165 10/13/08 FAR 442 M 64166 10/13/08 FAR 396 M 65167 10/13/08 FAR 457 M 66168 10/17/08 TOM 488 F 67169 10/22/08 REY 396 M 68170 10/22/08 REY 457 M 69171 10/27/08 FAR 396 M 70172 10/29/08 FAR 427 M 71173 10/29/08 FAR 488 M 72174 10/30/08 TOM 427 M 73175 11/05/08 TOM 488 F 74176 11/06/08 REY 274 M 75177 11/07/08 TOM 427 M 76178 11/08/08 TOM 366 F 77179 11/12/08 TOM 396 M 78 *Location codes; SEFI = Southeast Farallon Island, TOM = Tomales Point, ANI = Año Nuevo Island, REY = Point Reyes, TRI = Trinidad Head, HUM = Humbolt Bay. †Offshore sites visited; C = Café, H = Hawaii.
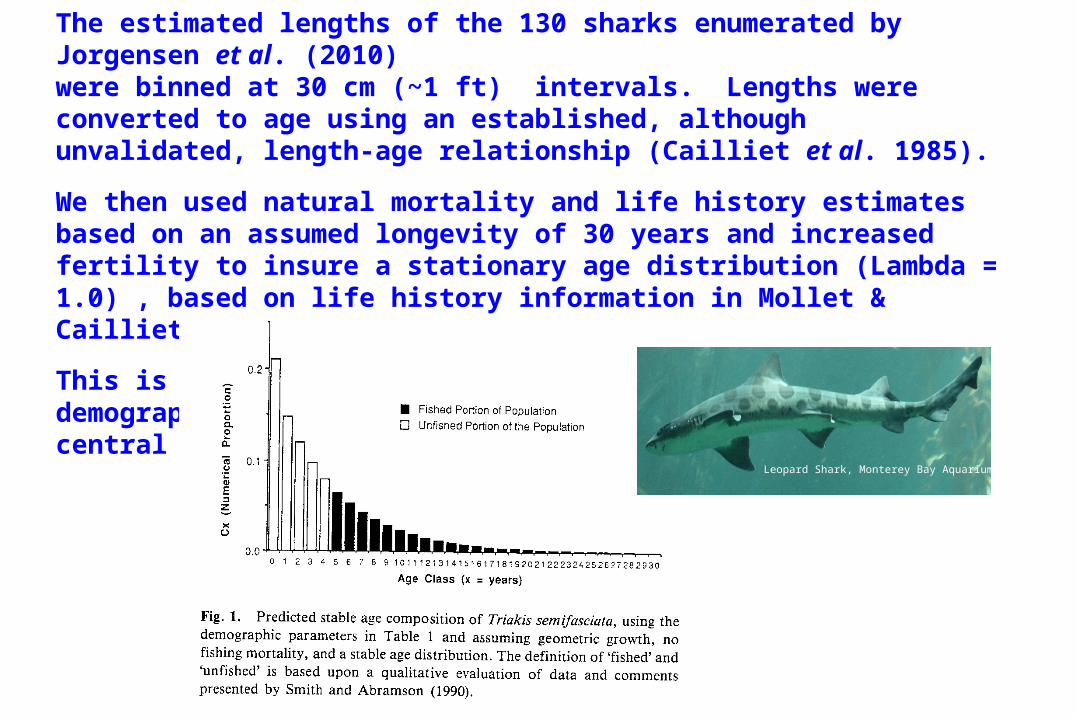
The estimated lengths of the 130 sharks enumerated by Jorgensen et al. (2010)were binned at 30 cm (~1 ft) intervals. Lengths were converted to age using an established, although unvalidated, length-age relationship (Cailliet et al. 1985).
We then used natural mortality and life history estimates based on an assumed longevity of 30 years and increased fertility to insure a stationary age distribution (Lambda = 1.0) , based on life history information in Mollet & Cailliet (2002).
This is similar to what Cailliet (1992) did for his demographic study of Leopard Sharks (Triakis semifasciata) off central California.
Leopard Shark, Monterey Bay Aquarium
1 4 7 10 13 16 19 22 25 28 310
0.02
0.04
0.06
0.08
0.1
0.12
0.14
0.16
0.18
0.2
Prop
ortio
nal A
ge D
istr
ibuti
on
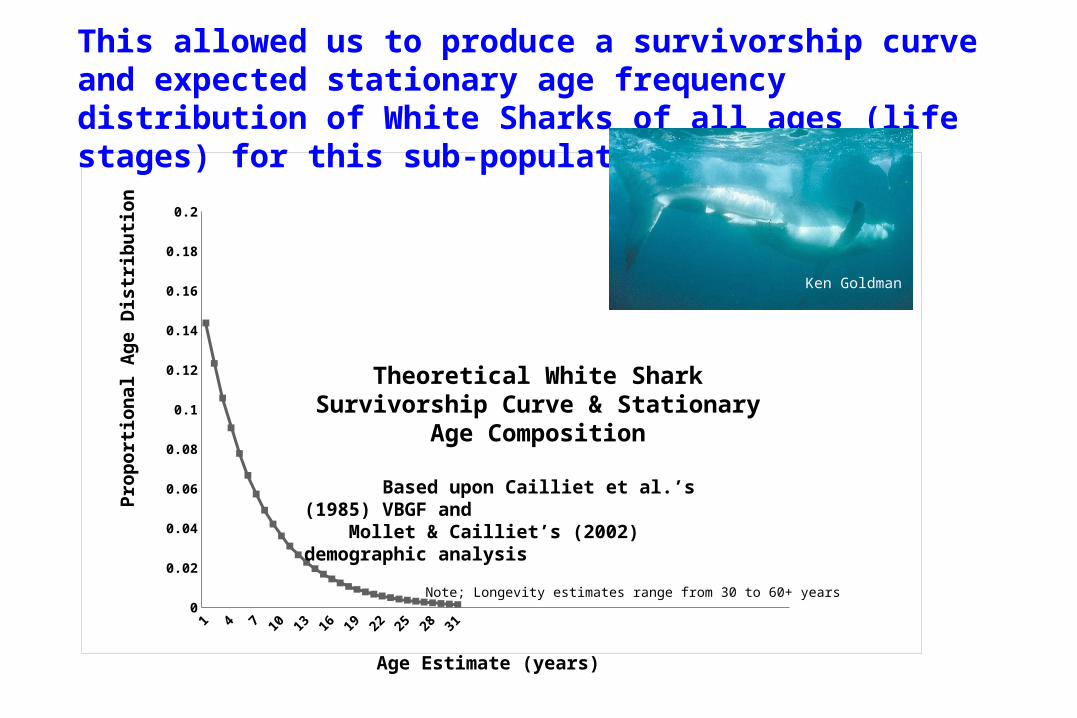
Theoretical White Shark Survivorship Curve & Stationary Age Composition
Based upon Cailliet et al.’s (1985) VBGF and Mollet & Cailliet’s (2002) demographic analysis
This allowed us to produce a survivorship curve and expected stationary age frequency distribution of White Sharks of all ages (life stages) for this sub-population.
Age Estimate (years)
Ken Goldman
Note; Longevity estimates range from 30 to 60+ years
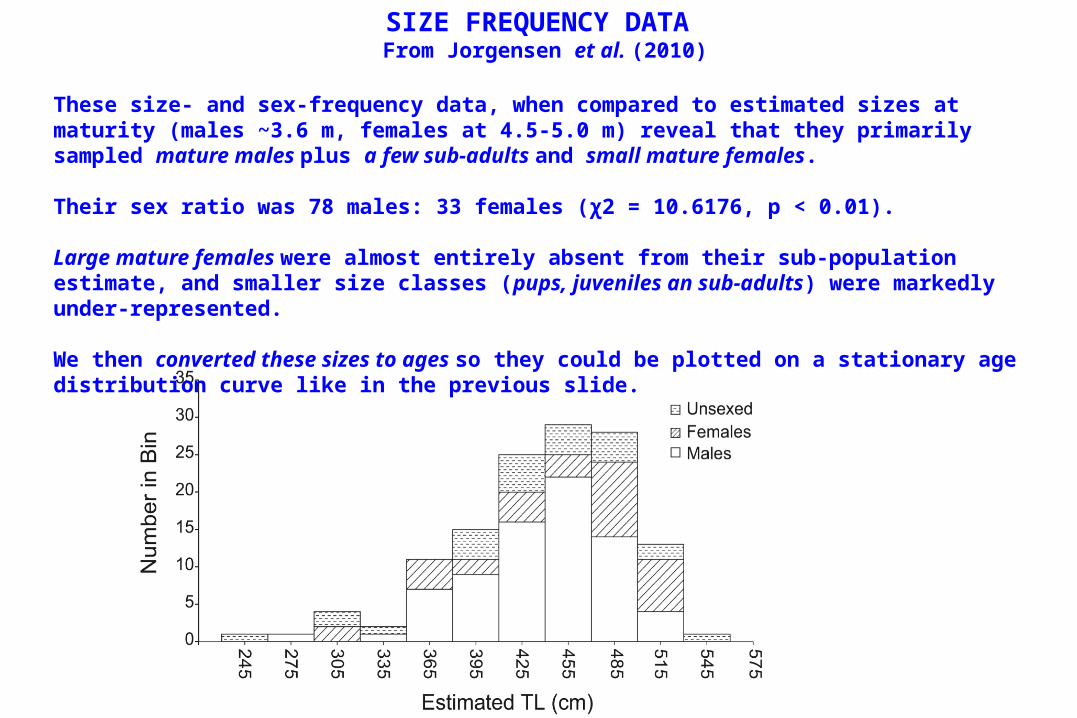
SIZE FREQUENCY DATA From Jorgensen et al. (2010)
These size- and sex-frequency data, when compared to estimated sizes at maturity (males ~3.6 m, females at 4.5-5.0 m) reveal that they primarily sampled mature males plus a few sub-adults and small mature females.
Their sex ratio was 78 males: 33 females (χ2 = 10.6176, p < 0.01).
Large mature females were almost entirely absent from their sub-population estimate, and smaller size classes (pups, juveniles an sub-adults) were markedly under-represented.
We then converted these sizes to ages so they could be plotted on a stationary age distribution curve like in the previous slide.
DEMOGRAPHY
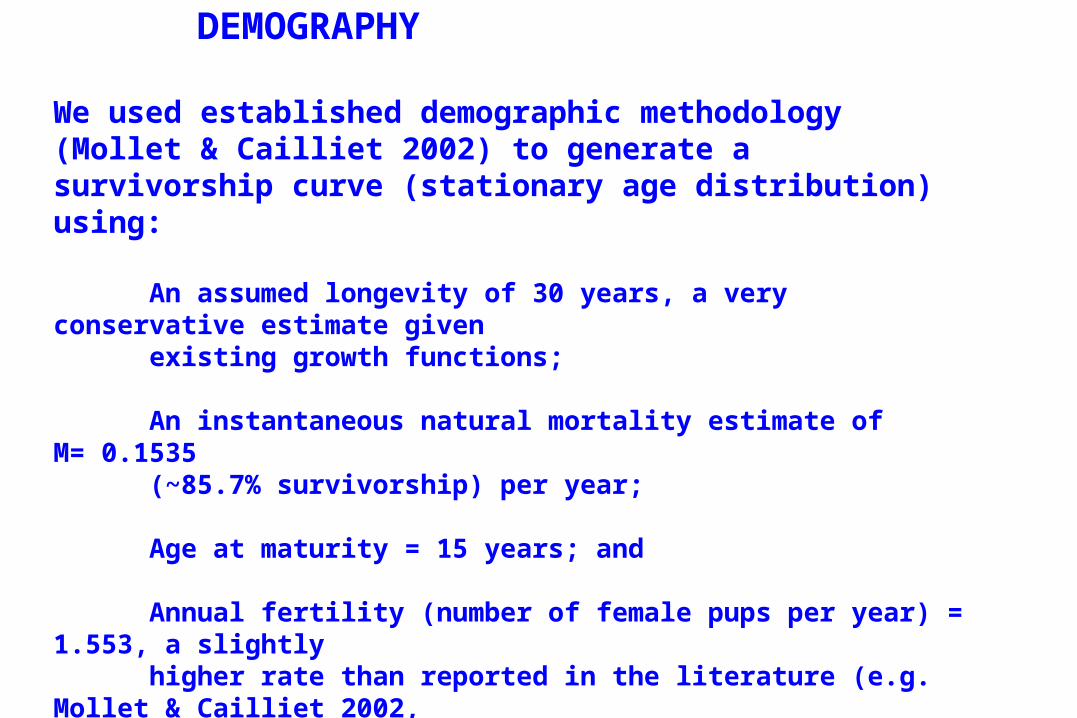
We used established demographic methodology (Mollet & Cailliet 2002) to generate a survivorship curve (stationary age distribution) using:
An assumed longevity of 30 years, a very conservative estimate given existing growth functions; An instantaneous natural mortality estimate of M= 0.1535 (~85.7% survivorship) per year; Age at maturity = 15 years; and
Annual fertility (number of female pups per year) = 1.553, a slightly higher rate than reported in the literature (e.g. Mollet & Cailliet 2002, Francis 1996).
All to achieve a stationary age distribution (lambda = 1.0).
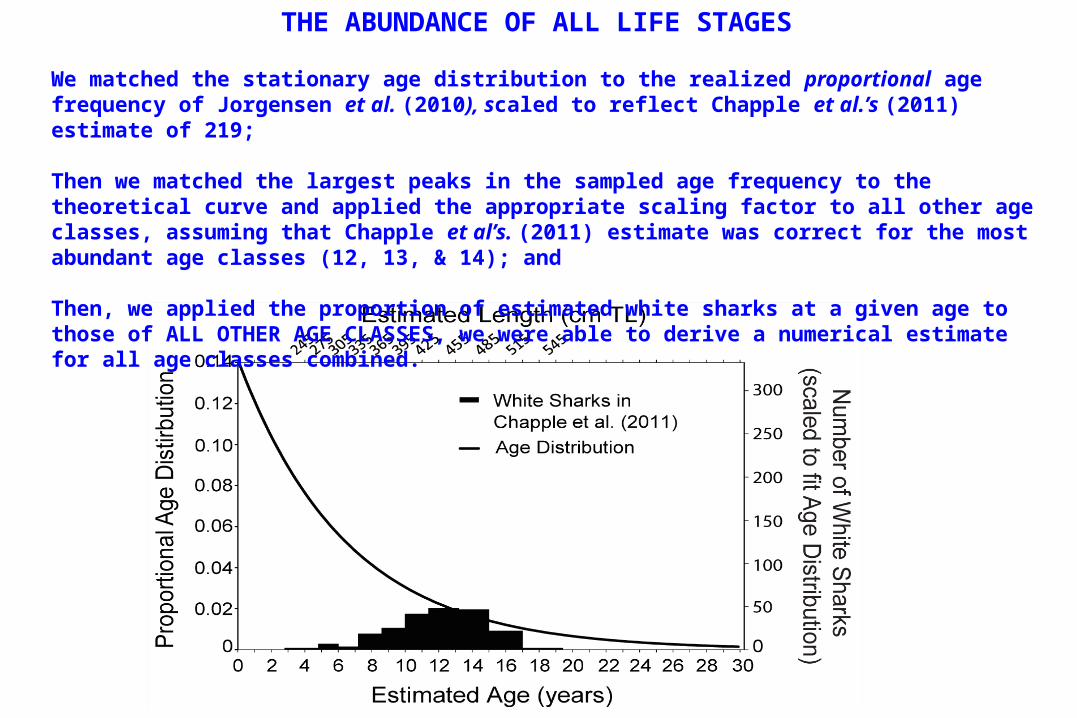
THE ABUNDANCE OF ALL LIFE STAGES
We matched the stationary age distribution to the realized proportional age frequency of Jorgensen et al. (2010), scaled to reflect Chapple et al.’s (2011) estimate of 219;
Then we matched the largest peaks in the sampled age frequency to the theoretical curve and applied the appropriate scaling factor to all other age classes, assuming that Chapple et al’s. (2011) estimate was correct for the most abundant age classes (12, 13, & 14); and
Then, we applied the proportion of estimated white sharks at a given age to those of ALL OTHER AGE CLASSES, we were able to derive a numerical estimate for all age classes combined.
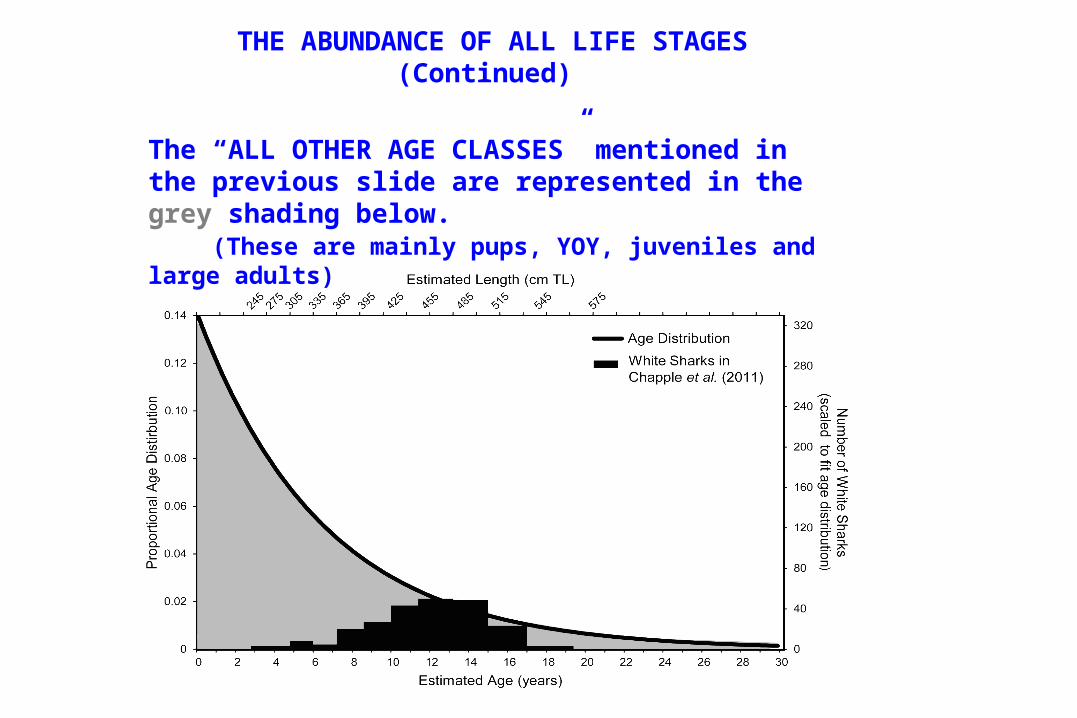
THE ABUNDANCE OF ALL LIFE STAGES(Continued)
The “ALL OTHER AGE CLASSES” mentioned in the previous slide are represented in the grey shading below. (These are mainly pups, YOY, juveniles and large adults)
OUR RESULTS
Chapple et al. (2011) only sampled a small proportion of the age distribution for the sub-population represented at the sampling locations.
Matching the sampled age frequency of the most abundant age classes with neighboring age distribution proportions (at 12, 13 and 14 yrs) and scaling appropriately provides an estimate of number of all life stages (ages) throughout coastal California would be at least 2,418 White Sharks.
The range was from 2,148 to 2,819 White Sharks, depending upon which size or age class we chose, with 2,418 as the final value with the best fit at age 13.
Increasing M by a factor of two to reflect increased mortality of early life stages for each of the two youngest age classes results in a negligible effect (<2%) on the population estimate.
0 10 20 30 40 50 60 70 800
1
2
3
4
5
6
7
8
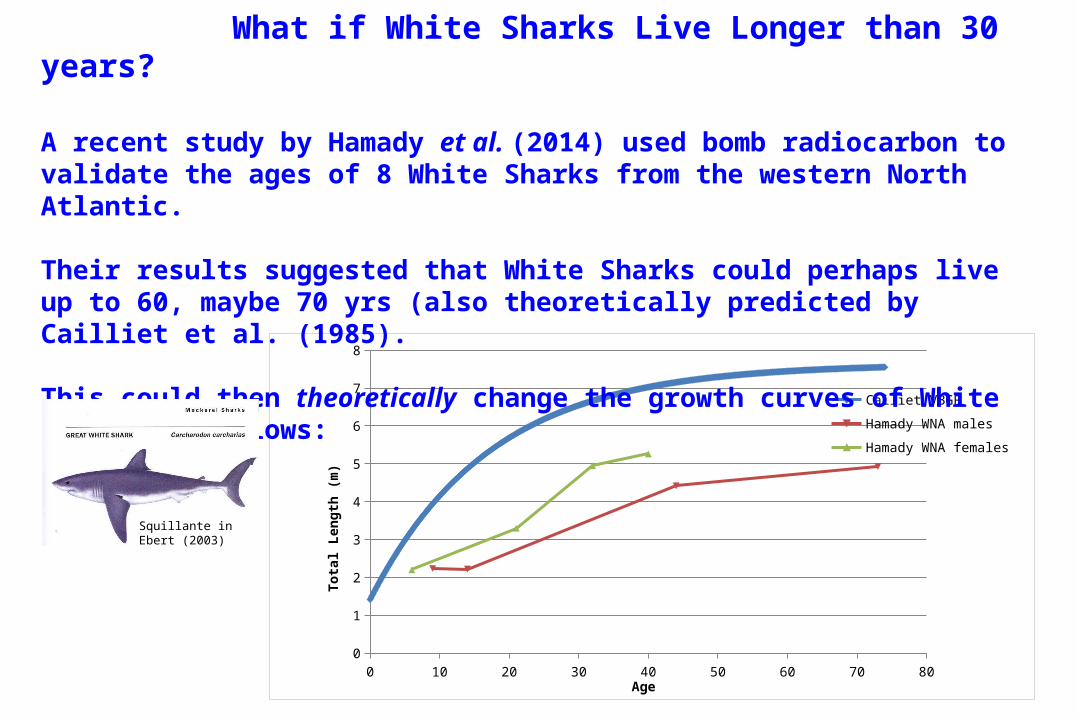
Cailiet VBGF
Hamady WNA males
Hamady WNA females
Age
Tota
l Len
gth
(m)
What if White Sharks Live Longer than 30 years?
A recent study by Hamady et al. (2014) used bomb radiocarbon to validate the ages of 8 White Sharks from the western North Atlantic.
Their results suggested that White Sharks could perhaps live up to 60, maybe 70 yrs (also theoretically predicted by Cailliet et al. (1985).
This could then theoretically change the growth curves of White Sharks as follows:
Squillante in Ebert (2003)
1 4 7 10 13 16 19 22 25 28 310
0.02
0.04
0.06
0.08
0.1
0.12
0.14
0.16
0.18
0.2 White Shark Survivorship Curve and Stationary Age Distribution
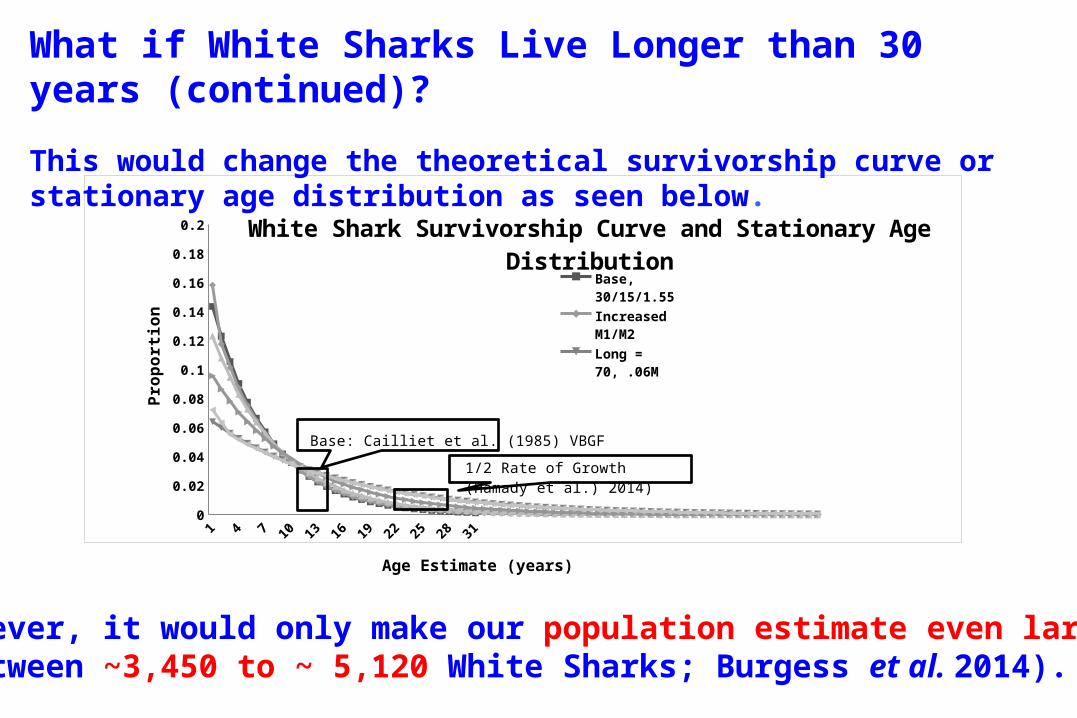
What if White Sharks Live Longer than 30 years (continued)?
This would change the theoretical survivorship curve or stationary age distribution as seen below.
However, it would only make our population estimate even larger(between ~3,450 to ~ 5,120 White Sharks; Burgess et al. 2014).
Age Estimate (years)
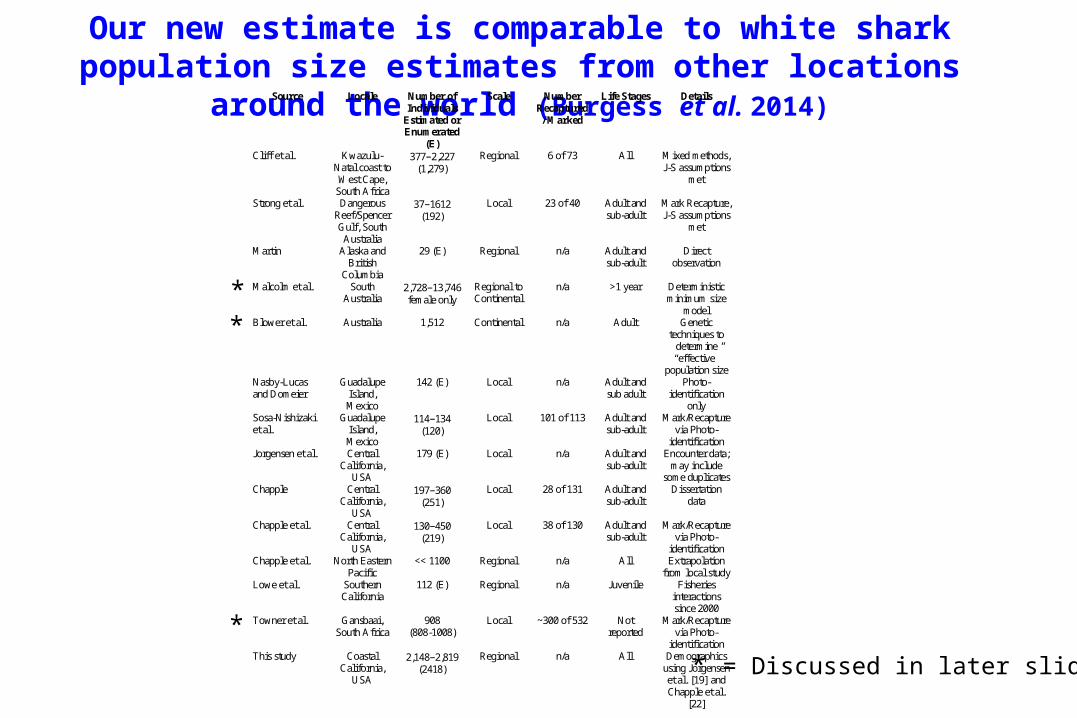
Our new estimate is comparable to white shark population size estimates from other locations around the world (Burgess et al. 2014)
Source Locale Number of Individuals
Estimated or Enumerated
(E)
Scale Number Recaptured
/ Marked
Life Stages Details
Cliff et al. Kwazulu-Natal coast to West Cape,
South Africa
377–2,227 (1,279)
Regional 6 of 73 All Mixed methods, J-S assumptions
met
Strong et al. Dangerous Reef/Spencer Gulf, South Australia
37–1612 (192)
Local 23 of 40 Adult and sub-adult
Mark Recapture, J-S assumptions
met
Martin Alaska and British
Columbia
29 (E) Regional n/a Adult and sub-adult
Direct observation
Malcolm et al. South Australia
2,728–13,746 female only
Regional to Continental
n/a >1 year Deterministic minimum size
model Blower et al. Australia 1,512 Continental n/a Adult Genetic
techniques to determine “effective”
population size Nasby-Lucas and Domeier
Guadalupe Island, Mexico
142 (E) Local n/a Adult and sub adult
Photo-identification
only Sosa-Nishizaki et al.
Guadalupe Island, Mexico
114–134 (120)
Local 101 of 113 Adult and sub-adult
Mark/Recapture via Photo-
identification Jorgensen et al. Central
California, USA
179 (E) Local n/a Adult and sub-adult
Encounter data; may include
some duplicates Chapple Central
California, USA
197–360 (251)
Local 28 of 131 Adult and sub-adult
Dissertation data
Chapple et al. Central California,
USA
130–450 (219)
Local 38 of 130 Adult and sub-adult
Mark/Recapture via Photo-
identification Chapple et al. North Eastern
Pacific << 1100 Regional n/a All Extrapolation
from local study Lowe et al. Southern
California 112 (E) Regional n/a Juvenile Fisheries
interactions since 2000
Towner et al. Gansbaai, South Africa
908 (808-1008)
Local ~300 of 532 Not reported
Mark/Recapture via Photo-
identification This study Coastal
California, USA
2,148–2,819 (2418)
Regional n/a All Demographics using Jorgensen et al. [19] and Chapple et al.
[22]
**
*
* = Discussed in later slides
In the eastern North Pacific (U.S. west coast):
Our estimate is similar to that from a recent independent status review by the NMFS (Dewar et al. 2014) of the ENP white shark population, which estimated ~3,000 individuals.
This status review team had access to virtually all available data from white shark researchers throughout the eastern North Pacific and used multiple modeling approaches.
Similar conclusions were made in a 2014 analysis by the California Department of Fish and Wildlife (and approved by the Commission)
Scot Anderson
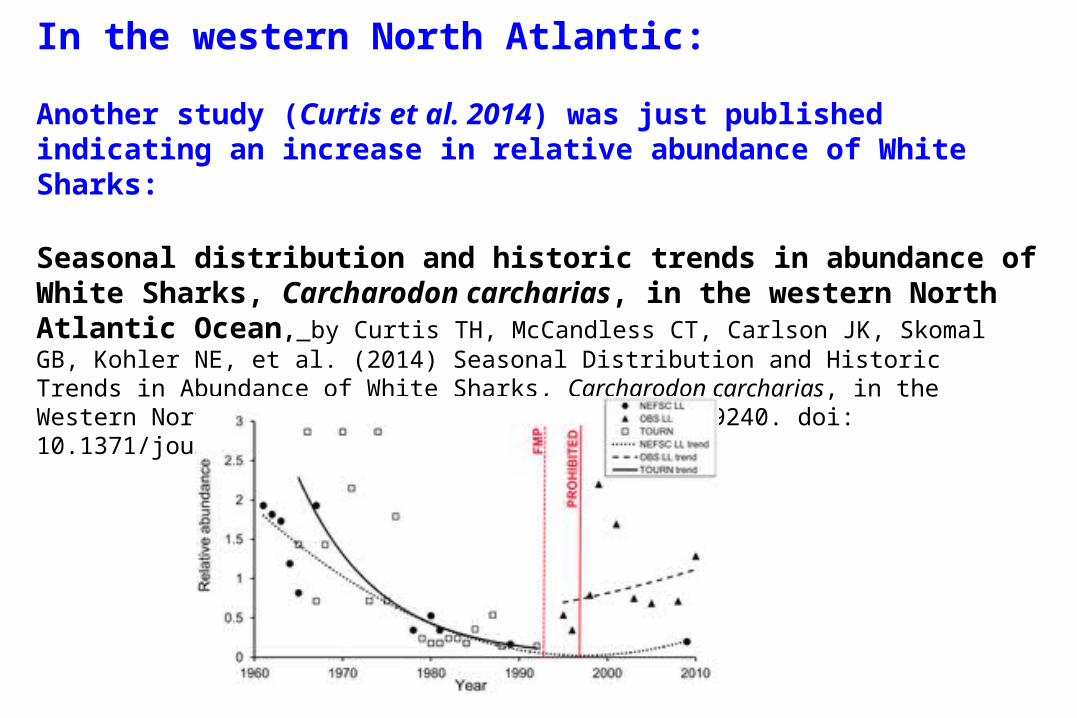
In the western North Atlantic:
Another study (Curtis et al. 2014) was just published indicating an increase in relative abundance of White Sharks:
Seasonal distribution and historic trends in abundance of White Sharks, Carcharodon carcharias, in the western North Atlantic Ocean, by Curtis TH, McCandless CT, Carlson JK, Skomal GB, Kohler NE, et al. (2014) Seasonal Distribution and Historic Trends in Abundance of White Sharks, Carcharodon carcharias, in the Western North Atlantic Ocean. PLoS ONE 9(6): e99240. doi: 10.1371/journal.pone.0099240
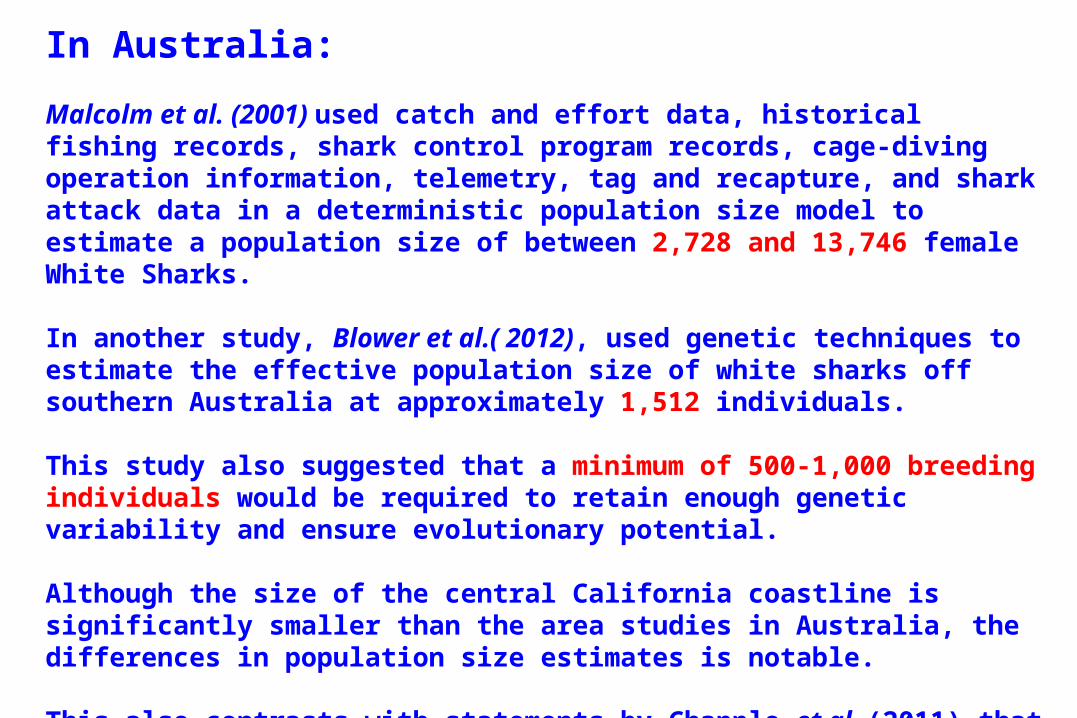
In Australia:
Malcolm et al. (2001) used catch and effort data, historical fishing records, shark control program records, cage-diving operation information, telemetry, tag and recapture, and shark attack data in a deterministic population size model to estimate a population size of between 2,728 and 13,746 female White Sharks.
In another study, Blower et al.( 2012), used genetic techniques to estimate the effective population size of white sharks off southern Australia at approximately 1,512 individuals.
This study also suggested that a minimum of 500-1,000 breeding individuals would be required to retain enough genetic variability and ensure evolutionary potential.
Although the size of the central California coastline is significantly smaller than the area studies in Australia, the differences in population size estimates is notable.
This also contrasts with statements by Chapple et al. (2011) that the size of the eastern North Pacific White Shark population is alarmingly low, and cited genetic diversity as a factor.
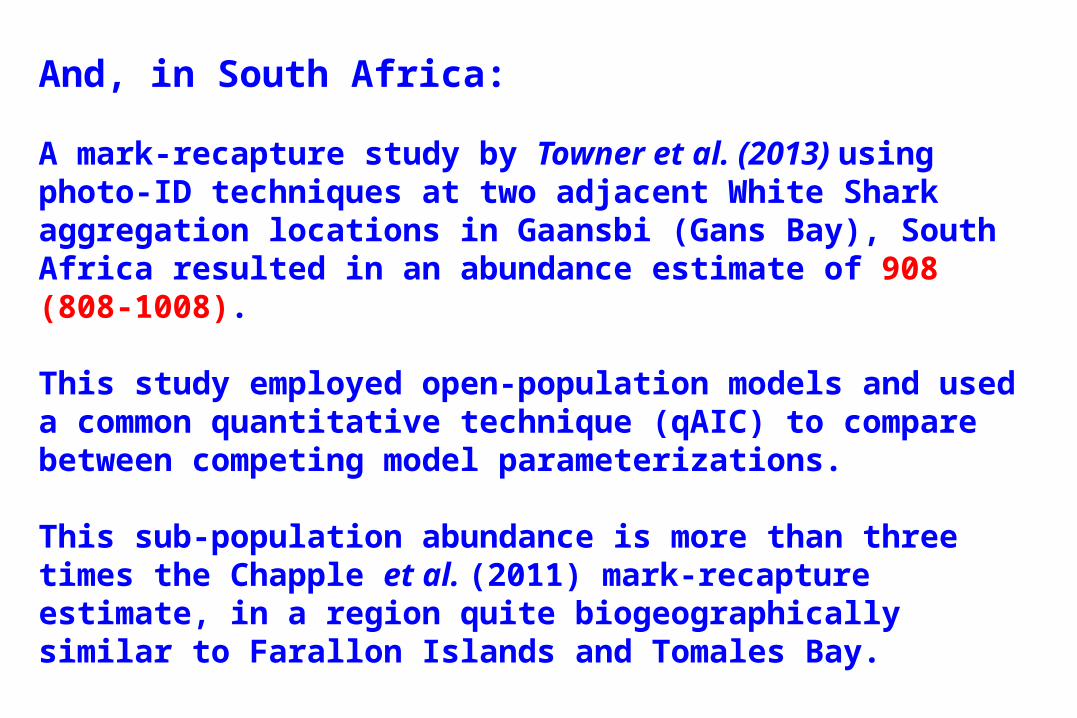
And, in South Africa:
A mark-recapture study by Towner et al. (2013) using photo-ID techniques at two adjacent White Shark aggregation locations in Gaansbi (Gans Bay), South Africa resulted in an abundance estimate of 908 (808-1008).
This study employed open-population models and used a common quantitative technique (qAIC) to compare between competing model parameterizations.
This sub-population abundance is more than three times the Chapple et al. (2011) mark-recapture estimate, in a region quite biogeographically similar to Farallon Islands and Tomales Bay.
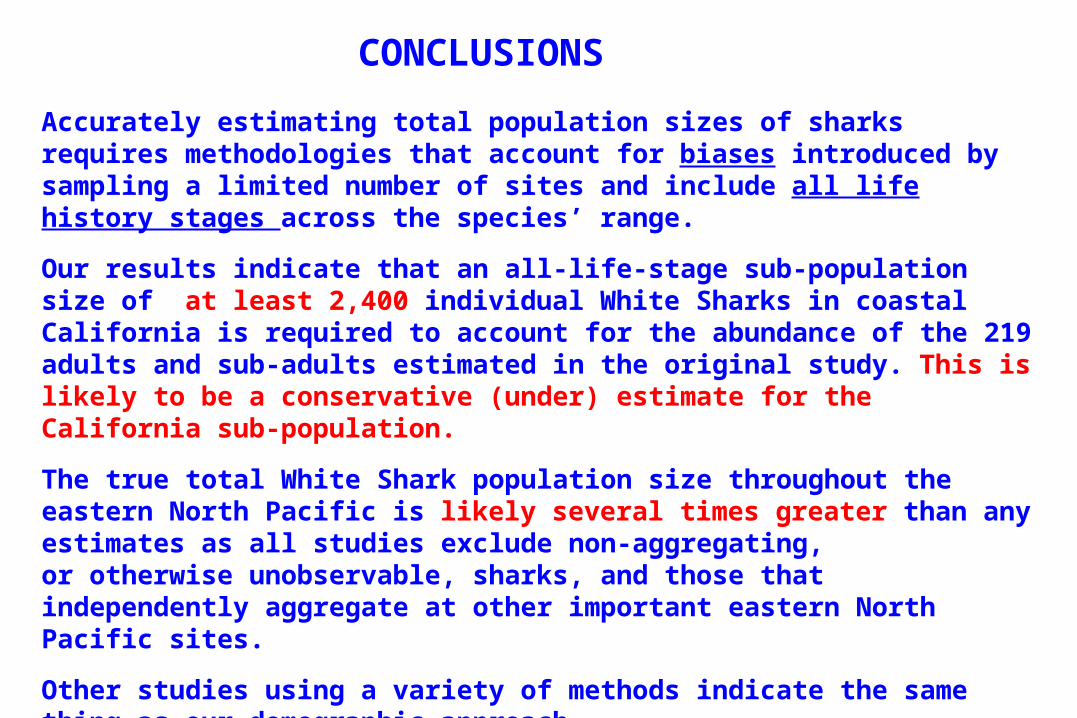
Accurately estimating total population sizes of sharks requires methodologies that account for biases introduced by sampling a limited number of sites and include all life history stages across the species’ range.
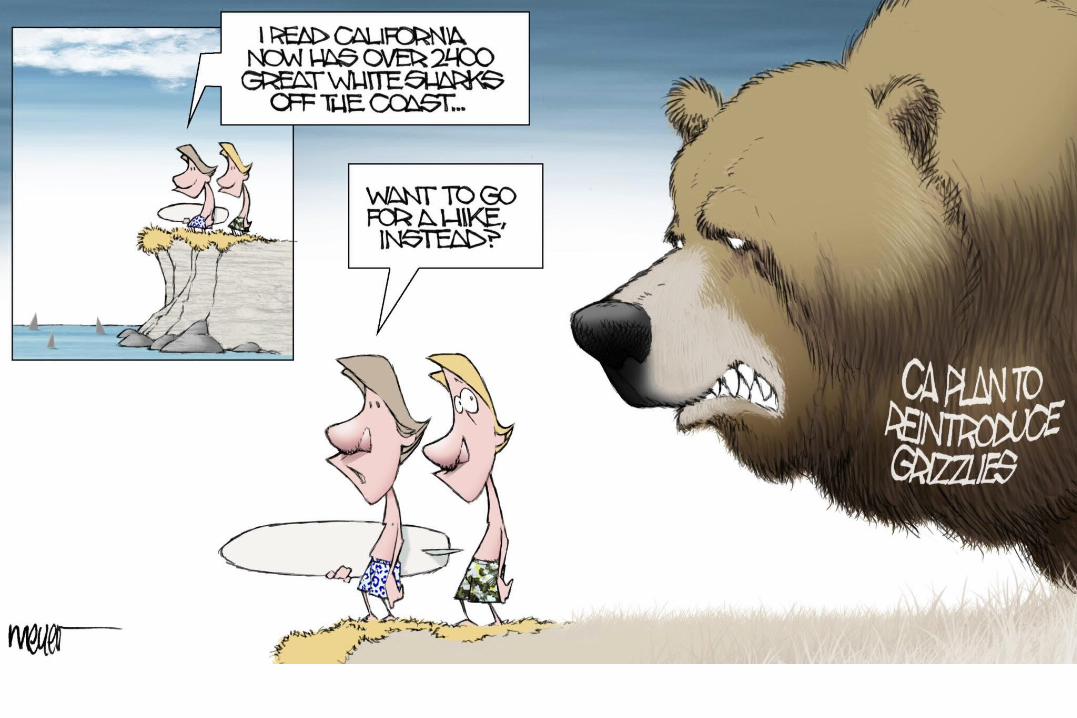
Our results indicate that an all-life-stage sub-population size of at least 2,400 individual White Sharks in coastal California is required to account for the abundance of the 219 adults and sub-adults estimated in the original study. This is likely to be a conservative (under) estimate for the California sub-population.
The true total White Shark population size throughout the eastern North Pacific is likely several times greater than any estimates as all studies exclude non-aggregating, or otherwise unobservable, sharks, and those that independently aggregate at other important eastern North Pacific sites.
Other studies using a variety of methods indicate the same thing as our demographic approach.
Our analysis indicates that White Shark abundance off central California is not in danger as previously proposed. Indications are that the ENP White Shark population is healthy and may be growing.