A speculator who tries to time price movements over very short time intervals and takes positions that remain outstanding for only minutes
13
Types of Futures Traders
Day Trader
Similar to a scalper but tries to profit from short-term price movements during the trading day; normally offsets the initial position before the market closes such that no position remains outstanding overnight
Position Trader
A speculator who holds a position for a longer period in anticipation of a more significant, longer-term market move.
14
Types of Futures Traders
Spreader versus Arbitrageur
Both are speculators that take relatively low-risk positions
Futures Spreader
May simultaneously buy a futures contract and sell a related futures contract trying to profit on anticipated movements in the price difference
The position is generally low risk because the prices of both contracts typically move in the same direction
15
Types of Futures Traders
Arbitrageur
Tries to profit by identifying the same asset
that is being traded at two different prices in
different markets at the same time
Buys the asset at the lower price and
simultaneously sells it at the higher price
Arbitrage transactions are thus low risk and
serve to bring prices back in line in the sense
that the same asset should trade at the same
price in all markets
16
Margin Requirements
Initial Margin
A cash deposit (or U.S. government
securities) with the exchange simply
for initiating a transaction
Initial margins are relatively low, often
involving less than 5% of the
underlying asset’s value
Maintenance Margin
The minimum deposit required at the
end of each day 17
Margin Requirements
Unlike margin accounts for stocks,
futures margin deposits represent a
guarantee that a trader will be able to
make any mandatory payment
obligations
Same effect as a performance bond
18
Margin Requirements
Marking-to-Market
The daily settlement process where at
the end of every trading day, a trader’s
margin account is:
Credited with any gains
Debited with any losses
Variation Margin
The daily change in the value of margin
account due to marking-to-market
19
Expiration and Delivery
Expiration Date
Every futures contract has a formal
expiration date
On the expiration date, trading stops
and participants settle their final
positions
Less than 1% of financial futures
contracts experience physical delivery
at expiration because most traders
offset their futures positions in
advance 20
Example
90-Day Eurodollar Time Deposit
Futures
The underlying asset is a Eurodollar
time deposit with a 3-month maturity.
Eurodollar rates are quoted on an
interest-bearing basis, assuming a 360-
day year.
Each Eurodollar futures contract
represents $1 million of initial face
value of Eurodollar deposits maturing
three months after contract expiration. 21
Example
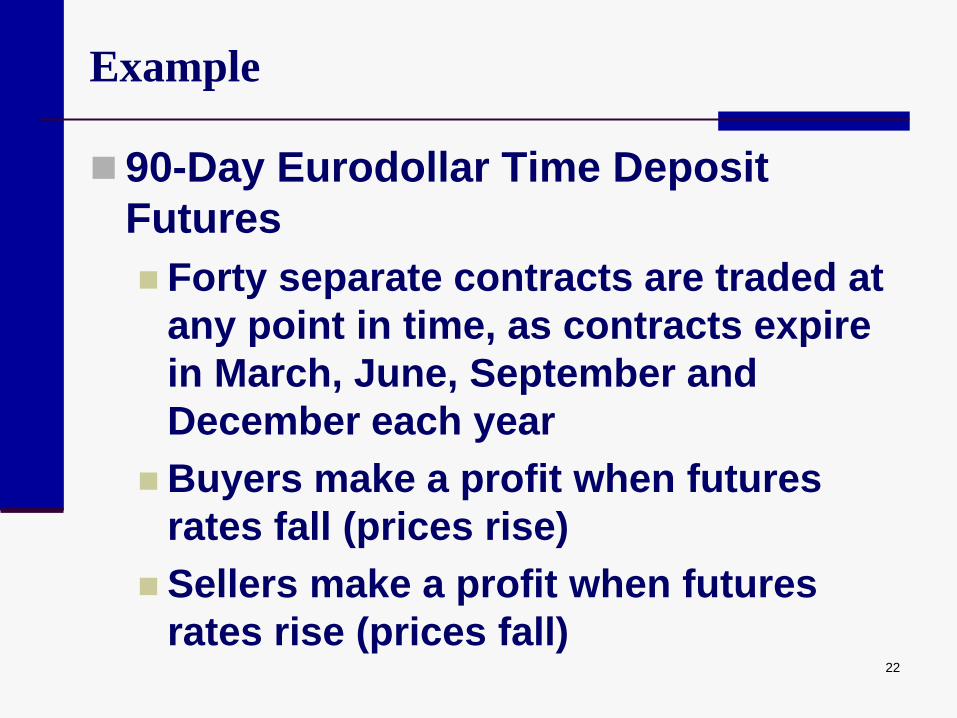
90-Day Eurodollar Time Deposit
Futures
Forty separate contracts are traded at
any point in time, as contracts expire
in March, June, September and
December each year
Buyers make a profit when futures
rates fall (prices rise)
Sellers make a profit when futures
rates rise (prices fall) 22
Example
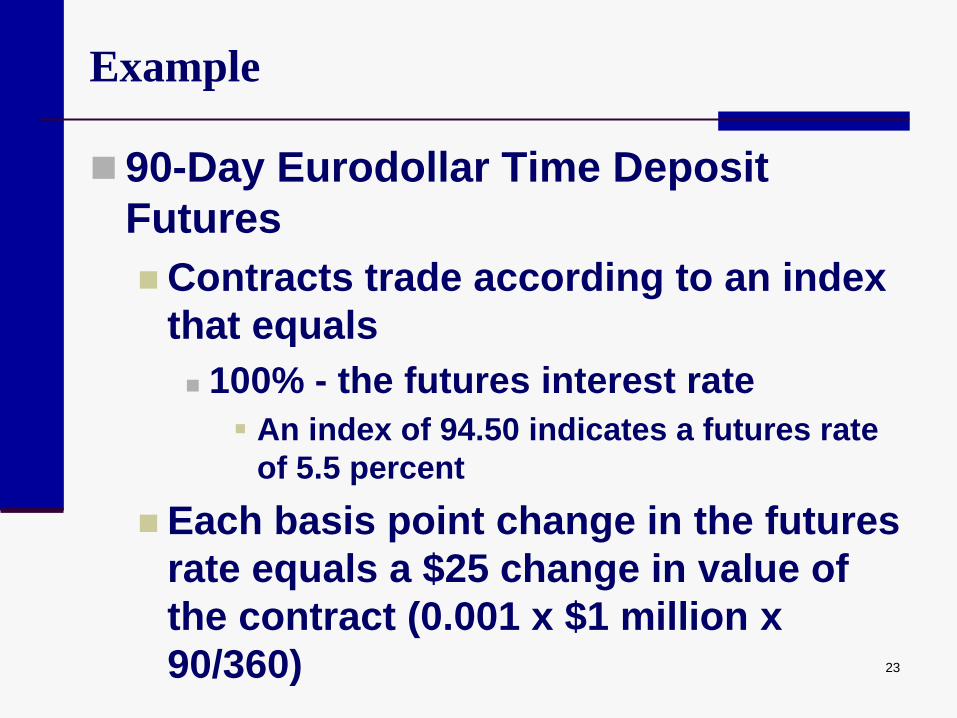
90-Day Eurodollar Time Deposit
Futures
Contracts trade according to an index
that equals
100% - the futures interest rate
An index of 94.50 indicates a futures rate
of 5.5 percent
Each basis point change in the futures
rate equals a $25 change in value of
the contract (0.001 x $1 million x
90/360) 23
The first column indicates the settlement month and year
Each row lists price and yield data for a distinct futures contract that expires sequentially every three months
The next four columns report the opening price, high and low price, and closing settlement price.
The next column, the change in settlement price from the previous day.
The two columns under Yield convert the settlement price to a Eurodollar futures rate as:
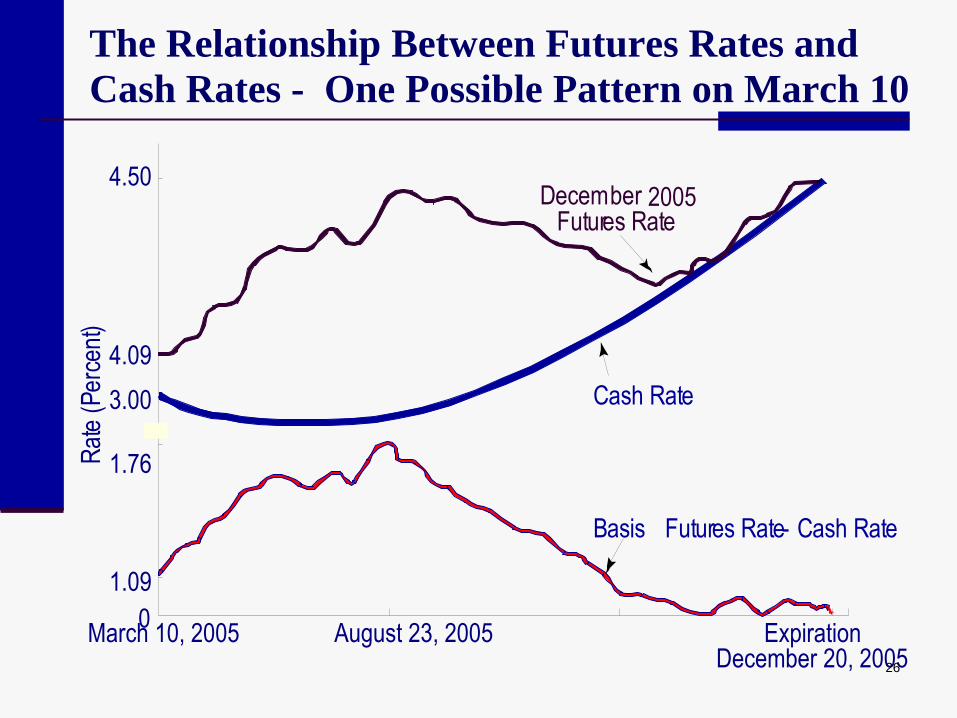
The basis is the cash price of an asset minus the corresponding futures price for the same asset at a point in time
For financial futures, the basis can be calculated as the futures rate minus the spot rate
It may be positive or negative, depending on whether futures rates are above or below spot rates
May swing widely in value far in advance of contract expiration
25
4.50
4.09
3.00
1.76
1.09
0 March 10, 2005 August 23, 2005 Expiration December 20, 2005
B a s i s F u t u r e s R a t e - C a s h R a t e
C a s h R a t e
D e c e m b e r 2005 F u t u r e s R a t e
R a t
e ( P
e r c e
n t )
The Relationship Between Futures Rates and
Cash Rates - One Possible Pattern on March 10
26
Speculation versus Hedging
A speculator takes on additional risk
to earn speculative profits
Speculation is extremely risky
A hedger already has a position in the
cash market and uses futures to adjust
the risk of being in the cash market
The focus is on reducing or avoiding
risk
27
Speculation versus Hedging
Example
Speculating
You believe interest rates will fall, so
you buy Eurodollar futures
If rates fall, the price of the underlying
Eurodollar rises, and thus the futures
contract value rises earning you a profit
If rates rise, the price of the Eurodollar
futures contract falls in value, resulting in
a loss
28
Speculation versus Hedging
Example
Hedging
A bank anticipates needing to borrow
$1,000,000 in 60 days. The bank is
concerned that rates will rise in the
next 60 days
A possible strategy would be to short
Eurodollar futures.
If interest rates rise (fall), the short
futures position will increase (decrease)
in value. This will (partially) offset the
increase (decrease) in borrowing costs 29
Speculation versus Hedging
With financial futures, risk often
cannot be eliminated, only reduced.
Traders normally assume basis risk in
that the basis might change adversely
between the time the hedge is initiated
and closed
Perfect Hedge
The gains (losses) from the futures
position perfectly offset the losses
(gains) on the spot position at each
price 30
Profit Diagrams for the December 2005
Eurodollar Futures Contract: Mar 10, 2005
31
Steps in Hedging
Identify the cash market risk exposure to reduce
Given the cash market risk, determine whether a long or short futures position is needed
Select the best futures contract
Determine the appropriate number of futures contracts to trade.
Buy or sell the appropriate futures contracts
Determine when to get out of the hedge position, either by reversing the trades, letting contracts expire, or making or taking delivery
Verify that futures trading meets regulatory requirements and the banks internal risk policies
32
A Long Hedge
A long hedge (buy futures) is appropriate
for a participant who wants to reduce spot
market risk associated with a decline in
interest rates
If spot rates decline, futures rates will
typically also decline so that the value of the
futures position will likely increase.
Any loss in the cash market is at least
partially offset by a gain in futures
33
Long Hedge Example
On March 10, 2005, your bank expects to
receive a $1 million payment on November
8, 2005, and anticipates investing the funds
in 3-month Eurodollar time deposits
The cash market risk exposure is that the
bank will not have access to the funds for
eight months.
In March 2005, the market expected
Eurodollar rates to increase sharply as
evidenced by rising futures rates.
34
Long Hedge Example
In order to hedge, the bank should buy futures contracts
The best futures contract will generally be the December 2005, 3-month Eurodollar futures contract, which is the first to expire after November 2005.
The contract that expires immediately after the known cash transactions date is generally best because its futures price will show the highest correlation with the cash price.
35
Long Hedge Example
The time line of the bank’s hedging
activities would look something like
this:
March 10, 2005 November 8, 2005 December 20, 2005
Cash: Anticipated investment
Futures: Buy a futures contract
Invest $1 million
Sell the futures contract
Expiration of Dec. 2005
futures contract
36
Long Hedge Example
3.99%90
360
$1,000,000
$9,975return Effective
Date Cash Market Futures Market Basis
3/10/05 Bank anticipates investing $1 million Bank buys one December 2005 4.09% - 3.00% = 1.09%
(Initial futures in Eurodollars in 8 months; current Eurodollar futures contract at
position) cash rate = 3.00% 4.09%; price = 95.91
11/8/05 Bank invests $1 million in 3 - month Bank sells one December 2005
4.03% - 3.93% = 0.10%
(Close futures Eurodollars at 3.93% Eurodollar futures contract at
$25 each = $2,500 $25 each = $725 Effective loss = $2,500 - $725 = $1,775 Effective rate at sale of deposit = 4.00% - 0.29% = 3.71% or 3.00% - (0.71%) = 3.71%
41
Change in the Basis
Long and short hedges work well if the futures rate moves in line with the spot rate
The actual risk assumed by a trader in both hedges is that the basis might change between the time the hedge is initiated and closed
In the long hedge position above, the spot rate increased by 0.93% while the futures rate fell by 0.06%. This caused the basis to fall by 0.99% (The basis fell from 1.09% to 0.10%, or by 0.99%) 42
Change in the Basis
Effective Return from a Hedge
Total income from the combined cash
and futures positions relative to the
investment amount
Effective return
Initial Cash Rate - Change in Basis
In the long hedge example:
3.00% - (-0.99%) = 3.99%
43
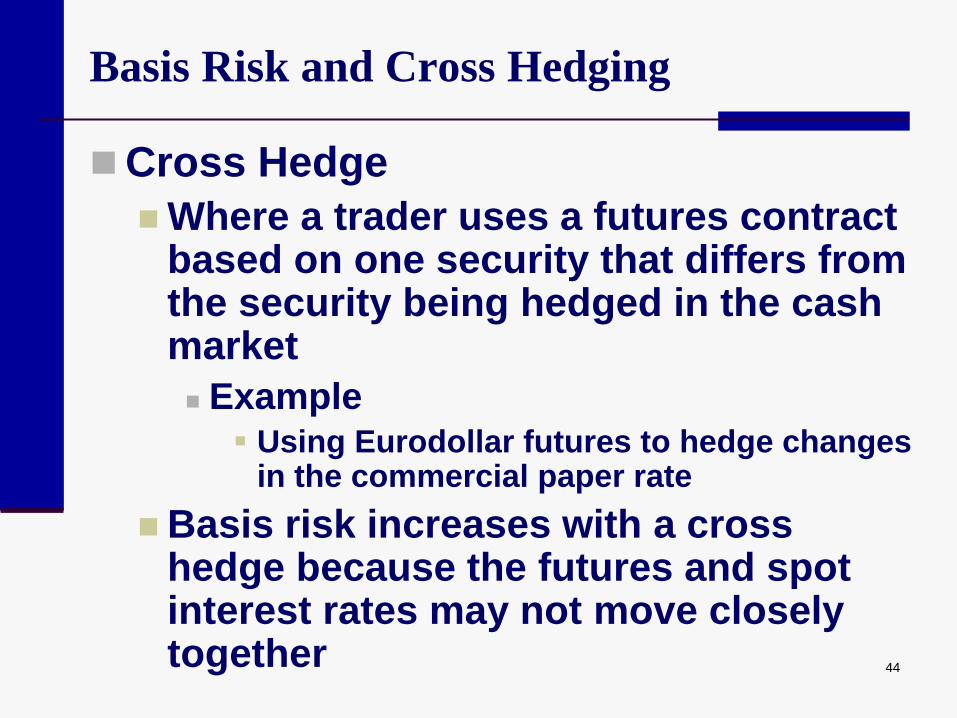
Basis Risk and Cross Hedging
Cross Hedge
Where a trader uses a futures contract based on one security that differs from the security being hedged in the cash market
Example Using Eurodollar futures to hedge changes
in the commercial paper rate
Basis risk increases with a cross hedge because the futures and spot interest rates may not move closely together 44
Microhedging Applications
Microhedge
The hedging of a transaction
associated with a specific asset,
liability or commitment
Macrohedge
Taking futures positions to reduce
aggregate portfolio interest rate risk
45
Microhedging Applications
Banks are generally restricted in their use of financial futures for hedging purposes
Banks must recognize futures on a micro basis by linking each futures transaction with a specific cash instrument or commitment
Many analysts feel that such micro linkages force microhedges that may potentially increase a firm’s total risk because these hedges ignore all other portfolio components
46
Creating a Synthetic Liability with a Short Hedge
3/10/05 7/3/05 9/30/05
Six-Month Deposit
Time Line
Three-Month Cash Eurodollar
3.25%
Synthetic
Six-Month Deposit3.00% 3.88%
-0.48% 3.40%
Three-Month Synthetic Eurodollar
Profit =
All In Six-Month Cost = 3.20%
47
Creating a Synthetic Liability with a Short Hedge
Summary of Relevant Eurodollar Rates and Transactions March 10, 2005 3-month cash rate = 3.00%; bank issues a $1 million, 91-day Eurodollar deposit 6-month cash rate = 3.25% Bank sells one September 2005 Eurodollar futures; futures rate = 3.85%
July 3, 2005 3-month cash rate = 3.88%; bank issues a $1 million, 91-day Eurodollar deposit Buy: One September 2005 Eurodollar futures; futures rate = 4.33%
Date Cash Market Futures Market Basis
3/10/05 Bank issues $1 million, 91-day Eurodollar time deposit Bank sells one September 2005 0.85%
at 3.00%; 3-mo. interest expense = $7,583. Eurodollar futures contract at 3.85% 7/3/05 Bank issues $1 million, 91-day Eurodollar time deposit Bank buys one September 2005 0.45%
at 3.88%; 3-mo. interest expense = $9,808 (increase in interest expense over previous period = $2,225).
Eurodollar futures contract at 4.33%;
Net effect: 6-mo. interest expense = $17,391 Profit on futures = $1,200
3.20%182
360
$1,000,000
$1,200-$17,391cost borrowing Effective
Interest on 6-month Eurodollar deposit issued March 10 = $13,144 at 3.25%; vs. 3.20% from synthetic liability
48
The Mechanics of Applying a Microhedge
1. Determine the bank’s interest rate
position
2. Forecast the dollar flows or value
expected in cash market transactions
3. Choose the appropriate futures
contract
49
The Mechanics of Applying a Microhedge
4. Determine the correct number of futures
contracts
Where
NF = number of futures contracts
A = Dollar value of cash flow to be hedged
F = Face value of futures contract
Mc = Maturity or duration of anticipated cash
asset or liability
Mf = Maturity or duration of futures contract
bMfF
Mc ANF
contract futures onmovement rate Expectedinstrument cash onmovement rate Expected b
50
The Mechanics of Applying a Microhedge
5. Determine the Appropriate Time
Frame for the Hedge
6. Monitor Hedge Performance
51
Macrohedging
Macrohedging
Focuses on reducing interest rate risk
associated with a bank’s entire
portfolio rather than with individual
transactions
52
Macrohedging
Hedging: GAP or Earnings Sensitivity
If GAP is positive (negative), the bank
is asset (liability) sensitive and its net
interest income rises (falls) when
interest rates rise (falls) and falls
(rises) when interest rates fall (rise)
Positive GAP
Use a long hedge
Negative GAP
Use a short hedge 53
Hedging: GAP or Earnings Sensitivity
Positive GAP
Use a long hedge
If rates rise, the bank’s higher net
interest income will be offset by losses
on the futures position
If rates fall, the bank’s lower net
interest income will be offset by gains
on the futures position
54
Hedging: GAP or Earnings Sensitivity
Negative GAP
Use a short hedge
If rates rise, the bank’s lower net
interest income will be offset by gains
on the futures position
If rates fall, the bank’s higher net
interest income will be offset by losses
on the futures position
55
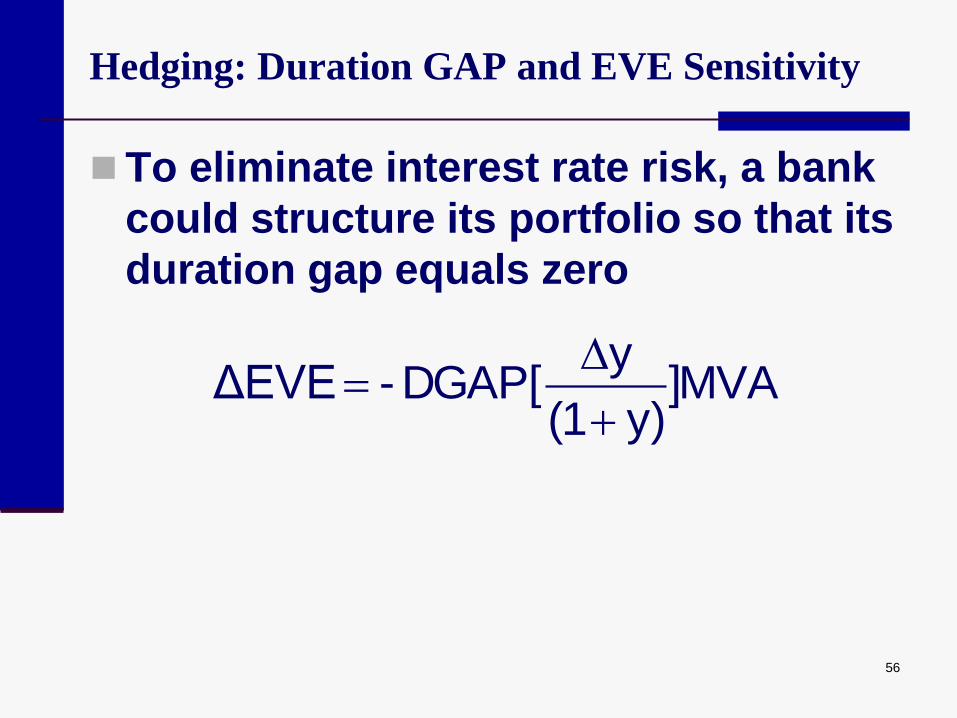
Hedging: Duration GAP and EVE Sensitivity
To eliminate interest rate risk, a bank
could structure its portfolio so that its
duration gap equals zero
MVA]y)(1
yDGAP[- ΔEVE
56
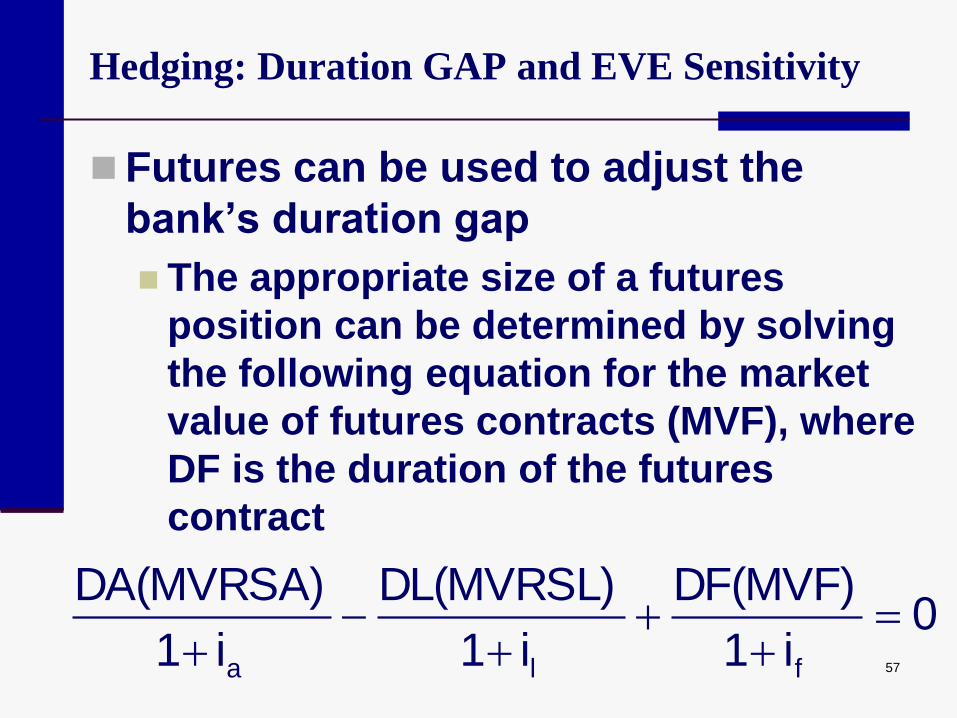
Hedging: Duration GAP and EVE Sensitivity
Futures can be used to adjust the
bank’s duration gap
The appropriate size of a futures
position can be determined by solving
the following equation for the market
value of futures contracts (MVF), where
DF is the duration of the futures
contract
0
i1
DF(MVF)
i1
DL(MVRSL)
i1
DA(MVRSA)
fla
57
Hedging: Duration GAP and EVE Sensitivity
Example:
A bank has a positive duration gap of
1.4 years, therefore, the market value
of equity will decline if interest rates
rise. The bank needs to sell interest
rate futures contracts in order to hedge
its risk position
The short position indicates that
the bank will make a profit if futures
rates increase
58
Hedging: Duration GAP and EVE Sensitivity
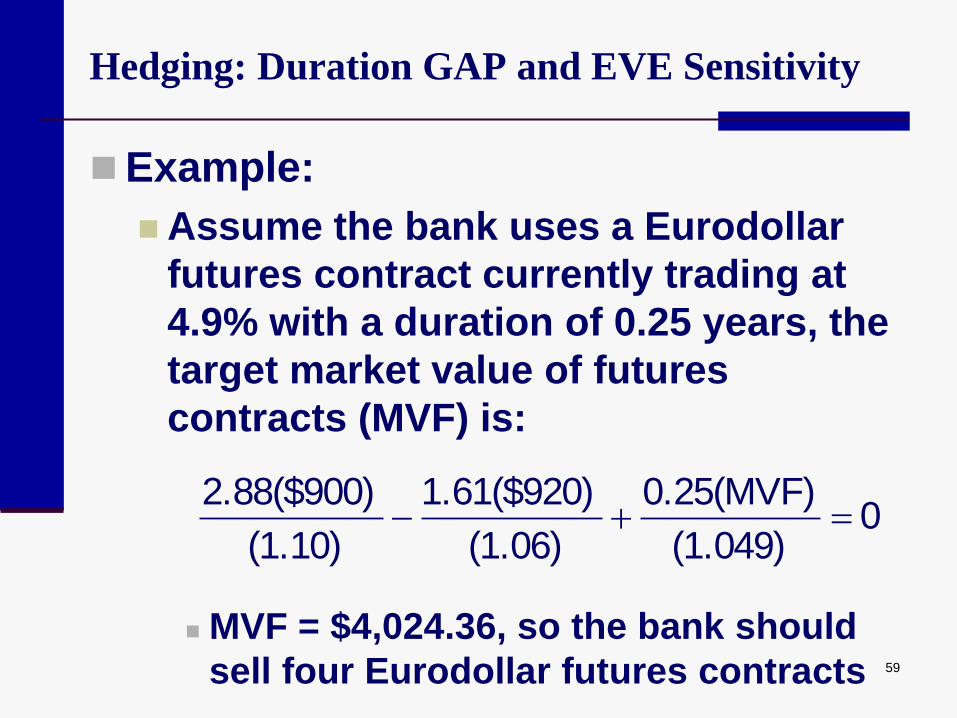
Example:
Assume the bank uses a Eurodollar
futures contract currently trading at
4.9% with a duration of 0.25 years, the
target market value of futures
contracts (MVF) is:
MVF = $4,024.36, so the bank should
sell four Eurodollar futures contracts
0 (1.049)
0.25(MVF)
(1.06)
1.61($920)
(1.10)
2.88($900)
59
Hedging: Duration GAP and EVE Sensitivity
Example:
If all interest rates increased by 1%, the
profit on the four futures contracts
would total 4 x 100 x $25 = $10,000,
which partially offset the $12,000
decrease in the economic value of
equity associated with the increase in
cash rates
Recall from Exhibit 6.2, the unhedged
bank had a reduction in EVE of $12,000
60
Accounting Requirements and Tax Implications
Regulators generally limit a bank’s use of futures for hedging purposes
If a bank has a dealer operation, it can use futures as part of its trading activities
In such accounts, gains and losses on these futures must be marked-to-market, thereby affecting current income
Microhedging
To qualify as a hedge, a bank must show that a cash transaction exposes it to interest rate risk, a futures contract must lower the bank’s risk exposure, and the bank must designate the contract as a hedge
61
Using Forward Rate Agreements to Manage
Interest Rate Risk
Forward Rate Agreements
A forward contract based on interest rates based on a notional principal amount at a specified future date
Buyer
Agrees to pay a fixed-rate coupon payment (at the exercise rate) and receive a floating-rate payment
Seller
Agrees to make a floating-rate payment and receive a fixed-rate payment
The buyer and seller will receive or pay cash when the actual interest rate at settlement is different than the exercise rate
62
Forward Rate Agreements (FRA)
Similar to futures but differ in that
they:
Are negotiated between parties
Do not necessarily involve
standardized assets
Require no cash exchange until
expiration
There is no marking-to-market
No exchange guarantees performance
63
Notional Principal
The two counterparties to a forward rate agreement agree to a notional principal amount that serves as a reference figure in determining cash flows.
Notional
Refers to the condition that the principal does not change hands, but is only used to calculate the value of interest payments.
64
Notional Principal
Buyer
Agrees to pay a fixed-rate coupon payment and receive a floating-rate payment against the notional principal at some specified future date.
Seller
Agrees to pay a floating-rate payment and receive the fixed-rate payment against the same notional principal.
The interest settlement amount is $5,000 Interest = (.07 -.05)(90/360) $1,000,000 = $5,000
Actual interest = $5,000 /[1 + (90/360).05] = $4,938
69
Example: Forward Rate Agreements
The FRA position is similar to a
futures position
County Bank would pay fixed-
rate/receive floating-rate as a hedge if
it was exposed to loss in a rising rate
environment.
This is analogous to a short futures
position
70
Example: Forward Rate Agreements
The FRA position is similar to a
futures position
Metro Bank would take its position as a
hedge if it was exposed to loss in a
falling (relative to forward rate) rate
environment.
This is analogous to a long futures
position
71
Basic Interest Rate Swaps
Basic or Plain Vanilla Interest Rate
Swap
An agreement between two parties to
exchange a series of cash flows based
on a specified notional principal
amount
Two parties facing different types of
interest rate risk can exchange interest
payments
72
Basic Interest Rate Swaps
Basic or Plain Vanilla Interest Rate Swap
One party makes payments based on a fixed interest rate and receives floating rate payments
The other party exchanges floating rate payments for fixed-rate payments
When interest rates change, the party that benefits from a swap receives a net cash payment while the party that loses makes a net cash payment
73
Basic Interest Rate Swaps
Conceptually, a basic interest rate
swap is a package of FRAs
As with FRAs, swap payments are
netted and the notional principal never
changes hands
74
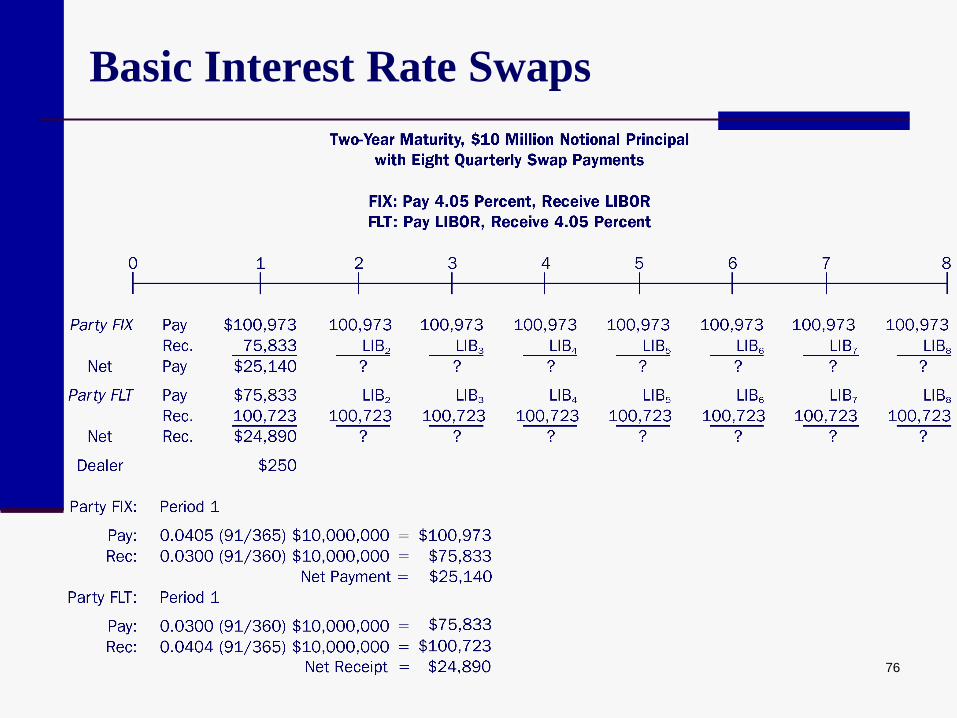
Basic Interest Rate Swaps
Using data for a 2-year swap based on
3-month LIBOR as the floating rate
This swap involves eight quarterly
payments.
Party FIX agrees to pay a fixed rate
Party FLT agrees to receive a fixed rate
with cash flows calculated against a
$10 million notional principal amount
75
Basic Interest Rate Swaps
76
Basic Interest Rate Swaps
Firms with a negative GAP can reduce
risk by making a fixed-rate interest
payment in exchange for a floating-rate
interest receipt
Firms with a positive GAP take the
opposite position, by making floating-
interest payments in exchange for a
fixed-rate receipt
77
Basic Interest Rate Swaps
Basic interest rate swaps are used to:
Adjust the rate sensitivity of an asset or liability
For example, effectively converting a fixed-rate loan into a floating-rate loan
Create a synthetic security
For example, enter into a swap instead of investing in a security
Macrohedge
Use swaps to hedge the bank’s aggregate interest rate risk
78
Basic Interest Rate Swaps
Swap Dealers
Handle most swap transactions
Make a market in swap contracts
Offer terms for both fixed-rate and
floating rate payers and earn a spread for
their services
79
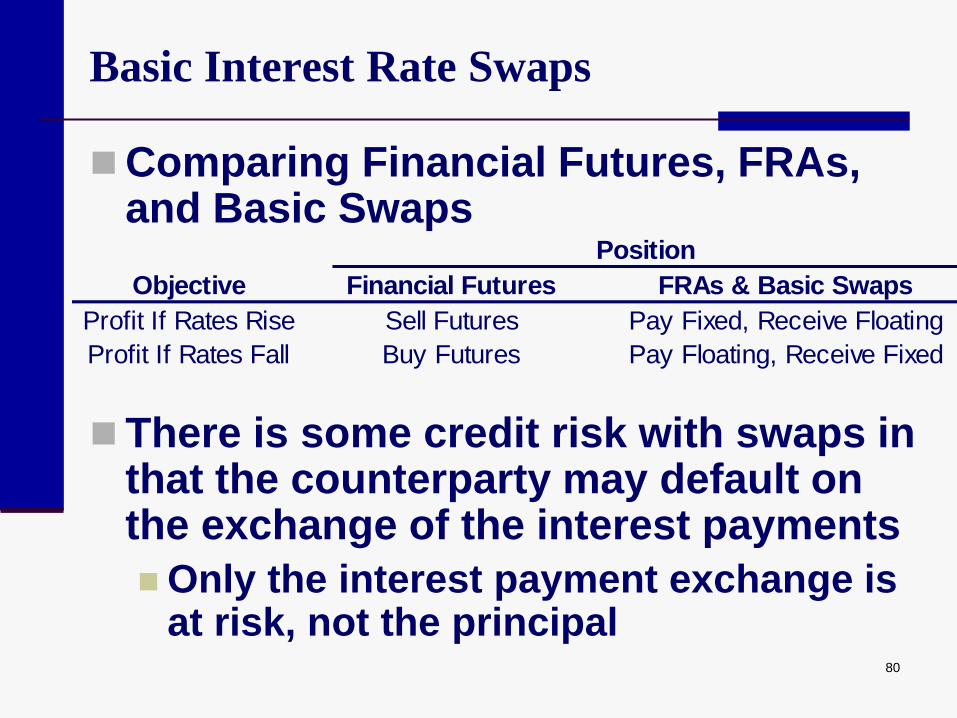
Basic Interest Rate Swaps
Comparing Financial Futures, FRAs, and Basic Swaps
There is some credit risk with swaps in that the counterparty may default on the exchange of the interest payments
Only the interest payment exchange is at risk, not the principal
Objective Financial Futures FRAs & Basic Swaps
Profit If Rates Rise Sell Futures Pay Fixed, Receive Floating
Profit If Rates Fall Buy Futures Pay Floating, Receive Fixed
Position
80
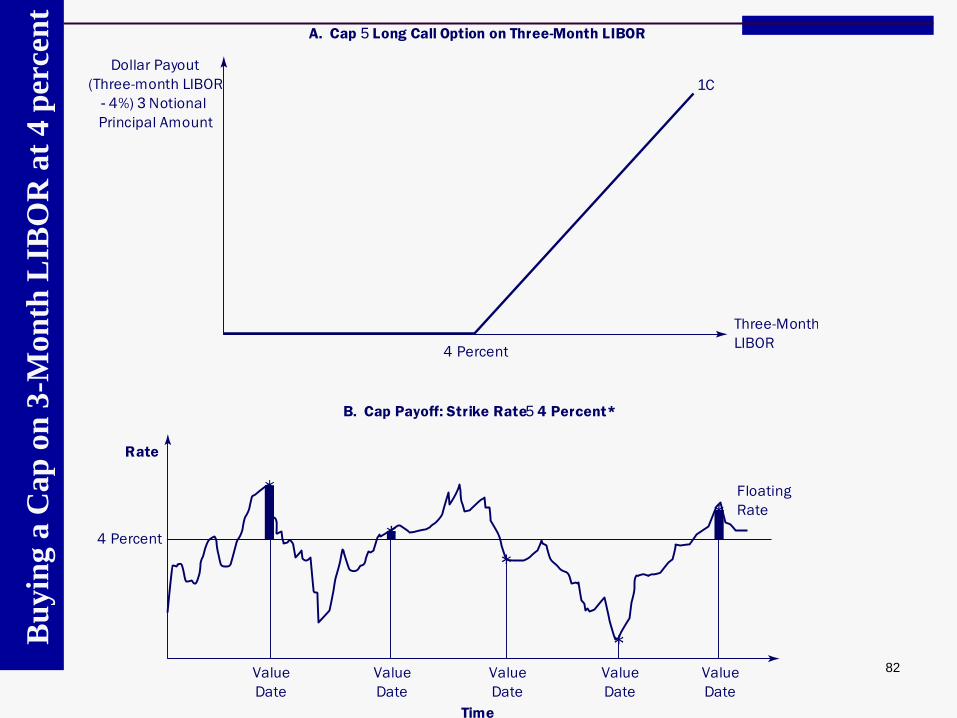
Interest Rate Caps and Floors
Interest Rate Cap
An agreement between two
counterparties that limits the buyer’s
interest rate exposure to a maximum
limit
Buying a interest rate cap is the same
as purchasing a call option on an
interest rate
81
Bu
yin
g a
Cap
on
3-M
on
th L
IBO
R a
t 4 p
erce
nt
4 Percent
A. Cap 5 Long Call Option on Three-Month LIBOR
Dollar Payout
(Three-month LIBOR
- 4%) 3 Notional
Principal Amount
1C
Three-Month
LIBOR
Value
Date
Value
Date
Value
Date
Time
B. Cap Payoff: Strike Rate5 4 Percent*
Value
Date
Value
Date
Floating
Rate
Rate
4 Percent
82
Interest Rate Caps and Floors
Interest Rate Floor
An agreement between two
counterparties that limits the buyer’s
interest rate exposure to a minimum
rate
Buying an interest rate floor is the
same as purchasing a put option on an
interest rate
83
Bu
yin
g a
Flo
or
on
3-M
on
th L
IBO
R a
t 4 p
erce
nt
4 Percent
A. Floor = Long Put Option on Three-Month LIBOR
Dollar Payout
(4% - Three-month
LIBOR) X Notional
Principal Amount
1P
Three-Month
LIBOR
Value
Date
Value
Date
Value
Date
Time
B. Floor Payoff: Strike Rate= 4 Percent*
Value
Date
Value
Date
Floating
Rate
Rate
4 Percent
84
Interest Rate Caps and Floors
Interest Rate Collar
The simultaneous purchase of an interest rate cap and sale of an interest rate floor on the same index for the same maturity and notional principal amount
A collar creates a band within which the buyer’s effective interest rate fluctuates
It protects a bank from rising interest rates
85
Interest Rate Caps and Floors
Zero Cost Collar
A collar where the buyer pays no net premium
The premium paid for the cap equals the premium received for the floor
Reverse Collar
Buying an interest rate floor and simultaneously selling an interest rate cap
It protects a bank from falling interest rates
86
Pricing Interest Rate Caps and Floors
The size of the premiums for caps and floors is determined by:
The relationship between the strike rate an the current index
This indicates how much the index must move before the cap or floor is in-the-money
The shape of yield curve and the volatility of interest rates
With an upward sloping yield curve, caps will be more expensive than floors
87
Pricing Interest Rate Caps and Floors
Term Bid Offer Bid Offer Bid Offer
Caps
1 year 24 30 3 7 1 2
2 years 51 57 36 43 10 15
3 years 105 115 74 84 22 29
5 years 222 240 135 150 76 5
7 years 413 433 201 324 101 116
10 years 549 573 278 308 157 197
Floors1 year 1 2 15 19 57 55
2 years 1 6 31 37 84 91
3 years 7 16 40 49 128 137
5 years 24 39 75 88 190 205
7 years 38 60 92 106 228 250
10 years 85 115 162 192 257 287
1.50% 2.00% 2.50%
A. Caps/Floors
4.00% 5.00% 6.00%
88
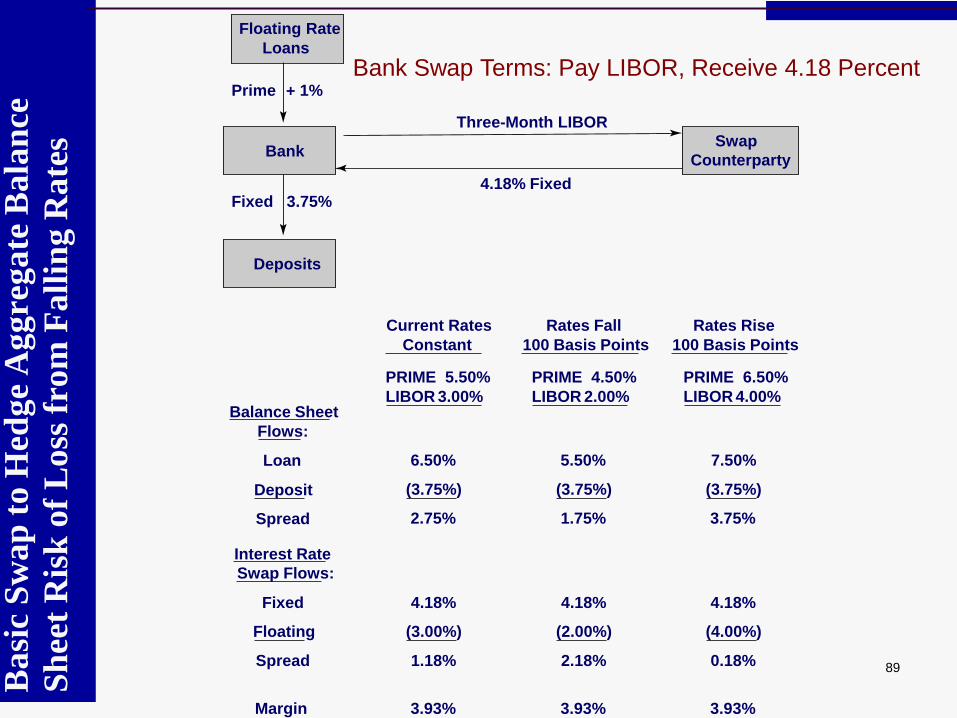
Ba
sic
Sw
ap
to
Hed
ge
Ag
gre
ga
te B
ala
nce
Sh
eet
Ris
k o
f L
oss
fro
m F
all
ing R
ate
s Bank Swap Terms: Pay LIBOR, Receive 4.18 Percent
Current Rates
Constant
Bank Swap Terms: Pay LIBOR, Receive 4.18 Percent*
Rates Fall
100 Basis Points
Balance Sheet
Flows:
Loan
Deposit
Spread
6.50%
(3.75%)
2.75%
5.50%
(3.75%)
1.75%
7.50%
(3.75%)
3.75%
4.18%
(3.00%)
1.18%
4.18%
(2.00%)
2.18%
4.18%
(4.00%)
0.18%
3.93% 3.93% 3.93%
Interest Rate
Swap Flows:
Fixed
Floating
Spread
Margin
Rates Rise
100 Basis Points
PRIME 5.50%
LIBOR 3.00%
PRIME 4.50%
LIBOR 2.00%
PRIME 6.50%
LIBOR 4.00%
Floating Rate
Loans
Prime + 1%
Bank
Fixed 3.75% 4.18% Fixed
Three-Month LIBOR
Deposits
Swap
Counterparty
89
Bu
yin
g a
Flo
or
on
3-M
on
th L
IBO
R t
o H
edg
e A
ggre
gate
B
ala
nce
Sh
eet
Ris
k o
f L
oss
Fro
m F
all
ing
Ra
tes
Floor Terms: Buy a 2.50 Percent Floor on 3-Month LIBOR
Rates Fall
100 Basis Points
Balance Sheet
Flows:
Loan
Deposit
Spread
6.50%
(3.75%)
2.75%
5.50%
(3.75%)
1.75%
7.50%
(3.75%)
3.75%
0.00%
(0.30%)
(0.30%)
0.50%
(0.30%)
0.20%
0.00%
(0.30%)
(0.30%)
2.45% 1.95% 3.45%
Floor
Flows:
Payout
Fee Amort.
Spread
Margin
Rates Rise
100 Basis Points
PRIME 5.50%
LIBOR 3.00%
PRIME 4.50%
LIBOR 2.00%
PRIME 6.50%
LIBOR 4.00%
Floating Rate
Loans
Prime + 1%
Bank
Fixed 3.75%
Three-Month LIBOR < 2.50%
Fee: (0.30%) per year
Receive when
Deposits
Counterparty
Current Rates
Constant
90
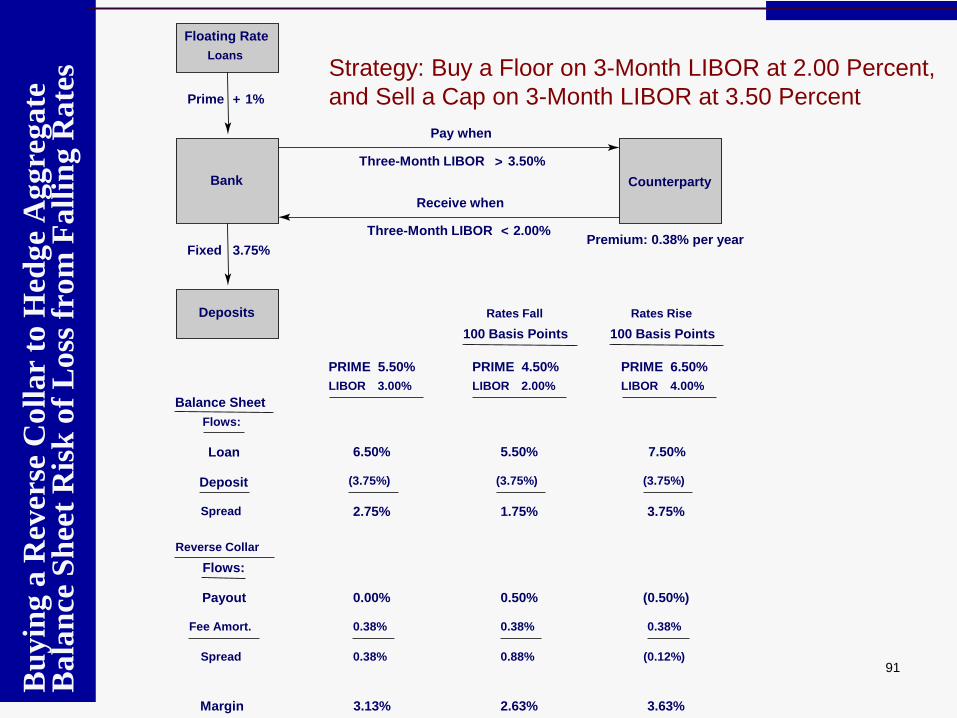
Bu
yin
g a
Rev
erse
Coll
ar
to H
edge
Aggre
gate
B
ala
nce
Sh
eet
Ris
k o
f L
oss
fro
m F
all
ing R
ate
s Strategy: Buy a Floor on 3-Month LIBOR at 2.00 Percent,
and Sell a Cap on 3-Month LIBOR at 3.50 Percent
Rates Fall
100 Basis Points
Balance Sheet
Flows:
Loan
Deposit
Spread
6.50%
(3.75%)
2.75%
5.50%
(3.75%)
1.75%
7.50%
(3.75%)
3.75%
0.00%
0.38%
0.38%
0.50%
0.38%
0.88%
(0.50%)
0.38%
(0.12%)
3.13% 2.63% 3.63%
Reverse Collar
Flows:
Payout
Fee Amort.
Spread
Margin
Rates Rise
100 Basis Points
PRIME 5.50%
LIBOR 3.00%
PRIME 4.50%
LIBOR 2.00%
PRIME 6.50%
LIBOR 4.00%
Floating Rate
Loans
Prime + 1%
Bank
Fixed 3.75%
Three-Month LIBOR < 2.00% Premium: 0.38% per year
Receive when
Three-Month LIBOR > 3.50%
Pay when
Deposits
Counterparty
91
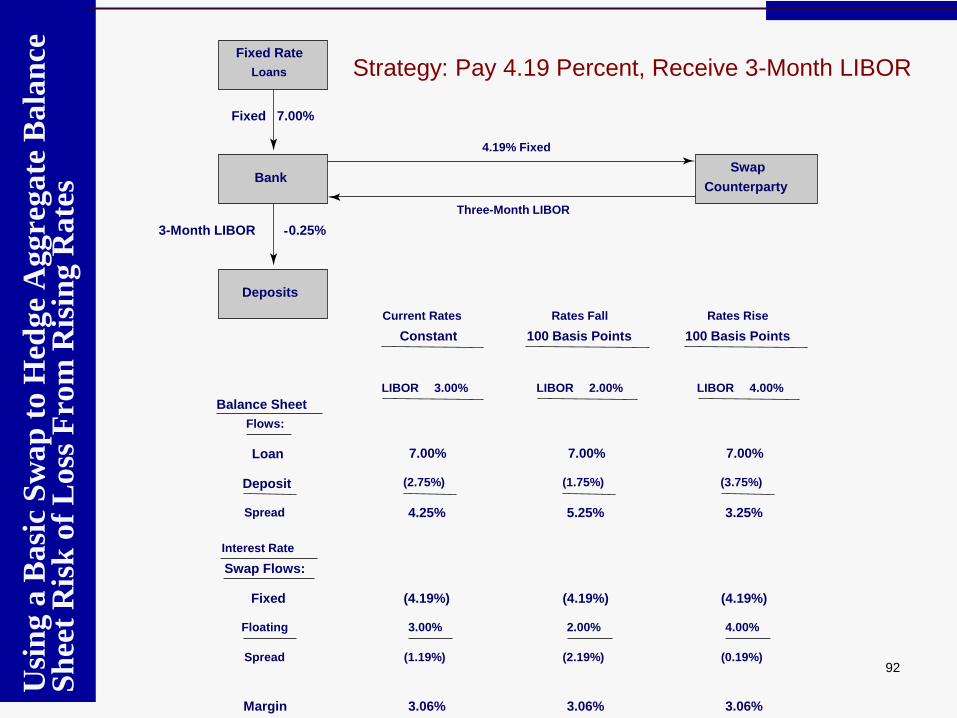
Usi
ng a
Basi
c S
wap
to H
edge
Aggre
gate
Bala
nce
S
hee
t R
isk
of
Loss
Fro
m R
isin
g R
ate
s Strategy: Pay 4.19 Percent, Receive 3-Month LIBOR
Rates Fall
100 Basis Points
Balance Sheet
Flows:
Loan
Deposit
Spread
7.00%
(2.75%)
4.25%
7.00%
(1.75%)
5.25%
7.00%
(3.75%)
3.25%
(4.19%)
3.00%
(1.19%)
(4.19%)
2.00%
(2.19%)
(4.19%)
4.00%
(0.19%)
3.06% 3.06% 3.06%
Interest Rate
Swap Flows:
Fixed
Floating
Spread
Margin
Rates Rise
100 Basis Points
LIBOR 3.00% LIBOR 2.00% LIBOR 4.00%
Fixed Rate
Loans
Fixed 7.00%
Bank
3-Month LIBOR - 0.25%
Three-Month LIBOR
4.19% Fixed
Deposits
Swap
Counterparty
Current Rates
Constant
92
Rates Fall
100 Basis Points
Balance Sheet
Flows:
Loan
Deposit
Spread
7.00%
(2.75%)
4.25%
7.00%
(1.75%)
5.25%
7.00%
(3.75%)
3.25%
0.00%
(0.50%)
(0.50%)
0.00%
(0.50%)
(0.50%)
0.50%
(0.50%)
0.00%
3.75% 4.75% 3.25%
Cap
Flows:
Payout
Fee Amort.
Spread
Margin
Rates Rise
100 Basis Points
LIBOR 3.00% LIBOR 2.00% LIBOR 4.00%
Fixed Rate
Loans
Bank
Three-Month LIBOR - 0.25%
Three-Month LIBOR > 4.00%
Fee: (0.50%) per year
Receive when
Deposits
Counterparty
Fixed 7.00%
Current Rates
Constant
Bu
y a
Cap
on
3-M
on
th L
IBO
R t
o H
edge
Bala
nce
S
hee
t R
ate
Ris
k o
f L
oss
fro
m R
isin
g R
ate
s Strategy: Buy a Cap on 3-Month LIBOR at 4.00 Percent
93
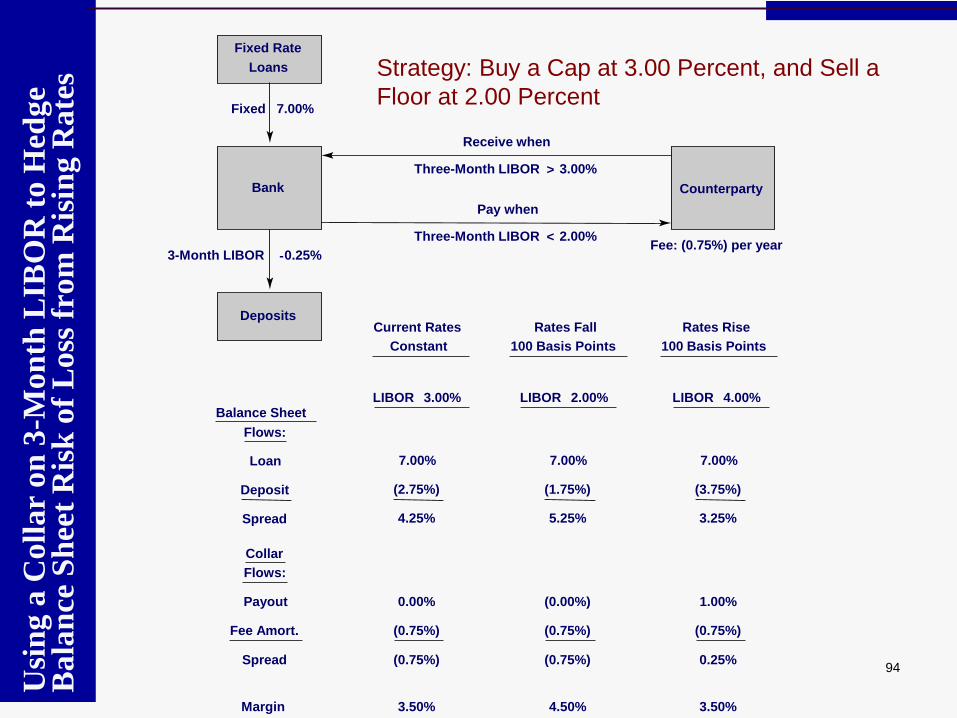
Usi
ng a
Coll
ar
on
3-M
on
th L
IBO
R t
o H
edge
Bala
nce
Sh
eet
Ris
k o
f L
oss
fro
m R
isin
g R
ate
s Strategy: Buy a Cap at 3.00 Percent, and Sell a
Floor at 2.00 Percent
Rates Fall
100 Basis Points
Balance Sheet
Flows:
Loan
Deposit
Spread
7.00%
(2.75%)
4.25%
7.00%
(1.75%)
5.25%
7.00%
(3.75%)
3.25%
0.00%
(0.75%)
(0.75%)
(0.00%)
(0.75%)
(0.75%)
1.00%
(0.75%)
0.25%
3.50% 4.50% 3.50%
Collar
Flows:
Payout
Fee Amort.
Spread
Margin
Rates Rise
100 Basis Points
LIBOR 3.00% LIBOR 2.00% LIBOR 4.00%
Fixed Rate
Loans
Fixed 7.00%
Bank
3-Month LIBOR - 0.25%
Three-Month LIBOR < 2.00% Fee: (0.75%) per year
Pay when
Three-Month LIBOR > 3.00%
Receive when
Deposits
Counterparty
Current Rates
Constant
94
William Chittenden edited and updated the PowerPoint slides for this edition.