Web Analytics 1 Web Analytics Using eMetrics to Guide Marketing Strategies on the Web Web analytics is the practice of measuring, collecting, analyzing and reporting on Internet data for the purposes of understanding how a web site is used by its audience and how to optimize its usage (definition by the Web Analytics Association). Over the summer, ITS spent a considerable amount of time evaluating the various web analytic tools available and their associated advantages and disadvantages. Ultimately we selected two tools (one was free and one was purchased - thanks to Harold for his financial support). Chuck Wyatt and Tracy Axelson have been working through the implementation of these products and we are finally in a place where we are comfortable enough with the products, their capabilities and the data that we are getting out of them, to discuss their practical application. Ideally, the presentation that Chuck and Tracy have prepared will serve a catalyst for a discussion about: realistic "business" objectives for our website; the development of key performance indicators that are both actionable and measurable; and reporting requirements.
Transcript
Web Analytics
1
Web Analytics
Using eMetrics to Guide Marketing Strategies
on the Web
Web analytics is the practice of measuring, collecting, analyzing and reporting on Internet data for the purposes of understanding how a web site is used by its audience and how to optimize its usage (definition by the Web Analytics Association).
Over the summer, ITS spent a considerable amount of time evaluating the various web analytic tools available and their associated advantages and disadvantages. Ultimately we selected two tools (one was free and one was purchased - thanks to Harold for his financial support). Chuck Wyatt and Tracy Axelson have been working through the implementation of these products and we are finally in a place where we are comfortable enough with the products, their capabilities and the data that we are getting out of them, to discuss their practical application. Ideally, the presentation that Chuck and Tracy have prepared will serve a catalyst for a discussion about: realistic "business" objectives for our website; the development of key performance indicators that are both actionable and measurable; and reporting requirements.
Web Analytics
2
What is Web Analytics
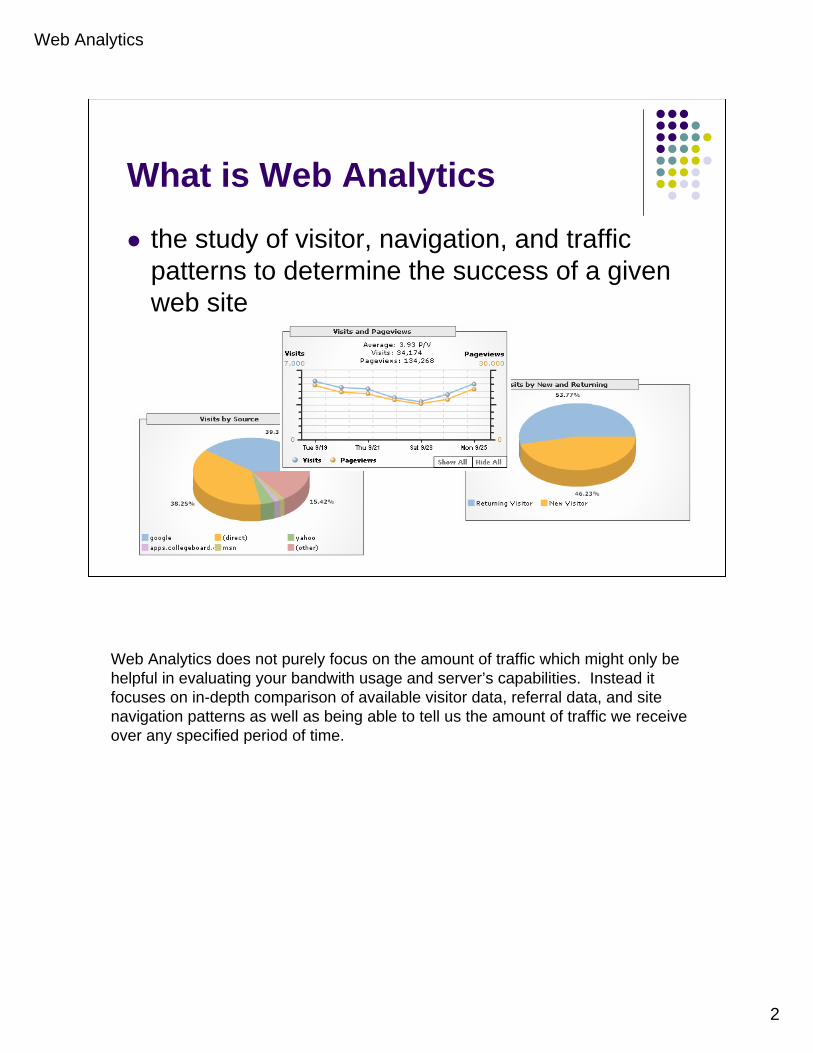
the study of visitor, navigation, and traffic patterns to determine the success of a given web site
Web Analytics does not purely focus on the amount of traffic which might only be helpful in evaluating your bandwith usage and server’s capabilities. Instead it focuses on in-depth comparison of available visitor data, referral data, and site navigation patterns as well as being able to tell us the amount of traffic we receive over any specified period of time.
Web Analytics
3
Data Sources
Server LogsVisitor’s DataSearch Engine DataDefined Conversion Funnels
The various tools that perform this analysis use these sources to complete the analysis. We’ll talk about defined conversion funnels in-depth toward the end of the presentation.
Web Analytics
4
Our Old ToolW-Usage
Uses server logs only for hit analysisBest use – to estimate server loadGood for historical analysis
Our old tool W-Usage was useful in evaluating the load on the server. It basically tracked the hits in reference to certain pages - pages we decided to track. As we’ll discuss later, this is not the best method of analyzing the success or failure of a web site. But it is good for us to have this tool if simply as a means of historical analysis.
Web Analytics
5
Our New Tools
Urchin 5 Software
Server sideCombination of server logs, cookies, and javascript code in its analysis
Google Analytics
External to our serversUses cookies and javascript code to analyze web traffic
But this fall we have incorporated two new tools. These two tools have their own strengths and weaknesses and each will be used for different reasons.
Urchin is a software application installed on our servers that uses a combination of server logs, cookies, and javascript code to perform its analysis. Google Analytics is offered free by Google, it functions completely separate of our servers and is only capable of using cookies and a small snippet of javascript code that we place on pages we want to track.
Web Cookies: web cookies are a tiny text file sent from the web server to a visitor’s browser and on returning visits to that site, sent back again, unchanged to provide some information about that visitor. Cookies are used to maintain information about visitors’ previous interactions with a web site, for authentication, or for simple tracking purposes.
Web Analytics
6
ProsVery Accurate Session DataDeeper Level Page Analysis
ConsDoes not provide Marketing-Based DataGeographical Analysis and Visitor Data Could be Better
Pros and Cons of
Urchin, for its reasonable price tag, does a terrific job of determining what is a real person visiting our site. It uses a combination of a cookie to track the session, along with our logs and page code to create a very accurate picture of the human traffic on our site.
Urchin does not provide the great marketing-based data that Google Analytics is so useful for, therefore we’ll use Urchin for more of the standard reports.
Web Analytics
7
Pros and Cons of
ProsExcellent Graphical Representation of DataProvides for Marketing-Based Analysis
ConsPage Level Analysis is More SuperficialTracking Method Not as Accurate as Urchin’s UTMNo Historical Data
Google Analytics tracking method is not able to use our logs to decide what is a returning or unique human visitor – but even with that, the numbers generated by Google are VERY close to what we get internally with Urchin.
Google Analytics limits the depth of the page navigation and it also limits the number of profiles you have available without paying a fee, although what is available for free is more than sufficient for the present time.
Google Analytics has a wonderful graphical representation, especially of the geographical data and what we are most excited about, the ability to preset conversion funnels to track marketing goals on the site. More about that specifically later.
Web Analytics
8
Definitions and Examples
Common Terms Defined and Some Basic Reports
Before going into the marketing driven analysis, I’d like to make sure everyone is on the same page with understanding the basic terms of web analytics and at the same time go over some of the basic reports that we recommend should be run on a periodic basic. These reports are really valuable when you look at the trends over time rather than informative in and of themselves. We can talk at the end of the presentation about who would like to get these periodic reports as well as what intervals makes the most sense for informative comparison.
Web Analytics
9
VisitorsA visitor is a unique individual user of a web site.Tracking methods varyUTM uses a complex algorithm to determine what constitutes a “visitor”
A visitor is a unique individual user of a web site. The Urchin tracking method, UTM, as previously stated does a very good job of evaluating the data to determine real human users of our site. (there are lots of non-human visitors to the site such as web bots that help search engines to index a site).
Web Analytics
10
Sessions
A session is a period of activity by an individual visitor from entrance point to exit point
The session, in addition to visitors, is probably one of the most useful pieces of information we can gather. The session is the period of activity by an individual visitor from the time they entered our site until they exited our site (or left the site up dormant for a long period of time – walking away to go do something else for instance would result in a timeout after a particular length of time).
Web Analytics
11
Pageviews
A pageview is a request from a visitor’s browser for a displayable web page
A pageview is a successful request for a single web page on our site. This does not count objects on the pages, it only counts a page itself.
Web Analytics
12
Hits
A hit is a successful request from a visitor’s browser for ANY page element: images, media, scripts, etc
Hits are the least valuable piece of data gathered from a value perspective. To say we had 400,000 hits this week means absolutely nothing to the success or failure of a site apart from being able to assess the load on the server. Hits reflect every single object loaded on a page (images, links, includes, etc) and a single web page may have many hits associated with it.
Web Analytics
13
Session Summary
Per session analysis gives us a better idea of the activity of visitors on the site
Session analysis is very helpful over time. The only parts of the per session analysis that I would think the marketing team would be interested in is the total session, total pageviews, average sessions per day, average pageviews per day, and average pageviews per session.
Web Analytics
14
Referrals in General
Where does our traffic come from? These are external web pages that brought traffic to our site
This report can tell us what pages external to the Clark site are driving traffic into our site. You’ll see that Google’s search engine is responsible for a full 22% of our traffic. But notice over 55% of our traffic (for this time period) has NO REFERRAL. That means that either they have our site bookmarked as a favorite, they type in the URL directly, or they were emailed a link perhaps. Notice that one of the higher referrers is the College Board site.
Web Analytics
15
Most Popular Search Engines
This report ranks the search engines referring to your site by the number of sessions created.
Instead of looking at all referrers, we can look purely at the search engines used to drive traffic to our site. Google and Yahoo would of course be the highest, but we can also see other search engines represented. This might be helpful in determining where we might like to purchase keywords or place other advertising.
Web Analytics
16
Search Terms by Engine
Expanded reports allow us to see top search terms associated with the different search engines.
The search engine report allows us to “drill down” to view the rated search terms used in any of these search engines as well. We can see what search terms are actually driving traffic to the site. What this report cannot help us with is evaluating what terms people might be using where our site does not place highly on the results. Obviously with this report, we can see that if someone searches by “clark”or “clark university” we are placed as number one in the results (just perform this search to see where you place) but if someone searches by “liberal arts massachusetts” where do we show up?
Web Analytics
17
Keyword Searches
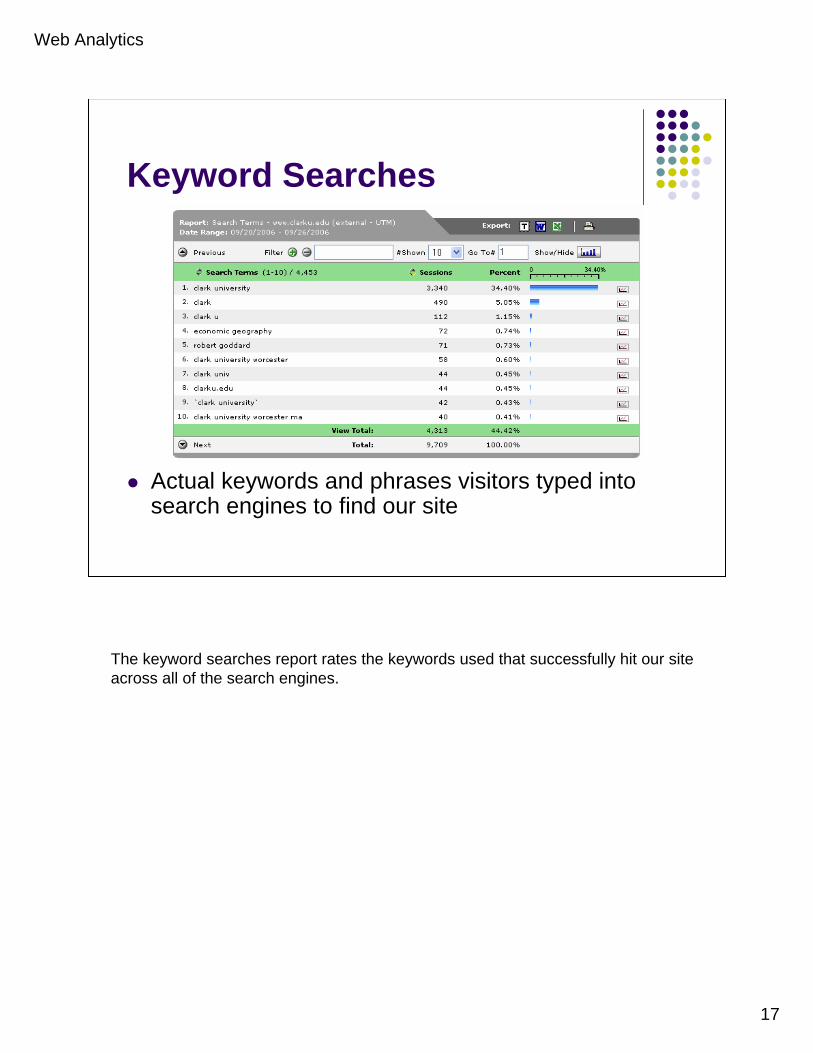
Actual keywords and phrases visitors typed into search engines to find our site
The keyword searches report rates the keywords used that successfully hit our site across all of the search engines.
More than 100 SearchesBlackboardCampus mapcMailEmail LibraryStudent emailTuition
What isn’t represented in the Urchin/Analytics keyword and search reports is what terms individuals are using once on our site to find content within the site. The search page consistently ranks in the top 10 visited pages. Chuck wrote a little application to record search terms on the internal search page and evaluate that data. It is important to know that we can filter this data in a variety of ways, for instance by on-campus searches and off-campus searches.
Internal Keywords help us to: •Evaluate the effectiveness of the site’s navigation•Evaluate placement of high interest links
Search terms with more that 100 requests:
blackboardcampus mapcmailemaillibrary
Web Analytics
19
Top Entrance Pages
This report ranks the entrance pages across our site- an entrance page is the first page viewed in each session.
Web Analytics
20
Top Exit Pages
The report ranks the top exit pages – the exit page is the last page viewed in each session.
Web Analytics
21
Bounce Rate
Bounce Rate refers to the number of sessions that began and ended on the same page without going to any other pages during the session.
Bounce rate sounds very bad but keep in mind that often the point of a page is for someone to visit it, read it or perform some other action such as printing or making a phone call, and then close it. It also can reflect visitors driven to our site through a search engine who find that our site is not what they were looking for. High placement on results pages in search engines can equate to higher bounce rates.
Web Analytics
22
Length of Session
How much time visitors are spending on your site
How much time are our visitors spending on our site per session.
Web Analytics
23
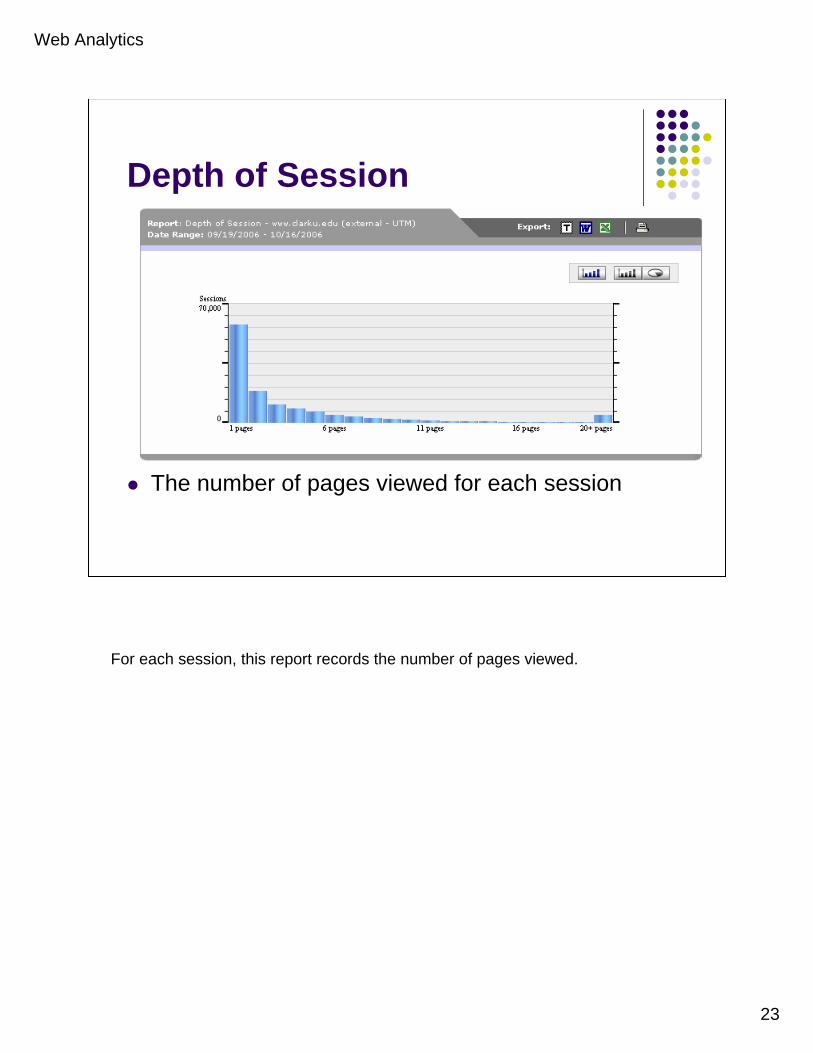
Depth of Session
The number of pages viewed for each session
For each session, this report records the number of pages viewed.
Web Analytics
24
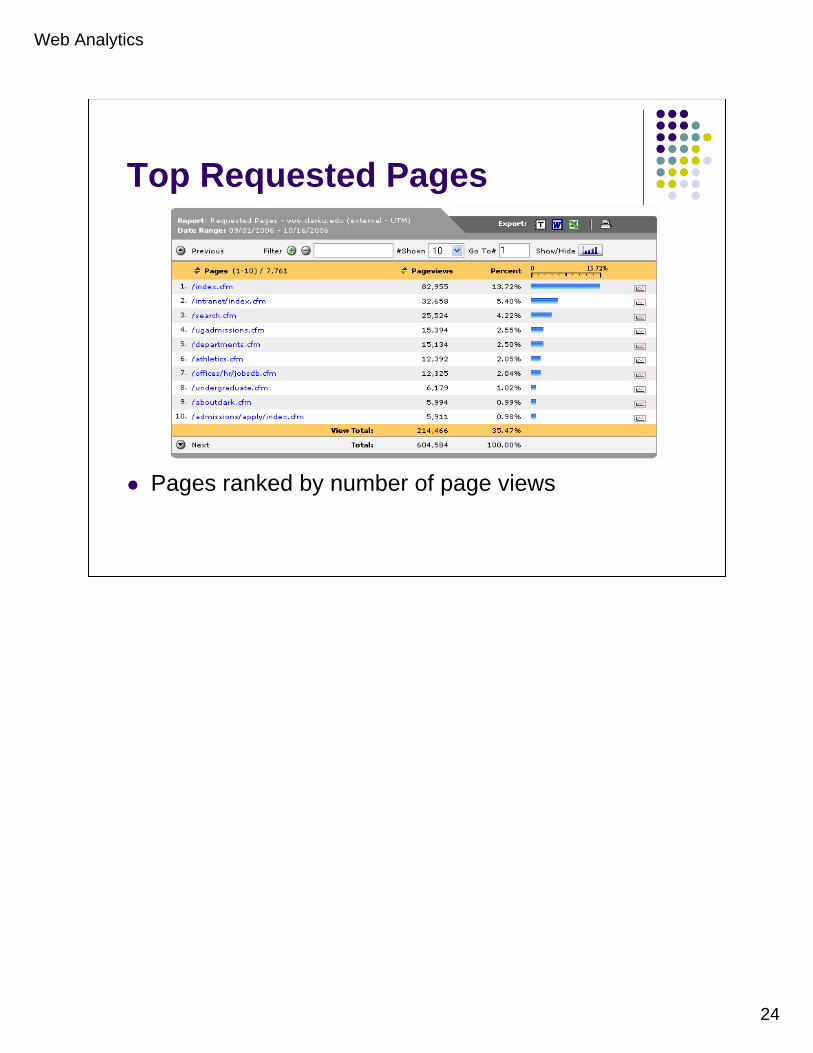
Top Requested Pages
Pages ranked by number of page views
Web Analytics
25
Top Downloads
Top downloaded documents such as PDFs or Word Documents
Web Analytics
26
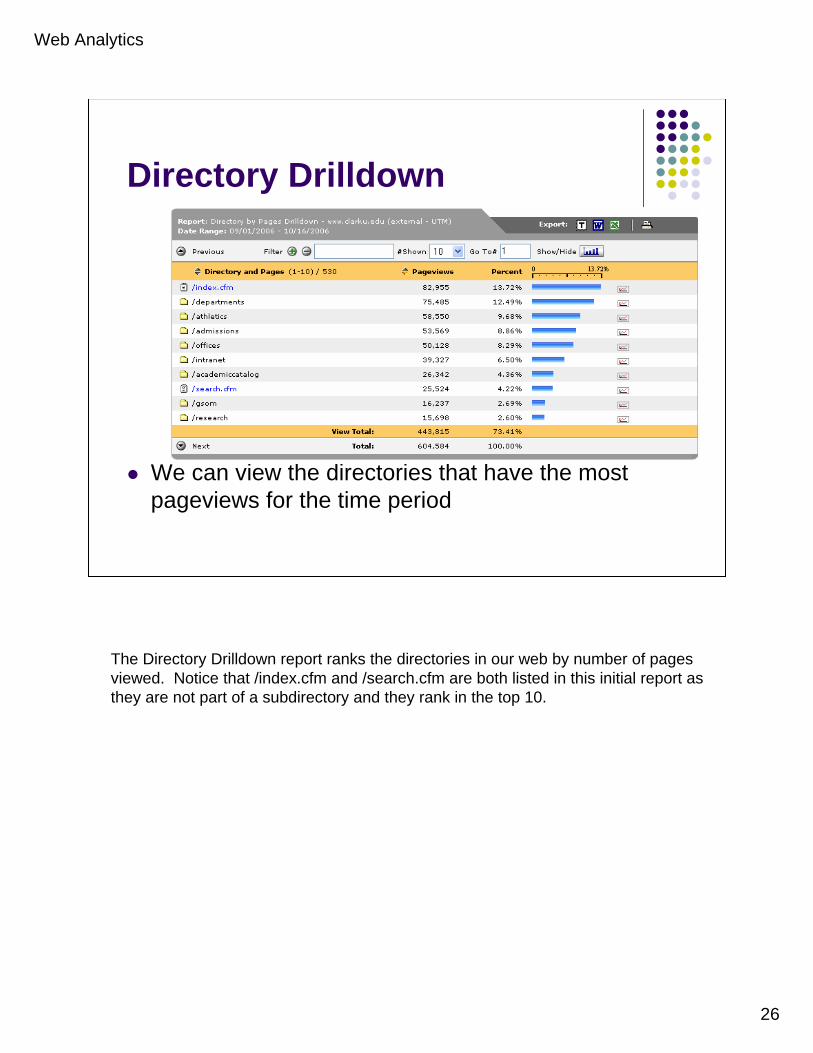
Directory Drilldown
We can view the directories that have the most pageviews for the time period
The Directory Drilldown report ranks the directories in our web by number of pages viewed. Notice that /index.cfm and /search.cfm are both listed in this initial report as they are not part of a subdirectory and they rank in the top 10.
Web Analytics
27
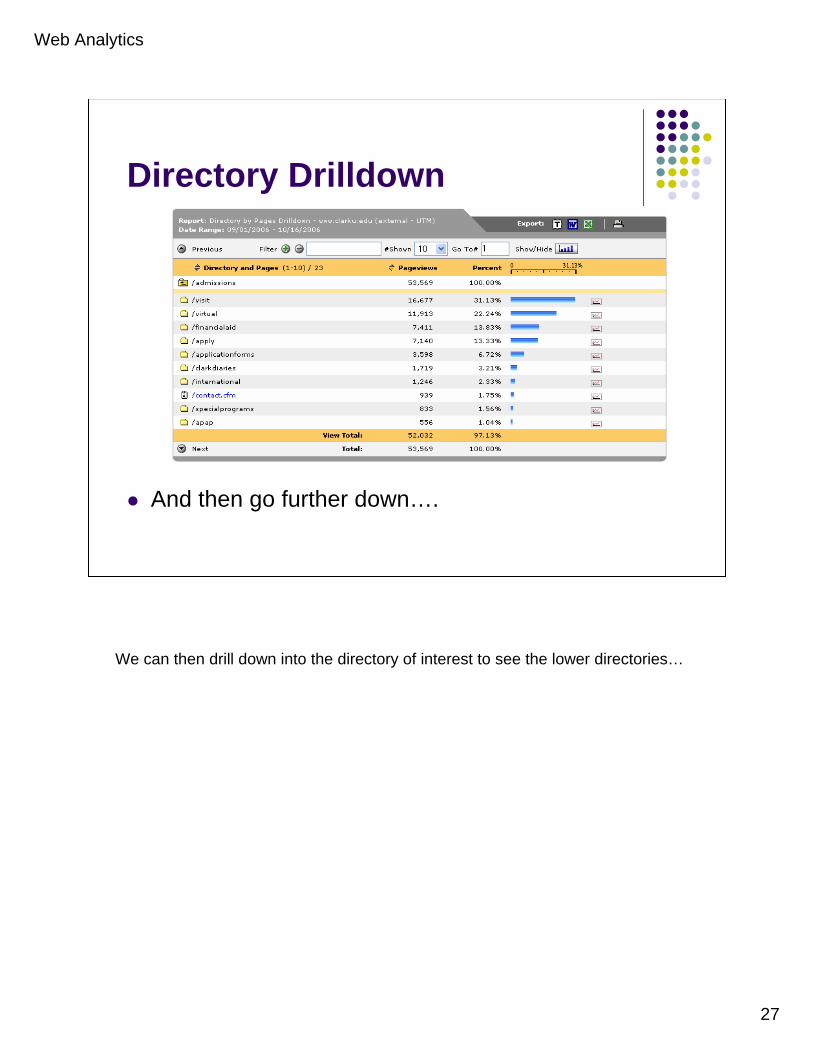
Directory Drilldown
And then go further down….
We can then drill down into the directory of interest to see the lower directories…
Web Analytics
28
Directory Drilldown
And further still until you can see the actual pages for that directory.
…and eventually the pages and their percentage of the total pageviews.
Web Analytics
29
Browsers/Platforms
What browser and computer platforms combinations are the most popular among our visitors?
There are a variety of reports to tell us what browser and computer platforms are most prevalent. This helps us a great deal when deciding what technologies to implement on the site. This report comes from Urchin. Google Analytics also has a report on the screen resolutions being used by visitors. That is very handy information as well from a technical perspective.
Web Analytics
30
Unique vs. Returning Visitors
Absolute unique visitors for a date range
This comes from Google Analytics where all previous reports came from Urchin’s interface. Urchin does not have a report to address this question of unique versus returning visitors.
Web Analytics
31
Geographical Locations
Top ten within the US
Web Analytics
32
Geographical Locations
Top ten countries
Web Analytics
33
Geo Map Overlay
Web Analytics
34
Defined Conversion Funnels
Conversion Rates andHow They’re Measured
We’d like to introduce the idea of conversion rates and the marketing-driven analysis that Google Analytics can provide. It is here that we are looking for guidance from the marketing committee as to goals that are viable for this type of tracking method.
Web Analytics
35
Conversion Rate
The number of goal conversions divided by sessionsLooks at whether your visitors have completed some action specified as a goal.
In terms of eCommerce, it is very easy to explain conversion rate. How many visits to XYZ company resulted in a purchase of ABC product?
In terms of Clark it is more difficult to define goals because there isn’t a “checkout”so to speak. However, we do have several goals on our site (admissions, giving to the Clark Fund, filling out various forms, etc).
Web Analytics
36
Conversion Funnel
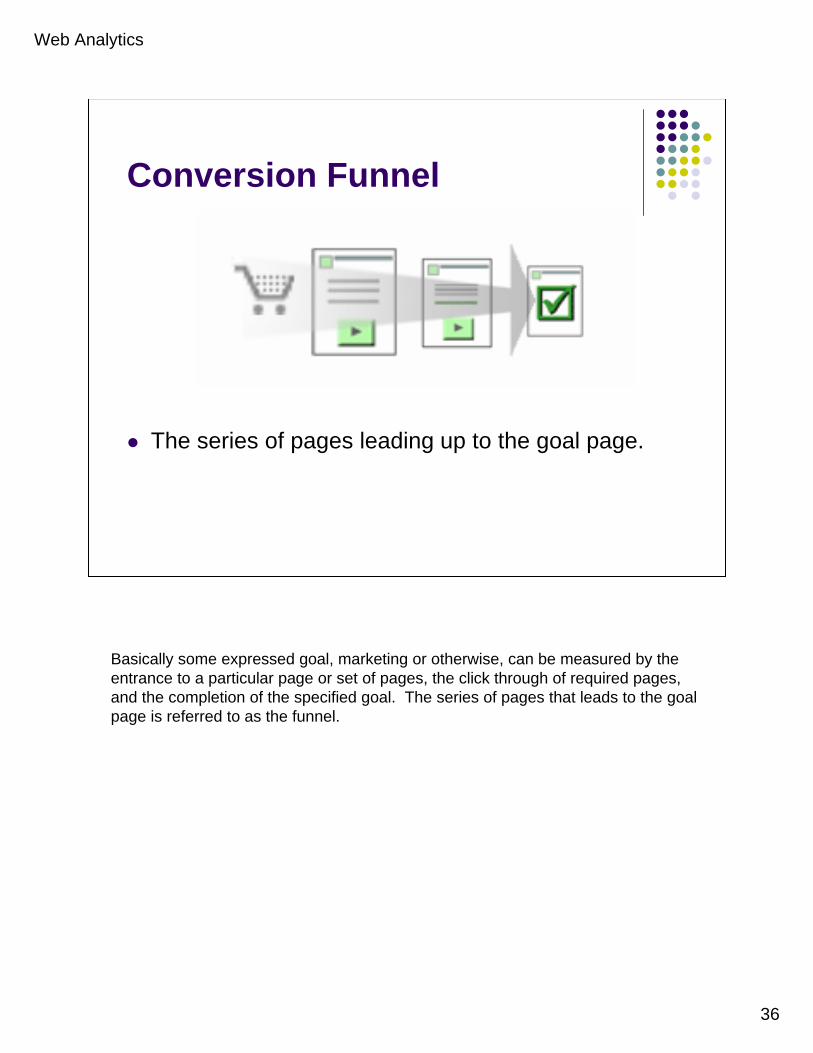
The series of pages leading up to the goal page.
Basically some expressed goal, marketing or otherwise, can be measured by the entrance to a particular page or set of pages, the click through of required pages, and the completion of the specified goal. The series of pages that leads to the goal page is referred to as the funnel.
Web Analytics
37
Admissions Conversions
Request More Info
Chuck and I chose the admissions “request more info” form as the most logical example of a conversion goal on our site. Obviously, we want students to visit the form and fill it out completely, providing their contact information so that they can receive admissions materials. This form is laid out in a series of pages which request personal and contact information as well as specific programs and other items of interest. The form creates a dynamic email to the student providing links to content in our site and makes a record in the database for admissions.
What did we find?
Web Analytics
38
This is the defined funnel navigation for September through October.
The defined funnel navigation report tracks visitors to the goal pages from their entrance through their exit or completion of the goal. We can see what pages referred the visitors to the goal pages and then for each piece of the funnel, we can see where visitors jumped out of the process.
The largest percentage jump out right at the beginning. They don’t even start the form. This could be parents realizing that they need to have their child fill out the form for instance.
We lose 45% on step 1, only 43 of which are exiting their browser completely. The rest continued on to other parts of the Clark site.On step 2 we lose another 23%, but roughly ½ of these are closing their browser completely. The rest go to other Clark pages.Step 3, we lose only 11%. So for the goal, we end up with a 35.9% conversion rate.
Web Analytics
39
Conclusions
Use the data to improve the form:Provide a “request info” form for parentsReduce the number of questionsProvide a process indicator
These defined conversion funnels really should be able to help us determine where the problem areas are for this more info process.
We lose ½ right off the top. Perhaps, as recent studies indicate, students do not want to give away any personal information and prefer to find out what they want to find out about a college without being “marketed to”. At STAMATS it was announced that this year 40% of applications received by colleges were the first contact that the colleges had had with these applicants. It could also be that parents begin to “request more info” only to find that the student has to fill out the form. Perhaps we could provide a link for parents to request information?
Further down in the process, we lose another 23%. That second step is a long page of questions that could be scary to the students. Perhaps we can pull out anything that isn’t absolutely necessary since all of these students should be getting a timely contact from an admissions counselor anyway? We might also wonder if the prospect bails out because they don’t know how long the form actually is, so perhaps adding a process indicator would make them feel more comfortable.
While this “request info” form does provide a nicely formatted HTML email with links to relevant information, we feel that the “thank you” page should also provide links other parts of the site they might find interesting based on their answers to the questions. This data is already in a database so putting it up on that page based on their responses would be very simple. If all the confirmation page says is “thank you” the natural tendency is to close that browser window. Instead, we feel it would be better if we kept them on the site by presenting links to other interesting content.
Web Analytics
40
What We Need From You
Marketing Goals for TrackingIntervals for Providing ReportsMethod of Providing Reports
Marketing Goals:We need the committee to specify web marketing objectives, either already in existence or to be developed, which would allow us to define key performance indicators that are both actionable and measurable.
Reporting Intervals:What intervals make sense in terms of the basic reports? Reporting intervals for conversion funnels, once defined, will most likely need to be decided on based on the content being analyzed, taking into consideration the natural business cycles represented in that funnel.
Reporting Methods:How would the marketing committee like to receive reports – in an emailed report, on a password protected web page, presented in person?