Schneider Electric protects grid revenue by helping distribution utilities easily locate energy losses and improve grid operations & efficiency.
Schneider Electric has partnered with Awesense Inc. to deliver a best in class grid data analytics solution.
Presenter
Presentation Notes
This presentation is about revenue protection in electric distribution networks. After a general overview of what is at stake and the various kinds of losses we'll be presenting how to tackle non technical energy losses in electrical distribution networks; we have understood that this is a major area of concerns for utilities and grid operators. We will show how we can help you to mitigate these losses with or without smartmeters.
3
Over $200B of energy wasted yearly
Annual value of global Non Technical electricity losses (annual increase +2,5%)
Source: World Bank 2011-2014
Presenter
Presentation Notes
From different sources, the assessment is Distribution non technical losses average 3-4% in the European Union (up to 30% in India) -This number (4%) includes losses in the medium and low voltage lines and in primary and secondary substations We are discussing huge amounts of money on a worldwide basis Utilities and Analysts acknoledge this is unfortunately on a growing trend… �Smartgrid technologies can help to reduce this. We’ll see how we can understand the problem and contribute to fix it.
4
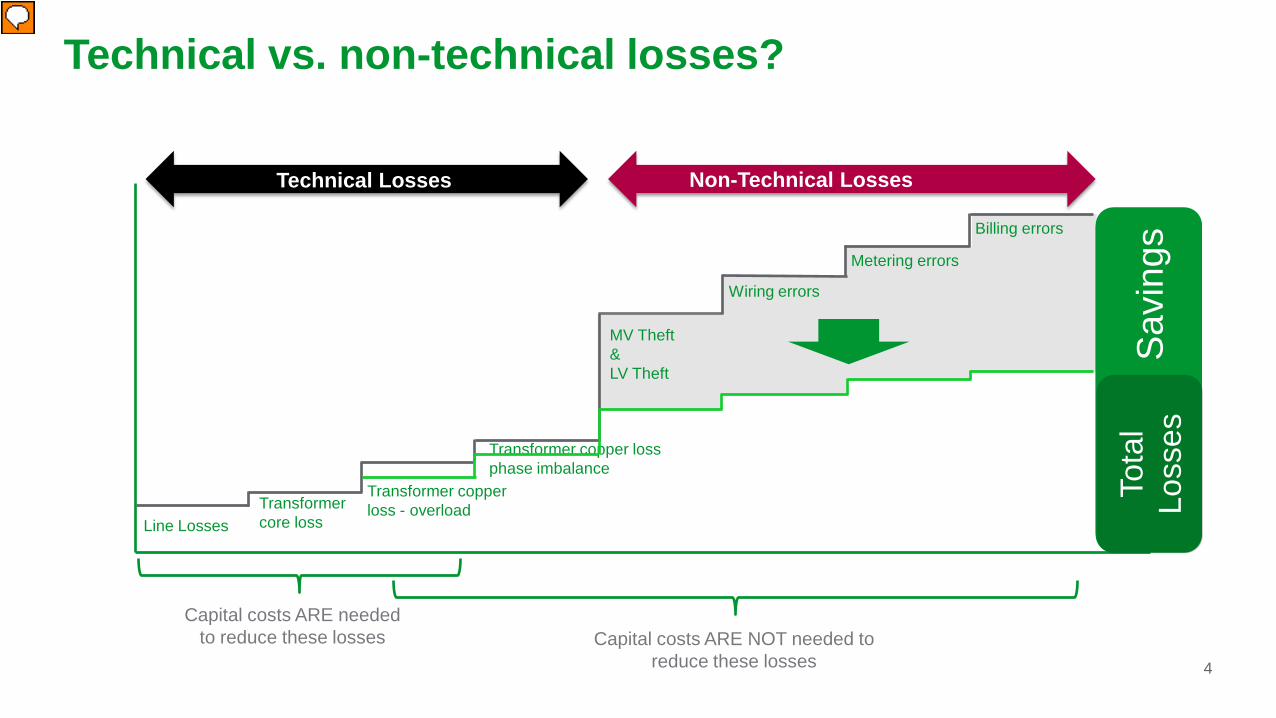
Technical Losses
MV Theft&LV Theft
Wiring errors
Tota
l Los
ses
Metering errors
Line LossesTransformer core loss
Transformer copper loss - overload
Transformer copper loss phase imbalance
Billing errors
Capital costs ARE NOT needed to reduce these losses
Capital costs ARE needed to reduce these losses
Non-Technical Losses
Technical vs. non-technical losses?
Savi
ngs
Tota
l Lo
sses
Presenter
Presentation Notes
Technical losses are generally a result of inefficiencies in the lines and transformers. These include: Line losses Transformer core losses Transformer copper losses Copper losses can be caused by heavy transformer loading, and by phase imbalances. You can reduce losses in some cases by re-assigning loads to less heavily loaded phases or transformers, when possible. Otherwise a transformer upgrade and the associated capital cost is the only way to reduce these technical losses. Non-technical losses can be more easily reduced without investing large amounts of capital. These include Theft Wiring errors Metering errors Billing errors When understanding the problem the same tool and methodology allow to decrease copper losses at the same time because, from measurements in the field, at MV/LV substations, we will visualize overloads and imbalances. So we can build recommendations to reduce them. Let’s have a look on how to proceed
5
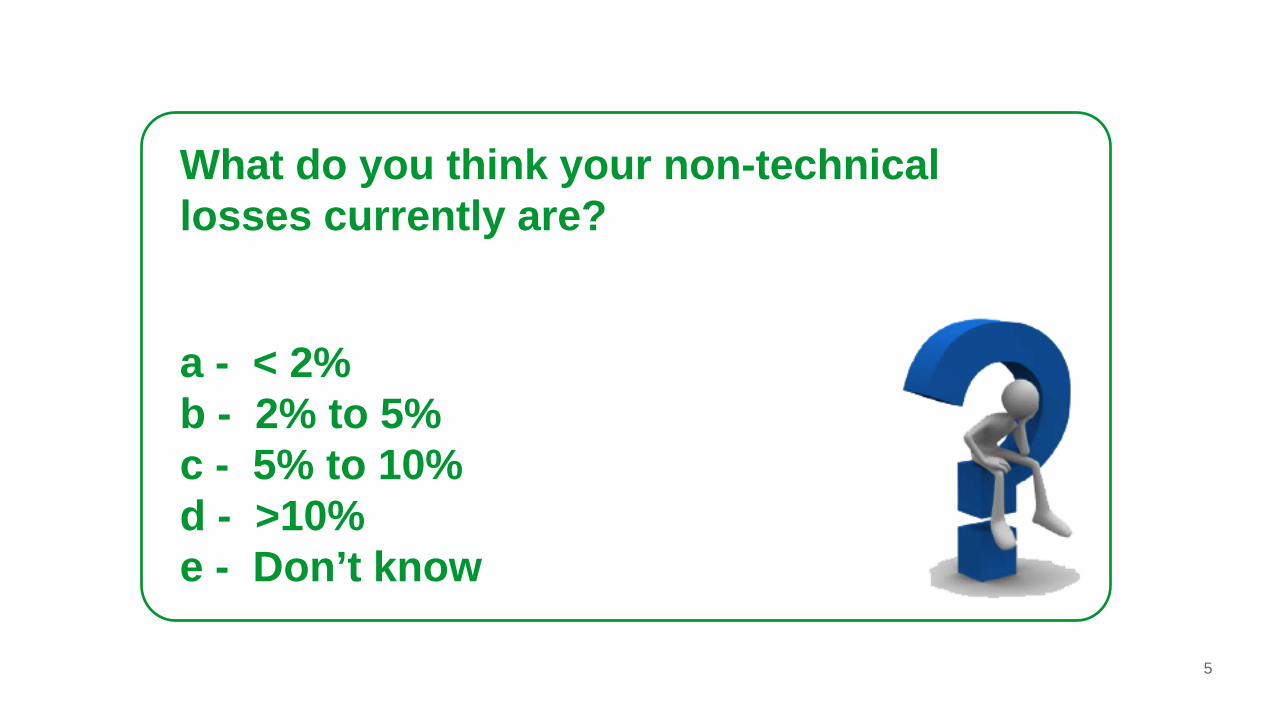
What do you think your non-technical losses currently are?
a - < 2%b - 2% to 5%c - 5% to 10%d - >10%e - Don’t know
6
Smart meters find some theft
Meter tampering
Low voltage diversionLosses identified
using Smart Meters and Meter Data Analytics
✔
✔
7
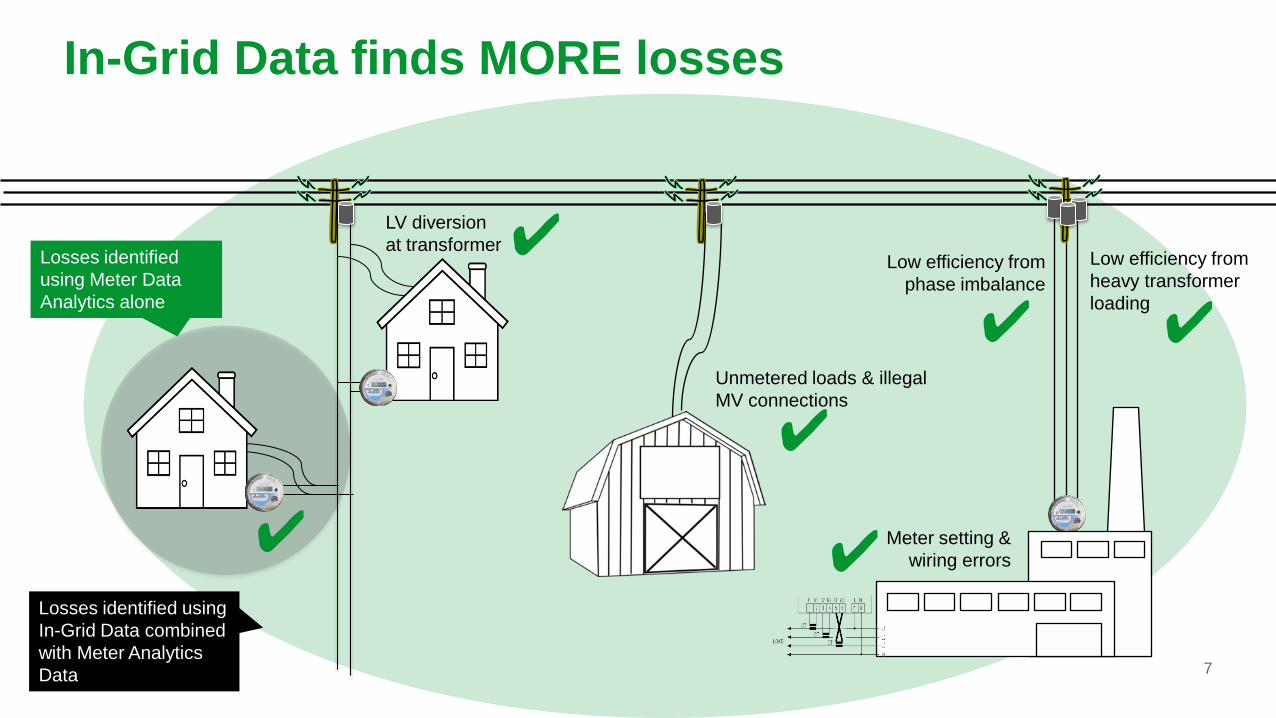
In-Grid Data finds MORE losses
Losses identified using Meter Data Analytics alone
LV diversion at transformer
Unmetered loads & illegal MV connections
Low efficiency from phase imbalance
Low efficiency from heavy transformer loading
Losses identified using In-Grid Data combined with Meter Analytics Data
Meter setting & wiring errors
✔
✔
✔✔
✔✔
8
The Challenges
Many distribution companies struggle to:• recover their investment in
smart metering• interpret the meaning of the
trends and alerts generated from analyzing big data
• relate the customer and consumption data to the grid operating condition
• determine the Next Best Action to reduce losses In many cases smart meter investments are motivated by a
desire to reduce grid losses
Tota
l Lo
sses
Start recovering losses sooner
Rec
over
mor
e lo
sses
20152014 20172016 20192018 20212020 20232022Lo
sses
9
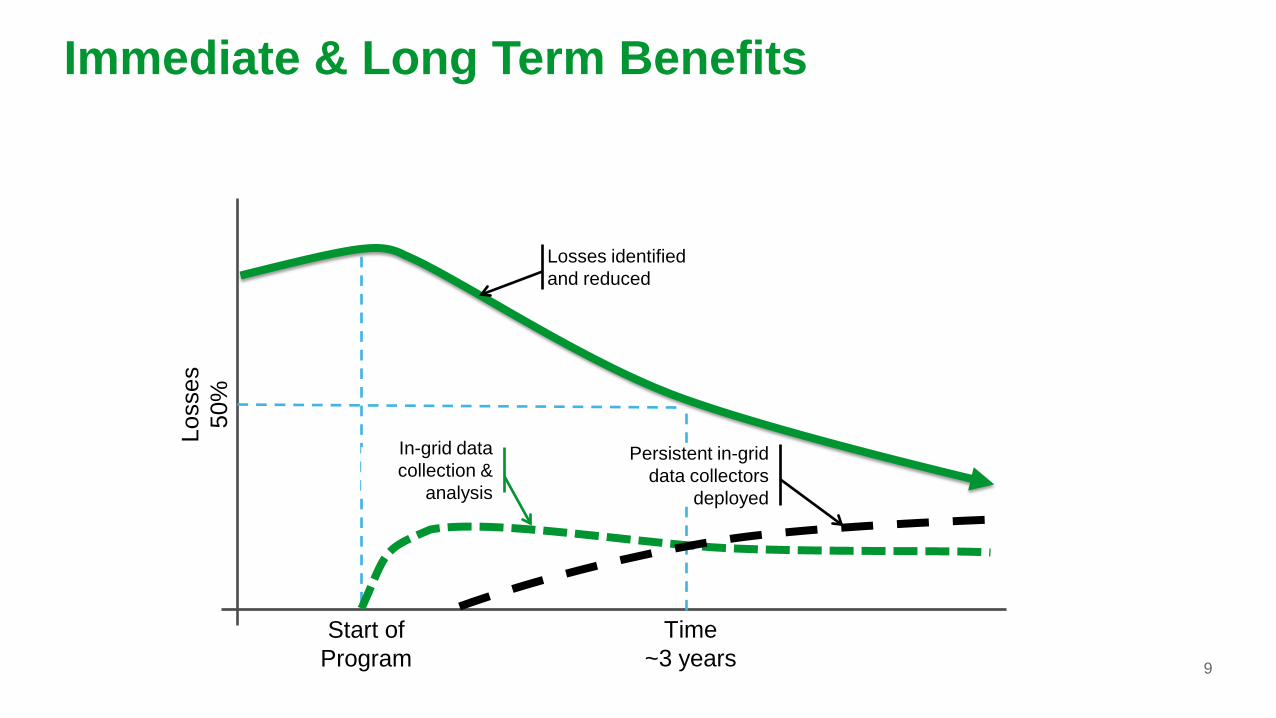
Immediate & Long Term Benefits
Loss
es50
%
Time~3 years
Start of Program
In-grid data collection &
analysis
Losses identified and reduced
Persistent in-grid data collectors
deployed
1010
But where to start looking?
With the TGI platform, Schneider Electric helps distribution utilities determine the highest risk segments of the grid – and the best places to start investigating.
Presenter
Presentation Notes
This presentation is about energy efficiency in electric distribution networks. After reviewing the various kinds of losses and the regulatory environment pressure for energy efficiency, with the example of Europe, I'll be presenting 5 practical strategies to tackle energy losses in electrical distribution networks; strategies that allow distribution network operators to comply with the new regulatory constraints and that at the same time can save cost.
11
Revenue Protection Manager
Investigations Manager and
Analyst
Field Investigator
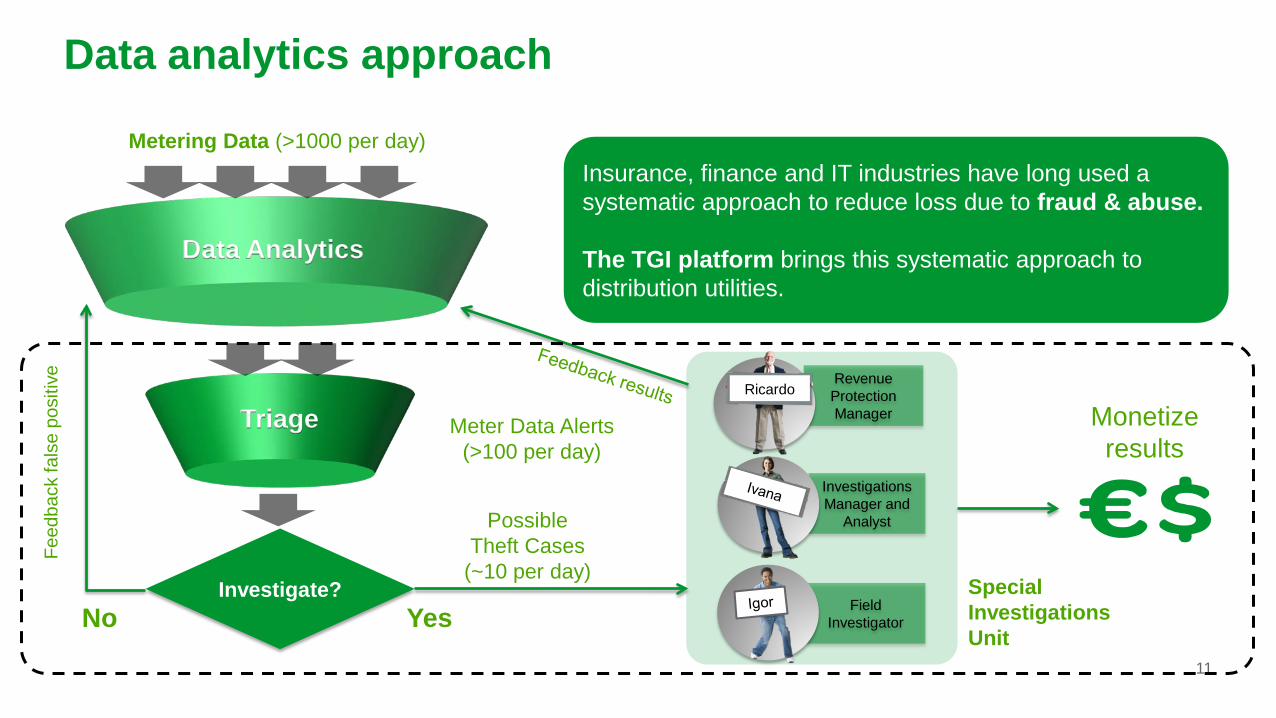
Data analytics approach
PossibleTheft Cases
(~10 per day)
Monetize results
Special InvestigationsUnit
Investigate?No Yes
Data Analytics
Triage Meter Data Alerts (>100 per day)
Feed
back
fals
e po
sitiv
e
Metering Data (>1000 per day)Insurance, finance and IT industries have long used a systematic approach to reduce loss due to fraud & abuse.
The TGI platform brings this systematic approach to distribution utilities.
Ricardo
12
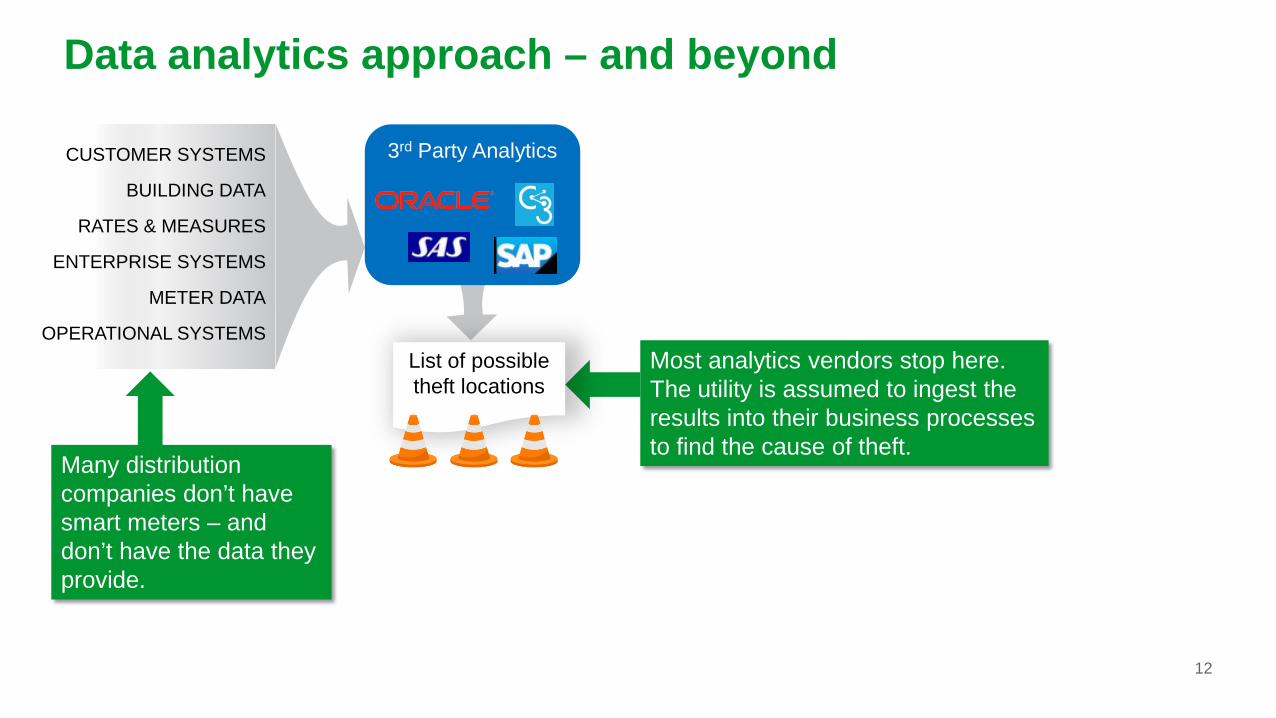
Data analytics approach – and beyond
Most analytics vendors stop here. The utility is assumed to ingest the results into their business processes to find the cause of theft.
CUSTOMER SYSTEMS
BUILDING DATA
RATES & MEASURES
ENTERPRISE SYSTEMS
METER DATA
OPERATIONAL SYSTEMSList of possible theft locations
3rd Party Analytics
Many distribution companies don’t have smart meters – and don’t have the data they provide.
13
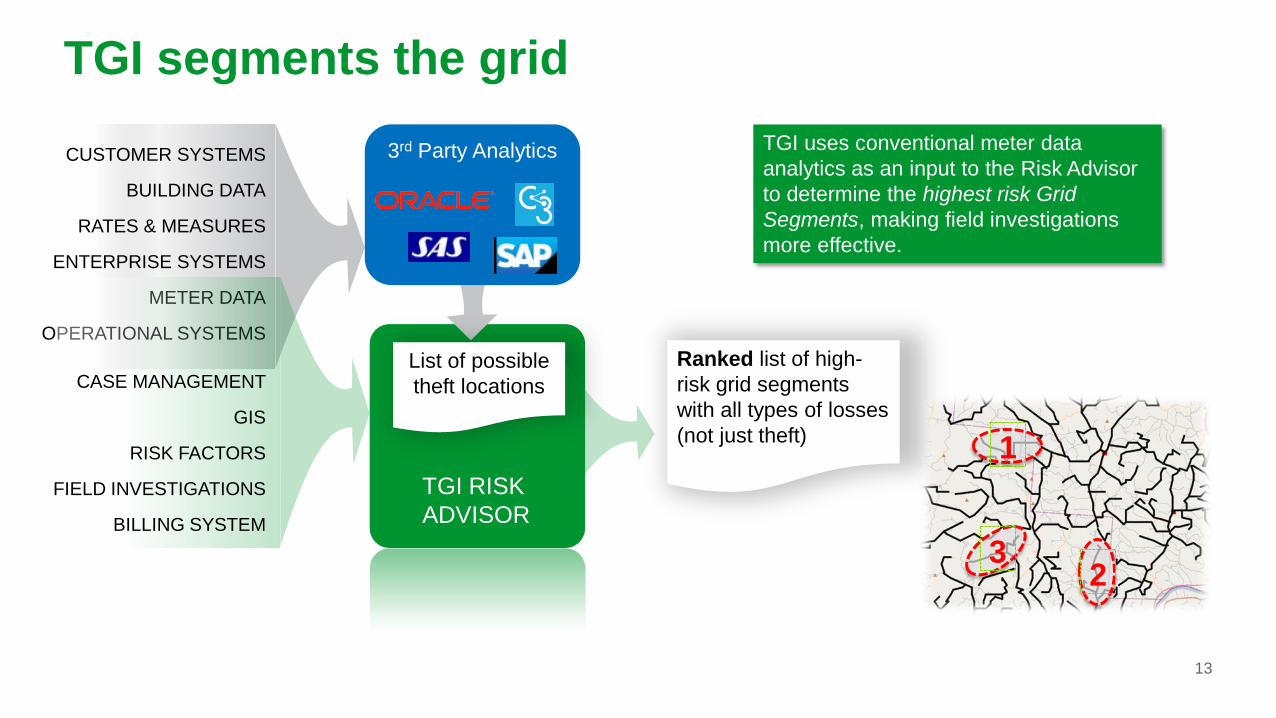
TGI segments the grid
List of possible theft locations
TGI uses conventional meter data analytics as an input to the Risk Advisor to determine the highest risk Grid Segments, making field investigations more effective.
TGI RISKADVISOR
Ranked list of high-risk grid segments with all types of losses (not just theft)
CUSTOMER SYSTEMS
BUILDING DATA
RATES & MEASURES
ENTERPRISE SYSTEMS
METER DATA
OPERATIONAL SYSTEMS
CASE MANAGEMENT
GIS
RISK FACTORS
FIELD INVESTIGATIONS
BILLING SYSTEM
1
23
3rd Party Analytics
14
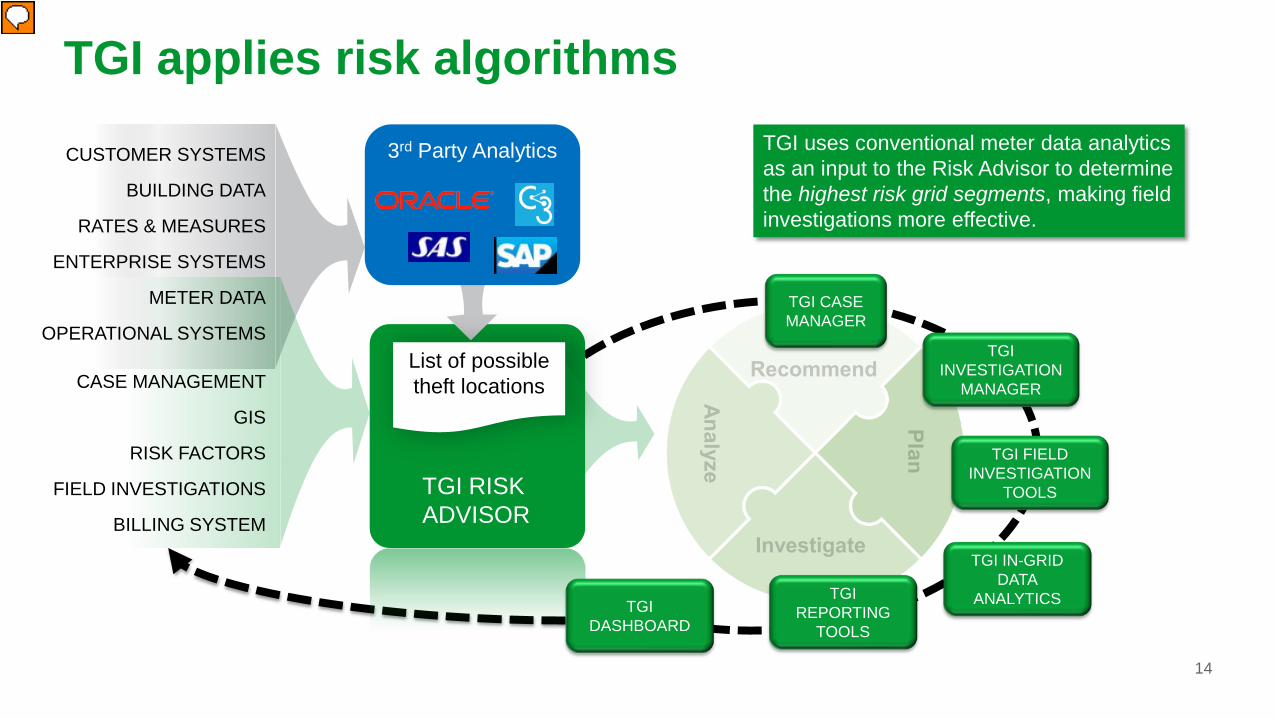
TGI applies risk algorithms
List of possible theft locations
TGI uses conventional meter data analytics as an input to the Risk Advisor to determine the highest risk grid segments, making field investigations more effective.
TGI RISKADVISOR
CUSTOMER SYSTEMS
BUILDING DATA
RATES & MEASURES
ENTERPRISE SYSTEMS
METER DATA
OPERATIONAL SYSTEMS
CASE MANAGEMENT
GIS
RISK FACTORS
FIELD INVESTIGATIONS
BILLING SYSTEM
TGI CASE MANAGER
TGI REPORTING
TOOLS
TGI INVESTIGATION
MANAGER
TGI FIELD INVESTIGATION
TOOLS
TGI DASHBOARD
TGI IN-GRID DATA
ANALYTICS
3rd Party Analytics
Presenter
Presentation Notes
TGI then identifies the highest risk grid segments that need permanent in-grid data collectors (sensors) to eliminate any chance of resurgence of losses. For utilities that have not deployed smart meters, TGI compares in-grid data to billing data.
17
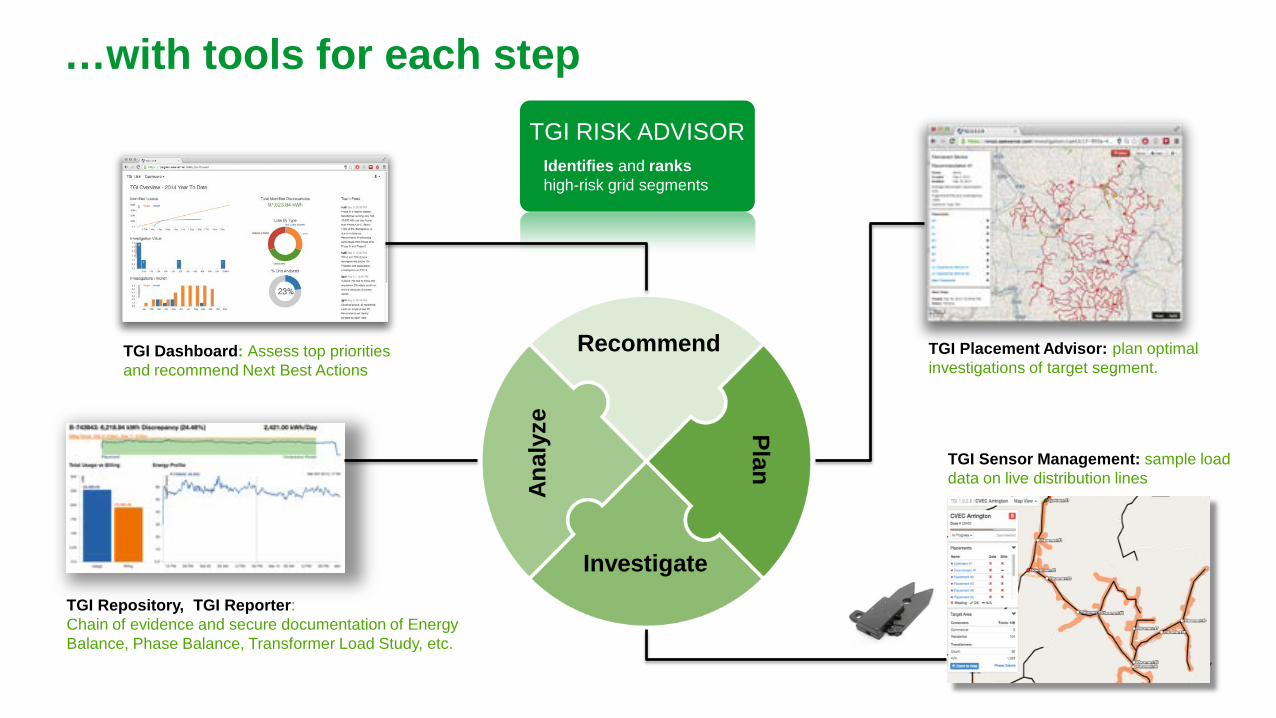
TGI RISK ADVISORIdentifies and rankshigh-risk grid segments
TGI Dashboard: Assess top priorities and recommend Next Best Actions
TGI Placement Advisor: plan optimal investigations of target segment.
TGI Repository, TGI Reporter:Chain of evidence and secure documentation of Energy Balance, Phase Balance, Transformer Load Study, etc.
…with tools for each step
Recommend
Plan
InvestigateAn
alyz
e
TGI Sensor Management: sample load data on live distribution lines
18
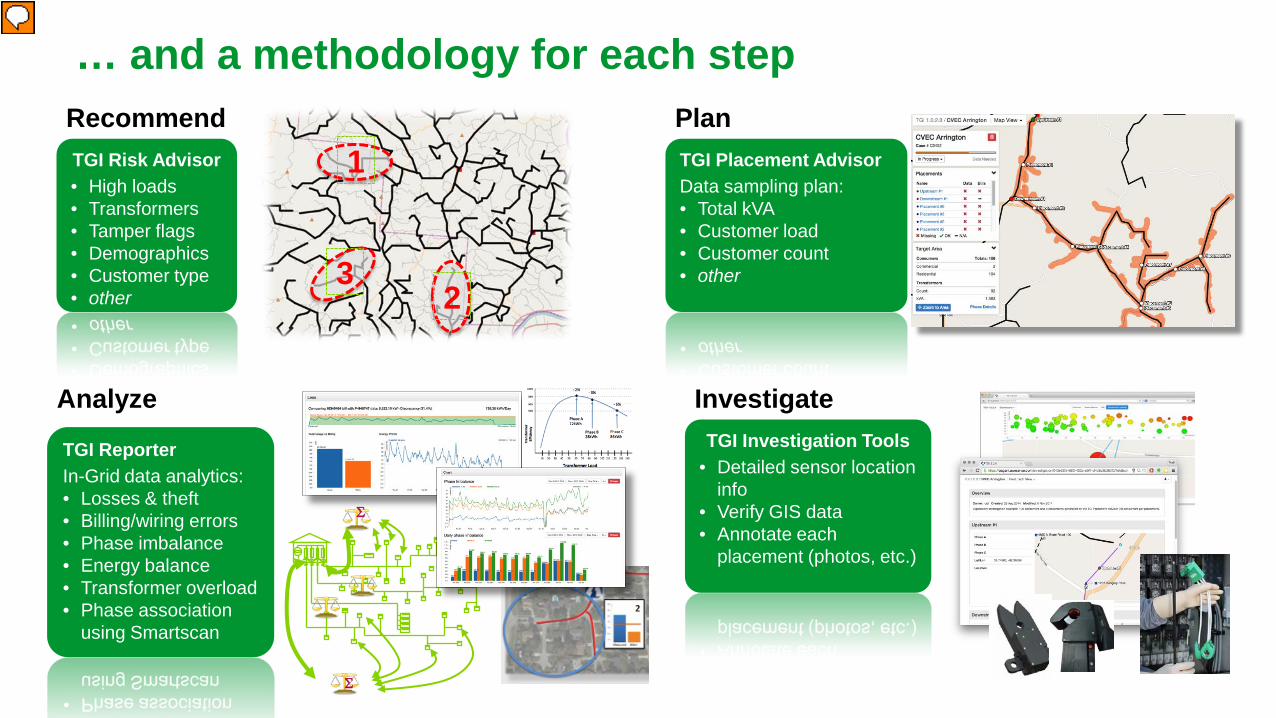
… and a methodology for each stepRecommendTGI Risk Advisor• High loads• Transformers• Tamper flags• Demographics• Customer type• other
1
23
PlanTGI Placement AdvisorData sampling plan:• Total kVA• Customer load• Customer count• other
InvestigateTGI Investigation Tools
• Detailed sensor location info
• Verify GIS data• Annotate each
placement (photos, etc.)
TGI ReporterIn-Grid data analytics:• Losses & theft• Billing/wiring errors• Phase imbalance• Energy balance• Transformer overload• Phase association
using Smartscan
Σ
Σ
Analyze
Presenter
Presentation Notes
Energy balance can been done against meter data (for those with smart meter) Schneider Electric’s TGI-ready Smartscan software app can determine the phase association of LV networks.
1919
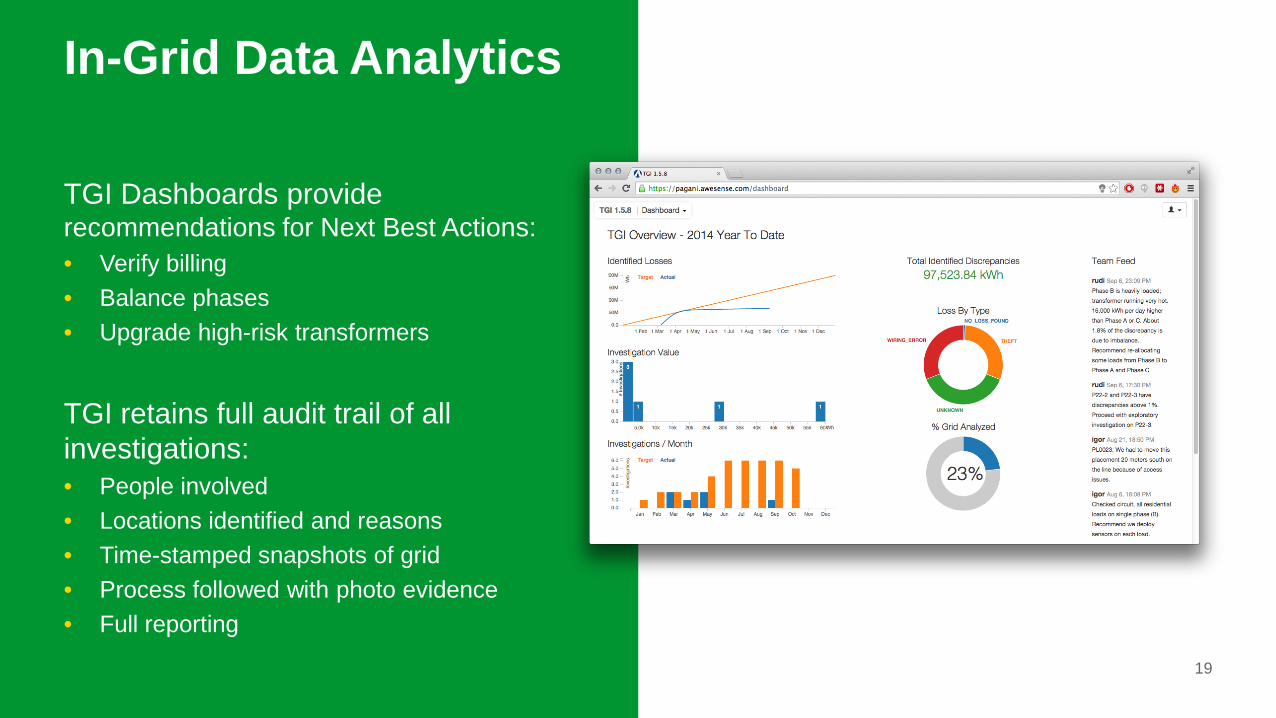
In-Grid Data Analytics
TGI Dashboards provide recommendations for Next Best Actions:• Verify billing• Balance phases• Upgrade high-risk transformers
TGI retains full audit trail of all investigations:• People involved• Locations identified and reasons• Time-stamped snapshots of grid• Process followed with photo evidence• Full reporting
20
Does NTL´s analysis require a Big Data Architecture?
a - Yes, alwaysb - Not at allc - Most of the timesd - It depends of data volumes to be
managed
21
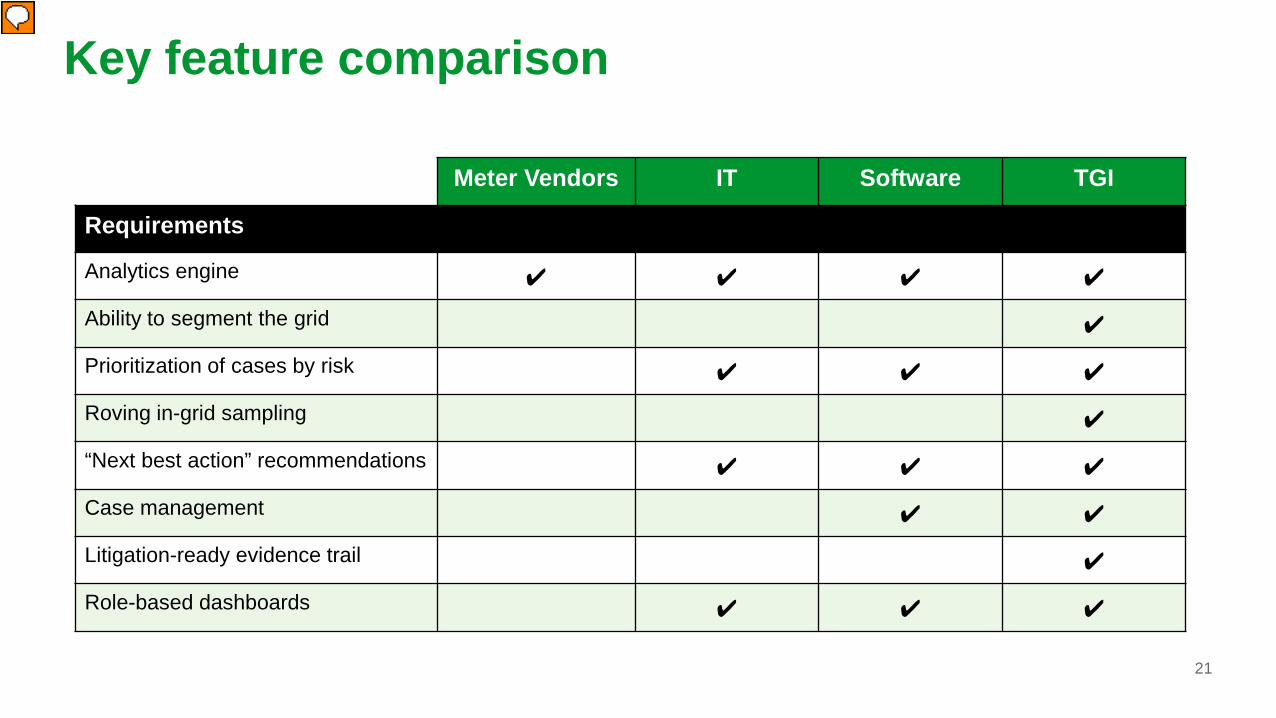
Key feature comparison
Meter Vendors IT Software TGI
Requirements
Analytics engine ✔ ✔ ✔ ✔
Ability to segment the grid ✔
Prioritization of cases by risk ✔ ✔ ✔
Roving in-grid sampling ✔
“Next best action” recommendations ✔ ✔ ✔
Case management ✔ ✔
Litigation-ready evidence trail ✔
Role-based dashboards ✔ ✔ ✔
Presenter
Presentation Notes
The simplest way actually is to implement a smartmeter infrastructure, to get the database and analyse th database. By detection of unnormal patterns we can find some losses. Then, IT companies and specialized software companies have built a set of tools that go a step further. With TGI, we add a great component to the equation: the knowledge of the grid, of the MV/LV substations and the documentation. So that we go broader and deeper in the analysis and we can provide utilities with a trail of document that show evidence of non technical losses and facilitate the revovery process, up to legal actions if necessary…
22
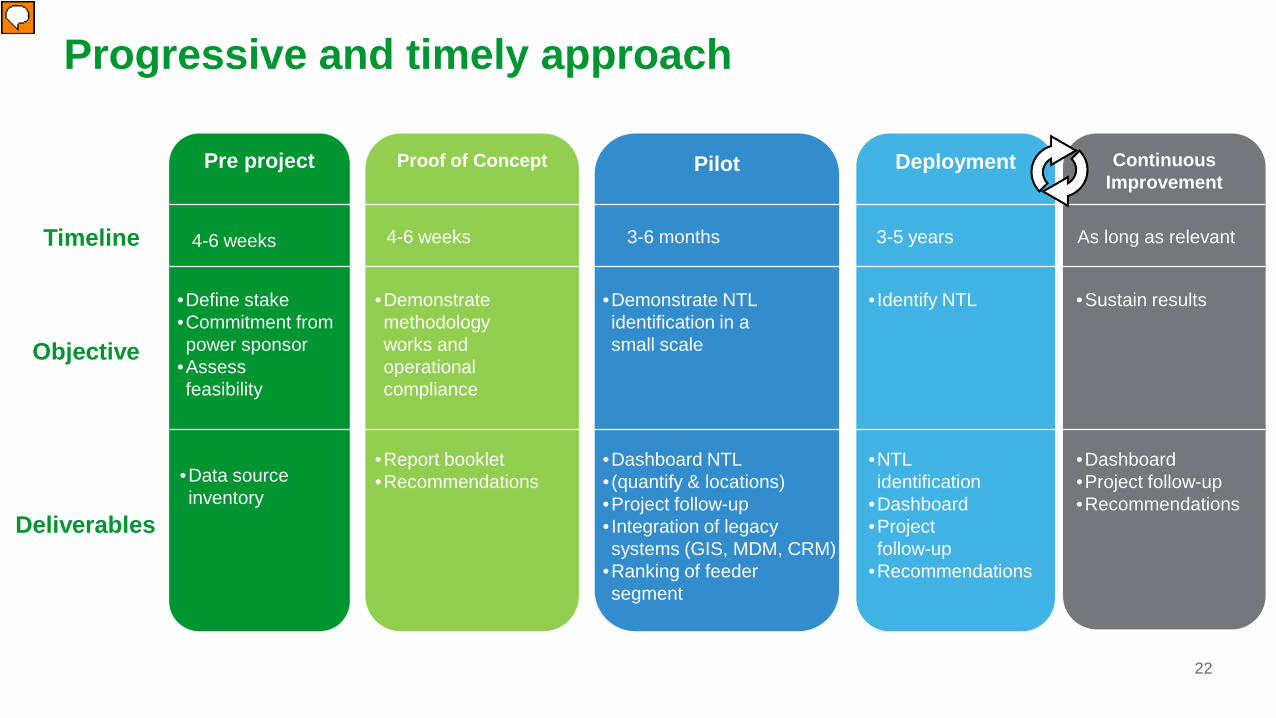
Progressive and timely approach
Pre project Proof of Concept Pilot Deployment Continuous Improvement
•Define stake•Commitment from power sponsor
•Assessfeasibility
4-6 weeks 3-6 months 3-5 years As long as relevant
•Demonstrate methodology works and operational compliance
The approach is in several steps. First is to understand what is at stake. What are the overall level of losses, what is the level of commitment at the executive level and to show on paper how we can help. Then we propose a proof of concept phase where we show how it works, what is the process and what would be the deployment process. It is then time to demonstrate through a pilot our ability to identify losses. �Finally we can deploy full scale in the utility territory. Afterwards, it is possible to continue some surveillance of critical areas to maintain the results overtime. All along the process we provide integration with the actual tools of the utilities like GIS, MDM… and dashboard to monitor the process, show achieved results and progresses to the different stakeholders. This dashboard can be customized to address the key questions of the utility.
2323
Conclusion
As the global specialist in EnergyManagement™, Schneider Electric helpsElectric Distribution Utilities to identify,measure and locate Non TechnicalLosses:
• Minimize the losses• Improving grid operations• Improve grid efficiency
Presenter
Presentation Notes
To conclude our presentation, I’d now like to sum up … We have seen distribution losses is a big problem. Regulation pushes more and more DSO and retailers to address and reduce the issue. Many distribution networks are poorly or partially instrumented. It is clear that smartmeters implementation will contribute to reduce non technical losses but it is not sufficient. This is why more accurate and highly networked sensors, and management systems will be required to achieve important savings. The end results is lost revenue is recovered and the grid efficiency improves. Thank you for attention