20
Using Guard Bands to Accommodate Uncertainty in the Spark AES Analysis of Aluminum or Aluminum Alloys When Determining Compliance with Specified Composition Limits

Using Guard Bands to Accommodate Uncertainty
in the Spark AES Analysis of Aluminum or
Aluminum Alloys When Determining Compliance
with Specified Composition Limits

Acknowledgement__________________________
The Aluminum Association gratefully acknowledges the efforts of the task group of the
Technical Committee on Product Standards in developing this report
Thomas Belliveau, Novelis
Denis Choquette, Rio Tinto
Olivier Gabis, Wagstaff
Michael Ruschak, Alcoa
John Sieber, NIST
Albert Wills, Sapa
Rebecca Wyss, Alcoa
Use of this Information______________________
Any data and information contained in this paper were compiled and/ or developed by The Aluminum
Association, Inc. In the view of the variety of conditions and methods of use to which such data and
information may be applied, The Aluminum Association and its member companies assume no
responsibility or liability for the use of information contained herein. Neither The Aluminum Association
nor any of its member companies give warranties, express or implied, with respect to this information.
© Copyright 2016, The Aluminum Association, Inc.

Table of Contents__________________________
Summary…………………………………………………………………………………………………………………………………...4
Scope…………………………………………………………………………………………………………………………………………4
References…………………………………………………………………………………………………………………………………5
Terms…………………………………………………………………………………………………………………………………………6
Introduction……………………………………………………………………………………………………………………………….7
Discussion of Guard Bands……………………………………………………………………………………..………………….8
Guard Band Examples…………………………………………………………………………………………………………..….12
Sampling and Sample Errors…………………………………………………………………………………………………….17
Conclusions………………………………………………………………………………………………………………………………18
Appendix A………………………………………………………………………………………………………………………………19

Page 4 of 20
Summary_________________________________
Every pound of aluminum or aluminum alloys cast and sold is certified to meet The Aluminum
Association Inc. registered limits or other specified composition limits. Certification of
aluminum and aluminum alloys to specified composition limits is typically done using Spark-
Atomic Emission Spectrometry (Spark-AES) following the procedures in ASTM International
(ASTM) E716 Standard Practices for Sampling and Sample Preparation of Aluminum and
Aluminum Alloys for Determination of Chemical Composition by Spectrochemical Analysis and
ASTM E1251 Standard Test Method for Analysis of Aluminum and Aluminum Alloys by
Spark-AES. Spark-AES Laboratories at major aluminum production facilities normally have
excellent analytical practices and follow strict quality control protocols to provide the best
results possible. However, every measurement has an associated uncertainty and the
measurement of composition using Spark-AES is no exception to the rule.
This paper provides a brief discussion of:
1. The uncertainty inherent in the elemental analysis of aluminum and aluminum alloys by
Spark-AES.
2. The benefits of using guard bands to set internal operating limits, which are offset from
specified composition limits.
3. A model of the risk for sale of out-of-specification product based on the analysis
uncertainty relative to the specified composition limits.
4. The main sources of uncertainty of Spark-AES and their potential causes.
Scope____________________________________
The scope of this paper is limited to results obtained by a single lab on cast metal samples taken
in accordance with ASTM E716 and analyzed in accordance with ASTM E1251. Analysis by more
than one lab may add uncertainty to the measurement process and is not within the scope of
this paper.

Page 5 of 20
References________________________________
1. ASTM E716 - Standard Practices for Sampling and Sample Preparation of Aluminum and
Aluminum Alloys for Determination of Chemical Composition by Spectrochemical
Analysis.
2. ASTM E 1251 - Standard Test Method for Analysis of Aluminum and Aluminum Alloys by
Spark-AES.
3. ISO 3534-1:1993. “Statistics - Vocabulary and symbols - Part 1: Probability and general
statistical terms”.
4. EURACHEM/CITAC Guide: Use of Uncertainty Information in Compliance
Assessment, First edition 2007, Editors S L R Ellison (LGC, UK), A Williams (UK)
5. ISO/IEC Guide 99- International Vocabulary of Metrology—Basic and General Concepts
and Associated Terms (VIM)
6. International Alloy Designations and Chemical Composition Limits for Wrought
Aluminum and Wrought Aluminum Alloys (Teal Sheets)
7. Designations and Chemical Composition Limits for Aluminum Alloys in the Form of
Castings and Ingot (Pink Sheets)
8. International Designations and Chemical Composition Limits for Unalloyed Aluminum
(Gold Sheets)
9. ANSI H35.1/H35.1M American National Standard Alloy and Temper Designation Systems
for Aluminum
Page 6 of 20
Terms____________________________________
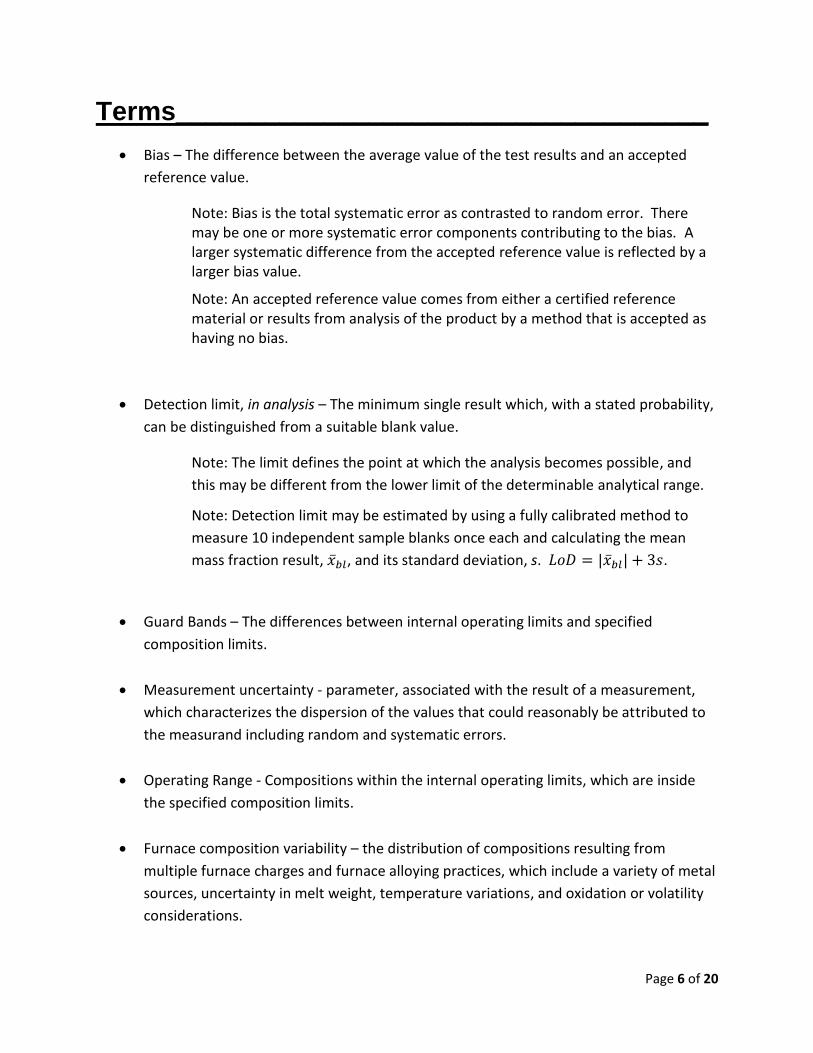
Bias – The difference between the average value of the test results and an accepted
reference value.
Note: Bias is the total systematic error as contrasted to random error. There may be one or more systematic error components contributing to the bias. A larger systematic difference from the accepted reference value is reflected by a larger bias value.
Note: An accepted reference value comes from either a certified reference material or results from analysis of the product by a method that is accepted as having no bias.
Detection limit, in analysis – The minimum single result which, with a stated probability,
can be distinguished from a suitable blank value.
Note: The limit defines the point at which the analysis becomes possible, and
this may be different from the lower limit of the determinable analytical range.
Note: Detection limit may be estimated by using a fully calibrated method to
measure 10 independent sample blanks once each and calculating the mean
mass fraction result, �̅�𝑏𝑙, and its standard deviation, s. 𝐿𝑜𝐷 = |�̅�𝑏𝑙| + 3𝑠.
Guard Bands – The differences between internal operating limits and specified
composition limits.
Measurement uncertainty - parameter, associated with the result of a measurement,
which characterizes the dispersion of the values that could reasonably be attributed to
the measurand including random and systematic errors.
Operating Range - Compositions within the internal operating limits, which are inside
the specified composition limits.
Furnace composition variability – the distribution of compositions resulting from
multiple furnace charges and furnace alloying practices, which include a variety of metal
sources, uncertainty in melt weight, temperature variations, and oxidation or volatility
considerations.

Page 7 of 20
Introduction_______________________________
Producers of aluminum or aluminum alloys typically measure composition on 100 % of their
cast products by taking samples from the molten metal, in accordance with ASTM E716, and
analyzing the samples using Spark Atomic Emission Spectrometry (Spark-AES) according to
ASTM E1251. The goal is always to provide accurate quantitative results, but uncertainty occurs
in all Spark-AES measurements, even when using properly calibrated instruments and the best
possible sampling, sample preparation and analysis procedures. The inherent uncertainty of
the analysis should be considered when establishing and determining compliance with specified
composition limits. Under the best of circumstances, two analyses on the same sample will not
likely produce the same results, even when using the same instrument. This uncertainty in
measuring composition may cause the following problems when the analysis result is close to a
specification limit:
1) a false negative outcome, (i.e. a measured composition that is outside the
specification limit when the actual composition meets the specification) or
2) a false positive outcome (i.e. a measured composition that meets the specification
limit when the actual composition is outside the specification).
When the uncertainty interval of a Spark AES measured result overlaps a specified composition
limit, the likelihood for a false positive or a false negative outcome increases, as illustrated in
Figures 1 and 2.
The blue curves in Figures 1 and 2 represent the expected frequency distribution of measured
Spark AES results, assumed to be normal or Gaussian shaped, around an actual (true)
value. Figure 1 illustrates the possibility that a measured result of a sample, having an actual
composition above the specified minimum composition limit, is below the specified minimum
composition limit due to the inherent uncertainty of the analysis. This illustrates the case of a
false negative outcome. Conversely, Figure 2 shows the case of a false positive outcome where
a measured result of a sample is above the specified minimum composition limit, but the actual
composition is below the specified minimum composition limit.

Page 8 of 20
Figure 1. False Negative Outcome
Figure 2. False Positive Outcome
Discussion of Guard Bands__________________
An effective way to accommodate measurement uncertainty is through the use of internal
operating limits tighter than the specified composition limits as shown in Figure 3. Assuming
that the furnace composition variability follows a normal distribution centered on the nominal
composition of a given alloy specification, the figure shows how the knowledge of
measurement uncertainty can be used to select internal operating limits that protect against
occurrences of false negative or false positive outcomes. The differences between internal
operating limits and specified composition limits are sometimes referred to as guard bands.
According to Figure 3, product having an analysis result between the internal operating limits
would be expected to comply with the specified limits. However, product having an analysis
value between the internal limits and the specified composition limits may or may not meet the
specified composition limits due to the measurement uncertainty. When establishing practices
to ensure compliance with specified composition limits, producers should consider the use of
guard bands based on the Spark-AES test method uncertainty.
Fre
qu
en
cy
Mass Fraction of Element
Fre
qu
en
cy
Mass Fraction of Element

Page 9 of 20
Operating
RangeMaximum
Specified
Composition
Limit
Minimum
Specified
Composition
Limit
Maximum
Operating
Limit
Minimum
Operating
Limit
Measurement
UncertaintyMeasurement
Uncertainty
Gu
ard
Ba
nd
Gu
ard
Ba
nd
Target
Composition
Furnace Composition
Variability
Figure 3 illustrates the case where the specified composition range is wide enough to
accommodate both the furnace composition variability and guard bands to account for
Spark-AES test method uncertainty. This is the best case scenario for reliably producing
product that meets specified composition limits.
Consider the case illustrated in Figure 4 where the specified composition range is wide enough
to accommodate guard bands but not wide enough for the operating range to be greater than
the furnace composition variability. In this case, the use of guard bands will ensure the product
composition is within specified composition limits. However, as the specified composition
range becomes tighter, it becomes more difficult and less practical to produce product that
reliably meets the specified composition limits without generating excessive internal scrap.
Based on the expected furnace composition variability, some amount of product with
composition between the specified composition limit and operating limit will be scrapped,
which may impact the cost and on-time delivery of the product.

Page 10 of 20
Operating
RangeMaximum
Specified
Composition
Limit
Minimum
Specified
Composition
Limit
Maximum
Operating
Limit
Minimum
Operating
Limit
Measurement
UncertaintyMeasurement
Uncertainty
Gu
ard
Ba
nd
Gu
ard
Ba
nd
Target
Composition
Furnace Composition
Variability
Figure 4 illustrates the effect of a narrow specified composition range relative to the operating range
and the furnace composition variability.
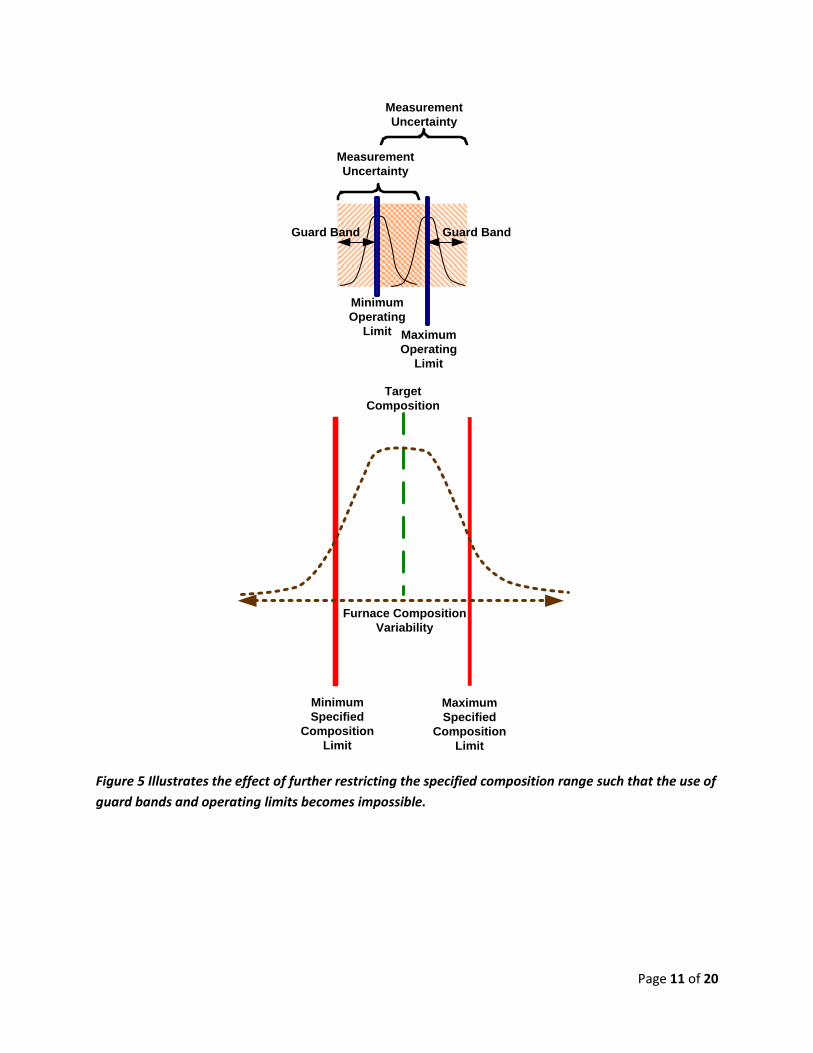
In the worst case scenario as illustrated in Figure 5, the specified composition range becomes
so narrow that the measurement uncertainty for results close to the operating limits defined by
guard bands may overlap, and the furnace composition variability exceeds the specified
composition limits. In this case, the use of guard bands and operating limits to account for
Spark AES test method uncertainty is impossible, which increases the probability of shipping
product that is outside the specified composition limits. This scenario also results in the
production of internal scrap and its attendant impact on cost and delivery.
Page 11 of 20
Maximum
Specified
Composition
Limit
Minimum
Specified
Composition
Limit
Target
Composition
Furnace Composition
Variability
Measurement
Uncertainty
Measurement
Uncertainty
Maximum
Operating
Limit
Minimum
Operating
Limit
Guard Band Guard Band
Figure 5 Illustrates the effect of further restricting the specified composition range such that the use of
guard bands and operating limits becomes impossible.

Page 12 of 20
Guard Band Examples______________________
Only a detailed analysis of the various sources of uncertainty can provide an accurate estimate
of their magnitudes. The magnitude of the uncertainty may vary with concentration and
element as shown by the precision and bias data given in Table 3 of ASTM E1251. Modern
instruments often have a short term variation (spark to spark) better than 0.5% relative on
good quality certified reference materials (CRM) and 1% relative on homogeneous production
samples. Repeatability between sparks on reference materials and samples is only one part of
the overall uncertainty of the final composition result. Sampling, sample preparation,
certification uncertainty on CRM, drift correction method, type standardization, and instrument
drift add to the total uncertainty of the result. Considering the sources of uncertainty, it is
likely that even the best labs have an overall uncertainty of about ± 3% relative, which is used in
the following examples. This uncertainty may be somewhat higher close to the detection limit
or in certain specific alloys (e.g. hypereutectic alloys). The uncertainty of 3% chosen for the
examples is not intended to represent the uncertainties for all laboratories. In some instances
it may be possible for individual laboratories to operate at a lower level of uncertainty.
Example 1 – Alloy with specified composition limits wide enough for effective use of guard
bands
Consider an alloy having specified composition limits of 4.0 % to 5.0 % with a mid-point
composition of 4.5 %. It is expected that the Spark-AES uncertainty from repeated analysis of
the control material and sampling effects is as much as 3 % relative. Calculations based on 3 %
uncertainty result in guard bands of 0.135 % (i.e. 0.03 * 4.5 %) and internal operating limits of
4.135 % (i.e. 4.0 % + 0.135 %) and 4.865 % (i.e. 5.0 % - 0.135 %). These limits define the
operating range and would protect against false negative and false positive results, ensuring
that the product complies with the specified composition limits.
The operating range with these internal operating limits is ± 8 % relative around the mid-point
composition of 4.5 % (i.e. ± (100 * (4.865 - 4.135) / 4.5) / 2), which is a large enough window for
the combination of furnace composition variability and analysis uncertainty. In this case, the
use of guard bands is possible.
Example 2 – Alloy with specified composition limits too narrow for effective use of guard
bands
Consider an alloy having more narrow specified composition limits of 4.2 % to 4.8 % with a
mid-point composition of 4.5 %. Again, calculations based on 3 % relative uncertainty yield
guard bands of 0.135 % (i.e. 0.03 * 4.5 %) and internal operating limits of 4.335 % (i.e. 4.2 % +
0.135 %) and 4.665 % (i.e. 4.8 % - 0.135 %). These limits define the operating range and would
Page 13 of 20
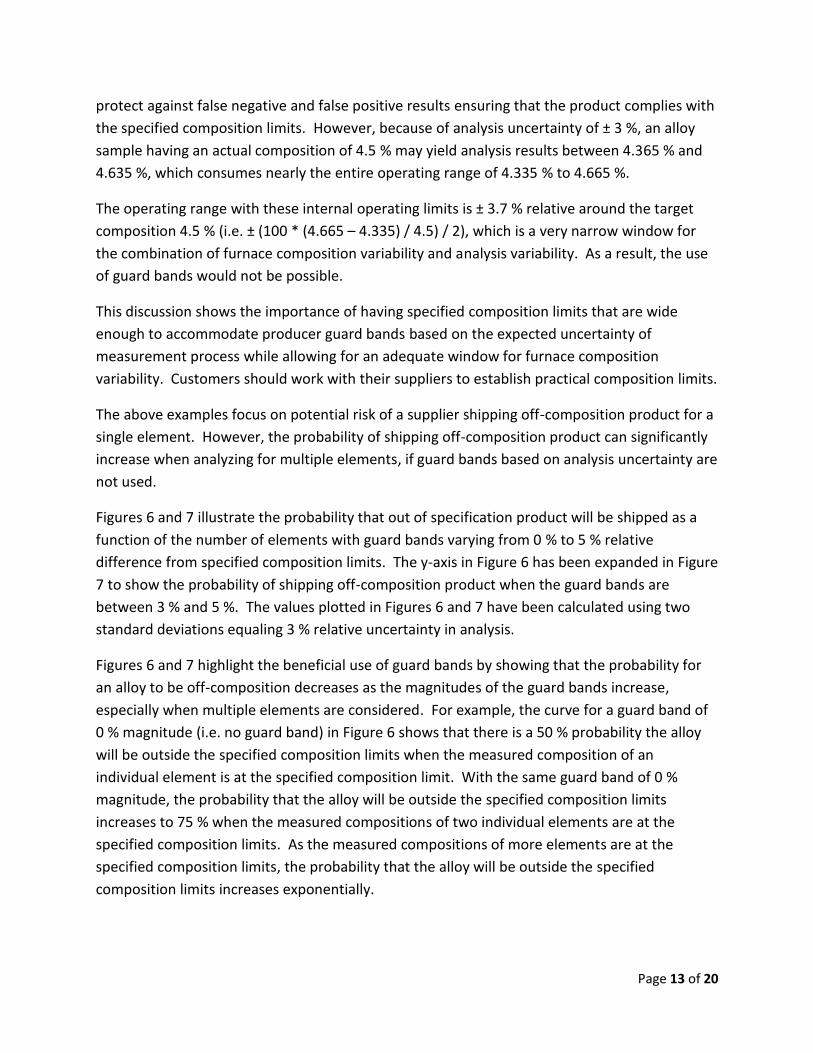
protect against false negative and false positive results ensuring that the product complies with
the specified composition limits. However, because of analysis uncertainty of ± 3 %, an alloy
sample having an actual composition of 4.5 % may yield analysis results between 4.365 % and
4.635 %, which consumes nearly the entire operating range of 4.335 % to 4.665 %.
The operating range with these internal operating limits is ± 3.7 % relative around the target
composition 4.5 % (i.e. ± (100 * (4.665 – 4.335) / 4.5) / 2), which is a very narrow window for
the combination of furnace composition variability and analysis variability. As a result, the use
of guard bands would not be possible.
This discussion shows the importance of having specified composition limits that are wide
enough to accommodate producer guard bands based on the expected uncertainty of
measurement process while allowing for an adequate window for furnace composition
variability. Customers should work with their suppliers to establish practical composition limits.
The above examples focus on potential risk of a supplier shipping off-composition product for a
single element. However, the probability of shipping off-composition product can significantly
increase when analyzing for multiple elements, if guard bands based on analysis uncertainty are
not used.
Figures 6 and 7 illustrate the probability that out of specification product will be shipped as a
function of the number of elements with guard bands varying from 0 % to 5 % relative
difference from specified composition limits. The y-axis in Figure 6 has been expanded in Figure
7 to show the probability of shipping off-composition product when the guard bands are
between 3 % and 5 %. The values plotted in Figures 6 and 7 have been calculated using two
standard deviations equaling 3 % relative uncertainty in analysis.
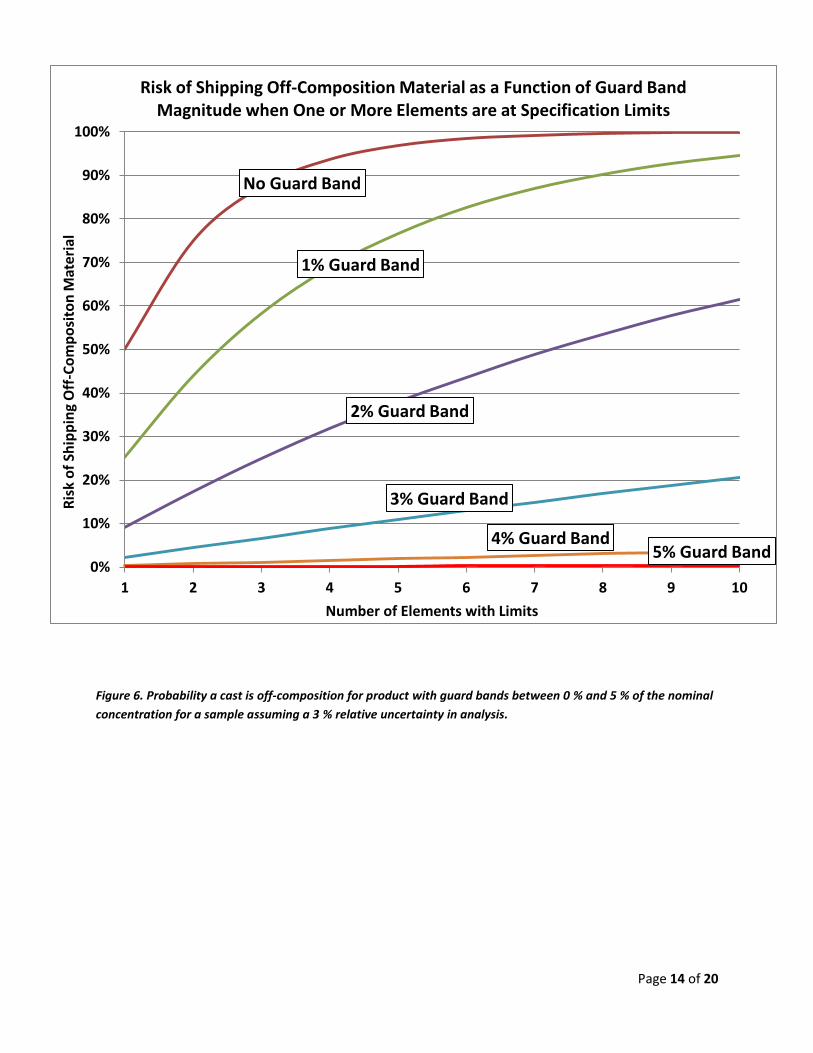
Figures 6 and 7 highlight the beneficial use of guard bands by showing that the probability for
an alloy to be off-composition decreases as the magnitudes of the guard bands increase,
especially when multiple elements are considered. For example, the curve for a guard band of
0 % magnitude (i.e. no guard band) in Figure 6 shows that there is a 50 % probability the alloy
will be outside the specified composition limits when the measured composition of an
individual element is at the specified composition limit. With the same guard band of 0 %
magnitude, the probability that the alloy will be outside the specified composition limits
increases to 75 % when the measured compositions of two individual elements are at the
specified composition limits. As the measured compositions of more elements are at the
specified composition limits, the probability that the alloy will be outside the specified
composition limits increases exponentially.
Page 14 of 20
Figure 6. Probability a cast is off-composition for product with guard bands between 0 % and 5 % of the nominal
concentration for a sample assuming a 3 % relative uncertainty in analysis.
No Guard Band
1% Guard Band
2% Guard Band
3% Guard Band
4% Guard Band 5% Guard Band
0%
10%
20%
30%
40%
50%
60%
70%
80%
90%
100%
1 2 3 4 5 6 7 8 9 10
Ris
k o
f Sh
ipp
ing
Off
-Co
mp
osi
ton
Mat
eria
l
Number of Elements with Limits
Risk of Shipping Off-Composition Material as a Function of Guard Band Magnitude when One or More Elements are at Specification Limits

Page 15 of 20
Figure 7. Expanded scale - Probability a cast is off-composition for product with guard bands between 3 % and
5 % of the nominal concentration for a sample assuming a 3 % relative uncertainty in analysis.
Significant digits
Spark-AES instruments can generate composition results with many more decimal places than
are meaningful based on the uncertainty of the measurement. As a result, consideration
should be given to the numbers of significant digits both requested and reported. To comply
with ASTM E1251 (2), alloy compositions shall not be reported with more significant digits or
higher precision than that of the certified reference material(s) used to calibrate or type
standardize the spectrometer.
A good guideline regarding the certification of aluminum alloys is to report composition results
using the number of decimal places specified by The Aluminum Association registration records
3% Guard Band
4% Guard Band
5% Guard Band 0%
2%
4%
6%
8%
10%
12%
1 2 3 4 5 6 7 8 9 10
Ris
k o
f Sh
ipp
ing
Off
-Co
mp
osi
ton
Mat
eri
al
Number of Elements with Limits
Expanded View Showing Risk of Shipping Off-Composition Material as a Function of Guard Band Magnitude when One or More Elements are at
Specification Limits
Page 16 of 20
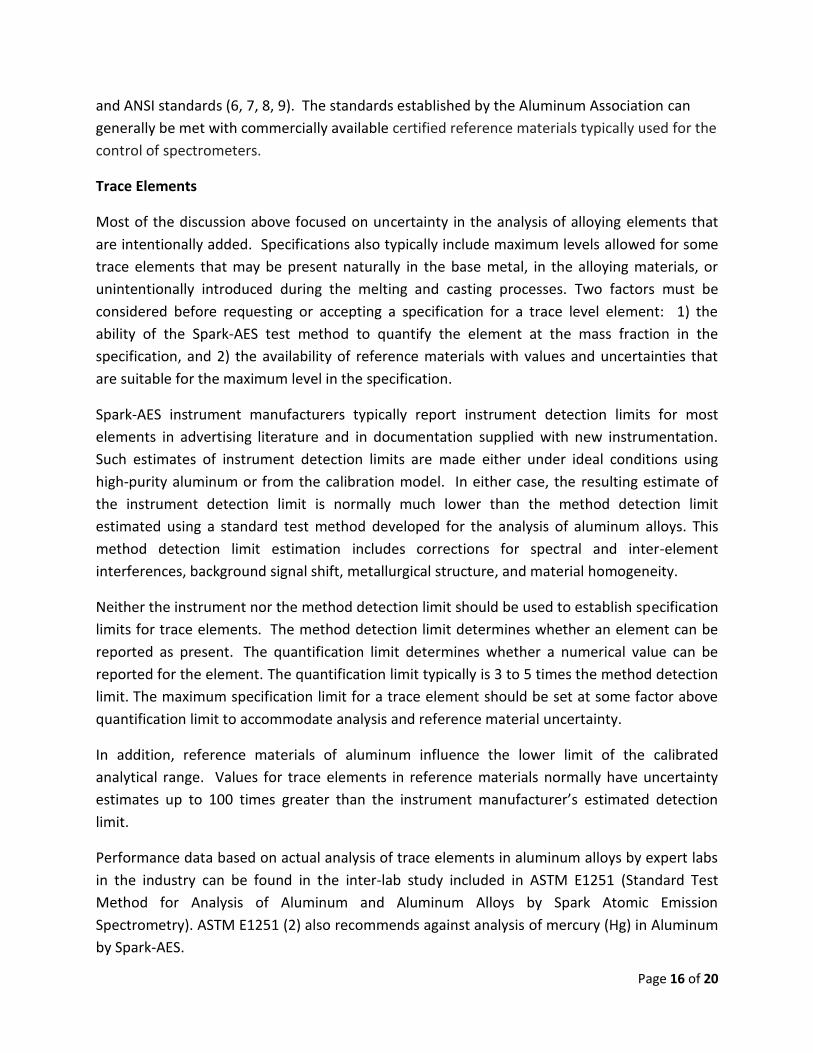
and ANSI standards (6, 7, 8, 9). The standards established by the Aluminum Association can
generally be met with commercially available certified reference materials typically used for the
control of spectrometers.
Trace Elements
Most of the discussion above focused on uncertainty in the analysis of alloying elements that
are intentionally added. Specifications also typically include maximum levels allowed for some
trace elements that may be present naturally in the base metal, in the alloying materials, or
unintentionally introduced during the melting and casting processes. Two factors must be
considered before requesting or accepting a specification for a trace level element: 1) the
ability of the Spark-AES test method to quantify the element at the mass fraction in the
specification, and 2) the availability of reference materials with values and uncertainties that
are suitable for the maximum level in the specification.
Spark-AES instrument manufacturers typically report instrument detection limits for most
elements in advertising literature and in documentation supplied with new instrumentation.
Such estimates of instrument detection limits are made either under ideal conditions using
high-purity aluminum or from the calibration model. In either case, the resulting estimate of
the instrument detection limit is normally much lower than the method detection limit
estimated using a standard test method developed for the analysis of aluminum alloys. This
method detection limit estimation includes corrections for spectral and inter-element
interferences, background signal shift, metallurgical structure, and material homogeneity.
Neither the instrument nor the method detection limit should be used to establish specification
limits for trace elements. The method detection limit determines whether an element can be
reported as present. The quantification limit determines whether a numerical value can be
reported for the element. The quantification limit typically is 3 to 5 times the method detection
limit. The maximum specification limit for a trace element should be set at some factor above
quantification limit to accommodate analysis and reference material uncertainty.
In addition, reference materials of aluminum influence the lower limit of the calibrated
analytical range. Values for trace elements in reference materials normally have uncertainty
estimates up to 100 times greater than the instrument manufacturer’s estimated detection
limit.
Performance data based on actual analysis of trace elements in aluminum alloys by expert labs
in the industry can be found in the inter-lab study included in ASTM E1251 (Standard Test
Method for Analysis of Aluminum and Aluminum Alloys by Spark Atomic Emission
Spectrometry). ASTM E1251 (2) also recommends against analysis of mercury (Hg) in Aluminum
by Spark-AES.

Page 17 of 20
The main sources of uncertainty of Spark-AES and their potential causes.
Uncertainty in elemental analysis, as in any analytical method, arises from systematic errors
that introduce a bias in the analysis and random errors arising from small variations from a
number of sources. The following discussion assumes systematic errors have been minimized
by adherence to appropriate practices as defined in ASTM methods E716 and E1251, vendor
recommended analysis practices, and the use as calibrants of reference materials composition
similar to the alloys being analyzed.
Random error appears as variability in the measurement process. The variability may be
observed in the short term as “spark-to-spark” or sample-to-sample variations, or in the longer
term, as observed in a control chart of the average analysis result on a control sample plotted
as a function of time.
Random errors in elemental analysis can be categorized according to the underlying cause of
the error. A brief discussion of sample and sampling errors along with a Table summarizing
other common sources of uncertainty follows.
Sampling and Sample Errors_________________ Sampling and sample related errors tend to dominate the overall analysis uncertainty. Typically
repeatability between sparks on a sample is 1.5 to 2 times higher than on a certified reference
material of the same alloy. Poor sampling and/or sample preparation practices can lead to
erroneous analyses and therefore wrong conclusions and/or decisions about conformance to
specification or process adjustments (furnace corrections). The uncertainty due to sampling
and sample related errors can be reduced by taking multiple samples and/or increasing the
number of sparks used to determine the average result.
Sampling errors include factors such as:
insufficient number of samples
lack of homogeneity in the metal being sampled
slow or non-continuous pouring (double pour)
more than one sample poured out of the same ladle of metal
mold not completely filled (sample and/or sprue not completely formed)
contaminated metal, sampler or ladle
improper sampler
improper care of the sampler or ladle
segregation related to the sample cooling rate and its directionality
Page 18 of 20
taking a sample with a cold mold
taking sample when metal temperature in the furnace or trough is too low for a particular alloy
allowing the metal in the ladle to cool excessively before pouring the sample
removing the sample or breaking the sprue before complete solidification
inclusions, skim or bath in the sample (observed before or after machining)
porosity, cracks, voids or pits in the sample (observed before or after machining)
rounded corners on the sample Sample preparation errors include:
incorrect or uneven depth of cut
surface too rough or too smooth relative to an ideal surface of 63 microinches RMS (1.6 micrometers) sample and standard surfaces have different surface roughness
samples not prepared properly using a milling machine or a lathe. Note: sanding or grinding may introduce contamination on the surface, tend to smear softer aluminum material over harder intermetallic particles, or eject harder intermetallic particles from the sample.
contamination from coolant (if used)
contamination from cutting tooling
contamination from sample handling
Other sources of uncertainty
Other sources of uncertainty can be attributed to the method, the instrument or the
surrounding environment and are covered in details in Appendix A.
Conclusions_______________________________
Uncertainty in measurements is unavoidable. Numerous sources of errors, including but not
limited to sampling, lab practices, and reference material uncertainty, are inherent in the
analytical process used to certify the compositions of aluminum and aluminum alloys. When
determining specified composition limits for a new product, or certifying the composition of an
existing product against specified composition limits, it is recommended that guard bands are
used to set internal operating limits to accommodate analysis uncertainty. Internal operating
limits are an essential practice for producers to ensure compliance of product within specified
composition limits.
Page 19 of 20
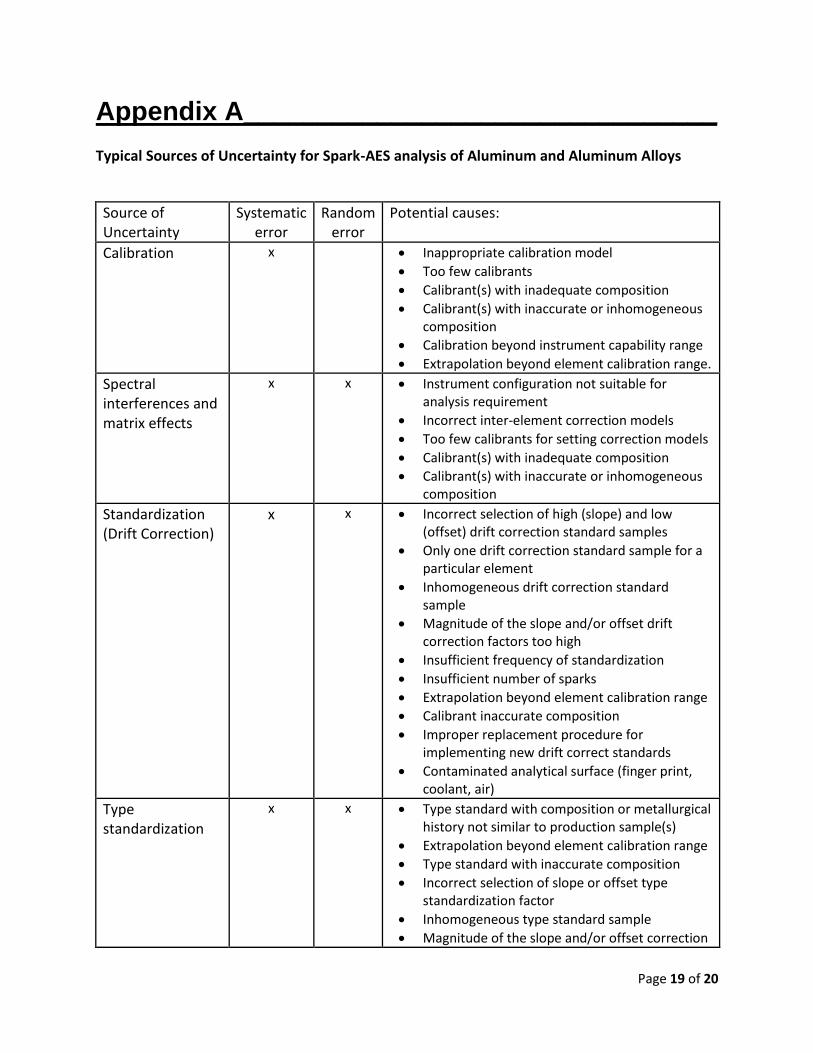
Appendix A________________________________ Typical Sources of Uncertainty for Spark-AES analysis of Aluminum and Aluminum Alloys
Source of Uncertainty
Systematic error
Random error
Potential causes:
Calibration x Inappropriate calibration model
Too few calibrants
Calibrant(s) with inadequate composition
Calibrant(s) with inaccurate or inhomogeneous composition
Calibration beyond instrument capability range
Extrapolation beyond element calibration range.
Spectral interferences and matrix effects
x x Instrument configuration not suitable for analysis requirement
Incorrect inter-element correction models
Too few calibrants for setting correction models
Calibrant(s) with inadequate composition
Calibrant(s) with inaccurate or inhomogeneous composition
Standardization (Drift Correction)
x x Incorrect selection of high (slope) and low (offset) drift correction standard samples
Only one drift correction standard sample for a particular element
Inhomogeneous drift correction standard sample
Magnitude of the slope and/or offset drift correction factors too high
Insufficient frequency of standardization
Insufficient number of sparks
Extrapolation beyond element calibration range
Calibrant inaccurate composition
Improper replacement procedure for implementing new drift correct standards
Contaminated analytical surface (finger print, coolant, air)
Type standardization
x x Type standard with composition or metallurgical history not similar to production sample(s)
Extrapolation beyond element calibration range
Type standard with inaccurate composition
Incorrect selection of slope or offset type standardization factor
Inhomogeneous type standard sample
Magnitude of the slope and/or offset correction

Page 20 of 20
Note: The list of sources of uncertainty was developed with the understanding that sample and reference material preparation conform to ASTM E716, and instrument operation and analysis practices conform to ASTM E1251.
factors too high
Insufficient frequency of type standardization
Insufficient number of sparks
Contaminated analytical surface (finger print, coolant, air)
Control sample analysis
x Control sample with composition or metallurgical history not similar to production sample(s)
Inhomogeneous control sample
Insufficient frequency of analysis
Absence of corrective action following an out of control result
Control sample limits too wide or too narrow
Insufficient number of sparks
Contaminated analytical surface (finger print, coolant, air)
Production sample analysis
x x Sample composition outside element calibration range
Insufficient number of sparks
Air infiltration between instrument stand and sample
Spark overlap
Electrode not properly cleaned
Sparks outside the recommended spark radius as depicted in ASTM E-716
Corrective action not taken when control sample analysis outside control limits
Contaminated analytical surface (finger print, coolant, air)
Instrument x x Temperature stability of instrument
Optical slit profile adjustment
Cleanliness of sample stand and argon supply line
Argon quality
Electrode positioning adjustment
Lens cleanliness
Laboratory environment
x x Room temperature fluctuations
Humidity fluctuations
Line voltage fluctuations


