Federal Remediation Technologies Roundtable Stephen Dyment U.S. EPA Office of Superfund Remediation and Technology Innovation [email protected]Using High Resolution Site Characterization to Improve Remedy Design and Implementation
Transcript
Federal Remediation Technologies Roundtable
Stephen DymentU.S. EPA Office of Superfund Remediation and Technology [email protected]
Using High Resolution Site Characterization to Improve Remedy Design and Implementation
Making the Case for Targeted High Resolution Characterization
What is “Optimization”(Working Definition / March 2011)
Systematic site review by a team of independent technical experts, at any phase of a cleanup process, to identify opportunities to improve
remedy protectiveness, effectiveness and cost efficiency, and to facilitate progress toward
site completion.
Background on EPA Optimization Efforts 2000 – Piloted optimization at 20 Fund-lead P&T sites
2002 – Began applying monitoring optimization for ground water sites, MAROS evaluations
2004 -- Superfund adopted the “Action Plan for Remedy Optimization” for Fund-lead P&T sites
2007 – Began applying optimization during remedy design and remedy redesign stages, branching out beyond P&T and Fund-lead
– RP lead sites, State lead, Federal facilities– Former Industrial facilities, landfills, sediment sites, mining sites, etc.– NAPL recovery, thermal remediation– Sediment capping– Biosparging– Soil capping– NAPL recovery, chemical oxidation– Air sparging / soil vapor extraction/ groundwater recirculation wells– Barrier walls– Constructed wetlands– Surface water collection and treatment, water diversion
Currently – Triad Approach, Green Remediation, and Five Year Review assistance all incorporated into optimization
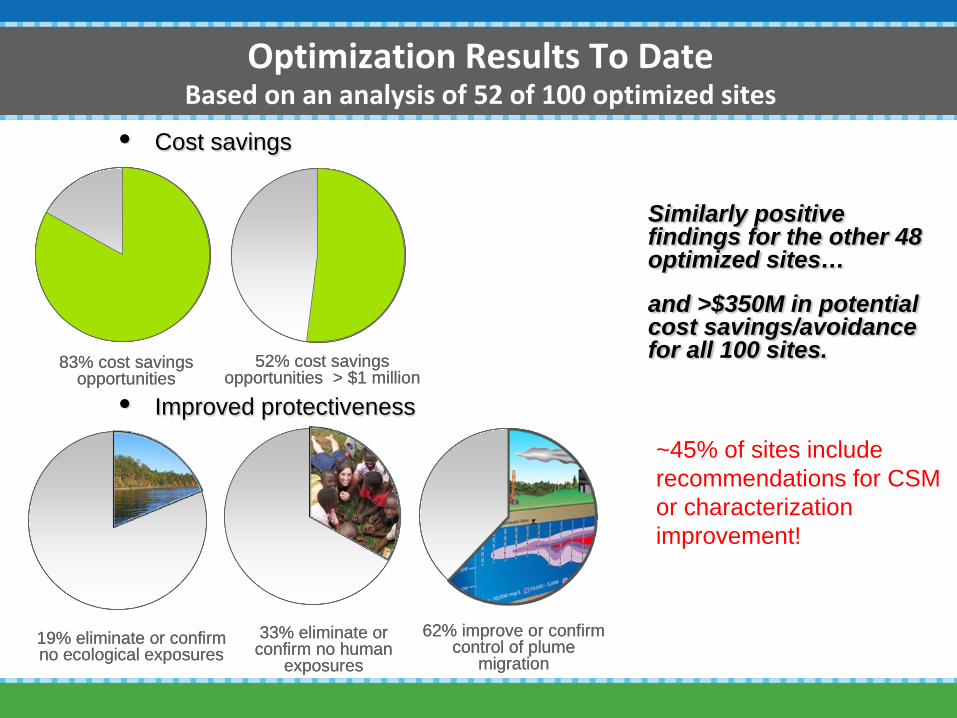
Optimization Results To DateBased on an analysis of 52 of 100 optimized sites
• Cost savings
• Improved protectiveness
83% cost savings opportunities
83% cost savings opportunities
52% cost savingsopportunities > $1 million
52% cost savingsopportunities > $1 million
19% eliminate or confirm no ecological exposures19% eliminate or confirm no ecological exposures
33% eliminate or confirm no human
exposures
33% eliminate or confirm no human
exposures
62% improve or confirm control of plume
migration
62% improve or confirm control of plume
migration
Similarly positive findings for the other 48 optimized sites…
and >$350M in potential cost savings/avoidance for all 100 sites.
~45% of sites include recommendations for CSM or characterization improvement!
Optimization Applied at Every Stage of the Pipeline
Site Completion
Preliminary Assessment
Site Inspection
Remedial Investigation
Feasibility Study
Remedial Design
Remedial Action Construction
Remedial Action Operations
Long-Term Monitoring
Site Identified
Long Term Monitoring Stage
Optimization
Remediation Stage Optimization
Design Stage Optimization
Investigation Stage Optimization
BMPs = Best Management Practices
Federal Remediation Technologies Roundtable
Common Themes Emerge
Need for improved CSMs including use of existing information– CSM chemistry and hydrogeology critical factors in assessing cost-
effective alternatives
Insufficient characterization– Source delineation, concentrated mass transport (mass flux),
aquifer structure and COC properties
Data management
Cost control- overwhelming the matrix– Large footprint vs. small footprint sites
– Source treatment (e.g., SVE, ISCO) incomplete, combined remedies and active treatment zones
Federal Remediation Technologies Roundtable
CSM Evaluation in Post-Construction Optimization CSM is THE tool necessary for assessing cost-effective
alternatives to current remedies
Examples from optimization warrior (USACE)– Region 9 RP lead, disposal pits received liquid waste – SVE
removing >4000 lb/VOCs per quarter for >4 years• Optimization study indicates DNAPL likely, recommends
aggressive source treatment
– Region 5 State lead, historical machine shop/retail strip mall, building limits source investigation for VOCs• ISCO pilot shows significant reduction, team reluctant to go full-
scale, afraid still won’t turn off P&T
• Optimization recommends further source characterization and aggressive treatment
Federal Remediation Technologies Roundtable
Optimization Case StudyGrants Chlorinated Solvents
Optimization conducted during early design stage
Large PCE plume from former dry cleaners
ROD signed in June 2006– In-situ thermal remediation
– In-situ chemical oxidation
– In-situ bioremediation
– Vapor mitigation
Pre-design activities (with more investigation) underway during optimization
Limited data available relative to other sites in design stage
$29 million ROD estimate for remediation
Federal Remediation Technologies Roundtable
Grants Chlorinated SolventsOptimization Findings
Presence of contamination in thin lenses
Potential for substantial mass to have already migrated from source area
Potentially less mass in subsurface than assumed in ROD cost estimates
Need for additional information to help refine/confirm CSM
Cost for remediation documented in ROD is likely overestimated
The early design phase was a good opportunity to contribute to the CSM.
Based on additional characterization (that remains to be collected)
– Reconsider thermal remediation for source area, or at least refine treatment volume and location (technology/approach & CSM)
– Reevaluate remedy approach for plume core and amounts of chemicals/nutrients for remediation (technology/approach)
– Reconsider remedial goals and time frames for comparing alternatives and determining progress… affects exit/remedial strategy (strategy & performance monitoring)
– Use extracted groundwater for chemical blending/injection (technology/approach)
Monitoring well locations/screen intervals suggested(performance monitoring) “Reconsider” and “reevaluate”
suggest iterative/dynamic process.
Federal Remediation Technologies Roundtable
Grants Chlorinated Solvents
10
Dry Cleaner
Approximate Extent of Thermal
ISCO
Bioaugmentation
Federal Remediation Technologies Roundtable
Grants Solvents- Changes to Remedy Design from Optimization Review
Additional source area characterization completed
Additional monitoring wells installed and screened appropriately
Area for thermal remediation reduced in size and relocated
MNA being considered for a portion of the plume (reducing the area for active remediation)
Chemical/nutrient amounts being reevaluated
Revised cost estimate is $11 million lower
11
Federal Remediation Technologies Roundtable
CSM Life Cycle Mimics Project Stages
13April 2010 Superfund Remedy Report
Trends in RODs and Decision Documents Selecting Groundwater Remedies (FY1986 - 2008)Total Groundwater RODs and Decision Documents = 1,727
27%27%26%
2%
92%
0%
10%
20%
30%
40%
50%
60%
70%
80%
90%
100%19
86
1987
1988
1989
1990
1991
1992
1993
1994
1995
1996
1997
1998
1999
2000
2001
2002
2003
2004
2005
2006
2007
2008
Per
cen
tag
e o
f A
ll G
rou
nd
wat
er
RO
Ds
Fiscal Year
GW P&T
GW In Situ Treatment
GW MNA
GW Containment Vertical Engineered Barrier
GW Other
• Groundwater Other includes institutional controls and other remedies not classified as treatment, MNA, or containment. • Note: Other remedies selected prior to 1998 may be under represented in figure. • RODs and decision documents may be counted in more than one category.• RODs from FY1986 – 2004 include RODs and ROD amendments.• Decision documents from FY2005 – 2008 include RODs, ROD amendments, and select ESDs
Collaborative Data Sets Address Analytical Spatial, and Sampling Uncertainties
Soil, fill, bedrock Lithology, groundwater flow, structure, permeability, porosity, and water quality
CPT, high-resolution piezocone Soil, water Lithology, groundwater flow
Federal Remediation Technologies Roundtable
1 False Negative Error= 5%
3 False Positive Errors=7.7%
59 Total pairs
True Positive 19 Pairs
True Negative 36 Pairs
10 False Positive Errors= 26%
0 False Negative Error= 0%
True Positive 20 Pairs
True Negative 29 Pairs
Federal Remediation Technologies Roundtable
3-Way Decision Structure With Region of Uncertainty
3 False Positive Errors=7.7%
59 Total pairs
True Positive 19 Pairs
0 False Negative Error= 0%True Negative
26 Pairs
11 Samples for ICP
Historic Fill Type 1
Historic Fill Type 2
Analysis Of Soil Conductivity Log to Select Soil Sampling Intervals
Historic Fill Thickness Native Soil
Collect Soil Samples
Soil Samples CollectedImmediately Above &
Below Historic Fill/NativeMaterial Interface
Soil Samples CollectedIn Different Historic Fill
Materials
Harrison Commons Area Wide Assessment
Figure 918
Soil Core Samples Correlated with EC LogHistoric Fill
(8-9 ft thick)
Peat & Clay(1.5 to 4 ft thick)
Red Fine to Medium
SandHarrison Commons Area
Wide AssessmentFigure 9
19
Federal Remediation Technologies Roundtable 20
Example of Collaborative Data Set
Example of Composite Collaborative Data Set: Conductivity probes, Soil Borings, Soil Sample
Analysis and Pre-pack Well Screen Settings
Soil Sample Analytical Results
Colors Indicate Concentration
Key LithologySurfaces: Landfill/Native Soil InterfaceAnd Top of Bedrock
Pre-Pack Well Screen: Nested Pair Above & Below Landfill/Native
Soil Interface
Combined Data Set of Conductivity, Lithology and Lead Soil Results
Bottom of Landfill
Lead Soil ResultsBelow 400 ppm-Green
Lead Soil ResultsAbove 400 ppm- Red
Predominance of LeadSoil results Below 400 ppm
Under Marsh Surface-No Vertical Migration fromLandfill to Underlying Soil
Federal Remediation Technologies Roundtable
Increasing the Value of High Resolution Approaches
Dynamic work strategies- facilitated by real time measurements and decision logic
Collaborative data sets– Multiple independent data sets
Deployment– Transects vs. hope and poke
– Depth profiling
– Groundwater elevation gradients can be poor predictors of localized flow
– Remedy areas of focus, mature plume areas vs. invasion fronts
Groundwater Challenges How “well” do you understand your site? Technology used influences your resulting site understanding
Size of measurement must be appropriate for scale of heterogeneity– Variability of hydraulic conductivity / other parameters– Steep concentration gradients – vertically and at plume edges– Heterogeneous distribution of DNAPL sources
Conventional monitoring wells are not optimal investigation tools– Wells yield depth-integrated, flow-weighted average data– Cannot discern heterogeneities that control contaminant transport– Good technology for long-term monitoring
Beware biased well locations [hope & poke]– Majority of uncertainty comes from data gaps between wells [hope]
– Majority of investigations rely on limited number of wells [poke]
BMP- Transects and vertical profiling – Effectively delineate groundwater impacts– Find appropriate monitoring well locations and screen intervals
22
23
Effects of depth-integrated, flow weighted averagingWell results less than vertically profiled concentrations
1 10 100 1,000 10,000 100,000
176
178
180
182
184
186
Ele
vation (m
)
PCE (ug/L)10-3 10-2 10-1
176
178
180
182
184
186
Hydraulic Conductivity (cm/sec)
Federal Remediation Technologies Roundtable 24
Conceptual Site ModelAre We Effectively Using Data or Confusing Data?
Federal Remediation Technologies Roundtable
These three figures are represented in one image from 3-D Analysis
The Value of Seeing the Whole Picture in 3-D
Where Do We Go From Here?
26
Continued improvements to CSMs– Lifecycle use as a planning, management, decision making tool
– 3D visualization and decision support tools (DST matrix)
– Data management
Characterization strategies and tools– For soil projects incremental and composite designs, adaptive QC
targets areas of highest variability
– Mapping mass storage vs. transport zones (Tool needs- CPT example)
– Aquifer characteristics (gradients, velocity)
– Contaminant and reagent mass transfer behavior
Outreach and training– High resolution site characterization course under development
– Continued technical support- 3D, tools, strategies, identify research needs (tools and strategies)