Using Historical Perspective of Keynesian vs. Neoclassical Macro in Teaching Principles 14th Fed Prof Conference 2016 Max Gillman, U. of Missouri-St. Louis Federal Reserve Bank of St. Louis 3-4 November 2016 Gillman (Federal Reserve Bank of St. Louis) With FRED and EconLowdown 3-4 November 2016 1 / 62
Transcript
Using Historical Perspective of Keynesian vs.Neoclassical Macro in Teaching Principles
14th Fed Prof Conference 2016
Max Gillman, U. of Missouri-St. Louis
Federal Reserve Bank of St. Louis
3-4 November 2016
Gillman (Federal Reserve Bank of St. Louis) With FRED and EconLowdown 3-4 November 2016 1 / 62
Evolutionary Approach to Teaching MacroPrinciples of Macroeconomics: An Evolutionary Approach; Jan. 2017
Great Depression to Great Recession
Fisher vs. Keynes
Neoclassical vs Keynesian
Lectures including Online FRED.
Homework including EconLowdown Modules.Using State of Art Econ Govt data & Online Modules.Without reliance on Proprietary Online Services.Adjust as FRED, EconLowdown Advance/Evolve.(In FRED We Trust).
Gillman (Federal Reserve Bank of St. Louis) With FRED and EconLowdown 3-4 November 2016 2 / 62
What We Teach Matters: Not Just How
What is an Economic Fallacy?
What is an Economic Fact?
What is a Macroeconomic Principle?
What Math can we use?
Can We Tell the Story of Macro?
Gillman (Federal Reserve Bank of St. Louis) With FRED and EconLowdown 3-4 November 2016 3 / 62
Fallacies: AS-AD derivation.
Keynesian Cross gives AS � AD analysis.
IS-LM gives AS � AD analysis.
Phillips curve gives AS � AD analysis.
Oil Price Theory of Stag�ation gives AS � AD analysis.
David Colander, 1995, "The Stories We Tell:
A Reconsideration of AS/AD Analysis."Journal of Economic Perspectives, 9(3): 169-188.
Gillman (Federal Reserve Bank of St. Louis) With FRED and EconLowdown 3-4 November 2016 4 / 62
Stylized Facts
Normal Real Business Cycle Stylized Facts
Solow Growth Facts of balanced growth path.
Phillips curves during Asset Market Booms & Busts
Bank Collapse Causing Crises of Grt Depress & Grt Rec.
US Lost Decades: 1929-1939 & 2007-2016.
Gillman (Federal Reserve Bank of St. Louis) With FRED and EconLowdown 3-4 November 2016 5 / 62
Macro Principles
S & D for capital depends on Real Interest Rate:
Fisher 1896 Model allows "Ramsey" RBC explanation.
Ramsey World AS � AD underlies Dyn. Stoch. Gen Equil.
Ramsey World AS � AD depends on real price of Gds to Labor:1/w .
Ramsey World S&D in Labor market dependson real price of Labor to Goods: w/1.Real Interest Rate constant in Ramsey World
Gillman (Federal Reserve Bank of St. Louis) With FRED and EconLowdown 3-4 November 2016 6 / 62
Math We Can Use
Graphs of Data over time: FRED mainly.
Plus BLS graphs, NIPA Dpt Comm.& OECD tables.
Graphs of Functional Data, in time: Phillips Curve
Can Construct Using FRED data in Excell.
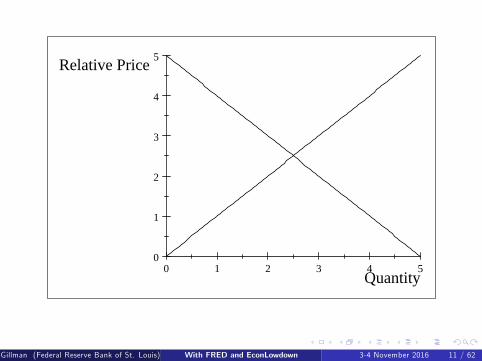
Graphs of Functions between 2 Variables:
eg. Price, Quantity; Output, Input.
Graphs of Functions Shifting:
Comparative Statics Change in one Parameter.
Tables.Equations: Simple Algebra Only
C + I + G = Y = GDP; R = r + π; GDP = GDI .Maybe: wl + rk � δ+ G � T = Y = GDI(A � B + C �D + E = F ).
Gillman (Federal Reserve Bank of St. Louis) With FRED and EconLowdown 3-4 November 2016 7 / 62
Story to be Told
Microeconomic to Macroeconomic Foundations
Comovement & Crises
Cycles & Growth
Policy
Gillman (Federal Reserve Bank of St. Louis) With FRED and EconLowdown 3-4 November 2016 8 / 62
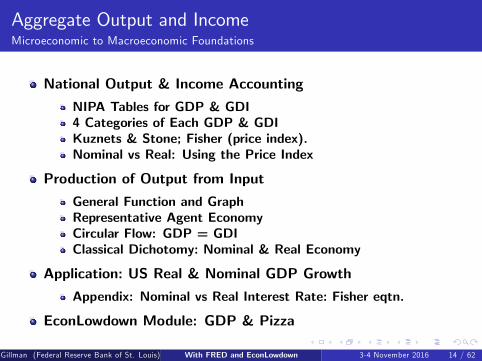
Micro Principles Used in MacroMicroeconomic to Macroeconomic Foundations
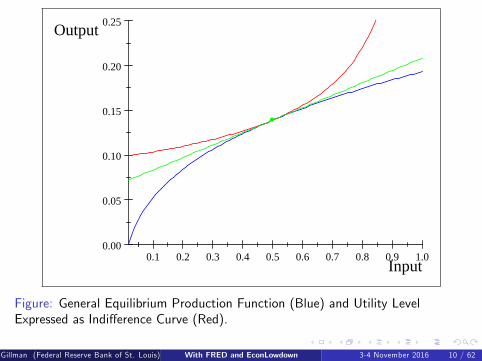
PPC, Production Function, Indi¤erence Curve.Diminishing Marg Prod. & Marg Utility; Mrkt Structure.Supply & Demand as function of Relative PriceComparative Statics
Smith, Ricardo, Bentham, Jevons, Menger, Walras,Malthus, Darwin, & MarshallLabor Theory of Value vs Neoclassical Theory of Value
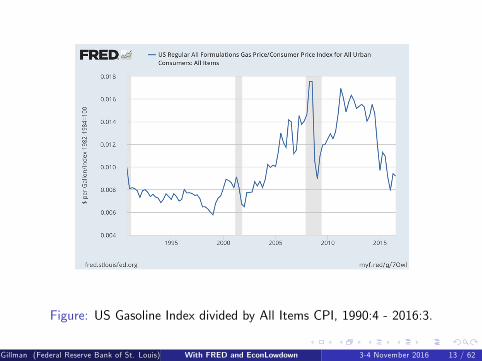
Application: Gasoline Prices & Loss of US World Auto MrktCurrent Dollar Gas Prices vs Real Dollar Gas Prices
Appendices: How Darwin Solved Shape of Production CurvePlus: Graphs & Data; Using FRED; y = a+ bx .
Append: Historical Money, In�ation & Debt;Fiscal Theory of the Price Level.
EconLowdown Module: Capital Markets.& Monetary Policy.
Gillman (Federal Reserve Bank of St. Louis) With FRED and EconLowdown 3-4 November 2016 19 / 62
Crises and In�ationComovement & Crises
Facts: WWI, WWII, Korean War & In�ation
Vietnam war In�ation: a period of "Peacetime".Granger Causality of Oil Prices by Money & In�ationKillian & coauthors on monetary causes of Oil prices.
Oil Price Shock Theory of Stag�ation: Mankiw (2015)
AS-AD with nominal prices vs Relative Prices.Monetary hypothesis of "OPEC Oil Shocks".In�ation Tax & Long run Growth.Phillips Curves: Theory, Evidence & Debt-De�ations.
Applic: Grt Depres. Turning Pt with �33 Banking Act & FDICAppend: US Banking Acts 1930�s and 2008.EconLowdown Module: Great In�ation, Grt Depres. 3 & 4.
Gillman (Federal Reserve Bank of St. Louis) With FRED and EconLowdown 3-4 November 2016 20 / 62
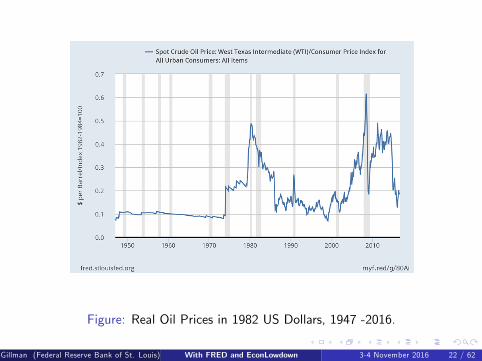
Figure: Real WTI Oil Prices, from Jan. 1947 to Dec. 1973: WTI US$ per barreldivided by US CPI index, in 1982 Constant Dollars.
Gillman (Federal Reserve Bank of St. Louis) With FRED and EconLowdown 3-4 November 2016 21 / 62
Figure: Real Oil Prices in 1982 US Dollars, 1947 -2016.
Gillman (Federal Reserve Bank of St. Louis) With FRED and EconLowdown 3-4 November 2016 22 / 62
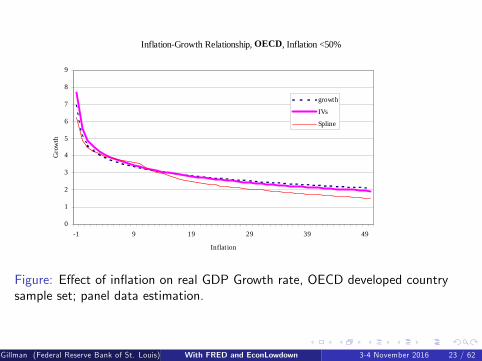
Figure: E¤ect of in�ation on real GDP Growth rate, OECD developed countrysample set; panel data estimation.
Gillman (Federal Reserve Bank of St. Louis) With FRED and EconLowdown 3-4 November 2016 23 / 62
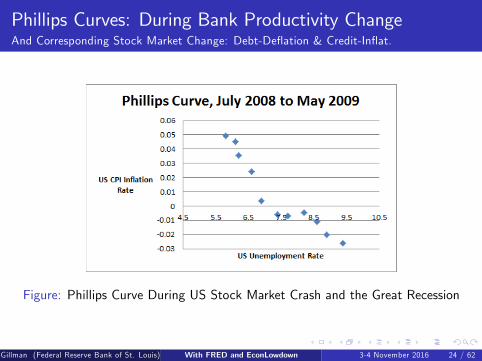
Phillips Curves: During Bank Productivity ChangeAnd Corresponding Stock Market Change: Debt-De�ation & Credit-In�at.
Figure: Phillips Curve During US Stock Market Crash and the Great Recession
Gillman (Federal Reserve Bank of St. Louis) With FRED and EconLowdown 3-4 November 2016 24 / 62
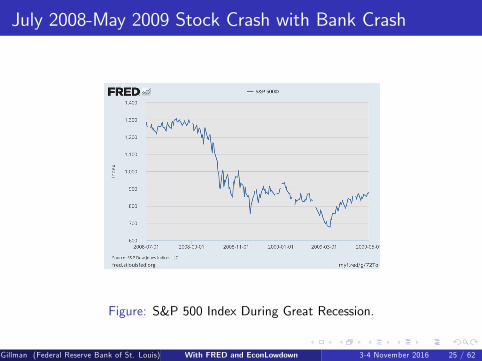
July 2008-May 2009 Stock Crash with Bank Crash
Figure: S&P 500 Index During Great Recession.
Gillman (Federal Reserve Bank of St. Louis) With FRED and EconLowdown 3-4 November 2016 25 / 62
May 29-May 33: US Great Depression
Figure: US Phillips Curve During Great Depression
Gillman (Federal Reserve Bank of St. Louis) With FRED and EconLowdown 3-4 November 2016 26 / 62
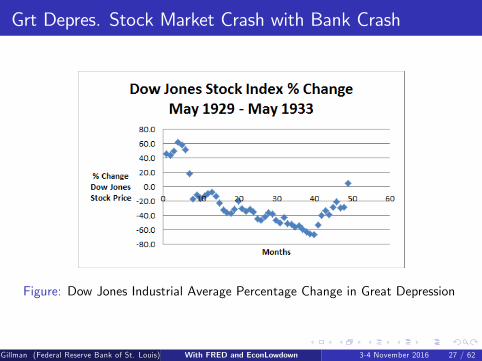
Grt Depres. Stock Market Crash with Bank Crash
Figure: Dow Jones Industrial Average Percentage Change in Great Depression
Gillman (Federal Reserve Bank of St. Louis) With FRED and EconLowdown 3-4 November 2016 27 / 62
1960s "FAMOUS" Phillips Curve
Figure: Phillips Curve from 1959:1 to 1969:12
Gillman (Federal Reserve Bank of St. Louis) With FRED and EconLowdown 3-4 November 2016 28 / 62
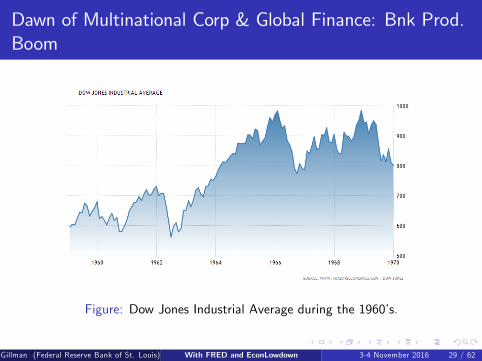
Dawn of Multinational Corp & Global Finance: Bnk Prod.Boom
Figure: Dow Jones Industrial Average during the 1960�s.
Gillman (Federal Reserve Bank of St. Louis) With FRED and EconLowdown 3-4 November 2016 29 / 62
Savings, Investment & InterestCycles & Growth
Facts: Income Flow on Wealth; Savings & Investment data.Keynesian Analysis of Capital Market
IS: Supply shifts out by more than Demand, when Y " ;"Excess Savings" & Downward sloping IS.LM: D shifts out by more than S ; LM slopes up.Horizontal Lines on Solow Growth path: general case.Policy: Govt Spending & Money increases Good.
Fisherian Neoclass. 2-period Model of Sav & Invest.Business Cycle Explanation: just 2 joint Comparative Statics.TFP increase, and y0 endowment increase.Get Keynes (1936) only graph with y0 endowment increase.
Applic: Present Discounted Value.Append: Savings & Investment data on same basis (FRED).EconLowdown Module: Time Value of Money; & Soar toSavings.
Gillman (Federal Reserve Bank of St. Louis) With FRED and EconLowdown 3-4 November 2016 30 / 62
29 30 31 32 33 34 35 36 37 381.00
1.05
1.10
1.15
k Capital Investment, Savings
(1+r)/1
Figure: Shift Back in Supply and Upwards in Demand for Capital (Black), from aProductivity Increase Relative to Baseline (Red): Capital Investment (andSavings) Unchanged, but Interest Rate Higher.
Gillman (Federal Reserve Bank of St. Louis) With FRED and EconLowdown 3-4 November 2016 31 / 62
31 32 33 34 35 361.00
1.02
1.04
1.06
1.08
k Capital
(1+r)/1
Figure: An Increase in Current Income Endowment Shifts out the Supply ofCapital (Black Curve) and Lowers the Real Interest Rate.
Gillman (Federal Reserve Bank of St. Louis) With FRED and EconLowdown 3-4 November 2016 32 / 62
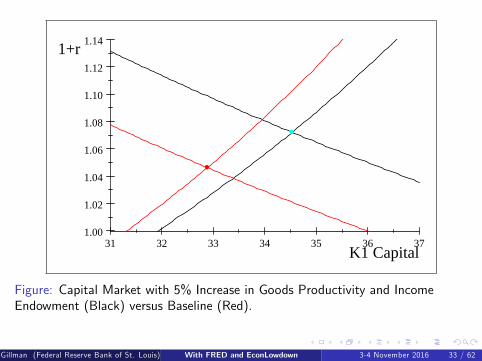
31 32 33 34 35 36 371.00
1.02
1.04
1.06
1.08
1.10
1.12
1.14
K1 Capital
1+r
Figure: Capital Market with 5% Increase in Goods Productivity and IncomeEndowment (Black) versus Baseline (Red).
Gillman (Federal Reserve Bank of St. Louis) With FRED and EconLowdown 3-4 November 2016 33 / 62
AS-AD & Business CyclesCycles & Growth
Facts
Monetary Prices Versus Relative PricesCapital to Goods Price & Debt-De�ationStylized Facts Of Cycles
Theory: Ramsey�s World with AS-AD
Ramsey Markets for Output, Labor and CapitalRBC Analysis: Goods & Time Endowment Changes
Application: Crisis from Fixed WageAppendix: Crisis from Bank Productivity Crash.EconLowdown Module: "The Great Depression 5".
Gillman (Federal Reserve Bank of St. Louis) With FRED and EconLowdown 3-4 November 2016 34 / 62
Figure: US Nominal Price of Goods (CPI) Divided by the Nominal Wage Rate(average weekly wage and salary, full time, 16 and over): P/W , 1979 to 2015
Gillman (Federal Reserve Bank of St. Louis) With FRED and EconLowdown 3-4 November 2016 35 / 62
Figure: Annual Growth Rate of Real Wage Rate and Trend-Adjusted Real GDP,US 1965:6-2014.
Gillman (Federal Reserve Bank of St. Louis) With FRED and EconLowdown 3-4 November 2016 36 / 62
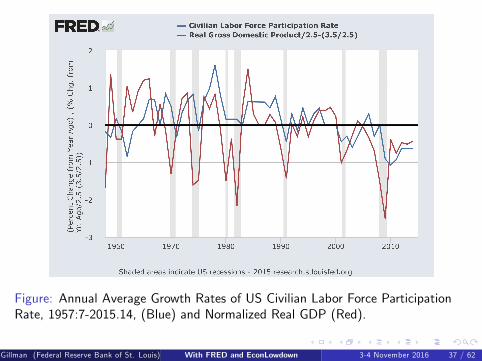
Figure: Annual Average Growth Rates of US Civilian Labor Force ParticipationRate, 1957:7-2015.14, (Blue) and Normalized Real GDP (Red).
Gillman (Federal Reserve Bank of St. Louis) With FRED and EconLowdown 3-4 November 2016 37 / 62
Figure: Business Cycle Expansion in Goods Market: AS � AD Equilibrium with5% Increase (in Black) in Both Productivity A and Time T as Compared to theOriginal (in Red).
Gillman (Federal Reserve Bank of St. Louis) With FRED and EconLowdown 3-4 November 2016 38 / 62
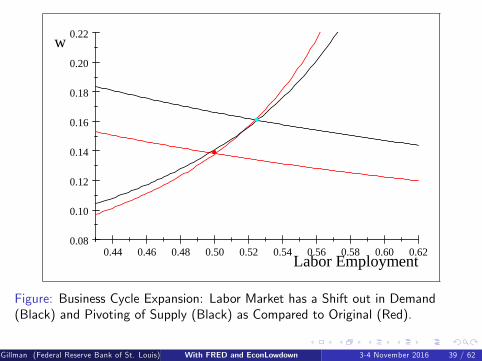
Figure: Business Cycle Expansion: Labor Market has a Shift out in Demand(Black) and Pivoting of Supply (Black) as Compared to Original (Red).
Gillman (Federal Reserve Bank of St. Louis) With FRED and EconLowdown 3-4 November 2016 39 / 62
0 1 2 3 4 5
0.05
0.06
0.07
0.08
0.09
0.10
Capital Stock k
Real Interest Rate r
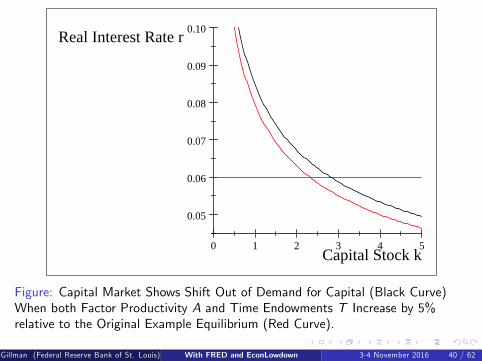
Figure: Capital Market Shows Shift Out of Demand for Capital (Black Curve)When both Factor Productivity A and Time Endowments T Increase by 5%relative to the Original Example Equilibrium (Red Curve).
Gillman (Federal Reserve Bank of St. Louis) With FRED and EconLowdown 3-4 November 2016 40 / 62
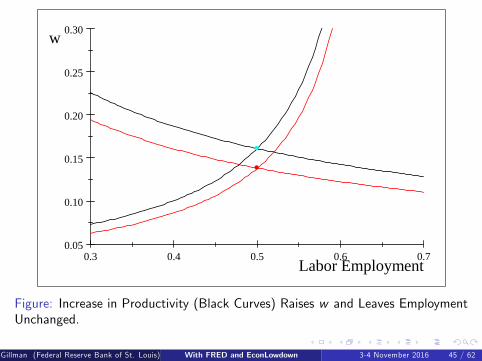
0.30 0.35 0.40 0.45 0.50 0.55 0.600.08
0.10
0.12
0.14
0.16
0.18
0.20
Labor Employment
w
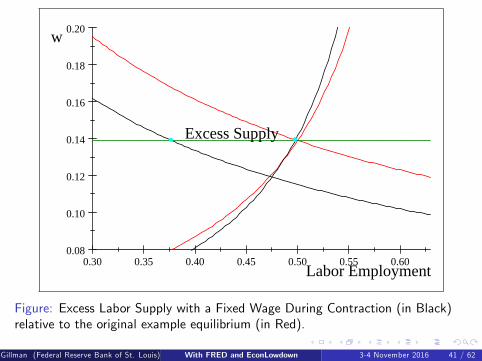
Excess Supply
Figure: Excess Labor Supply with a Fixed Wage During Contraction (in Black)relative to the original example equilibrium (in Red).
Gillman (Federal Reserve Bank of St. Louis) With FRED and EconLowdown 3-4 November 2016 41 / 62
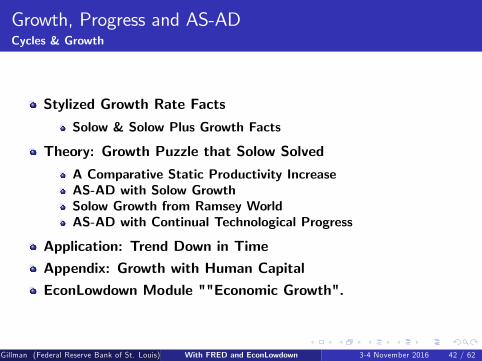
Growth, Progress and AS-ADCycles & Growth
Stylized Growth Rate Facts
Solow & Solow Plus Growth Facts
Theory: Growth Puzzle that Solow Solved
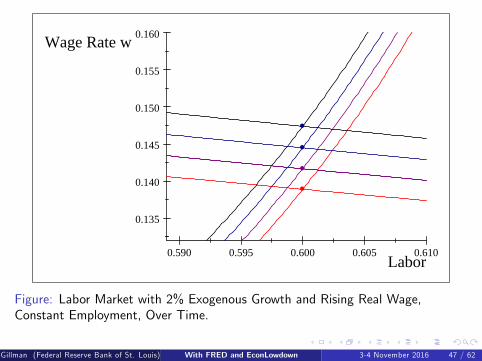
A Comparative Static Productivity IncreaseAS-AD with Solow GrowthSolow Growth from Ramsey WorldAS-AD with Continual Technological Progress
Application: Trend Down in TimeAppendix: Growth with Human CapitalEconLowdown Module ""Economic Growth".
Gillman (Federal Reserve Bank of St. Louis) With FRED and EconLowdown 3-4 November 2016 42 / 62
Figure: US Years of Education by Birth Cohort
Gillman (Federal Reserve Bank of St. Louis) With FRED and EconLowdown 3-4 November 2016 43 / 62
Figure: Ramsey Consumption Theory and Busines Cycles: Increase in A.Gillman (Federal Reserve Bank of St. Louis) With FRED and EconLowdown 3-4 November 2016 51 / 62
The Great Recession and Lost DecadePolicy
Facts: Fed "Bailout" of US Bank System?Theory: Bagehot�s law of �nancial e¢ ciency
Tax on Capital Markets, Welfare Loss,Financial "Repression"Seeking Yield": Capital Market DistortionGovernment Capital FloodingInternationally Ine¢ cient Bank SubsidizationDeconstructing 3-Equation Keynesian Bank Model
Application: Normalizing PolicyAppendix: Being Earnest on BankingEconLowdown Module "The Great Depression 6".
Gillman (Federal Reserve Bank of St. Louis) With FRED and EconLowdown 3-4 November 2016 52 / 62
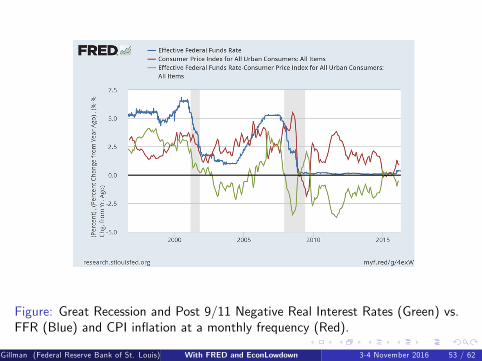
Figure: Great Recession and Post 9/11 Negative Real Interest Rates (Green) vs.FFR (Blue) and CPI in�ation at a monthly frequency (Red).
Gillman (Federal Reserve Bank of St. Louis) With FRED and EconLowdown 3-4 November 2016 53 / 62
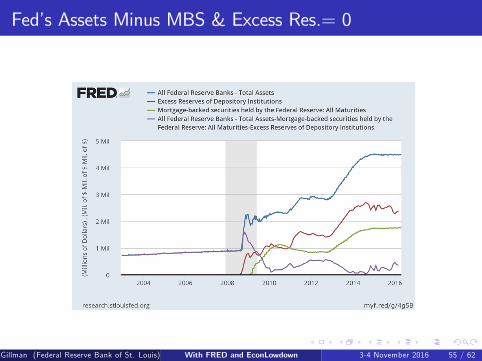
Fed Caused Lost Decade?Purple line (Total Assets) - (MBS) follows Red (Excess Reserves)
Gillman (Federal Reserve Bank of St. Louis) With FRED and EconLowdown 3-4 November 2016 54 / 62
Fed�s Assets Minus MBS & Excess Res.= 0
Gillman (Federal Reserve Bank of St. Louis) With FRED and EconLowdown 3-4 November 2016 55 / 62
Interest on Excess Reserves Forces Down Real Interest Rt.
Figure: Loan Ratio (Blue) & Real Int.Rt (Red)Gillman (Federal Reserve Bank of St. Louis) With FRED and EconLowdown 3-4 November 2016 56 / 62
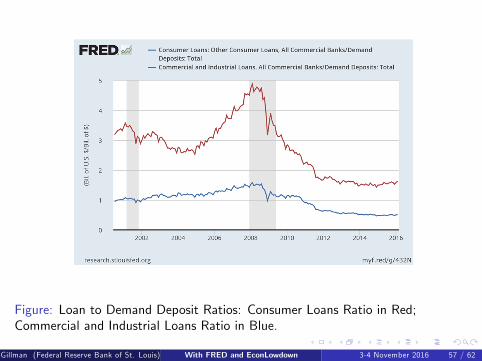
Figure: Loan to Demand Deposit Ratios: Consumer Loans Ratio in Red;Commercial and Industrial Loans Ratio in Blue.
Gillman (Federal Reserve Bank of St. Louis) With FRED and EconLowdown 3-4 November 2016 57 / 62
When E¤ective Ceiling Imposed On Real Interest Rate
31 32 33 34 35 361.00
1.02
1.04
1.06
1.08
K1 Capital
1+r
Excess Demand For Capital
Figure: Savings and Investment: Aggregate Supply and Demand for Capital kWith Real Interest Rate Ceiling
Gillman (Federal Reserve Bank of St. Louis) With FRED and EconLowdown 3-4 November 2016 58 / 62
Fed�s Shift out of Supply of Capital through the OpenMarket Purchases of US Treasury or Treasury backedSecurities: Creating the Bank System�s Excess Reserves ."Excess Reserves" That Fed Supplied Buying Treas Debt
31 32 33 34 35 36 37 381.00
1.02
1.04
1.06
1.08
K1 Capital
1+r
Excess Reserves
Figure:Gillman (Federal Reserve Bank of St. Louis) With FRED and EconLowdown 3-4 November 2016 59 / 62
Capital Tax Wedge on Priv Invest. with High r forInvestmentLow r for Savings: Dead Weight Triangle Loss of Welfare
31 32 33 34 35 36 37 381.00
1.02
1.04
1.06
1.08
K1 Capital
1+r
Excess Reserves
Figure: "Deadweight Loss Triangle"Gillman (Federal Reserve Bank of St. Louis) With FRED and EconLowdown 3-4 November 2016 60 / 62
View of Wedge in Gen Equil CCAPMBrown Indi¤ Curve CUTS Prod Funct at Low Diversi�cation Level
0.0 0.2 0.4 0.6 0.8 1.00.00
0.05
0.10
0.15
0.20
0.25
Capital at Risk
Capital Yield
Figure: Optimal Portfolio Diversi�cation between Market Portfolio (Tangency)and "Risk-free" Government Debt.
Gillman (Federal Reserve Bank of St. Louis) With FRED and EconLowdown 3-4 November 2016 61 / 62
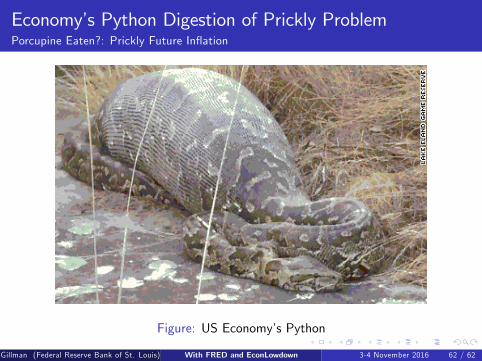
Economy�s Python Digestion of Prickly ProblemPorcupine Eaten?: Prickly Future In�ation
Figure: US Economy�s Python
Gillman (Federal Reserve Bank of St. Louis) With FRED and EconLowdown 3-4 November 2016 62 / 62