19
Using Hyperion to Develop an Absolute Calibration Model for the Libya 4 Invariant Test Site -Initial concepts Nischal Mishra Dennis Helder Sandip Shrestha Ameya Vaidya Calcon-2012

Using Hyperion to Develop an Absolute
Calibration Model for the Libya 4
Invariant Test Site
-Initial concepts
Nischal Mishra
Dennis Helder
Sandip Shrestha
Ameya Vaidya
Calcon-2012

Objective
• Pseudo Invariant Calibration Sites (PICS) have been used for many years to determine the stability of optical satellite sensors.
• However, the potential exists to use PICS for absolute calibration of optical satellite sensors. As a sensor views a calibration panel in the laboratory during pre-launch testing, in an analogous manner consider the sensor viewing PICS while on orbit.
• Specific goals: – Determine the intrinsic stability of PICS.
– Develop a comprehensive and accurate PICS absolute calibration model that can be SI traceable.
Empirical approach
Developing surface and atmospheric models based on satellite and meteorological observations.
First Principles approach
Develop surface and atmospheric models based on the inherent physics of the site.

Outline • PICS Background
• Libya 4 test site Long term trending of Landsat 7 ETM+ using
Libya 4
• Introduction to sensors
• EO-1Hyperion- spectral model
• Introduction Terra MODIS (calibrated
radiometer)
• Derivation of hyperspectral profile of the
target
• Stability of Libya 4 using Hyperion Acknowledgement:
This work was supported by the NASA Landsat Project Science Office and USGS EROS.
The MODIS data has been provided by MODIS Characterization Support Team (MCST).

Outline con’t..
• Absolute calibration Development
Absolute scaling factor—anchoring spectral model to Terra
MODIS
Development of BRDF models
For Solar Zenith Angle
For View Zenith Angle
• Validation of the model using Terra MODIS and Landsat
Red bands
• Validation of the model for all the bands
• Conclusions

PICS Background
• PICS have been used for on-orbit radiometric trending of optical satellite sensors for at least 15
years.
• Highly regarded sites used by the calibration community tend to be in the Sahara desert of North
Africa
• A suite of sites has been developed and endorsed by CEOS (can be viewed at
http://calval.cr.usgs.gov/sites_catalog_ceos_sites.php#CEOS )
Mauritania 2 Libya 1
Egypt 1
Egypt 2
Mauritania 2 Mauritania 1
Algeria 3 Libya 4

Long Term Trending of Landsat using Libya 4
• Location: 28.55
lat,23.39
long ,elevation
of 118 m above sea level.
• Has been used for an
extended period of time
by many investigators.
• Possibly the most stable
and brightest desert site
• Long term observations
from ETM+ shows that
Libya 4 is stable to ~ 2%
in the VNIR bands and
~3% in the SWIR bands.

The Earth Observing 1 (EO-1)
Hyperion
• Launched on 11/ 21/2000
• Pushbroom sensor with a single telescope and
two grating spectrometers
• 196 calibrated bands from 0.4 to 2.5 µm ,30 m
spatial res., 10 nm spectral res. and 7.5 km
swath width
• Good coverage over PICS
– Over 170 cloud free acquisitions over
Libya 4
– Over 130 acquisitions over Egypt 1
– More than 30 collects over Mauritania
1& 2 and Algeria 3
– Cloud cover less than 10%
Terra MODIS
• Launched on December 18, 1999.
• Pusbroom sensor with a swath of 2330
km.
• 36 spectral channels
• Diffuser based calibration, radiometric
calibration of better than 3%
• Temporal resolution of 1 to 2 days,
acquires large number of data over
PICS
Fig: Schematic view of the EO-1 Hyperion Fig: Schematic view of the MODIS instrument
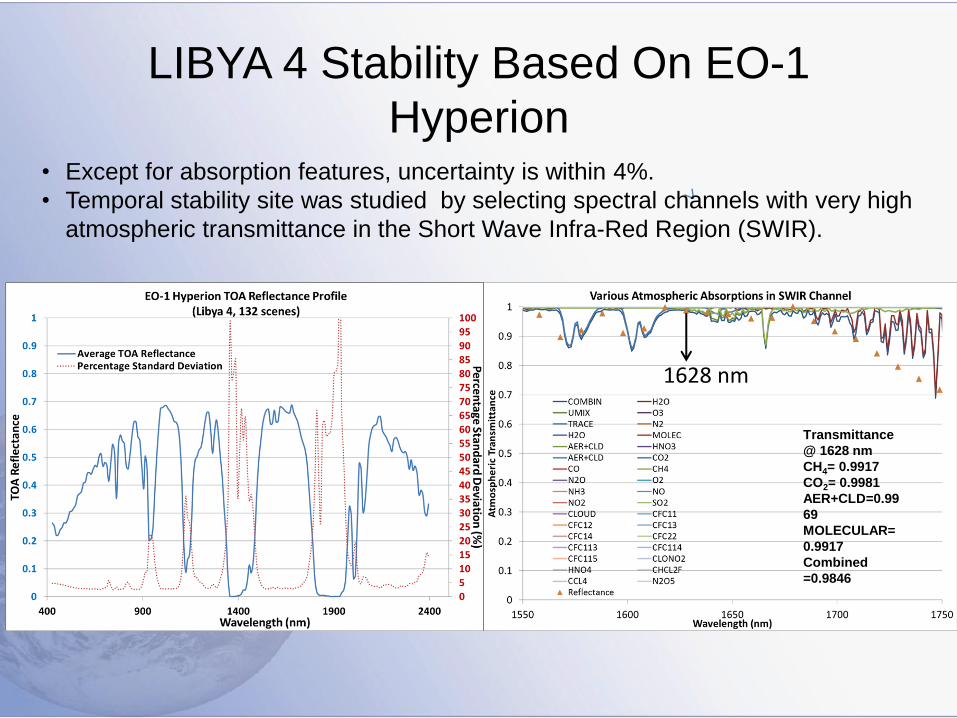
LIBYA 4 Stability Based On EO-1
Hyperion • Except for absorption features, uncertainty is within 4%.
• Temporal stability site was studied by selecting spectral channels with very high
atmospheric transmittance in the Short Wave Infra-Red Region (SWIR).
Transmittance
@ 1628 nm
CH4= 0.9917
CO2= 0.9981
AER+CLD=0.99
69
MOLECULAR=
0.9917
Combined
=0.9846
1628 nm

• Viewing geometry was restricted to within +/- 5 nadir degrees to minimize the
effects caused by non-nadir viewing
• Annual cycles visible are primarily due to varying solar illumination angles coupled
with the bidirectional reflectance distribution function (BRDF) of the surface.
• Temporal uncertainty is found to be 2.46%.
• Simple linear empirical BRDF model was developed to correct for variations caused
by solar zenith angles.
Development of a linear BRDF model-
illumination

• Linear BRDF model show that temporal stability improved to 0.84 % for this channel.
• Consistent Uncertainties with Ross-Li model
• Sub 1% results were observed for other high transmittance SWIR channels too. (1558 nm,
1568 nm, 1588 nm, 1598 nm, 1618 nm, 1638 nm, 1648 nm, 1659 nm, 1679 nm)
• Without atmospheric effects, site stability is better than 1%
Development of a linear BRDF model-illumination cont’d..

Absolute scaling factor—anchoring spectral model to Terra MODIS
• Assuming Terra to be the calibration standard, the
Hyperion spectrum can be scaled appropriately.
• scale factor calculated using six available same day
(viewing angles <
5o, solar zenith angle of 30
5o)
pairs.
• Statistical analysis indicated mean scaling values could
be clustered into three groups: band 7, bands 3,2 and
6 and bands 1, 4 (α = 0.05).
• Hyperspectral scale model was then developed using
the smooth linear interpolation between these three
gain points.

Development of Linear BRDF model- Illumination
• MODIS Observations for 10 years was used to develop a linear BRDF model.
• Example shown for red band, similar model was generated for 6 bands.
• The resulting slope value were plotted as a function of their center wavelengths.
• Exponential model developed to predict change in BRDF as a function of
wavelength.

Development of a BRDF model-viewing
angle • BRDF as a function of viewing angle is clearly non-linear
• 2nd order polynomial model developed, similar to Ross-Li model; higher order terms
were statistically insignificant
• Model reduces variability due to view angle to less than 1% at atmospherically clear
wavelengths .

Development of a linear BRDF model-
viewing angle cont’d.
• Off-nadir MODIS data were not
available when the work was
done.
• Hence spectrally cleaner
Hyperion channels were used to
model the slope.
• Two term exponential model
developed as a function of
wavelength to predict second
order term; first order term
essentially constant.
• Thus the absolute calibration model is of the form

• Currently the model has been tested only for nadir views
• Results provided for red bands show the systematic as well as the
random error is of the order of 1.4% in this band.
• the fit is very good due to MODIS being used to develop the model
Validation of the model using Terra MODIS

Validation of the model using Landsat 7 ETM+
• Comparison is made between the Libya 4 model prediction and at-
sensor reflectance derived from ETM+ measurements.
• Percent difference between the two is on the order of 1.2% RMSE and
the spread of ~ 1%.
• The uncertainties are similar between MODIS and ETM+ suggesting a
good model fit. This may be due to the higher degree of similarity
between the ETM+ and MODIS bands at this wavelength

Validation Summary for all bands • For both MODIS and ETM+ sensors,
STD is better than 2% for all the bands, except SWIR -2 bands which has
slightly higher values.
Systematic offsets are within 2.5% in VNIR bands
Higher offset exists between the two sensors in the SWIR1 and SWIR 2
channels ( ~ 5%).
MODIS ETM+ MODIS ETM+
3 (459-479 nm) 1 (450-515 nm) 1.32% 1.65% 1.26% 1.54%
4( 545-565 nm) 2( 525-605 nm) 1.24% 2.27% 1.24% 0.94%
1 (620-670 nm) 3 (630-690 nm) 1.39% 1.28% 1.28% 1.02%
2 (841-876 nm) 4 (750-900 nm) 1.61% 2.18% 1.41% 1.79%
6 (1628-1652 nm) 5 (1550-1750 nm) 1.04% 5.70% 0.95% 1.25%
7 (2105-2155 nm) 7 (2090-2350 nm) 2.14% 4.99% 2.15% 2.24%
MODIS Bands ETM+ Bands
Root Mean
Squared Error
( RMSE)
STD of residues

Conclusions • Hyperion measurements in a transparent channel showed that
precision better than 1% is possible in Libya 4.
• A simple model was then developed for Libya 4 using Hyperion for the spectral information and Terra MODIS as reference for the absolute calibration. – This model was validated through use of observations by the L7 ETM+
sensor.
– After accounting for the spectral bandpass, it was shown that the simple model was consistent with ETM+ to within 1.5%.
– This agreement is well within the stated calibration accuracies of these two sensors (2% reflectance-based for Terra, and 5% radiance-based for ETM+).
– ETM+ bands at longer wavelengths show substantially greater bias—up to 5% in the SWIR.
• Work in progress to expand the model with broader view geometries, and develop more exact surface and atmospheric components
• Validate the model with multiple suites of sensors.

Backup slides
Thuillier Chkur
1 (450-515 nm) 1997 1969 1.40%
2( 525-605 nm) 1812 1840 1.55%
3 (630-690 nm) 1533 1551 1.17%
4 (750-900 nm) 1039 1044 0.48%
5 (1550-1750 nm) 230.8 225.7 2.21%
7 (2090-2350 nm) 84.9 82.07 3.33%
ETM+ Bands
Solar Irradiance
(W/m2μm)Percent
Diff.MODIS ETM+ MODIS ETM+
3 (459-479 nm) 1 (450-515 nm) 1.32% 1.65% 1.26% 1.54%
4( 545-565 nm) 2( 525-605 nm) 1.24% 2.27% 1.24% 0.94%
1 (620-670 nm) 3 (630-690 nm) 1.39% 1.28% 1.28% 1.02%
2 (841-876 nm) 4 (750-900 nm) 1.61% 2.18% 1.41% 1.79%
6 (1628-1652 nm) 5 (1550-1750 nm) 1.04% 5.70% 0.95% 1.25%
7 (2105-2155 nm) 7 (2090-2350 nm) 2.14% 4.99% 2.15% 2.24%
MODIS Bands ETM+ Bands
Root Mean
Squared Error
( RMSE)
STD of residues


