62

Internet of Things (IoT) Webcasts
1. Introduction to Informix and the Internet of
Things – May 26th
2. Using Informix TimeSeries and the
Internet of Things
3. Running an Informix Database Server on an
ARM Computer – June 23rd
4. The Basics of Getting Up and Running with
Informix – July 28th
2

Using Informix TimeSeries and
the Internet of Things • Summary of IoT, capturing sensor data and using ARM
computer as a smart gateway
• TimeSeries – what is it?
• How to set up a simple, regular TimeSeries
• Creating a TimeSeries for sensor data
• Virtual Table Interface and expression-based VTI
• Example of displaying sensor data on a web page
• Publishing sensor data to the cloud
• View data in the cloud
• Using APIs to pull data from the cloud
• Demonstration of using APIs to display sensor data and graphs on a website
3

Internet of Things (IoT)
• Connecting together the Physical and
Digital World
• Built around sensors and smart gateways
• Consumer Examples of “smart” devices:
– Thermostats
– Door Locks
– Lightbulbs,
– Etc.
4
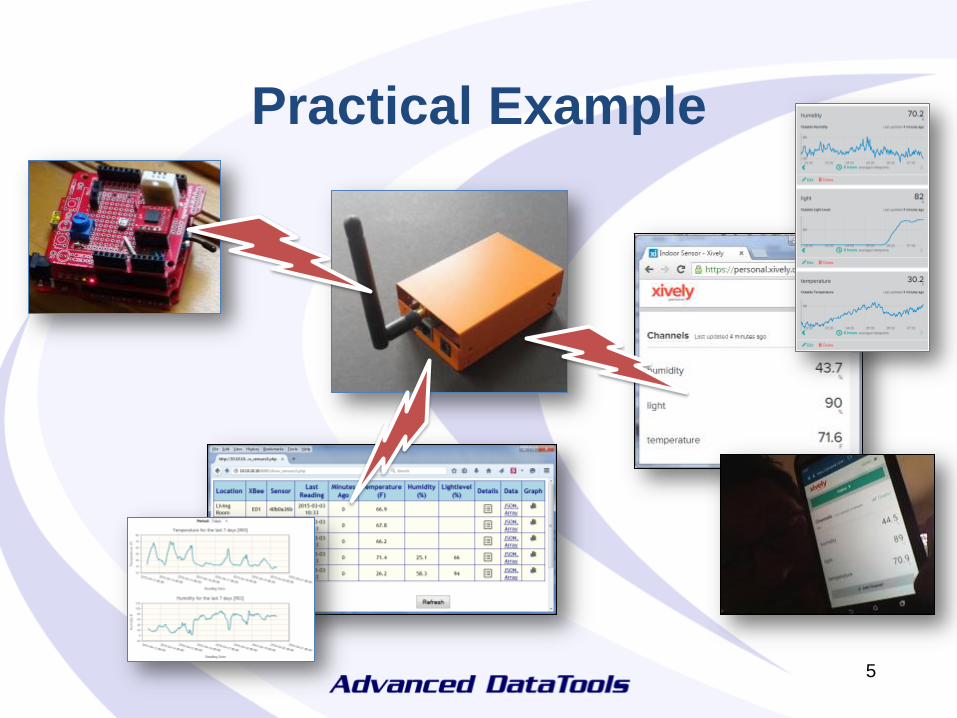
Practical Example
5

Smart Gateway
Sensor Data and Gateway
6
Sensors
XBee Radios
Mesh Network Control
Devices
Sensor
Readings

Sensor Data on Gateway
• What are we going to do with this data?
• Store it in the database…using TimeSeries
– Keep a history
– Local analytics
– Values accessible from multiple applications
7

IoT…The Problem with Data
• The Internet of Things – tens of billions of
devices, each generating many data
points over time
• Storing the data efficiently is important
– Fast saving
– Fast retrieval
– Maximize storage efficiency
8

Lots of Data!
By mid-2014, 50 million Smart Meters had
been installed in the US (IEI Report, September 2014)
A single utility company with 5 million meters will still
generate over 175 billion readings each year if read
every 15 minutes
9
Number of Data Points in 1 Year Number of
Meters Read 1 x day Read 1 x hour Read 1 x 15 mins
50,000,000 18,250,000,000 438,000,000,000 1,752,000,000,000

TimeSeries
• TimeSeries is an efficient and fast way to store and access datapoints that have a time component
• Stores the data elements in columnar form
• Consider our sensor data:
– Simple data elements (temperature, humidity, etc)
– Readings arrive at regular intervals with timestamps
• TimeSeries is included with ALL editions of Informix – it is not an add-on
10

Sensor Data Traditional Relational Model
11
Sensor Id 40b0a36b
Sensor Name R01
Sensor
Location
Living
Room
Sensor Id 40b0a36b
Timestamp 2014-04-14
11:30
Temperature 69.50 Sensor Id 40b0a36b
Timestamp 2014-04-14
11:31
Temperature 69.75 Sensor Id 40b0a36b
Timestamp 2014-04-14
11:32
Temperature 70.00
Parent key value
is repeated for
each reading
Do we need the
timestamp?
Overhead for
each record
saved
The value is all we
want!

Sensor Data
TimeSeries Model
– Store all of the readings in the SAME record
– Append them to the TimeSeries column
12
Sensor Id 40b0a36b
Sensor Name R01
Sensor Location Living Room
Temperature 69.50, 69.75, 70.00, …
– With a regular timestamp, if we know the start
time of readings, we can work out the
timestamp of any reading by its offset.
TimeSeries
Column

What does a TimeSeries Look Like?
The values are stored in a single column
sensor_id 40b79f8e
xbee_name R03
sensor_location Arduino Sensor 2
sensor_data origin(2015-01-18 18:30:00.00000), calendar(ts_1min), containe
r(sensor_container), threshold(0), regular, [NULL, NULL, NULL,
NULL, NULL, NULL, NULL, NULL, NULL, (66.6 ,38.7 ,67 ), (
65.3 ,40.2 ,67 ), (63.9 ,42.2 ,67 ), (63.3 ,42.7 ,
66 ), (62.6 ,43.7 ,67 ), (62.1 ,45.0 ,66 ), (61.5
,45.6 ,66 ), (61.2 ,46.6 ,67 ), (60.8 ,47.1 ,67
), (60.3 ,48.1 ,67 ), (60.1 ,48.1 ,67 ), (59.7 ,4
8.2 ,67 ), (59.5 ,49.2 ,67 ), (59.4 ,48.7 ,67 ),
...
13
Consider our utility company with 5 million smart meters…
They will only have 5 million records in their “meter” table, regardless of
how many “readings” they store

Creating a TimeSeries 1. Create a Calendar Pattern
– Defines valid time intervals for timeseries data
2. Create a Calendar Table, referencing the Pattern – Defines a calendar based on start date/time &
pattern
3. Create a Row Type to store the timeseries
4. Create a Container for the TimeSeries data, referencing the Row Type – Specifies where the timeseries data is stored
5. Create a Table with a TimeSeries column, using the Row Type
14

Creating a TimeSeries –
1: Calendar Pattern Defines valid time intervals for TimeSeries
data
Example:
To store employee hours over a week that is only
Mon-Fri, the pattern would be defined as:
INSERT INTO CalendarPatterns
VALUES('workweek_day',
'{1 off, 5 on, 1 off}, day');
15
Assuming the calendar will begin on a Sunday

Creating a TimeSeries –
2: Calendar Table The calendar uses the supplied pattern and a
start date to know what are valid entries and to
define the format of the stored data
Example:
INSERT INTO CalendarTable
(c_name, c_calendar)
VALUES ('weekcal',
'startdate(2014-04-13 00:00:00.00000),
pattstart(2014-04-13 00:00:00.00000),
pattname(workweek_day)');
16
Needs to be
a Sunday to
match the
pattern

Creating a TimeSeries –
3: Row Type Row that will be used to store the timestamp
and data elements for that timestamp
Example:
create row type hours_worked(
timestamp datetime year to fraction(5),
num_hours decimal(4,2)
);
17
Must have this level
of precision This is what we
want to store

Creating a TimeSeries –
4: Container Specify where the TimeSeries rows are to be
stored
Example:
execute procedure TSContainerCreate
('hours_container',
'datadbs',
'hours_worked',
0, 0);
18
Row Type
DBSpace

Creating a TimeSeries –
5: Table Table containing the Row Type to store the
TimeSeries
Example:
create table emp_hours_worked (
empid integer,
emp_hours TimeSeries(hours_worked)
);
19
Row Type

Creating a TimeSeries –
New Record Create the TimeSeries when insert the record
Example:
insert into emp_hours_worked values (
1,
TSCreate('weekcal',
'2014-04-13 00:00:00.00000', 0, 0, 0,
'hours_container')
);
This is a REGULAR TimeSeries [use TSCreateIrr for irregular]
20
Calendar
Container

Creating a TimeSeries –
New Record Empty TimeSeries record – what does it look
like?
empid 1
emp_hours
origin(2014-04-14 00:00:00.00000),
calendar(weekcal),
container(hours_container),
threshold(0), regular, []
21
Start date got bumped
forward because it was
created on a non-work day
No TS data yet

Creating a TimeSeries –
Insert Data
We UPDATE the row to add TimeSeries data, because we are modifying the TimeSeries column
update emp_hours_worked
set emp_hours = PutElem(emp_hours,
row("2014-04-14 00:00:00",8)::hours_worked)
where empid = 1;
update emp_hours_worked
set emp_hours = PutElem(emp_hours,
row("2014-04-18 17:00:00",8.25)::hours_worked)
where empid = 1;
22
Monday
Friday
The time is of no relevance in
this example as the calendar
pattern uses a unit of DAY

Creating a TimeSeries –
Insert Data The Calendar will prevent timestamps that
don’t match the pattern
update emp_hours_worked
set emp_hours = PutElem(emp_hours,
row("2014-04-19 17:00:00",7.50)::hours_worked)
where empid = 1;
# ^
#(UTSBB) - Timestamp 2014-04-19 17:00:00.00000 is not a
valid day in calendar.
#
23
Saturday

Creating a TimeSeries
Reviewing the TimeSeries data
update emp_hours_worked
set emp_hours = PutElem(emp_hours,
row("2014-04-21 17:00:00", 7.75)::hours_worked)
where empid = 1;
empid 1
emp_hours
origin(2014-04-14 00:00:00.00000),
calendar(weekcal), container(hours_container),
threshold(0), regular,
[(8.00 ), NULL, NULL, NULL, (8.25 ), (7.75 )]
24
Monday
Mon Tue Wed Thu Fri Mon
One value stored
for each valid day
of the Calendar

Creating a TimeSeries for Sensor
Data Create the structures to store the sensor information and TimeSeries
[Not creating a Calendar in this example – instead use a predefined one when create the timeseries]
#1 – Row Type
create row type sensor_reading(
timestamp datetime year to fraction(5),
temperature decimal(4,1),
humidity decimal(4,1),
lightlevel smallint
);
25

Creating a TimeSeries for Sensor
Data
#2 – Table
create table sensor(
sensor_id char(8),
xbee_name char(3),
sensor_location char(20),
sensor_data TimeSeries(sensor_reading)
);
26
Row Type

Creating a TimeSeries for Sensor
Data
#3 – Container
execute procedure TSContainerCreate
('sensor_container',
'sensordbs',
'sensor_reading',
0,
0);
27

Creating a TimeSeries for Sensor
Data Create the records for the sensors – one for
each sensor
insert into sensor values (
"40b79f8e",
"R03",
"Arduino Sensor 2",
TSCreate(
'ts_1min',
'2015-01-18 18:30:00.00000',
0, 0, 0,
'sensor_container'));
28
Predefined calendar –
new value each minute
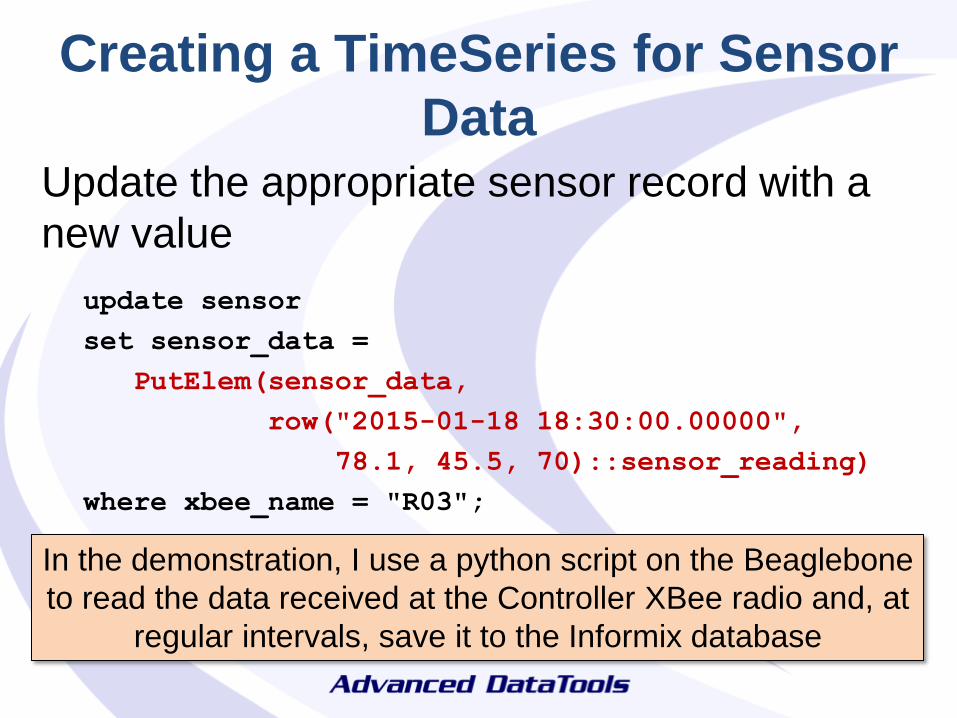
Creating a TimeSeries for Sensor
Data Update the appropriate sensor record with a
new value
update sensor
set sensor_data =
PutElem(sensor_data,
row("2015-01-18 18:30:00.00000",
78.1, 45.5, 70)::sensor_reading)
where xbee_name = "R03";
In the demonstration, I use a python script on the Beaglebone
to read the data received at the Controller XBee radio and, at
regular intervals, save it to the Informix database

Viewing TimeSeries Sensor Data
Query the table
select *
from sensor
where xbee_name matches "R03";
The values are stored in a single column
sensor_id 40b79f8e
xbee_name R03
sensor_location Arduino Sensor 2
sensor_data origin(2015-01-18 18:30:00.00000), calendar(ts_1min), containe
r(sensor_container), threshold(0), regular, [NULL, NULL, NULL,
NULL, NULL, NULL, NULL, NULL, NULL, (66.6 ,38.7 ,67 ), (
65.3 ,40.2 ,67 ), (63.9 ,42.2 ,67 ), (63.3 ,42.7 ,
66 ), (62.6 ,43.7 ,67 ), (62.1 ,45.0 ,66 ), (61.5
,45.6 ,66 ), (61.2 ,46.6 ,67 ), (60.8 ,47.1 ,67
), (60.3 ,48.1 ,67 ), (60.1 ,48.1 ,67 ), (59.7 ,4
8.2 ,67 ), (59.5 ,49.2 ,67 ), (59.4 ,48.7 ,67 ),
...
30

Viewing TimeSeries Sensor Data
Query values for a timestamp
select
sensor_id,
xbee_name,
GetElem(sensor_data, '2015-01-18 18:40:00') as readings
from sensor
where xbee_name matches "R03";
The values are returned as the custom type
sensor_id 40b79f8e
xbee_name R03
readings ROW('2015-01-18 18:40:00.00000',65.3 ,40.2 ,67 )
31

Virtual Table Interface
Using a Virtual Table Interface (VTI) simplifies the
use of TimeSeries data by displaying the data in a
relational format
– Each TimeSeries element can be treated as a “row” of
data through the VTI
execute procedure tscreatevirtualtab(
'sensor_vti',
'sensor');
32
VTI to create
TimeSeries table to
create the VTI on

Querying the VTI select *
from sensor_vti
where sensor_location = "Arduino Sensor 2"
sensor_id 40b79f8e
xbee_name R03
sensor_location Arduino Sensor 2
timestamp 2015-01-18 18:39:00.00000
temperature 66.6
humidity 38.7
lightlevel 67
sensor_id 40b79f8e
xbee_name R03
sensor_location Arduino Sensor 2
timestamp 2015-01-18 18:40:00.00000
temperature 65.3
humidity 40.2
lightlevel 67
sensor_id 40b79f8e
xbee_name R03
sensor_location Arduino Sensor 2
timestamp 2015-01-18 18:41:00.00000
temperature 63.9
humidity 42.2
lightlevel 67
33
Timestamps
and data
values broken
into individual
records
Looks Relational!
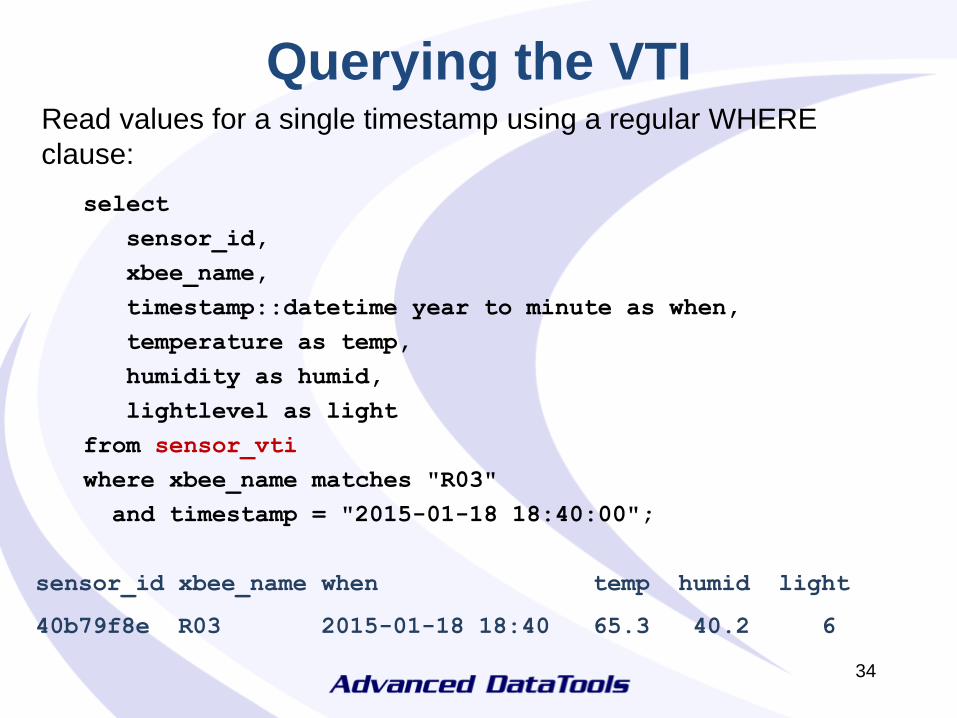
Querying the VTI Read values for a single timestamp using a regular WHERE
clause:
select
sensor_id,
xbee_name,
timestamp::datetime year to minute as when,
temperature as temp,
humidity as humid,
lightlevel as light
from sensor_vti
where xbee_name matches "R03"
and timestamp = "2015-01-18 18:40:00";
sensor_id xbee_name when temp humid light
40b79f8e R03 2015-01-18 18:40 65.3 40.2 6
34

Expression-Based VTI
Create a VTI based off an expression
Example: Can use this to simplify the averaging of our sensor data
execute procedure tscreateexpressionvirtualtab(
'sensor_hourly_vti',
'sensor',
'AggregateBy(
"avg($temperature),avg($humidity),avg($lightlevel)",
"ts_1hour", sensor_data,0)',
'sensor_reading',
1,
'sensor_data'
);
35
Using a different
Calendar

Querying the Expression-Based VTI select *
from sensor_hourly_vti
where sensor_location = "Arduino Sensor 2"
sensor_id 40b79f8e
xbee_name R03
sensor_location Arduino Sensor 2
timestamp 2015-01-18 18:00:00.00000
temperature 60.9
humidity 46.8
lightlevel 66
sensor_id 40b79f8e
xbee_name R03
sensor_location Arduino Sensor 2
timestamp 2015-01-18 19:00:00.00000
temperature 57.2
humidity 50.9
lightlevel 66
sensor_id 40b79f8e
xbee_name R03
sensor_location Arduino Sensor 2
timestamp 2015-01-18 20:00:00.00000
temperature 57.0
humidity 49.0
lightlevel 66
36
Now see one
timestamp
each hour and
values are
averaged

TimeSeries Row Type
• Our Row Type allows us to store three values: – Temperature
– Humidity
– Light Level
• Some sensors just send temperature
• Lots of NULL values in the TimeSeries
... (69.6 ,NULL,NULL), (69.1 ,NULL,NULL), (69.8 ,N
ULL,NULL), (69.6 ,NULL,NULL), (69.6 ,NULL,NULL), (69.6 ,NUL
L,NULL), (69.6 ,NULL,NULL), (69.6 ,NULL,NULL), (69.6 ,NULL,
NULL), (69.6 ,NULL,NULL), (69.8 ,NULL,NULL), (69.1 ,NULL,NU
LL), (69.8 ,NULL,NULL), (69.8 ,NULL,NULL), (69.8 ,NULL,NULL
), (69.8 ,NULL,NULL), (70.0 ,NULL,NULL), (70.0 ,NULL,NULL),
(70.0 ,NULL,NULL), (70.0 ,NULL,NULL), (70.0 ,NULL,NULL), ...
37

TimeSeries Data
• Good use case for JSON
– Key-value pairs. Example:
{ {"temperature":"70.2"}, {"humidity":"45.0"} }
– Only store the elements that are received
– Can add new sensors easily, e.g.
{"volume":"22"}
– Informix 12.10.xC4 supports JSON data in
TimeSeries
38

Display the Sensor Data
Query to show the latest value for each sensor, with
the timestamp and data values as separate fields:
select
trim(rtab.sensor_location)::char(15) sensor_location,
rtab.xbee_name,
rtab.sensor_id,
rtab.lastval.timestamp::datetime year to minute last_reading,
rtab.lastval.temperature temp,
rtab.lastval.humidity humid,
rtab.lastval.lightlevel light
from
(select sensor_id,
xbee_name,
sensor_location,
GetLastElem(sensor_data) lastval
from sensor) as rtab
order by rtab.xbee_name;
39

Display the Sensor Data
The latest values for each sensor
sensor_location xbee_name sensor_id last_reading temp humid light
Living Room E01 40b0a36b 2015-03-01 21:22 67.5
Dining Room E03 40b0a058 2015-03-01 21:22 69.1
Secret Bunker E05 40ad72c1 2015-03-01 21:22 68.5
Arduino Sensor R01 40a09c56 2015-03-01 21:23 71.2 25.3 4
Arduino Sensor R03 40b79f8e 2015-03-01 21:22 25.9 55.5 6
5 row(s) retrieved.
40
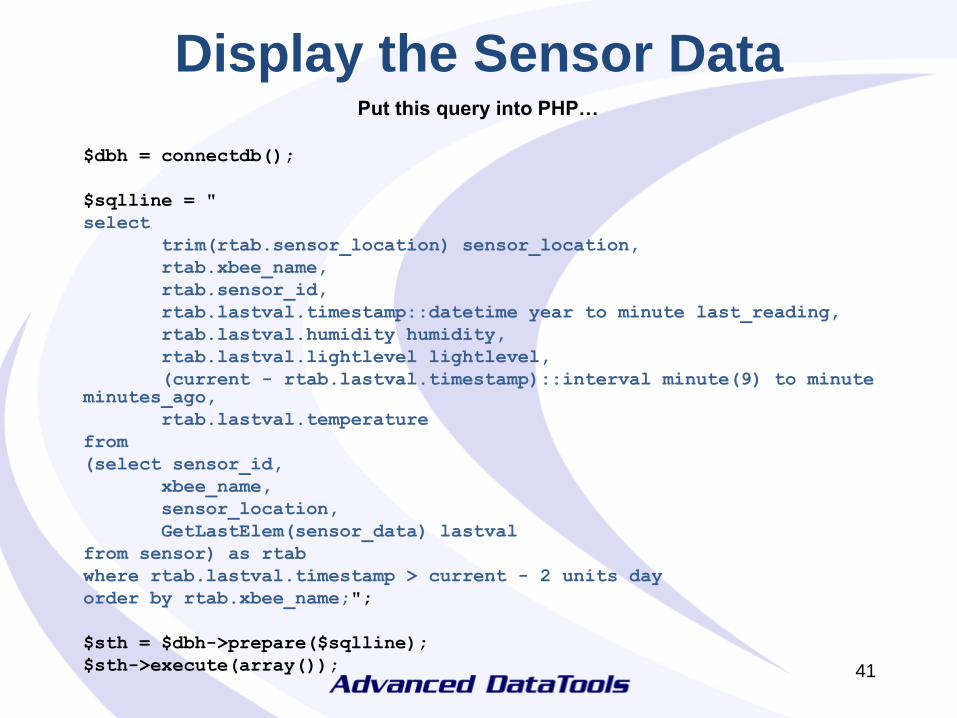
Display the Sensor Data Put this query into PHP…
$dbh = connectdb();
$sqlline = "
select
trim(rtab.sensor_location) sensor_location,
rtab.xbee_name,
rtab.sensor_id,
rtab.lastval.timestamp::datetime year to minute last_reading,
rtab.lastval.humidity humidity,
rtab.lastval.lightlevel lightlevel,
(current - rtab.lastval.timestamp)::interval minute(9) to minute minutes_ago,
rtab.lastval.temperature
from
(select sensor_id,
xbee_name,
sensor_location,
GetLastElem(sensor_data) lastval
from sensor) as rtab
where rtab.lastval.timestamp > current - 2 units day
order by rtab.xbee_name;";
$sth = $dbh->prepare($sqlline);
$sth->execute(array());
41
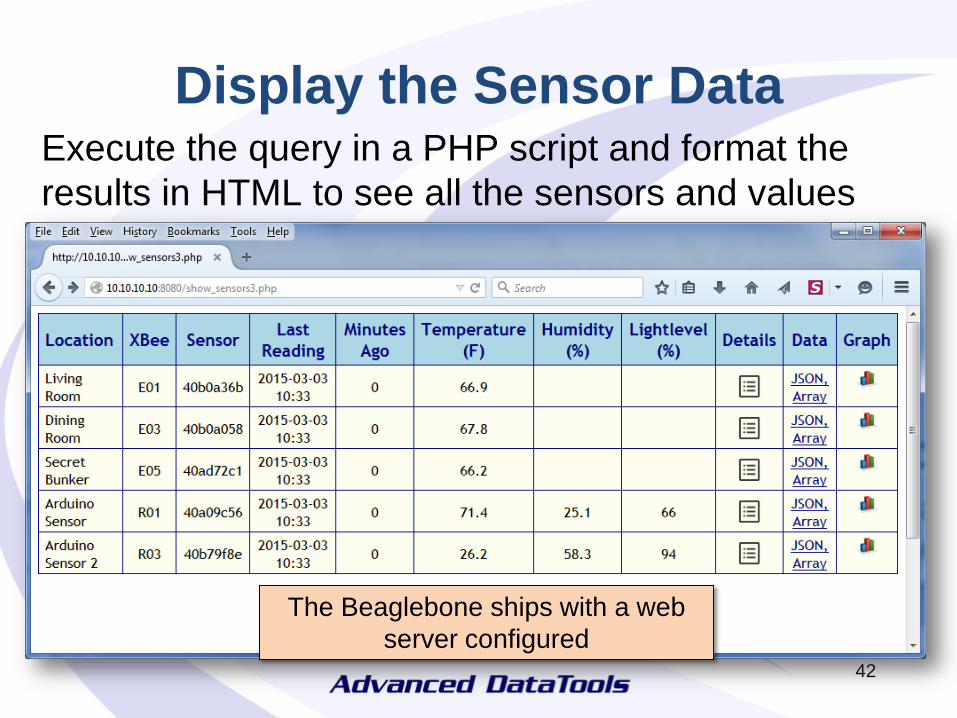
Display the Sensor Data Execute the query in a PHP script and format the
results in HTML to see all the sensors and values
42
The Beaglebone ships with a web
server configured

Display the Sensor Data Run queries against the TimeSeries sensor data and
display…
43

Graph using Array of TimeSeries
Values
44
Graphs
produced by the
jqplot jQuery
plugin, reading
a JSON data
source
The VTI on
expression can
be used to
aggregate the
data over
different time
periods

Outside the Box
• The TimeSeries data is stored on the Smart
Gateway
• The queries run locally…
• The web pages are served locally...
45
But this is the Internet of Things… I want to view my data from anywhere…and on my fancy
smartphone!!

Publishing the Sensor
Data to the Cloud
• Use one of several sites that allow data to be
posted to a remote server
• Information can be retrieved from the site and
viewed anywhere
• Site provides APIs to post data and view data
• Can also set triggers, view location, etc
46

Publishing the Sensor Data
Example with xively.com in Python
import xively
.
api = xively.XivelyAPIClient("qPy5…0")
feed = api.feeds.get(818865217)
.
now = datetime.datetime.utcnow()
feed.datastreams = [
xively.Datastream(id='temp', current_value=sensor[f]['temp'], at=now),
xively.Datastream(id='light',current_value=sensor[f]['light'], at=now),
xively.Datastream(id='humidity', current_value=sensor[f]['humidity'],
at=now),
xively.Datastream(id='dial', current_value=sensor[f]['dial'], at=now),
xively.Datastream(id='switch', current_value=switchpos, at=now),
xively.Datastream(id='heading', current_value=sensor[f]['heading'], at=now),
]
feed.update()
47

PUT using JSON {
"datastreams": [
{
"id": "temperature",
"datapoints": [
{
"at": "2015-03-01T20:20:00-07:00",
"value": "71.6"
},
{
"at": "2015-03-01T20:21:00-07:00",
"value": "71.6"
}
]
},
{
"id": "humidity",
"datapoints": [
{
"at": "2015-03-01T20:20:00-07:00",
"value": "26.1"
},
{
"at": "2015-03-01T20:21:00-07:00",
"value": "26.0"
}
]
},
{
"id": "light",
"datapoints": [
{
"at": "2015-03-01T20:20:00-07:00",
"value": "5"
},
{
"at": "2015-03-01T20:21:00-07:00",
"value": "5"
}
]
}
],
"version": "1.0.0"
} 48

Viewing the Sensor Data on the Web
Immediately view the
data on a webpage:
https://personal.xively.com/feeds/351628128
49

Viewing the Sensor Data on the Web
50

Use APIs to Pull Data from Cloud http://api.xively.com/v2/feeds/351628128.json?&key=n1AqEZak5r7Hbj2q7
5vTTsRrnJjHTuOan8oLTrCAf7LAyqVz
Returns a JSON object containing the current
values of each datastream.
Display on a web page:
51
{"id":351628128,"title":"Outdoor
Sensor","private":"false","feed":"https://api.xively.com/v2/feeds/351628128.json","auto_feed_url":"https://api.xively.com/v2/feeds/351628128.json","statu
s":"live","updated":"2015-03-04T00:20:10.055886Z","created":"2015-01-
27T18:52:29.627560Z","creator":"https://xively.com/users/mikeeew","version":"1.0.0","datastreams":[{"id":"humidity","current_value":"57.4","at":"2015-
03-04T00:19:00.000000Z","max_value":"96.4","min_value":"0.0","tags":["Outside
Humidity"],"unit":{"symbol":"%","label":"Percent"}},{"id":"light","current_value":"82","at":"2015-03-
04T00:19:00.000000Z","max_value":"100.0","min_value":"1.0","tags":["Outside Light Level"],"unit":{"symbol":"%","label":"Percentage of
Max"}},{"id":"temperature","current_value":"23.2","at":"2015-03-04T00:19:00.000000Z","max_value":"88.3","min_value":"-1.5","tags":["Outside
Temperature"],"unit":{"symbol":"F","label":"Degrees F"}}],"product_id":"6qbhiTM74LELhDvwuZ4H","device_serial":"MK4GFWRYW9EN"}

Use APIs to Pull Data from Cloud
https://api.xively.com/v2/feeds/351628128/datastreams/temperature.png?
duration=24hours&limit=1000&c=2188c5&g=true&s=4&b=true&t=Outside
%20Temperature&w=600&h=200&timezone=Mountain%20Time%20%28
US%20%26%20Canada%29
Returns a PNG graph of the “temperature” datastream:
52

Use the APIs on a
Webpage
View from anywhere!
http://mybackyard.altervista.org
53

IBM Internet of Things
Foundation
• IBM have created their own, cloud-
hosted service for IoT
• Part of the IBM Bluemix platform
• Uses Informix TimeSeries
54
Bluemix
• Cloud based services
• Pick and choose what you
want
55

Bluemix - IoT
56
Add the Internet of
Things Service

Internet of Things Foundation
• Register a Device
57
• Use MQTT protocol to send messages to
IoTF in the cloud

Internet of Things Foundation
58
Recipes to help
connect different
devices
https://developer.ibm.com/iotfoundation/

Node-RED
• Create “flows” using a browser
• Choose and configure different events and outputs
• Uses node.js
• Can run on Raspberry Pi and Beaglebone
59
http://nodered.org/

Links
Solving Business Problems with Informix TimeSeries RedBook:
http://www.redbooks.ibm.com/redbooks/pdfs/sg248021.pdf
TimeSeries Data User’s Guide:
http://www-01.ibm.com/support/knowledgecenter/SSGU8G_12.1.0/com.ibm.tms.doc/tms.htm
IoT on Bluemix:
https://console.ng.bluemix.net/solutions/iot
Docker – Informix Container:
https://registry.hub.docker.com/u/ibmcom/informix-innovator-c/
60

Next Webcast
Running an Informix Database Server on an ARM Computer – June 23rd, 2 PM EDT
Thomas Beebe
Since IBM released Informix for the ARM platform, it has become a marriage of two great technologies: the small, fast, low-power, affordable solution of ARM chips paired with the high-performance, low-footprint, low-maintenance, and high-stability of the Informix database engine.
This presentation will cover the features and benefits of running Informix on ARM, how to begin working with it, and what hardware can be used. This isn't just for hardware developers; anyone who tinkers with hardware, IoT, or could use more portable and flexible computing can benefit from the pairing of ARM and Informix.
61


