Page 1
Using Latent Profile Analysis to Derive a
Classification of Four-Year Colleges and Universities
by
Kyle Joseph Whitman
A Dissertation Presented in Partial Fulfillment
of the Requirements for the Degree
Doctor of Philosophy
Approved July 2020 by the
Graduate Supervisory Committee:
Michael Crow, Co-Chair
Derrick Anderson, Co-Chair
Spiro Maroulis
ARIZONA STATE UNIVERSITY
August 2020
Page 2
i
ABSTRACT
Organizational classifications are critical to a wide variety of stakeholders. Within
the domain of higher education, researchers use established classifications for sample
selection or within empirical models to account for unobserved organizational
characteristics. Colleges and universities, as well as their political principals, often use
classifications to form peer-groups and reference sets through which organizational
performance is assessed. More broadly, classifications provide aspirational archetypes to
an organizational field.
Using American higher education as the empirical context, this dissertation
introduces Latent Profile Analysis (LPA) as a method to identify the structure of an
organizational field and to classify organizations within this structure. Using measures of
model fit and concerns for interpretability, this investigation determined that 13
distinctive organizational designs are present in the field of American higher education.
Derived groupings are compared to the 2018 Basic Classification from the Carnegie
Classification of Institutions of Higher Education. Opportunities and challenges for
operationalizing this derived classification are discussed.
Page 3
ii
DEDICATION
I dedicate this dissertation to my family. I am greatly appreciative towards my
mother and father, Barbara and Steven, and sister, Natalie, for all they have done to give
me every opportunity to learn and grow.
Page 4
iii
ACKNOWLEDGEMENTS
I would like thank Michael Crow, Derrick Anderson, and Spiro Maroulis for their
support, feedback, and encouragement throughout my graduate school experience at
Arizona State University.
I would also like to express my appreciation to all the other wonderful educators
and professors I have been lucky to have while progressing through the public education
system of Arizona. My success is directly connected to their efforts and dedication.
Page 5
iv
TABLE OF CONTENTS
Page
LIST OF TABLES ............................................................................................................. ix
LIST OF FIGURES .............................................................................................................x
CHAPTER
1 INTRODUCTION ........................................................................................................1
The Carnegie Classification ......................................................................................... 2
History and Background ............................................................................................2
Methodology of the 2018 Basic Classification .........................................................3
Impacts and Significance of the Basic Classification................................................5
Purpose of the Present Study ........................................................................................ 9
Significance of the Study ............................................................................................. 9
Academic Research on Higher Education ...............................................................10
University Strategy ..................................................................................................11
Performance Assessment .........................................................................................12
2 LITERATURE REVIEW ...........................................................................................15
Introduction ................................................................................................................ 15
Taxonomy, Classification, and Human Progress ....................................................... 15
Organizational Taxonomy and Classification .........................................................17
Page 6
v
CHAPTER Page
Emerging Approaches to University Classification ................................................... 19
Theory......................................................................................................................20
Samples and Data ....................................................................................................21
Methods and Results................................................................................................22
Conclusion ...............................................................................................................24
Perspectives on Organizational Classification within the Field of Public
Administration ............................................................................................................... 25
The Generic Approach ............................................................................................26
The Core Approach .................................................................................................27
Publicness: Dimensional and Realized ....................................................................28
Realized Publicness in Public Administration Research ............................................ 31
Realized Publicness as Dependent Variable ............................................................33
Significant Findings of the Realized Publicness Literature ....................................35
Assessment of the Realized Publicness Literature .....................................................39
Realized Publicness of Higher Education Organizations ........................................... 41
Access to Learning Environments ...........................................................................42
Production of New Knowledge ...............................................................................44
Page 7
vi
CHAPTER Page
3 METHODOLOGY .......................................................................................................46
Population, Data Source, and Sample ........................................................................ 46
Unit of Analysis .......................................................................................................48
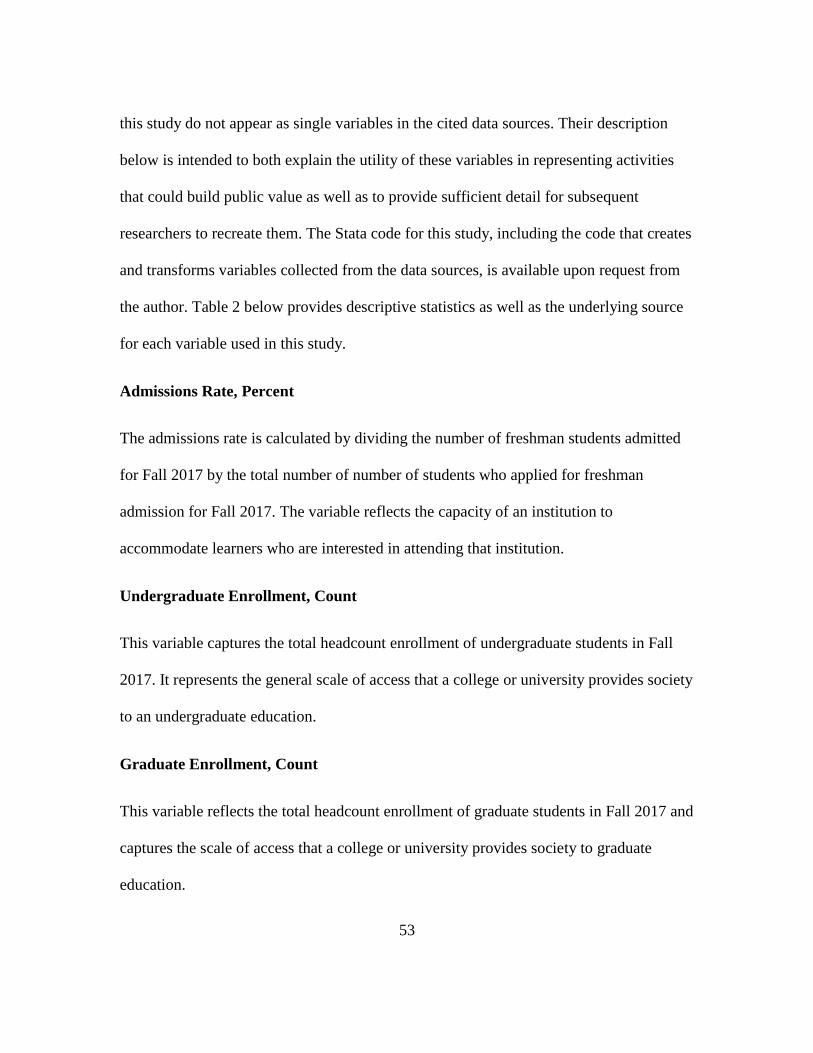
Variables Used in Study ..........................................................................................52
Statistical Method ....................................................................................................... 61
Latent Class and Latent Profile Analysis ................................................................61
Principled Model Building ......................................................................................64
Analytical Method of Present Study .......................................................................... 67
4 RESULTS ...................................................................................................................68
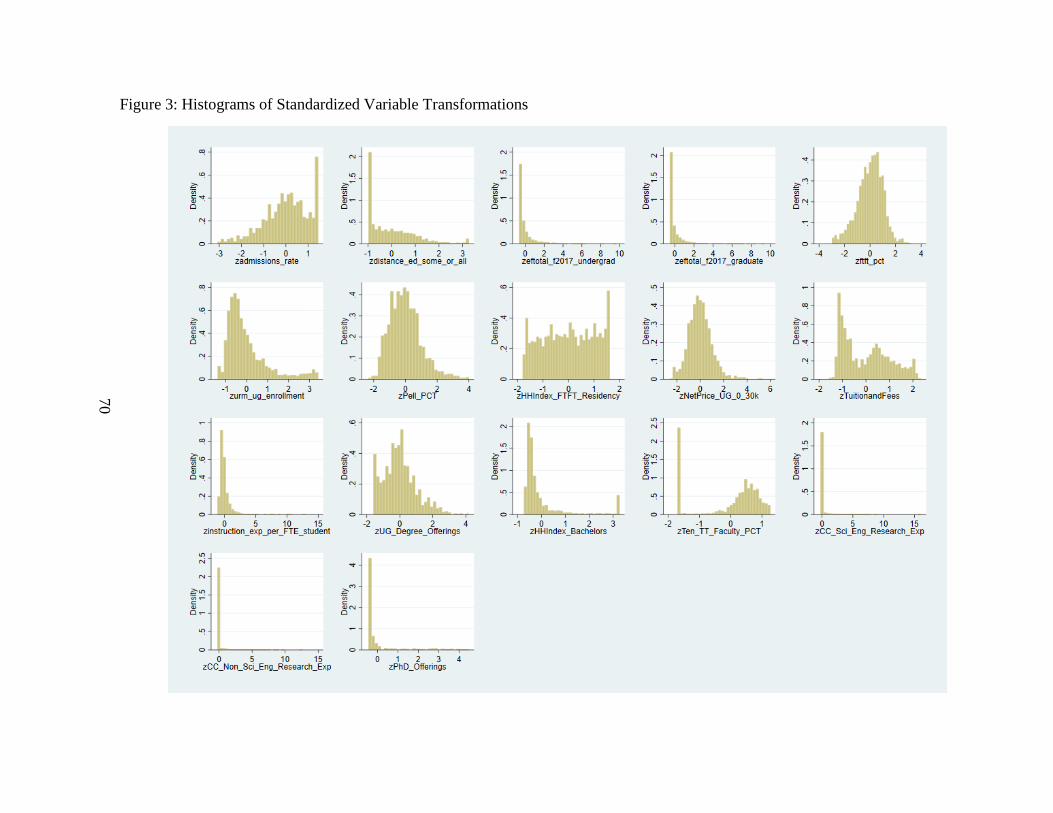
Model Specification ................................................................................................... 68
Model Identification ................................................................................................... 71
Class Enumeration...................................................................................................... 72
Classification .............................................................................................................. 73
Class Homogeneity ..................................................................................................74
Class Separation ......................................................................................................75
Description of 13 Classes ........................................................................................... 80
Class 1: Community-Scale Research Universities ..................................................80
Class 2: Professional Schools ..................................................................................82
Page 8
vii
CHAPTER Page
Class 3: National-Scale Research Universities........................................................83
Class 4: Legacy Access Universities .......................................................................85
Class 5: Classical Academies ..................................................................................86
Class 6: Community-Scale Access Colleges ...........................................................88
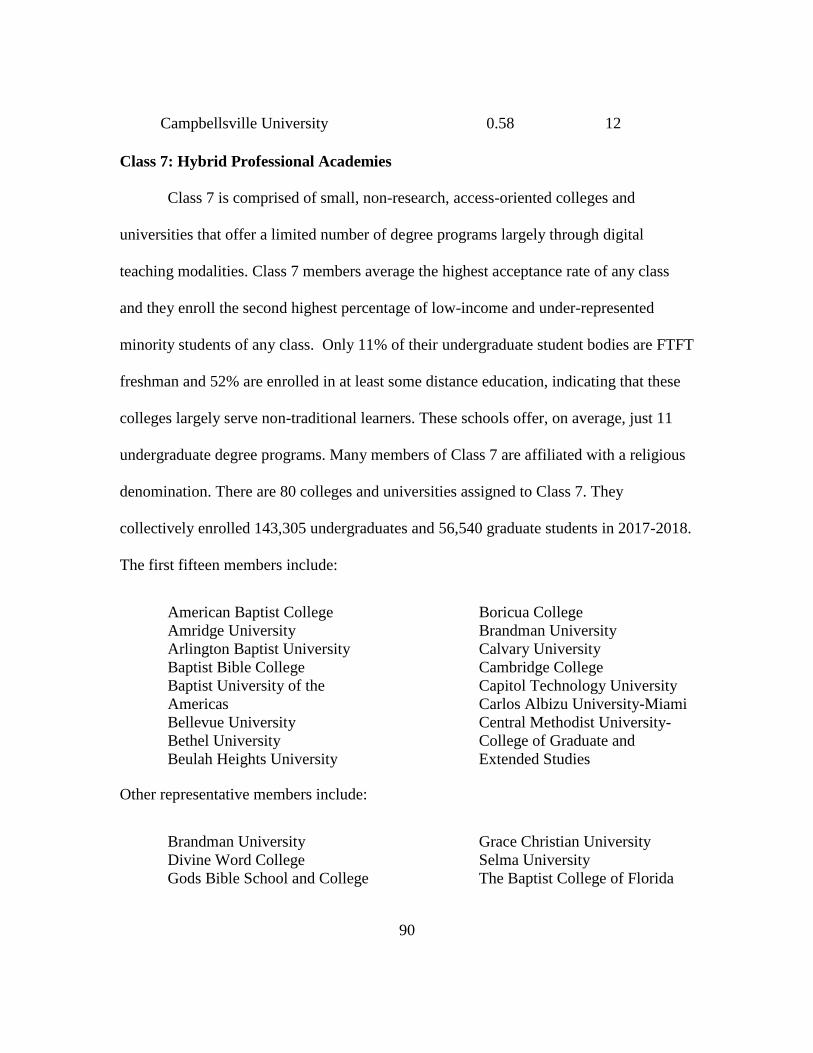
Class 7: Hybrid Professional Academies ................................................................90
Class 8: Community-Scale Liberal Arts Colleges ...................................................91
Class 9: Seminaries, Yeshivas, and Other Colleges of Divinity .............................92
Class 10: High-Intensity Research Universities ......................................................94
Class 11: National-Scale Digital Access Universities .............................................95
Class 12: Legacy Immersion Colleges and Universities .........................................96
Class 13: Regional-Scale Research Universities .....................................................97
Comparison of LPA results to 2018 Basic Carnegie Classification........................... 99
5 DISCUSSION ...........................................................................................................104
Latent Profile Analysis of College and University Data .......................................... 105
Limitations and Future Directions ........................................................................... 106
Conclusion ................................................................................................................ 108
REFERENCES ................................................................................................................110
Page 9
viii
APPENDIX Page
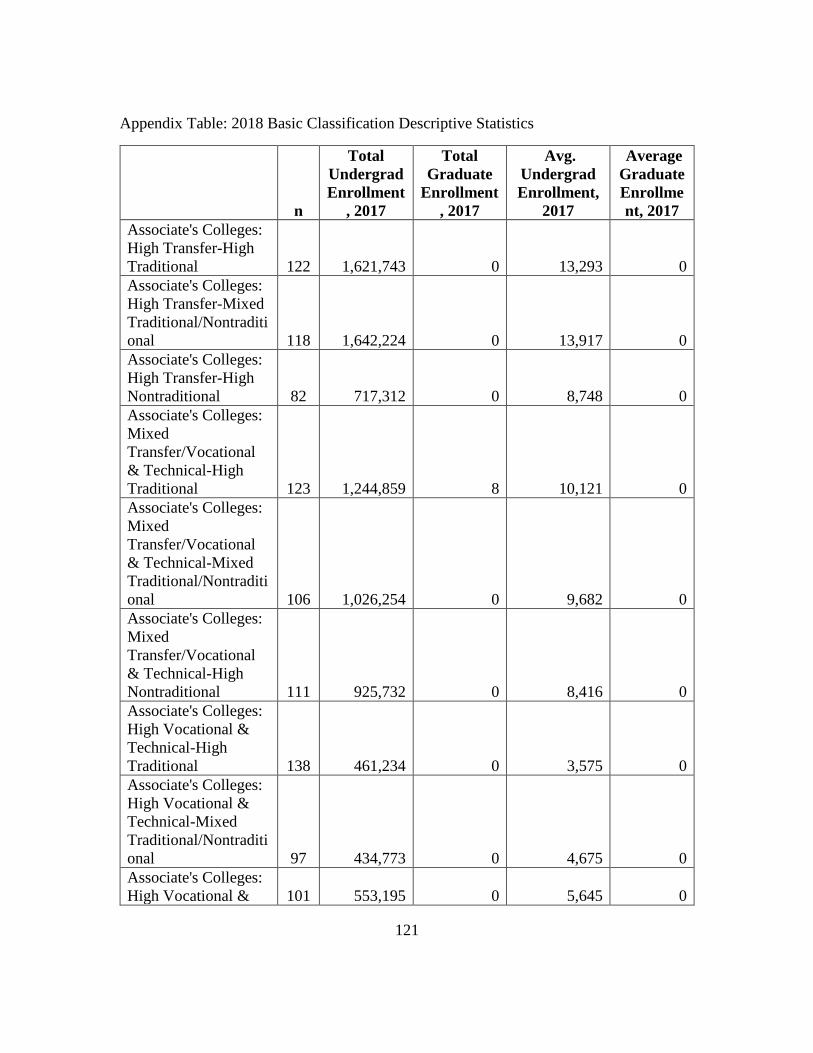
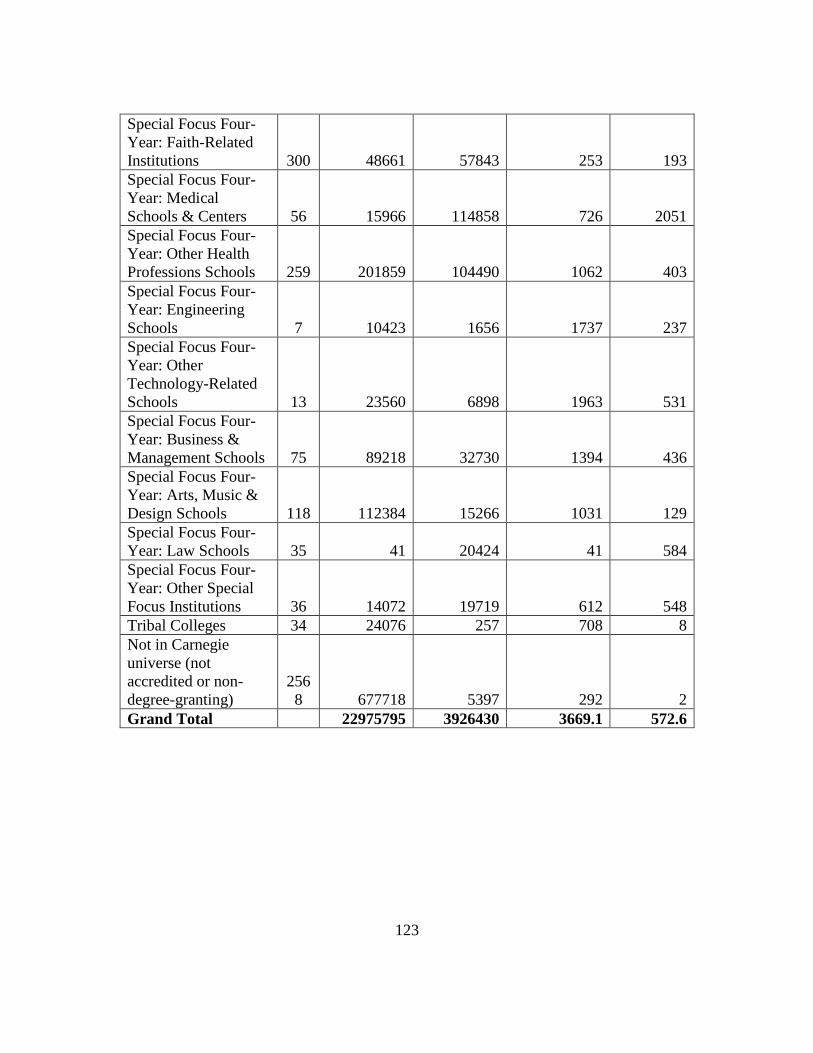
A 2018 BASIC CLASSIFICATION DESCRIPTIVE STATISTICS ..................120
B LPA MODEL OUTPUT .................................................................................124
Page 10
ix
LIST OF TABLES
Table Page
1: Realized Publicness Literature ...................................................................................... 37
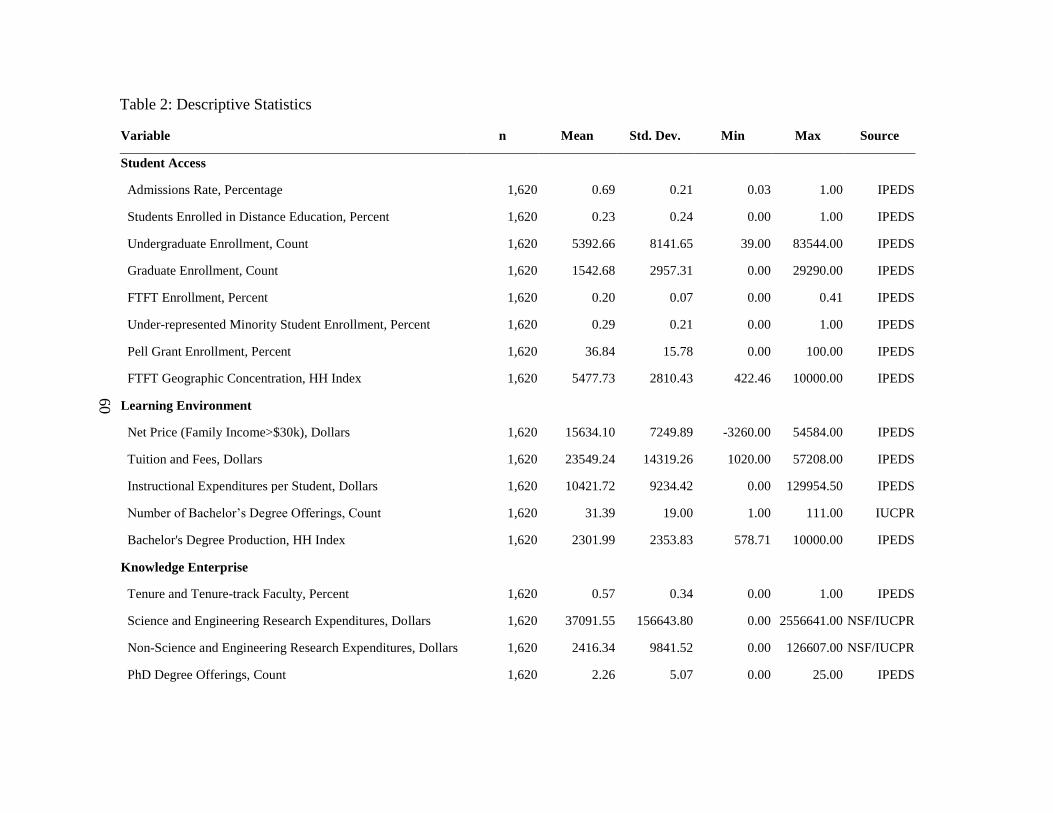
2: Descriptive Statistics..................................................................................................... 60
3: Log Likelihood Estimates for Classes with Different Starting Seeds .......................... 71
4: Class-specific Variable Means...................................................................................... 79
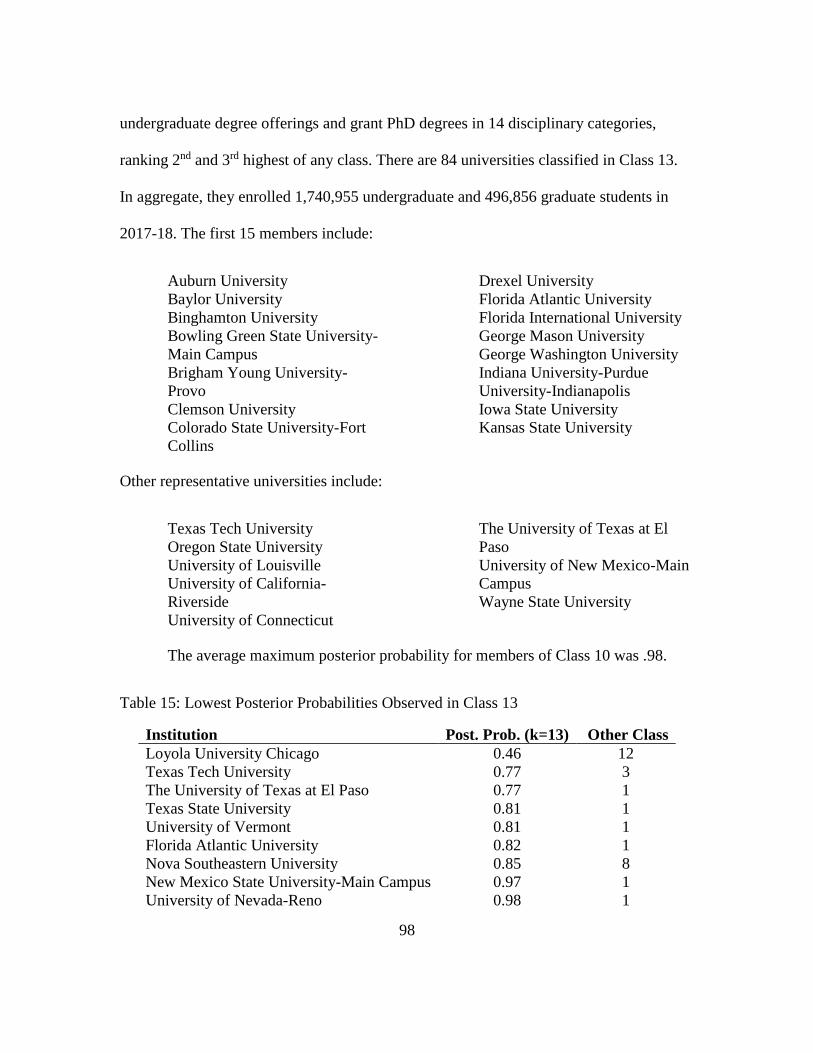
5: Lowest Posterior Probabilities Observed in Class 1 ..................................................... 82
6: Lowest Posterior Probabilities Observed in Class 2 ..................................................... 83
7: Lowest Posterior Probabilities Observed in Class 3 ..................................................... 85
8: Lowest Posterior Probabilities Observed in Class 4 ..................................................... 86
9: Lowest Posterior Probabilities Observed in Class 5 ..................................................... 88
10: Lowest Posterior Probabilities Observed in Class 6 ................................................... 89
11: Lowest Posterior Probabilities Observed in Class 7 ................................................... 91
12: Lowest Posterior Probabilities Observed in Class 8 ................................................... 92
13: Lowest Posterior Probabilities Observed in Class 9 ................................................... 93
14: Lowest Posterior Probabilities Observed in Class 12 ................................................. 97
15: Lowest Posterior Probabilities Observed in Class 13 ................................................. 98
16: Classification Comparison between 2018 Carnegie Classification and LPA Results
......................................................................................................................................... 100
Page 11
x
LIST OF FIGURES
Figure Page
1: 2018 Carnegie Classification: Basic Classification ........................................................ 7
2: Mixture Models............................................................................................................. 62
3: Histograms of Standardized Variable Transformations................................................ 70
4: Goodness-of-fit Statistics for Identified Models .......................................................... 73
5: Histogram of Posterior Probabilities for Class Membership ........................................ 74
6: Within-Class Standard Deviation of Manifest Variables by Class ............................... 77
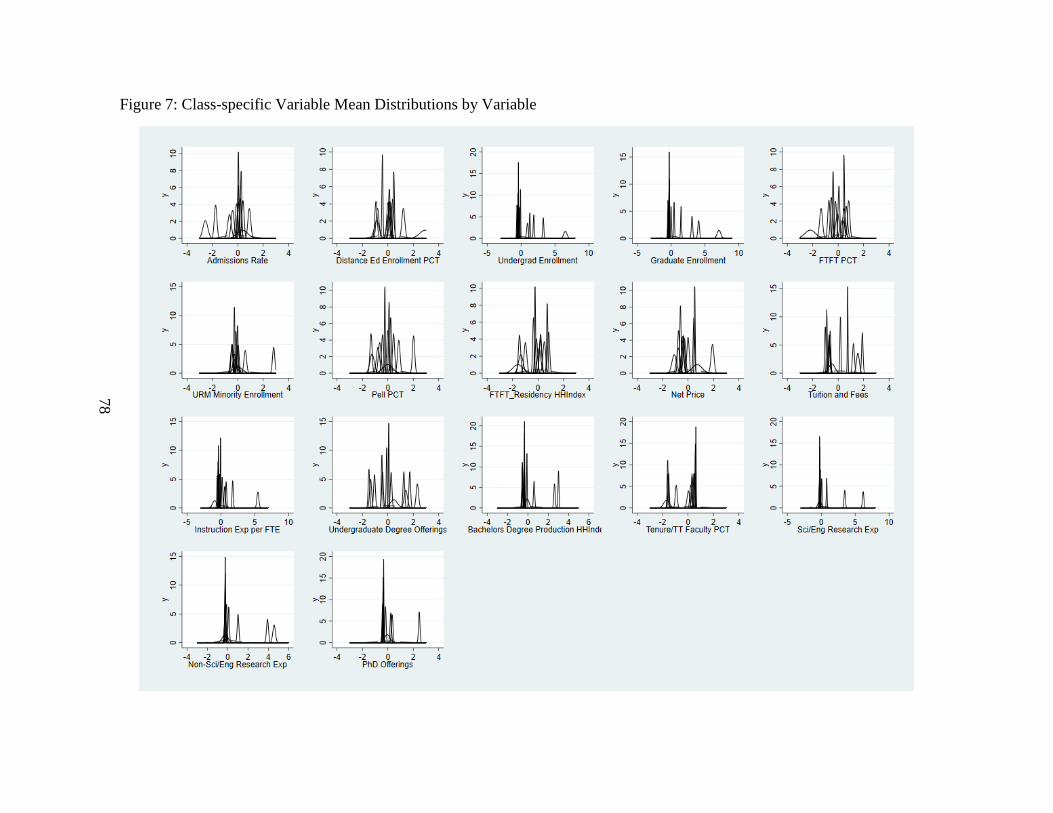
7: Class-specific Variable Mean Distributions by Variable ............................................. 78
8: Sankey Diagram Comparison between 2018 Carnegie Classification and LPA Results
......................................................................................................................................... 101
9: Histograms for Class-Specific Variable Standard Deviations by Classification ........ 102
Page 12
1
CHAPTER 1: INTRODUCTION
College and university classifications group organizations based on one or more
organizational characteristics. Examples of classifications include sector (public, private
not-for-profit, private for-profit), institution size, land grant status, historically black
college or university status, and tribal college status. The 2018 version of the Basic
Classification of the Carnegie Classification of Institutions of Higher Education uses
several organizational characteristics to classify organizations and is the most used and
influential classification in higher education (McCormick and Zhao 2005).
Higher education stakeholders use college and university classifications for a
wide range of activities. Researchers investigating phenomena occurring in higher
education settings often use classifications to create frames from which to draw samples
of colleges and universities. Empirical studies that include colleges and universities from
several classification categories often include classifications as control variables in
models to hold constant unobserved organizational characteristics. Higher education
stakeholders use classifications to form groups of colleges and universities for purposes
of goal-setting and performance assessment. In these contexts, the analytic utility of a
classification is directly related to its ability to create homogeneous groupings of colleges
and universities from the heterogeneous field of higher education. The categories
contained within a classification can also confer privileged status on members and cause
the classification status of a college or university to become the object of strategic action.
Page 13
2
College and university classifications have found little application in public
policy. Despite these organizations being instruments through with policy makers realize
public values, such as fostering intergenerational economic mobility or generating new
knowledge that spurs economic advance and improvements in quality of life, many
public policies pay little attention to the organizational designs of colleges and
universities. When college and university classifications are used in public policies, they
are often the broadest possible, such as sector. As such, the understanding that some
college and university designs—as captured through a classification—might be better or
worse than others at achieving important public values is not often incorporated in public
policies.
The Carnegie Classification
History and Background
The Carnegie Foundation for the Advancement of Teaching established the
Carnegie Commission on Higher Education in 1967 to advance recommendations to
strengthen U.S. higher education. As part of the analytical work underpinning their policy
recommendations, the Commission created a classification scheme of colleges and
universities. Realizing the potential utility, the Commission published it in 1971 “to be
helpful to many individuals and organizations that are engaged in research on higher
education” (Carnegie Commission on Higher Education 1971). Carnegie has updated the
“Basic Classification,” which is the most widely used classification among the various
classifications they have created in 1987, 1995, 2000, 2005, 2010, 2015, and 2018. In
Page 14
3
addition to the Basic Classification, Carnegie produces specialized college and university
classifications based on undergraduate instructional programs, graduate instructional
programs, enrollment profiles, size and setting, and community engagement. The
administration of the Classification is now housed at the Indiana University Center for
Postsecondary Research (Indiana University Center for Postsecondary Research 2019).
Methodology of the 2018 Basic Classification
The 2018 Basic Classification uses an algorithmic approach with a series of
yes/no questions to classify colleges and universities into discrete, pre-defined categories.
There are currently seven categories and 27 sub-categories. The classification algorithm
uses membership in the American Indian Higher Education Consortium, granting of
degrees in only one academic field, and conferral of only associate’s degrees to first
classify institutions into Tribal Colleges, Special Focus Colleges, and Associate’s
Colleges categories. Institutions not classified into these categories are then classified
into Doctoral Universities, Master’s Colleges and Universities, Baccalaureate Colleges or
Baccalaureate/Associate’s Colleges categories based on the level of doctoral degree and
master’s degree production. Figure 1 provides the full classification algorithm of the
2018 Basic Classification as provided by the Indiana University Center for Postsecondary
Research (Indiana University Center for Postsecondary Research 2019). Appendix A
provides descriptive statistics for all subcategories in the 2018 Basic Classification.
The sub-categorization of the Doctoral Universities category, which is comprised
of universities that confer more than 20 research doctorates or 30 professional doctorates
Page 15
4
per year, is noteworthy for its analytical complexity. Doctoral Universities that have less
than $5 million per year in research expenditures are sub-categorized as
Doctoral/Professional Universities. Doctoral universities with more than $5 million
dollars in research expenditures are sub-categorized into High Research Activity
Universities and Very High Research Activity Universities based on a “Research Activity
Index.”
The Research Activity Index uses aggregate and per-capita full-time faculty data
on 1.) science and engineering research expenditures; 2.) non-science and engineering
research expenditures; 3.) science and engineering research staff (such as post-doctoral
positions and non-faculty research staff); and 4.) research doctorate degree production.
All data are converted to rank scores. Aggregate and per-capita data sets are separately
analyzed with a principal components analysis. The first factors in each principal
components analysis are used to create index scores for each university. These bivariate
scores are plotted and universities are split into the High and Very High Research
Activity subcategories based on their position relative to a line determined by the minima
of each scale (Indiana University Center for Postsecondary Research 2019). Visual
inspection of these bivariate score plots does not indicate obvious clusters of
observations.
The methodology of the 2018 Carnegie Classification presents several concerns.
First, the results are not fully reproducible by other researchers (Kosar and Scott 2018),
despite the Indiana University Center for Postsecondary Research providing all
Page 16
5
underlying data on its website. This is largely due to the partitioning method used on
Research Activity Index data. Harmon et al. (2019) report that Carnegie uses hand-drawn
arcs to classify institutions “based on areas of ‘best separation’ in the groups.” Second,
classification results are unstable from year-to-year. A change in an institution’s
classification from one iteration of the classification to the next could occur for several
reasons. Possibilities include changes in the variables used in the classification, changes
in the variable thresholds in the classification algorithm, changes in the number of
institutions meeting selection criteria for classification (which is particularly important in
a relative-based classification procedure used on a small sample of institutions), changes
in the physical shape of the particular hand-drawn arc used to partition doctoral
institutions, and changes in university performance on the measured variables.
Impacts and Significance of the Basic Classification
Despite methodological concerns, the Basic Classification has had a significant
impact on U.S. higher education. The effects largely stem from users of the classification
interpreting the Carnegie Basic Classification subcategories as hierarchical and conflating
classification with performance assessment. Educational administrators have
characterized Carnegie R1 status as representing the “pinnacle of higher education—a
shorthand for institutions to identify themselves” (Anderson 2016). Leaders in higher
education often discuss achieving R1 status as a goal onto itself rather than a recognition
that follows from pursuing other activities that support public value. Upon being
classified as an R1 school in the 2018 update, a news release from Auburn University
cited that achieving R1 status “has been a long-term goal for the university and one of the
Page 17
6
main priorities of President Steven Leath since he took office in March 2017” (Brownlee
2018). The University of Nevada-Las Vegas, which also achieved R1 status in the 2018
update, had long sought R1 status, and specifically created a plan to reach R1 status by
2025 (Solis 2018).
The instrumental value of the Basic Classification is often discussed in tandem
with achieving a higher rank. In materials promoting consulting services to help
universities “move up” and “climb” to a “higher” Carnegie Classification, one consulting
firm implied a wide variety of benefits accrue from a higher Carnegie rank. These include
an “enhanced institutional profile within their state and nationally, potentially greater
state investment downstream, and the ability to attract and retain better faculty, students,
donors, and partners” (Larme and Thayer 2017). Some rationalizations of reaching a
higher Carnegie rank strain credulity. Villanova University claimed in a press release that
the institution’s “new Carnegie Classification…will increase the type of intellectual
discussion that occurs among undergraduates, graduate students, and faculty on our
campus” (Villanova University 2016).
Page 18
7
Figure 1: 2018 Carnegie Classification: Basic Classification (reproduced from Indiana University Center for Postsecondary
Research 2019)
Page 19
8
Beyond the status and prestige accorded to highest-ranked colleges and
universities, the classification status of an organization does have other material
consequences. Grant-making foundations have linked grant eligibility to the Basic
Classification status of an applicant’s organization and state governments have used
organizational classification status in various funding formulas (McCormick and Zhao
2005). Additionally, the ranking categories used by U.S. News and World Report directly
map onto the categories of Carnegie’s Basic Classification, which the publication refers
to as the “accepted standard in U.S. higher education” (Morse, Brooks, and Mason 2019).
Research has shown college rankings, such as those of U.S. News and World Report, to
be predictive of a range of individual and organization-level outcomes (Rindova et al.
2018).
The identification of R1 as the pinnacle of higher education has focused the
attention of university decision-makers on the specific metrics used in the Carnegie
Classification. As universities have attempted to move up the hierarchy, they have spent
real resources to affect these metrics. This has had a significant isomorphic effect on U.S.
higher education, as universities direct resources to increase the scale and intensity of
research expenditures and research doctorate degree production (McCormick and Zhao
2005). While few might argue that universities cultivating research expenditures or
diverting resources to research activities and doctoral programs represents a critical
failure of incentives, it does implicate the dual issues of opportunity cost of
organizational design and the value of organizational diversity in a system of higher
education. The Basic Classification, as consumed by external parties, provides one
Page 20
9
aspirational archetype for colleges and universities and does not capture the various ways
in which colleges and universities build public value. For example, a college or university
that broadens access and increases degree production for underrepresented minorities
does not receive a “higher” ranking within the Carnegie Classification.
Purpose of the Present Study
The purpose of the current study is to explore organizational heterogeneity present in
U.S. higher education. This study is focused on the following questions:
1. In what ways are four-year colleges and universities in the United States diverse
in the ways they realize public value?
2. Can four-year colleges and universities in the United States be grouped to reflect
their organizational designs?
3. What are the similarities and differences among and between these groups?
4. How do these groupings compare to existing classification schemes, such as the
Carnegie Classification?
Significance of the Study
Generally stated, the purpose of taxonomy and classification is to evaluate
observations within a heterogeneous population and assign them into homogeneous
groupings based on their similarities and differences (Sneath and Sokal 1962). Within the
context of higher education, the purpose of classification is to create groupings of
colleges and universities that share similar organizational profiles across one or more
attributes of interest. Clark Kerr described the original purpose of the Carnegie
Page 21
10
Classification as the creation of groups that were “relatively homogeneous with respect to
the functions of the institutions as well as with respect to characteristics of student and
faculty members” (McCormick and Zhao 2005). The purpose of the present study is to
advance an analytical method that creates groupings of colleges and universities with
higher homogeneity and face validity than currently available classifications.
The accurate and meaningful classification of colleges and universities is critical
to a variety of higher education stakeholders. Improved classifications can assist
researchers examining higher education institutions as well as higher education
administrators and political principals.
Academic Research on Higher Education
University classifications are widely used in academic research on higher
education. They have been incorporated in several broad ways, including as a key
explanatory variable, a control variable, and for sample selection. Examples of
classifications being used as an explanatory variable include studies from the institutional
characteristics literature, which often uses classification categories, such as those from
the Carnegie Classification, in modeling outcomes, such as student graduation rates. This
body of research has found weak evidence that institutional characteristics and
institutional missions predict student outcomes when student characteristics are
controlled (Pike, Kuh, and Gonyea 2003; McCormick et al. 2009). Examples of studies
that use classifications to create sample frames include many studies from the extensive
university technology transfer literature (Feldman et al. 2002; Friedman and Silberman
Page 22
11
2003; Bozeman and Gaughan 2007). These studies have used classifications such as the
Carnegie Classification, Land Grant status, and public status to select organizations for
sampling.
When classifications are directly incorporated into empirical models of colleges
and universities, their purpose is to capture unobserved organizational characteristics. In
this way, classifications are critical: testing theories on well specified samples and with
additional variables that meaningfully reflect institutional characteristics improves the
ability of analytical methods to identify relationships between variables and improves the
generalizability of the research.
University Strategy
Strategists and decision-makers act on taxonomic models of the competitive
environment facing their organization. These can be mental models based on simple or
sophisticated representations of environment (Porac and Thomas 1990) or predefined
taxonomic models of industries or markets, such as the North American Industry
Classification System (NAICS). Within the context of higher education, peer groups are
often formed by geographic proximity, co-membership in athletic conferences, or
Carnegie Classification (McKeown-Moak and Mullin 2014).
Taxonomic models and classifications directly connect to management strategy.
They help organizational decision-makers define peer groups and develop mimetic or
differentiating competitive strategies. They also can inform the creation of organizational
goals, the assessment of organizational capabilities, and the identification of rivals.
Page 23
12
Anachronistic classifications, on the other hand, can create competitive blind spots.
Consider a contemporary automobile manufacturer that believes it has a strong position
within the luxury automobile manufacturing market. The development of competing
technologies, such as autonomous taxis, may change the competitive landscape such that
the automobile manufacturer must compete not with the products of other luxury
automobile manufacturers, but also entirely different forms of transportation.
Performance Assessment
University performance is a critical public policy issue. Each year, federal and
state governments direct billions of dollars of public resources to public and private
universities to provide access to higher education, to support critical research and
development activities, and to perform a variety of other public service missions.
Historically, state governments have supported public universities with block grants
and/or enrollment funding instruments that determined appropriations based on student
enrollment (Lumina Foundation n.d.). Recently, state governments have begun
implementing performance-based funding policies that allocate some or all state funding
to public universities based on university performance. Twenty-seven states have
implemented these policies for four-year public colleges and universities (Dougherty et
al. 2016). Although there is considerable diversity in the design and implementation of
these policies, most of these policies seek to increase retention rates, graduation rates, and
degree production (Harnisch 2011).
Page 24
13
There is little evidence in the literature that these policies have been successful in
achieving their aims. While some studies have found that the implementation of
performance-based funding policies are associated with changes in resource allocations
(Rabovsky 2012) and managerial decisions (Natow 2014), many studies have not been
able to connect these policies to the achievement of university performance
improvements such as graduation rates or degree production (Hillman, Tandberg, and
Gross 2014; Rutherford and Rabovsky 2014).
Setting appropriate goals is a key to policy success. No known studies have
examined the creation of specific goals in university performance-based funding policies.
University performance—particularly within the domain of degree production and
graduation rates—reflect the aggregate of individual student-level outcomes. Student-
level outcomes, in turn, are a product of student characteristics interacting with the
broader university environment (Tinto 2012). Within the language of a production
process, this is to say that a university’s output is a product of the university’s inputs and
its resource transformation process. Since the characteristics of students on
“transformation processes” vary considerably across colleges and universities, it is
difficult for oversight organizations to assess the performance of college or university: is
a 60% four-year graduation rate for School X poor, adequate, or exceptional? Is School
X’s 60% graduation rate worse, similar, or better to School Y’s 75% graduation rate? An
improved classification of colleges and universities can help political principals assess
and contextualize university performance by grouping similar schools together so that the
Page 25
14
performance of a college or university can be measured relative to the leaders, the
laggards, and the average for other similar schools.
Page 26
15
CHAPTER 2: LITERATURE REVIEW
Introduction
This chapter reviews the literature as it relates to the current study. The chapter
begins by briefly defining and discussing the significance of taxonomy and classification
within the enterprise of science. It then reviews taxonomy and classification within the
organizational sciences before engaging and critiquing the modest academic literature
that exists on the taxonomy and classification of colleges and universities. In search of
new perspectives, this review then engages public administration’s framework of realized
publicness in order to inform a new approach to college and university taxonomy and
classification.
Taxonomy, Classification, and Human Progress
Grouping entities—such as animals, plants, or sounds heard in the night—by their
observed features is a fundamental cognitive behavior that helps humans quickly reduce
the complexity of the natural world. This helps humans see patterns, hypothesize
relationships, and build collective knowledge. Formalized versions of this activity include
taxonomy, which is defined as the development of theories and methods for separating
entities into groups, and classification, which is defined as the assignment of entities into
formally designated groups (Sneath and Sokal 1962).
The history of taxonomy and classification is intertwined with the history of
scientific and human progress. One of the first formalized classification structures of
natural objects was Aristotle’s Scala Naturae. This hierarchical classification ranked all
Page 27
16
living things known to Aristotle on a single continuum arranged by his assessment of
their biological complexity and “potentiality” of reaching divine perfection (Granger
1985). Aristotle’s classification reflected his view that living objects embodied essential,
unchangeable characteristics that could be identified and compared. This fundamental
assumption about the nature of living objects, which contemporary biologists have
forcefully repudiated, had profound implications for those who used the Scala Naturae to
guide research. Philosopher Karl Popper observed that any discipline that used Aristotle’s
method of classification “remained arrested in a state of empty verbiage and barren
scholasticism, and that the degree to which the various sciences have been able to make
any progress depended on the degree to which they have been able to get rid of this
essentialist method (Popper 2012).”
Subsequent taxonomists have developed alternative theories of classification.
These include nominalist approaches, which hold that groupings of entities do not
naturally exist but rather are product of an individual’s agency. Empirical approaches
assume that natural groupings of entities exist and that analysis of observed data can
reveal these natural groupings.
Empirical taxonomy and classification are critical in the use of the hypothetico-
deductive method. Among other things, the scientific method requires the formulation of
theories and falsifiable hypotheses, measurement of phenomena, and the public reporting
of results for replication (Lawson 2015). Homogeneous groupings of observations assist
in these activities, as they increase the ability of analytical methods to identify
Page 28
17
relationships within collected data and for other researchers to replicate results with other
data. Without a robust and well-developed taxonomic and classification effort to proceed
and ground empirical research, it is difficult for an investigator to know whether results
are due to the idiosyncrasies of sample selection or the hypothesized theoretical
relationships. In this way, taxonomy and classification are prerequisites of the scientific
method rather than a product of it.
Organizational Taxonomy and Classification
Taxonomy and classification efforts in the organizational sciences are much more
recent and less developed than in other fields. Bill McKelvey, writing in the early 1980s,
described organization science as existing at that time in a pre-Linnean state: a “1750s
body of knowledge cloaked in 1980s garb (McKelvey 1982).” A large part of this stems
from a tradition of investigators using essentialist and special-purpose classifications that
use a single organizational attribute to assign organizations to discrete categories. In the
years after McKelvey published Organizational Systematics in 1982, there have been
several notable large-scale classifications of organizations, such as research and
development laboratories (Crow and Bozeman 1998), and several distinct lines of
research have emerged.
One line of research engages organizational taxonomy and classification from a
cognitive perspective. Largely using the language of “categorization” and rooted in
psychology and sociology, this line of research views organizational categories as created
by individuals for strategic purposes. Research in this line has focused on category
Page 29
18
emergence (Pontikes and Hannan 2014), category properties (Hsu and Hannan 2005;
Hannan 2010), and the strategic use of categorization for competitive advantage within
markets (Porac and Thomas 1990; Zuckerman 1999; Cattani, Porac, and Thomas 2017).
This line of research emphasizes that categories are the artifact of individual agency.
A second line of work assumes organizational groupings exist beyond an
individual’s construction of them and views the purpose the taxonomic and classification
research to identify these existing groupings. Drawing from phenetic classification in
biology, this stream of research attempts to use the observed characteristics of
organizations to derive groups of organizations that maximize organizational
homogeneity within groupings and maximize heterogeneity across groupings. This
research has largely focused on taxonomic methods and approaches. Research has
addressed the interconnected issues feature selection, specification of sampling
populations, and analytical methods. There has been disagreement in the role of theory in
empirical classifications, which some authors arguing that empirical classifications
should be unconstrained by prior theory (Rich 1992), while others argue that a purely
inductive, theory-free approach to empirical classification is not possible (McKelvey
1982; Doty and Glick 1994). This line of research emphasizes the multidimensional
nature of organizations: empirical taxonomic methods create polythetic groupings in
which no single attribute is necessary or sufficient for an organization to be assigned to a
group. Instead, a pattern of similarity across observed characteristics is needed.
Page 30
19
Emerging Approaches to University Classification
A review of academic publishing databases finds a small and fragmented
literature on college and university taxonomy and classification that is largely
disconnected from theoretical work on organizational taxonomy and classification. One
stream of this literature is focused on extending the logic of university classification to
settings previously without traditions of university classification, such as South Korea
(Shin 2009), Thailand (Phusavat et al. 2011), and India (Jalote, Jain, and Sopory 2020) or
to explore the organizational diversity of small groups of colleges and universities
serving specific purposes, such as Hispanic-serving institutions in the United States
(Núñez, Crisp, and Elizondo 2016). Another stream of this literature, contributed to by
scholars who administer the Carnegie Classification, attempts to reflect on the experience
of creating the Carnegie Classification (McCormick and Zhao 2005; Indiana University
Bloomington and McCormick 2013; Borden and McCormick 2019). A third stream of
this literature directly engages, critiques, and attempts to improve upon the college and
university classification efforts Carnegie started several decades ago. The present review
will focus on this third stream within the literature.
This third steam of literature has focused more on broad taxonomic methods and
approaches than the classification of specific colleges and universities into groups. As a
result, a review of this literature must focus more on the limits and possibilities of the
methods used rather than synthesizing the collectively derived knowledge of university
forms. Among the studies reviewed, two studies focused on methodological
Page 31
20
improvements to the analytical procedure of the existing Carnegie classification system
(Kosar and Scott 2018 and Harmon et al. 2019). Two other studies attempted new types
of empirical classifications of research-intensive groups of colleges and universities.
Brint and colleagues (2006) created aspirational reference sets for universities and
colleges based on a survey of university presidents and compared these reference sets to
an “objective” reference set derived from a cluster analysis of universities represented in
their survey of university presidents. Crisp et al. (2019) used a k-means cluster analysis to
find organizational groupings existing within the population of broad-access colleges and
universities in the United States.
Theory
Organizational taxonomists have contested the role of theory in taxonomic work,
with some authors arguing for a theory-free, inductive approach and others advocating
for theory to provide the basis of feature selection and interpretation of results
(McKelvey 1982). The studies reviewed here mirrored this debate and had significant
differences in their engagement with theory. The two methodological papers ignored
theory altogether, while the two classification papers had moderate grounding in theory.
Crisp and colleagues (2019) provided the strongest theoretical grounding. They
used resource dependency theory to argue that differences in “systemic, constituential,
programmatic, resource, and environmental” variables form the basis for understanding
organizational diversity among broad-access institutions. Resource dependency theory,
together with previous literature, led them to include 20 variables in their cluster analysis.
Page 32
21
These ranged from performance outcomes, such as the retention and graduation rates, to
environmental variables such as the unemployment rate and median housing prices in the
surrounding county. They also included several existing classifications, such as
institutional control and for-profit status, as measures.
Brint et al. (2006) provided less theoretical basis for their cluster analysis. They
justified the inclusion of seven variables (Carnegie Classification, institutional control,
total head count enrollment, average SAT/ACT test scores of admitted freshmen,
undergraduate tuition, total organizational operating budget, and the percentage of
degrees awarded in arts and sciences) as being “both central components of structural
location and plausible bases for the formation of clusters…”
Samples and Data
All four studies engaged a limited sample of U.S. higher education. As
methodologically oriented papers, Kosar and Scott (2018) examined doctoral institutions
classified by Carnegie and Harmon et al. (2019) analyzed research-intensive universities
classified by Carnegie. This limited their analyses to 276 and 334 universities,
respectively, but allowed both groups to use the same dataset and measures used by
Carnegie and to compare results to the Carnegie classification.
Brint et al. (2006) bounded their analysis to four-year and above public and non-
profit private colleges and universities represented within the results of their presidential
survey. Although their final sample included just 252 colleges and universities, their
sample represented various types and kinds of colleges and universities present in
Page 33
22
American higher education. Crisp et al. (2019) engaged the largest swath of U.S. higher
education by sampling all public and private colleges and universities that had a freshman
admissions rate of 80% or higher in 2014-15. This yielded a sample of 1,073
organizations, but excluded most of the largest and well-known universities in the
country.
Methods and Results
Published papers on university classification have used a variety of analytical
techniques to identify groupings of similar colleges and universities. Kosar and Scott
(2018) and Harmon et al. (2019), which both focused on incremental improvements to
the existing Carnegie methodology, employed a conceptually similar two-stage
classification approach as Carnegie. They first applied a data reduction technique on
aggregated and per-capita university data and then plotted resulting factors. Other authors
have used data clustering methods such as k-means.
Kosar and Scott (2018) argued that Carnegie’s approach of retaining the first
component of two separate principal components analysis of aggregate and per-capita
university measures does not optimally capture the variance occurring in the data. To
explain more variance in the data, they applied a varimax rotation to the first two
principal components of a combined aggregate and per-capita dataset. They then plotted
these factors in X-Y space and used graphical boundaries to discretize the dataset into
three groupings roughly corresponding to the doctoral, high-research activity, and very-
high research activity categories in the Carnegie Classification. The resulting
Page 34
23
assignments of universities largely resembled the existing assignments from Carnegie.
This approach suffers from several weaknesses. First, the there is no available measures
of model fit beyond explained variation. Second, visual inspection of the plotted bivariate
factors does not reveal any obvious clusters within the dataset. The assignment of
universities into low, medium, and high groups is very sensitive to the graphical
boundary lines, the placement of which are completely arbitrary.
Others have used methods, such as structural equation modeling, with additional
diagnostic and model fit tools. Harmon et al. (2019) used the existing variables in the
Carnegie dataset as items in a structural equation model that conceptualized STEM and
non-STEM university productivity as two latent factors that, in turn, explained a shared
latent factor of overall university productivity. This resulted in a single productivity
factor score for each university, which the authors then ordered from lowest to highest.
They used single-variable mixture modeling to derive three clusters present in the
unidimensional dataset as well as to classify specific universities into these three clusters.
This resulted in all 84 very high activity universities in 2015 Carnegie Classification
clustering in their derived “SEM Large” category and approximately half of very high
research activity universities and doctoral universities splitting between their “SEM
medium” and “SEM small” categories.
Traditional clustering methods have also been used to classify universities. Brint,
Riddle, and Hanneman (2006) used an agglomerative clustering method and the Akaike
information criterion to derive seven clusters of colleges and universities present within
Page 35
24
their sample. Similarly, Crisp et al. (2019) used hierarchical agglomerative clustering on
their sample of broad access universities. After using Box Cox transformations to
normalize several variables, the authors analyzed public and private colleges and
universities separately. AIC and BIC criteria indicated the presence of four clusters,
which they identified as low-cost, open access public colleges; striving regional and state
universities; private accessible liberal arts and religious colleges; and access-oriented
minority-serving private colleges.
Conclusion
The papers analyzed here have several notable weaknesses. The two
methodological papers conceptualize university differentiation based on a latent factor of
university research productivity. Regardless of the particular data reduction and
partitioning methods used, the conflation of university performance with organizational
differentiation results in the studies creating a taxonomy of university performances
rather than of organizational types that can inform the assessment of university
performance. One of these studies (Harmon et al. 2019) explicitly created a hierarchical
ranking of universities based on a latent factor of overall university productivity. The
conceptual or practical utility of this ranking above a simple ranking of universities on
any of the aggregate or per-capita variables is not clear.
Another critical issue with some of the reviewed studies is the inclusion of
previous classifications, such as Carnegie classification and institutional control, as data
on which universities groups are derived. With much of the observed variance across
Page 36
25
observations existing as prior university classifications, the inclusion of prior
classification as data points increases the likelihood that the results of subsequent
classification work simply recreate existing classifications.
Both of the issues above directly relate to the role of theory and the interpretation
of results in these studies. Three of the papers reviewed had little to no grounding in
theory and selected measures largely by convenience (such as selecting measures already
gathered and publicly reported by Carnegie). This is an issue to the extent that the cluster
analytical techniques used by these researchers will identify groupings of observations
within multivariate databases, but will not ensure that resulting groupings are meaningful
representations of organizational groupings as they exist and function in the
organizational field. To ensure valid and meaningful results, investigators need to allow
theory to guide the selection of measures and results need to be cross-verified with
organizational field knowledge (McKelvey 1982).
Taken as a whole, these studies show a significant opportunity for additional
research that is guided by theory, uses methods that provide diagnostics for model fit, and
engages the totality of U.S. higher education rather than small, unrepresentative samples
of colleges and universities.
Perspectives on Organizational Classification within the Field of Public
Administration
This section engages and reviews the public administration literature, particularly
the realized publicness literature, to provide a theoretical grounding for taxonomic and
Page 37
26
classification work of the present study. It begins with a discussion of various
conceptualizations of organizational differentiation, including the generic approach and
the core approach, before reviewing recent theoretical and empirical developments in the
dimensional and realized publicness literature.
While the public administration literature does not often explicitly use the
language of taxonomy and classification, these concepts have been central to the
development of the field. The name itself—public administration—implies a type of
classification of organizations based on some sort of attribute. Disagreements and debates
as to these attributes constitute the basis of the publicness literature and the extent to
which these attributes and resulting classifications cause differences in organizational
outcomes is the foundation of the sector differences literature.
The Generic Approach
The generic approach negates substantive differences in public and private
organizations. Rather than focusing on distinctive aspects of organizations, this
perspective holds that organizational decisions are “subject to a cost-benefit calculus of
one form or another and to a variety of competing inputs” (Scott and Falcone 1998) and
that management practices can be developed or imported into organizations across sector
without any significant revision or customization. Herbert Simon’s theory of
administrative behavior (1997), which places human cognition as the micro-foundation of
organizational decision-making and ultimately organizational design, is an example of
the generic approach. Key components of this theory, such as the worker program/script,
Page 38
27
are argued to exist in any type of organization. Despite being theoretically advanced by
many early organizational scholars, there has been little embrace of this perspective by
contemporary scholars who stress that public and private organizations are substantially
different (Denhardt and Denhardt 2000).
The Core Approach
The core approach to understanding organizations, as characterized by (Bozeman
1987), stresses that differences between organizations arise from differences in
organizational legal status. Scholars from a variety of fields, including economics,
political science and public administration, have contributed to this approach but each
differs in their theorizing as to how the legal status of an organization contributes to
differences in manager and employee behavior as well as broader organizational
outcomes. Despite their differences, these scholars often stress the categorization of
organizations into discrete types. Scholars operating in this tradition have theoretically
connected legal status to organizational behavior with property rights and political
control arguments.
The property rights perspective of the core approach defines an organization’s
status as a function of ownership of the organization and sees differences in ownership as
contributing to differences in employee and manager behavior. This perspective rests on
the observation that individuals or other organizations can own private organizations
directly. Ownership creates a very clear connection between management decisions and
remuneration: it encourages owner/managers to focus on maximizing residual profits and
Page 39
28
increasing the long-term value of the organization by revenue generation, cost-cutting
and productivity growth. Since ownership in public organizations cannot be transferred,
managers lack incentives to provide “owner/entrepreneur oversight” (Bozeman 1987) of
employees. These differences make private and public organizations substantively
different.
Publicness: Dimensional and Realized
The dimensional approach departs from the core approach by stressing that
differences between public and private organizations are only a matter of degree and that
most organizations exist as hybrids on a public-private spectrum. This perspective, which
was first advanced by Bozeman (1987) and later clarified by Bozeman and Bretschneider
(1994), has spawned a diverse literature that is united in synthesizing both the economic
and political control perspectives of the core approach and arguing that the concept can
be applied to any organization in any sector. Bozeman (1987) summarizes the
dimensional approach as classifying an organization as public “to the extent that it
exercises or is constrained by political authority” and “private to the extent that it
exercises or is constrained by economic authority.” In this way, the dimensional approach
considers publicness as independent of the legal status of the organization.
While the dimensional approach to publicness combines both the economic and
political approaches, it is more than a simple combination of them. Bozeman (1987)
hypothesizes that several factors internal to the organization mediate the effects of
external political authority. For example, existing endowments of political authority the
Page 40
29
organization holds can mediate impositions of new political authority on the organization.
Levels of preexisting economic authority can mediate the impact of new impositions of
external political authority. The level of “indigenous resources,” such as “general
competence and particular skills of management, level and flexibility of financial
resources, composition of the labor force, reputation and general public perceptions, and
supplies of natural resources and production inputs” (Bozeman 1987) can mediate
external political authority. Boundary spanning by individuals within the organization
can mediate the impact of external political authority on the organization by their ability
to influence the broader operating environment or facilitate alternative resource
acquisition strategies.
Moulton termed the stream of research flowing from Bozeman’s (1987)
dimensional approach as “descriptive publicness” since the traditional measures used in
dimensional public research—funding, ownership, and control—are “intended to describe
the characteristics that make organizations public” (Moulton 2009). Researchers,
however, have used these operationalizations to predict certain organizational activities
and outcomes. A review of the descriptive publicness research (Andrews, Boyne, and
Walker 2011), found scattered evidence connecting the various dimensions of publicness
to either organizational effectiveness or efficiency. A large issue is the operationalization
of the dimensional publicness theory itself: many studies examined ownership, but not
funding or control dimensions of publicness. The authors found that “public ownership
leads to more equity and that public funding may be associated with higher efficiency,”
particularly in studies that were cross-sectional and that did not control for the internal or
Page 41
30
external context of the organization. The literature has not produced strong evidence that
links dimensional publicness to organizational effectiveness.
It is against this backdrop that Bozeman (2007) and Moulton (2009) reframed
dimensional publicness from descriptive publicness to “normative publicness” by using
dimensional publicness to understand the extent to which organizations engage in
behaviors that build public value. That is to say that the literature began to focus on
public value achievement, termed “realized publicness” by Moulton (2009), as a
dependent variable rather than dimensions of organizational publicness as independent
variables to explain organizational effectiveness or efficiency.
Bozeman (2007) defined public values as those that provide “normative
consensus about (a) the rights, benefits, and prerogatives to which citizens should (and
should not) be entitled; (b) the obligations of citizens to society, the state, and one
another; and (c) the principles on which governments and policies should be based.” In
this way, public values are not public goods in the conceptualization of neo-classical
economic theory or simple public opinions. Public opinion shifts rapidly while public
values evolve slowly. Public values can be found in a variety of sources, including
founding documents of governments, laws, court decisions, national myths, and within
public addresses by elected officials. Public values themselves cannot “fail,” but a society
can fail in the provision or realization of public values when “neither the market nor the
public sector provides goods and services required to achieve public values” (Bozeman
Page 42
31
2007). It is important to note that public values can be realized by actors in a variety of
sectors and that their provision is not the sole responsibility of the state.
Moulton argued that realized publicness was a function of “public value
institutions” that influence organizational behavior. These include regulative, associative
and cultural/cognitive public value institutions. Although these concepts relate to the
traditional measures of dimensional publicness, they are more encompassing. Regulative
public value institutions include formal, legally sanctioned “rules, surveillance
mechanisms, and sanctions that influence behavior.” The theoretical link between
regulative public value institutions and realized publicness can be made with institutional
theory, principal-agent theory, or resource dependence theory. Associative public value
institutions are not legally sanctioned. They include organizational membership in the
“community, local networks, organizational affiliations, and certification agencies that
may espouse public values and thus influence organizations toward realized publicness.”
Moulton points to institutionalism’s isomorphic pressures on organizations to appear
legitimate as linking the two concepts. The cultural cognitive dimension represents the
perceptions and motivations of individuals operating within an organization towards
supporting public value outcomes. In this way, Moulton explains realized publicness as a
function of environmental, organizational, and individual-level variables.
Realized Publicness in Public Administration Research
This section engages and reviews the literature that has emerged in response to
Moulton’s (2009) framework of realized publicness as it relates to the present study. A
Page 43
32
search of Google Scholar for articles citing Moulton’s framework reveals 192 articles,
book chapters, and other published works. Of these, there were six articles written by a
small and relatively integrated community of scholars that substantively engaged
Moulton’s framework with empirical investigations. The remainder of this section will
review these articles with respect to their broad research questions, approaches to
operationalizing concepts in the framework, and significant results. Their
operationalization of realized publicness is of particular interest to the present study.
Most of the existing studies examine only certain aspects of the full framework of
realized publicness in specific organizational settings. Moulton (2009) and Moulton and
Bozeman (2011) investigated whether the environmental publicness of mortgage lenders
influenced the provision of high-cost mortgages. Moulton and Bozeman (2011)
conducted a multi-level analysis at the mortgage borrower-level and county-level using
data collected from the 2004-06 HMDA Loan Application Register covering the states of
Indiana, Ohio, and Florida. While Moulton (2009) did not conduct a quantitative study in
her 2009 study, she did outline a possible study. Since her research proposal differs from
the later operationalization, the paper remains instructive and is included here for that
reason.
Several scholars have investigated realized publicness in the context of substance
abuse centers. Miller and Moulton (2013) researched the connection between policy
environments of substance abuse centers and organizational engagement in practices
shown to improve client outcomes. While they did not explicitly use Moulton’s (2009)
Page 44
33
framework of realized publicness, components of the framework are clearly present in the
overall logic of the study and in the operationalization of the variables. Su (2016) also
examined the impacts of political authority of “the provision of specialized programs for
vulnerable groups” by substance abuse centers.
Feeney and Welch (2012) explored how dimensions of publicness observed at
organizational and individual levels impact faculty behavior at research-extensive
universities. Their study is the most complete investigation of the framework of realized
publicness published to date.
Table 1 provides an overview of these studies.
Realized Publicness as Dependent Variable
Moulton (2009) identified the characterization of realized publicness—that is to
say defining the public value of organizational outcomes—as the first step in applying the
framework of realized publicness to an organization. The studies reviewed here vary with
respect to how they did this: some focused on characterizing the behavior of an individual
person, some focused on the presence of organizational engagement in an activity, and
others focused on the degree of organizational engagement in an activity.
Feeney and Welch (2012) examined three dependent variables measured at the
individual faculty level: the number of peer-reviewed journal articles published within
the past two years, the number of courses taught within the past year and the number of
committees served on within the past year. The authors justified the selection of these
three variables based on faculty incentive structures at research universities being
Page 45
34
comprised of scholarship, education provision, and service dimensions. That is to say that
these dependent variables are artifacts of the normative culture existing when these
organizations first originated.
Several authors used dummy variables to capture whether an organization
engaged in an activity deemed to realize public value. Miller and Moulton (2013)
employed six dependent variables at the organizational level that included measures of
both public service practices and positive client outcomes. All variables were
dichotomous and included whether an organization served clients with (1) housing or
with (2) employment; (3) utilized a case management system; (4) helped clients apply for
other public social support services; (5) offered at some services free of charge; and (6)
offered discounts to low-income clients. The authors motived the selection of these
measures public values by citing previous research that has linked these organizational
practices to long-term client outcomes. Su (2016), examining substance abuse centers,
operationalized realized publicness with four dummy variables that captured whether a
center offered specialized services for clients needing assistance for criminal justice;
HIV/AIDS; pregnancy; or other co-occurring issues.
Other authors examined rates of engagement or levels of organizational outcomes.
Within the context of mortgage lending, Moulton (2009) operationalized realized
publicness as the percentage of a mortgage lender’s mortgages held by low-income
borrowers as well as the payment delinquency and loan foreclosure rate of mortgages.
She justified these particular outcomes based on decades of homeownership-related
Page 46
35
legislation, including the authorizing legislation of the Federal Housing Administration
and other government-sponsored enterprises operating in the mortgage and housing
industries, as suggesting that “increasing access to home ownership for ‘underserved’
populations” (Moulton 2009) is a key public value. Given the dual levels of analysis,
Moulton and Bozeman (2011) constructed a multi-level analysis at the county and
individual borrower-level that investigated whether an individual had a high-cost
mortgage (defined as being more than “three percentage points above the comparable
U.S. Treasury Rate”). This variable was operationalized as a binary variable and only
represented the interest rate of the mortgage rather than other aspects of the loan, such as
a points, fees, or presence of balloon payments. Although dichotomous, this variable
within a geography represented the degree of organizations participating in an activity.
Continuous measures representing organizational degrees of engagement or
activity are likely most consistent with the framework of realized publicness. After all,
public value is not merely created by offering a service, but by ensuring that people can
access or benefit from it. The two are not automatically linked. Individual-level
measures, like those used by Feeney and Welch (2012), may be appropriate in
organizational settings with high levels of front-line worker discretion or autonomy.
Significant Findings of the Realized Publicness Literature
The literature has used Moulton’s (2009) framework in order to help understand
how to manage for publicness. To this end, the authors have explained the realized
publicness of organizations as a function of regulative, associative, and cultural/cognitive
public value institutions. The theoretical links they argue, as well as the
Page 47
36
operationalizations of the three public value institutions, are beyond the scope of this
literature review. Significant results will only be presented in summary. Overall, the
studies found modest support for their hypotheses that the increased presence of
regulative, associative, and cultural/cognitive public value institutions are linked to
realized publicness.
Moulton and Bozeman (2011) found strong evidence that all three types of
institutions influenced the realized public values of subprime mortgage lenders. Measures
of associative publicness and two out of three dimensions of regulative publicness were
statistically significant predictors of the probability of a mortgage holder having a high-
cost mortgage. The only measure that was not significant was the presence of local
nonprofit housing organizations.
Page 48
37
Table 1: Realized Publicness Literature
Research Questions
Analytical
Method
Sector of
Org
Level of
Analysis Dependent Variables Regulative Associative
Cultural/C
ognitive
Moulton
(2009)
"What influences
make mortgage
lenders more (or less)
likely to provide for
public outcomes?
Proposed
statistical
analysis
(study not
conducted)
Mortgage
Lenders
Organization Proportion of mortgages
held by low-income
borrowers and
delinquency/foreclosure
rates of mortgages
Lender contact
with regulatory
bodies
The degree of
lender
dependence
community and
extent of
community
organization
The "extent
to which
the lender
shares
public
values of
community
"
Moulton
and
Bozeman
(2010)
Does the "publicness
of the lending
environment at the
county level"
influence "the
probability of a
borrower receiving a
high-cost loan…?"
Multilevel
econometric
regression
Subprime
Mortgage
Lending
County and
individuals
(mortgage
holders)
Individual possessing a
"high-cost" mortgage,
binary
Extent of
Mortgage
Revenue Bonds
in local mkt and
"presence of
nonprofit
housing and
community dev.
orgs"
"Localness" of
bank's lending
activity
Not tested
Feeney
and
Welch
(2012)
How do university
"dimensions of
publicness affect
faculty behavior and
outcomes?"
Hierarchical
linear model
regression
Research-
Extensive
Universities
Individuals
(faculty
members) and
organization
Number of journal
articles, courses taught
within past year, and
department/university
committees served on in
past year
Mixed Mixed Attitudes
towards
research
and
authority in
department
Miller
and
Moulton
(2013)
How does
environmental and
organizational
publicness impact
public service
provision of substance
abuse centers?
Hierarchical
linear model
regression
Substance
Abuse
Treatment
Centers
States and
organizations
Six variables of public
service provision and
positive client outcomes
Community
publicness and
public priority
Sector of
organization
Not tested
Su (2016)
How do "different
dimensions of political
authorities facilitate
the provision of
specialized programs
for vulnerable
groups?"
Hierarchical
linear model
regression
Substance
Abuse
Treatment
Programs
State and
organization
Four dummy variables of
facility offering
specialized services
Collective
publicness,
revenue
composition
Accreditation
status
Not tested
Page 49
38
Feeney and Welch (2012) found that regulatory publicness at the federal level was
associated with increased knowledge and teaching outcomes while measures of state-
based publicness only positively predicted service outcomes. Interestingly, state-based
regulatory publicness was associated with lower levels of teaching publicness. Relative to
normative and associative publicness, the authors found that the network size of faculty
and affiliation with a federal laboratory positively related to knowledge outcomes. There
was mixed evidence for the relationship between university association membership and
knowledge outcomes and no support for their hypothesis that university commitments to
diversity impacted faculty realization of education and service outcomes. There was
mixed evidence of cultural and cognitive publicness impacting realized publicness.
Faculty perception was not statistically significant in the prediction of number of faculty
research articles published. An individual’s perception of influence within a department,
however, negatively predicted the number of courses taught and positively related to
research output.
Miller and Moulton (2013) found largely supportive evidence. Associational
publicness, as measured by organization sector, impacted the provision of all types of
public service practices, with public organizations providing more than private
organizations. Organizational receipt of public funding, regardless of sector, also
increased the provision of public service practices. The two dimensions of regulatory
publicness (collective publicness and public priority) were only statistically significantly
connected to provision of certain types of public service practices.
Page 50
39
Given the complexities and feedbacks of environments, organizations, and
employees, moderation between public value institutions was a critical concern in several
of the studies. Moulton (2009) started this community of scholars investigating these
types of relationships by hypothesizing that associative variables might moderate
regulative variables. In the case of mortgage lending, public disclosure laws force lenders
to disclose public value realization (such as foreclosure rates) to the community in which
they are embedded. The greater the extent lenders are embedded in a community that
they must maintain good relations with, the higher the impact of regulation on the
realization of public values. This thinking was confirmed in Miller and Moulton (2013),
who found that regulative publicness moderated the relationship between associative
(measured by sector) and public service provision. Private organizations in environments
with high publicness behaved similarly to government and nonprofit organizations in the
provision of public service practices.
Assessment of the Realized Publicness Literature
The realized publicness literature is largely characterized by consensus. A review
of the literature reveals several important unifying trends around topical focus,
methodology and theoretical perspectives. These trends represent strengths, weaknesses
and opportunities for this literature.
All studies reviewed here examined organizations existing within a narrowly
defined society-desired activity. Given that all studies operationalized the public value
institutions differently and had at least one statistically insignificant outcome, it is not
Page 51
40
clear what results are idiosyncratic to particular organizational settings, such as substance
abuse centers, and what results generalize to the large body of public organizations.
Comparative research and multi-method research, such as case studies, could help
provide clarity as to the critical bounds between the specific and the general.
Relatedly, these studies conceptualized the dimensions of realized publicness
relevant to organizations as something to be separately and distinctly analyzed. This is
related to these studies only engaging narrowly defined samples of organizations
providing the same service, such as substance abuse counseling. It is not known whether
realized publicness could be re-approached as a configural or combinatorial concept, in
which organizations do not simply engage in more or fewer of activities that realize
public value, but rather engage in different types of activities that realize different types
of public value. This may be particularly useful in organizational fields that are broader
and more complex or that allow organizations greater discretion in the types of activities
they pursue.
The authors reviewed here also shared a common theoretical perspective: they
connected public value institutions to realized publicness through institutional theory.
This is to be expected, given the parallels of Moulton’s public value institutions to
DiMaggio and Powell’s (1983) three forces of isomorphism: regulative, associative, and
cultural public value institutions cleanly map onto coercive, mimetic, and normative
isomorphic pressures. While accessing DiMaggio and Powell’s logic has allowed this
community of scholars to justify the relationships of these public value institutions to
Page 52
41
realized publicness, it has also locked them into an exploration of homogenization.
Reframing the focus toward issues of divergence and heterogeneity might prove fruitful
in that this focus could help identify conditions in which organizations evolve, change,
innovate, or otherwise differentiate themselves in the face of pressure to converge.
Realized Publicness of Higher Education Organizations
This section of the literature review will address the ways in which colleges and
universities realize public outcomes. This is not an insignificant task, as organizational
diversity and complexity characterize the higher education system in the United States. It
has evolved over three centuries from a small collection of church-affiliated colonial
colleges to an array of over 4,360 organizations. These include organizations popularly
classified as public, private, and for-profit schools; two-year, four-year, and graduate-
only schools; teaching-focused and research-focused schools; regional, access-oriented
public schools and nationally-oriented flagship public schools; theological seminaries;
public and private trade schools; and large elite private colleges. This collection of
organizations is economically and socially important: as a whole, colleges and
universities expend more than $596 billion on operations, enroll over 19 million students,
employ 1.5 million faculty and staff, and grant 1.96 million bachelor’s degrees and 2
million other academic degrees and credentials per year (NCES National Center for
Education Statistics 2018).
The first step in determining realized publicness in the framework that Moulton
(2009) advances is to identify the public values that organizations in a particular setting
Page 53
42
are able to achieve. Public values, as defined by Bozeman (2007), provide “normative
consensus about (a) the rights, benefits, and prerogatives to which citizens should (and
should not) be entitled; (b) the obligations of citizens to society, the state, and one
another; and (c) the principles on which governments and policies should be based.”
They are found in a variety of sources, such as authorizing legislation, laws, court
decisions, national myths, and public addresses by elected officials.
Access to Learning Environments
Colleges and universities have been definitionally associated with the provision of
access to learning opportunities, although broad attitudes as to the groups of students to
which this access is provided has evolved over the centuries. Harvard Corporation, which
was the first organization of higher education created in the American colonies, was
founded by vote of the Great and General Court of the Massachusetts Bay Colony in
1636 out of a collective impulse to not only replicate storied English institutions in a new,
unsettled environment but also to support an aristocratic class that would spur broad
social development (Harvard University n.d.). The 1780 constitution of the
Commonwealth of Massachusetts contained an entire chapter concerning “the university
at Cambridge” and specified that “…it shall be the duty of legislatures and magistrates, in
all future periods of this commonwealth, to cherish the interests of literature and the
sciences, and all seminaries of them; especially the university at Cambridge (M.A. Const.
Ch. 5, §1, art. I, 1780).” In the following decades, many states chartered and funded
universities through their constitutions to support expanded access to higher education
(Rudolph 1962).
Page 54
43
Several pieces of legislation passed in the middle and second half of the twentieth
century clarify modern public values in higher education, particularly as it relates to the
provision of educational access to low-income and other historically under-represented
groups of learners. The various “G.I. Bills” passed since 1944 have provided financial
assistance to veterans and servicemembers to attend college (Servicemen’s Readjustment
Act of 1944 1944) and the Higher Education Act of 1965 established grants and loans to
assist low-income students in attending colleges and universities (Higher Education Act
1965).
Policy debates at the state level are also insightful. In 2016, the California State
Auditor determined that the University of California system had done “significant harm
to residents and their families” by decreasing resident enrollment by 2,200 while growing
nonresident and international student enrollment by 18,000 from academic year 2010-11
to 2014-15; reducing admissions requirements for nonresidents; not adequately
containing costs; and not fully investigating cost-cutting measures before raising tuition
on resident students (California State Auditor 2016). Criticism from policy elites has
defused out to the broader public and provides evidence as to public values: a Pew
Research Center study found that 57% of Americans thought “the higher education
system in the United States fails to provide students with good value for the money”
(Pew Research Center 2011).
Creating an academic environment conducive to student success is another way
colleges and universities realize public value. The Higher Education Act of 1965
Page 55
44
established federal grants to small and less-developed colleges and universities to “assist
in raising the academic quality of colleges which have the desire and potential to make a
substantial contribution to the higher education resources of our nation…” It also
established a $50 million fund to assist college and university libraries in acquiring
“books, periodicals, documents, magnetic tapes, phonograph records, audiovisual
materials, and other related library materials” to enrich the environment in which students
learn (Higher Education Act of 1965 1965). These provisions suggest that colleges and
universities realize public value by not only admitting students but also designing an
instructional and broader academic environment in which students can succeed.
Production of New Knowledge
Debates over the role of knowledge production in U.S. colleges and universities
date back to the middle of the 19th Century and the establishment of German-influenced
universities such as Johns Hopkins in 1876 (Cole 2010). Combining the functions of
knowledge transmission and stewardship with knowledge generation required
significantly different organizational designs. That these new organizational designs
realized new types of public outcomes has been recognized in a range of federal
legislation. This legislation has resulted in the federal government spending $40.94
billion on university-based research and development in FY2017 (AAAS 2020).
These ongoing public investments in university-based research and development
date back to Science, the Endless Frontier, a document written by Vannevar Bush that
has served as the blueprint for the modern relationship between the federal government
Page 56
45
and the enterprise of scientific and technological research (Cole 2010; M. M. Crow and
Dabars 2020). Writing at the end of the Second World War and buoyed with the public
successes of the Manhattan Project and the mass production of Penicillin, Bush argued
that the continued federal funding in times of peace would help in the war against
disease, would improve national security and would improve public welfare through the
creation of new industries and jobs (Bush 1945). Given that addressing grand challenges
requires society-wide efforts, this study will consider the organization-level generation of
new knowledge to be a realized public outcome.
This review suggests that colleges and universities realize public outcomes in
three broad ways: the provision of student access to undergraduate and graduate learning
environments, the provision of an academic environment conducive to student success,
and the generation of new knowledge.
Page 57
46
CHAPTER 3: METHODOLOGY
This research seeks to address and explore several related research questions:
1. In what ways are four-year colleges and universities in the United States diverse
in the ways they realize public value?
2. Can four-year colleges and universities in the United States be grouped to reflect
their organizational designs?
3. What are the similarities and differences among and between these groups?
4. How do these groupings compare to existing classification schemes, such as the
Carnegie Classification?
This chapter will discuss the empirical strategy employed to answer these questions. It
will first address the complexities of the sample specification before describing the
manifest variables and statistical method used in the present study.
Population, Data Source, and Sample
The population for the present study is comprised of all four-year colleges and
universities in the United States. Both data limitations and availability dictate the
specification of the final sample. The data for this study come from two sources. First, I
use data from the Integrated Postsecondary Education Data System (IPEDS) of the U.S.
Department of Education (National Center for Education Statistics 2020b). This survey-
based administrative dataset contains annual data on student enrollment, student
outcomes, faculty and staffing, price, cost, and other institutional characteristics for all
institutions in the United States and abroad that participate in Title IV federal financial
Page 58
47
aid programs. Institutions calculate and report these data and the U.S. Department of
Education audits and verifies reported data. Second, I use data from the Indiana
University Center for Postsecondary Research, which currently administers the Carnegie
Classification (Indiana University Center for Postsecondary Research 2019). This
includes university research expenditure data from the National Science Foundation’s
Higher Education Research and Development (HERD) survey that the Indiana University
Center for Postsecondary Research has mapped onto the smaller units of analysis present
in the IPEDS database.
The sample for the present study attempts to balance comprehensiveness with
comparability, as determined by data limitations inherent in the study of organizational
diversity. Institutions populating the landscape of higher education in the United States
have large differences in organizational inputs, educational processes, financial models,
oversight mechanisms, organizational lifespans, and outputs. While these differences can
be important and useful in categorizing these organizations, they can also impose
significant limitations on the data available to study them.
A critical issue that data limitations may create is false equivalences. For
example, a researcher may be interested in understanding the degree of access that
institutions provide to lower-income students. There are very few measures of this critical
concept available, with Pell student enrollment being one of the most commonly used.
An institution that only operates a graduate medical program would appear as having no
Pell student enrollment and could appear analytically similar to a small, highly exclusive
Page 59
48
college that enrolls few lower-income students. Yet, this is not necessarily because the
medical school is not providing access to lower-income students like the exclusive
college, but rather because the medical college does not enroll undergraduate students
and only undergraduates are able to qualify for Pell grants.
The issues data availability create require careful and attentive consideration and
inform the sample selection of the present study. In cases where data availability issues
would likely misrepresent the nature of organizational diversity, organizations with
certain identified characteristics were excluded to minimize that misrepresentation. These
exclusions were relatively rare and limited in nature, and resulted in a large overall
sample for analysis.
The final sample was limited to all colleges and universities present in the IPEDS
database that are eligible to receive Title IV federal financial aid, are under public or
private not-for-profit control, located in a U.S. state, enroll first-time full-time (FTFT)
freshman undergraduates, charged an annual tuition of a least $1 in 2017-18, granted
more than ten bachelor’s degrees in 2017-18, and offered at least some educational
programs on a face-to-face basis. These restrictions ensure sufficient data availability for
organizational comparison. The final sample consisted of 1,620 colleges and universities
that enrolled 8,736,103 undergraduates and 2,499,146 graduate students in 2018-19.
Unit of Analysis
Specifying an appropriate unit of analysis, often referred to as an Operational
Taxonomic Unit (OTU), is critical in taxonomic and classification work (Sneath and
Page 60
49
Sokal 1962). Within an organization research context, an OTU could be a group of
employees, a department, a legally recognized corporate entity, or an entire industry. A
key consideration in selecting organizational OTUs is that they are measured consistently
across the sample and are directly connected to the research question (McKelvey 1982;
Rich 1992).
American institutions of higher education are designed, managed, and assessed at
various levels of aggregation and scale. Depending on the organization, these
concentrically nested scales can include the student-instructor dyad, class, individual
academic program, department or academic unit, child campus/UnitID campus, parent
campus, OPEID, and university system. Decisions occur and data are collected at various
levels of this hierarchy.
The IPEDS dataset observes at the “UnitID” level. Although it does not provide a
definition for UnitID (National Center for Education Statistics 2020b), UnitID often
corresponds to geographically discrete campuses that are separately accredited by an
accrediting agency. California State University-Dominguez Hills and Yale University are
examples of entities that have a unique UnitID within IPEDS. IPEDS provides variables
that researchers can use to aggregate UnitID-level data into alternative levels of analysis.
The first alternative is aggregate UnitID-level data up to the OPEID level.
Organizations that are eligible to receive Title IV federal student financial aid have
program participation agreements with the U.S. Department of Postsecondary Education.
Each campus that has a participation agreement with the Department of Education has a
Page 61
50
unique OPEID (Kelchen 2017). Universities with multiple campuses can have a single
program participation agreement and a single OPEID despite having multiple accredited
campuses within the organization. Arizona State University is an example of an
organization with a single OPEID and multiple campuses with distinct UnitIDs. Since no
data is reported at the OPEID level, users wishing to use OPEID-level data must collect
count data at the UnitID level and aggregate them into a new unified OPEDID-level
organization.
A second alternative is to use “parent” campus level data. The Department of
Education allows colleges and universities to report data to IPEDS on a parent/child
campus basis (National Center for Education Statistics 2020b). The decision to use this
type of data reporting is at the discretion of the college/university and is often used for
reporting certain financial data such as state appropriations (Kelchen 2017; Jaquette and
Parra 2014). When this reporting method is used, data for smaller campuses/branch
campuses are aggregated up and reported by a single campus in the university system,
most often the largest campus within the system, and smaller campuses report no data for
that variable. IPEDS provides a parent-child factor for campuses subject to this reporting
so that analysts can reallocate data from the aggregated “parent” campus to the smaller
“children” campuses.
A third alternative is to use the multi-campus identifier within IPEDS. This
variable, which is not explicitly defined in the IPEDS glossary, provides detail on
whether a college or university campus is organized within a larger organizational unit.
Page 62
51
Inspection of the dataset shows that this variable is irregularly coded within IPEDS and
of questionable utility. For example, IPEDS classifies the ten campuses of the University
of California as belonging to the “University of California” system, but the campuses of
Arizona State University, Northern Arizona University, and the University of Arizona as
belonging to the “Arizona Board of Regents” system. While the campuses of the
University of California share a single Board of Regents and university president and
have centralized student admissions, human resources, and other university
administrative activities (University of California 2020), the three public universities in
Arizona only share a common oversight board. All other university activities occur
separately within the universities. Thus, the multi-campus variable in IPEDS may
inadvertently commensurate very different organizational hierarchies.
There are benefits and drawbacks with using each of these units of analysis. Using
either the OPEID or multi-campus approach eliminates the use of variables in the IPEDS
universe reported only as rates, such as many distance education enrollment and
graduation rate measures, since these measures cannot be reconstructed at a higher level
of analysis without count data. More importantly, the creation and use of these levels of
analysis may also create units of analysis that are not functionally relevant to a taxonomic
study: they may create “synthetic” organizations that do not correspond to how these
organizations function and create value for students and the broader public. For example,
with respect to the student experience, aggregating a small, rural branch campus of a
major research university with the much larger research-intensive campus of that
university analytically treats the branch campus students as learning within the
Page 63
52
environment of the larger campus. The campus environments of the two campuses are
unlikely to match, so aggregation is likely to create misrepresentations of reality.
This study attempts to balance the preservation of the smallest possible unit of
analysis while ensuring data availability and accuracy. As such, this study observes at the
UnitID level and uses IPEDS-created parent/child reporting factors to portion financial
data calculated at the parent-campus level down to the child-campus level.
Variables Used in Study
This section details the variables used in the present study. The combined
IPEDS/IUCPR/NSF dataset contained hundreds of plausible measures of organizational
engagement in activities that could realize public values. It would be undesirable to
include all possible measures, as many of these are highly correlated and LPA models
can be become difficult to estimate with high numbers of manifest variables. As such, a
subset of measures was selected from the dataset based on several criteria. These criteria
included data availability across the sample, use in previous studies, and uniqueness.
Underlying the selection of these measures is also the fundamental assumption that they
reflect conscious or unconscious decisions of these organizations (or their principals) in
reference to organizational goals and objectives and are, as such, indicators of
organizational designs.
Many of these variables have been created or normalized with additional variables
to improve their analytical utility. For example, the under-represented minority student
calculation contains six variables from IPEDS. As such, many of the measures used in
Page 64
53
this study do not appear as single variables in the cited data sources. Their description
below is intended to both explain the utility of these variables in representing activities
that could build public value as well as to provide sufficient detail for subsequent
researchers to recreate them. The Stata code for this study, including the code that creates
and transforms variables collected from the data sources, is available upon request from
the author. Table 2 below provides descriptive statistics as well as the underlying source
for each variable used in this study.
Admissions Rate, Percent
The admissions rate is calculated by dividing the number of freshman students admitted
for Fall 2017 by the total number of number of students who applied for freshman
admission for Fall 2017. The variable reflects the capacity of an institution to
accommodate learners who are interested in attending that institution.
Undergraduate Enrollment, Count
This variable captures the total headcount enrollment of undergraduate students in Fall
2017. It represents the general scale of access that a college or university provides society
to an undergraduate education.
Graduate Enrollment, Count
This variable reflects the total headcount enrollment of graduate students in Fall 2017 and
captures the scale of access that a college or university provides society to graduate
education.
Page 65
54
FTFT Enrollment, Percent
A first-time, full-time student is an undergraduate student who has not previously
attended an academic or occupational program at any postsecondary institution and
enrolls in a degree-seeking program as a full-time student (National Center for Education
Statistics 2020b). Most outcome measures, such as the retention rate and graduation rates,
are calculated based on the outcomes of this group of students. These students represent
the “traditionality” of the student body. College and universities that serve distance
education, adult/returning, and other types of non-traditional learners often have low rates
of FTFT enrollment.
Under-represented Minority Student Enrollment, Percent
This variable represents the percentage of the undergraduate enrollment of a college or
university that this comprised of learners from the following racial/ethnic backgrounds:
American Indian or Alaska Natives; Black; Hispanic of any race; Native Hawaiian or
other Pacific Islander; and students of two or more races.
Enrollment of Pell Grant Enrollment, Percent
Pell student enrollment captures the percentage of undergraduate students who received a
Pell grant in the 2017-18 award year. It is calculated by dividing the number of
undergraduate students who received Pell grants in the 2017-18 by the revised
undergraduate financial aid cohort of 2017-18. The Pell program is a Title IV Federal
Financial Aid program designed to provide students from lower-income families with
Page 66
55
grants to attend an undergraduate institution. This variable captures the intensity or rate
of access that a college or university provides to learners from lower-income families.
FTFT Student Geographic Concentration, HH Index
This variable captures the geographic concentration of FTFT students. It is calculated as a
Herfindahl-Hirschman (HH) Index. The number of FTFT students from each U.S. state
and the District of Columbia are converted into shares relative to the total enrollment of
FTFT students from each U.S. state and the District of Columbia. The shares for each
geographic unit are then squared and summed for each institution. As such, this measure
hypothetically ranges from 196.07 to 10,000: an institution that enrolls one student from
each U.S. state and the District of Columbia would have an HH Index value of 196.07
(complete dispersion) while an institution that enrolls one student from one state would
have an HH Index of 10,000 (complete concentration).
Tuition and Fees, Dollars
This variable is the published tuition and fees for in-state (if applicable) undergraduate
students in the 2017-18 academic year.
Net Price, Dollars
This variable is the average net price of attendance in 2017-18 for in-state (if applicable)
undergraduate students coming from families making less than $30,000 per year.
Instructional Expenditures, Dollars
Page 67
56
This variable is a measure of the total instructional expenditures in FY2018 divided by
the total undergraduate and graduate student headcount in 2017-18. Instructional
expenditures include all resources that a college or university expends on credit and non-
credit instruction for general academic, occupational, and vocational instructional
activities.
Number of Undergraduate Degrees Offered, Count
This variable measures the number of bachelor’s degrees offered by a college or
university at the four-digit (Classification of Instructional Program) code level. The CIP
is a taxonomy of academic fields of study created by the National Center for Education
Statistics of the U.S. Department of Education (NCES 2020). Examples of four-digit
level fields of study within this taxonomy include Public Policy Analysis; Mechanical
Engineering; Social Psychology; and Finance.
Bachelor’s Degree Production, HH Index
This measure reflects the concentration of bachelor’s degree production by two-digit CIP
field of study expressed in terms of a Herfindahl-Hirschman Index. Examples of two-
digit CIP codes include Public Policy, Engineering, Psychology, and Business (NCES
2020). To calculate this index, the number of degrees produced in each two-digit CIP
code are converted into shares relative to the total bachelor’s degree production of the
college or university. The shares for each two-digit CIP code are then squared and
summed for each institution. Given that there are 37 two-digit CIP codes, this measure
ranges from 270.27 (complete dispersion across two-digit CIP codes) and 10,000
Page 68
57
(complete concentration in a single two-digit CIP code). This is a measure of the
comprehensiveness of a college or university’s academic enterprise.
Tenure and Tenure-track Faculty, Percent
This variable measures the percentage of tenure and tenure-track faculty as a percentage
of total instructional faculty at a college or university in 2017-18. Tenure and tenure-track
faculty positions are characterized by their permanence (National Center for Education
Statistics 2020b). Directly related to notions of academic freedom, the presence of tenure
and tenure-track faculty captures the extent to which a college or university provides
“conditions conductive to scholarly work” and is committed to the community of scholars
(Metzger 1961; Rudolph 2011).
Science and Engineering Research Expenditures, Thousands of Dollars
This variable reflects the sum of FY17 research expenditures at a college or university in
the fields of computer and information sciences, geosciences, life sciences, agricultural
sciences, biological and biomedical sciences, health sciences, mathematics and statistics,
physical sciences, chemistry, physics, psychology, and social sciences. The data source is
the National Science Foundation’s Higher Education Research and Development Survey.
Campus-level figures are estimated from the system-level NSF data by multiplying
system-level figures by the percentage of faculty at a campus relative to the total number
of faculty within the university system. Campus-level figures are provided by the Indiana
University Center for Postsecondary Research (Indiana University Center for
Page 69
58
Postsecondary Research 2020). This measure is reported as an aggregate dollar figure and
captures the scale of knowledge production in the sciences.
Non-Science and Engineering Research Expenditures, Thousands of Dollars
This variable is the sum of FY17 research expenditures at a college or university in the
fields of business management in business administration, communication, education,
humanities, law, social work, and visual and performing arts. The data source is the
National Science Foundation’s Higher Education Research and Development Survey and
campus-level data are provided by the Indiana University Center for Postsecondary
Research (Indiana University Center for Postsecondary Research 2020). This measure is
reported as an aggregate dollar figure and captures the scale of knowledge production in
non-science academic fields.
PhD Offerings, Count
This measure is the number of disciplines in which a college or university granted a
research/scholarship doctoral degree in 2017-18. A research/scholarship doctoral degree
program requires “advanced work beyond the master’s level, including the preparation
and defense of a dissertation based on original research” (National Center for Education
Statistics 2020b). This contrasts with professional practice doctoral degrees, such as a
Doctor of Medicine or Juris Doctor, which provide knowledge and skills directly
connected to the practice of a licensed or credentialed profession. Since Yale awarded the
first Ph.D. degree in 1861, the presence and scale of research/scholarship doctoral degree
Page 70
59
programs at a college or university has been seen as a key organizational differentiator
and driver of value to academia and broader society (Rudolph 2011).
Page 71
60
Table 2: Descriptive Statistics
Variable n Mean Std. Dev. Min Max Source
Student Access
Admissions Rate, Percentage 1,620 0.69 0.21 0.03 1.00 IPEDS
Students Enrolled in Distance Education, Percent 1,620 0.23 0.24 0.00 1.00 IPEDS
Undergraduate Enrollment, Count 1,620 5392.66 8141.65 39.00 83544.00 IPEDS
Graduate Enrollment, Count 1,620 1542.68 2957.31 0.00 29290.00 IPEDS
FTFT Enrollment, Percent 1,620 0.20 0.07 0.00 0.41 IPEDS
Under-represented Minority Student Enrollment, Percent 1,620 0.29 0.21 0.00 1.00 IPEDS
Pell Grant Enrollment, Percent 1,620 36.84 15.78 0.00 100.00 IPEDS
FTFT Geographic Concentration, HH Index 1,620 5477.73 2810.43 422.46 10000.00 IPEDS
Learning Environment
Net Price (Family Income>$30k), Dollars 1,620 15634.10 7249.89 -3260.00 54584.00 IPEDS
Tuition and Fees, Dollars 1,620 23549.24 14319.26 1020.00 57208.00 IPEDS
Instructional Expenditures per Student, Dollars 1,620 10421.72 9234.42 0.00 129954.50 IPEDS
Number of Bachelor’s Degree Offerings, Count 1,620 31.39 19.00 1.00 111.00 IUCPR
Bachelor's Degree Production, HH Index 1,620 2301.99 2353.83 578.71 10000.00 IPEDS
Knowledge Enterprise
Tenure and Tenure-track Faculty, Percent 1,620 0.57 0.34 0.00 1.00 IPEDS
Science and Engineering Research Expenditures, Dollars 1,620 37091.55 156643.80 0.00 2556641.00 NSF/IUCPR
Non-Science and Engineering Research Expenditures, Dollars 1,620 2416.34 9841.52 0.00 126607.00 NSF/IUCPR
PhD Degree Offerings, Count 1,620 2.26 5.07 0.00 25.00 IPEDS
Page 72
61
Statistical Method
There are a variety of methods to identify groups of similar entities within
multivariate datasets and assign members to these groups. These approaches can be
understood as existing on a spectrum ranging from inductive-oriented methods to
deductive-oriented methods (Schmiege, Masyn, and Bryan 2017). Deductive-oriented
methods are ideal for confirmatory research that seeks to test hypotheses in the context of
a theoretical model. Methods that specify the number of groups present within a
population, such as confirmatory latent class analysis, are examples of deductive-oriented
clustering methods. Inductive-oriented methods, often characterized as data-driven or
bottom-up methods, are largely applied in exploratory settings. Inductive methods allow
researchers to analyze datasets without prior theoretical expectations on phenomena, such
as the number of groups present. K-means clustering and latent class analysis are
examples of inductive methods.
Latent Class and Latent Profile Analysis
Latent class analysis (LCA) is a statistical method to determine groups of
unobserved heterogeneity within populations (Lazarsfeld 1968; Nylund-Gibson and Choi
2018). Although the term “latent class analysis” has been generically applied to models
using either continuous or categorical observed variables, latent class analysis applies
only to models that use categorical observed variables to classify observations into
classes. The classic two-by-two matrix popularized by management consultants is a
simple example of latent class analysis (Goodman 2002). Latent models that use
Page 73
62
continuous observed variables are called latent profile models (LPAs). Figure 2 shows
the relationship of these models to other common mixture models.
Figure 2: Mixture Models
Latent Models for Means
Continuous Discrete
Observed Variables Continuous Factor Analysis Latent Profile Analysis
Discrete Item Response Theory Latent Class Analysis
Both LCA and LPA have been widely used in the social sciences and medicine.
For example, researchers have used LCA and LPA to classify types of children who
present for mental healthcare (Petersen, Qualter, and Humphrey 2019), types of family-
owned firms (Stanley, Kellermanns, and Zellweger 2016), and types of customers in a
market (Oberski 2016). Within the domain of education, researchers have used these
methods to create typologies of students at four-year institutions (Dugan 2011), two-year
institutions (Hum 2016), as well as leadership types of principals of primary and
secondary schools in the U.S. (Urick and Bowers 2014).
LCA and LPA models conceptualize class membership as a latent, or unobserved,
categorical variable present within a population (Goodman 2002; Nylund-Gibson and
Choi 2018). The fundamental premise of these models is that covariation between
observed measures is explained by the latent group membership. These methods use
multivariate datasets to estimate the number of classes present in the sample, the
Page 74
63
probability of each observation belonging to each class, and the relative size of each
class. They can be used in both confirmatory and exploratory research.
There are a number of advantages of LCA and LPA relative to other cluster
analysis methods, such as k-means. LCA and LPA do not necessarily require variable
standardization, are less affected by variable multicollinearity than other cluster analysis
methods (Stanley, Kellermanns, and Zellweger 2016), and are able to accommodate
different distributional assumptions of manifest variables within the structural model
(Bauer and Curran 2004; Masyn 2013; Nylund-Gibson and Choi 2018). LCA and LPA
use a maximum likelihood estimation with an expectation-maximization procedure,
which allows for observations with missing data to be analyzed. Further, LCA and LPA
estimations result in group membership probabilities. These probabilities, unlike discrete
group assignments, can help illuminate the relationships between groups and identify
observations that are marginally attached to a group.
The equations estimated in latent profile analysis were developed by Lazarsfeld
(1968). The general form of these equations, given in Vermunt (2004), explains the joint
distribution of manifest variables as a mixture of class-specific manifest variable
distributions:
Page 75
64
In the equation above C represents the number of classes, µx is the mean vector of latent
class x, and Σx is the covariance matrix. The assumption of local independence, and thus,
equal error variances across classes, yields:
Principled Model Building
In exploratory research with latent profile models, the number of classes present
within a population is not known a priori. The LPA literature recommends iterating
through the steps of principled model building to increase the reliability and validity of
the analytical results. This entails completing the steps of model specification, model
identification, and class enumeration before proceeding to classification.
Model specification involves specifying the measurement model in the structural
model, including the family and linking functions appropriate for the manifest indicators,
and specifying the within-class variance structure. Latent profile models are able to
account for different assumptions of the mean and covariance structure of manifest
measures. Options include allowing all variances to vary across classes; constraining
manifest variable covariance to be equal across classes; fixing within-class variable
covariance at zero but allowing variance across classes to be estimated; and fixing
within-class covariance of manifest variables to zero and constraining covariance across
classes to be equal (but not necessarily at zero). The last two options reflect an
assumption of manifest variable independence conditional on class membership (Bauer
Page 76
65
and Curran 2004; Masyn 2013). These assumptions can impact the number of classes
identified, and by extension, the classification of observations into classes. Masyn (2013)
recommends specifying various models with these options and selecting a within-class
variance structure option based on relative model fit or theoretical and practical
considerations.
Model identification proceeds after model specification. It entails comparing the
log-likelihood estimates of models with the same number of class solutions but different
starting seeds. Models for the same class solution (k=4, for example) that have lower log-
likelihood estimates than other models with that same class solution could reflect local
maxima of the log-likelihood function. Running a range of models with different starting
seeds and selecting the model for each class solution with the highest log-likelihood
estimate helps build confidence in the identification of models reflecting the global
maximum of the log-likelihood function (Nylund, Asparouhov, and Muthén 2007; Masyn
2013). Only models reflecting the global maxima can be used for subsequent steps. There
are no clear recommendations in the literature on the number of classes for which models
should be identified. To provide an analytical and conceptual baseline, researchers often
start by specifying a model with one class and increase the number of classes by one until
model convergence issues are encountered (Nylund-Gibson and Choi 2018).
Once candidate models for each class solution are identified in the model
identification step, the class enumeration step can proceed to identify the number of
classes present in the data by comparing goodness-of-fit statistics across the range of
Page 77
66
class solutions. Although there are no universally accepted model fit criteria, there are
several broad approaches to determining the number of classes present within the data.
These include using information criteria or model criteria. Information criteria are based
on statistical analyses of model fit while model criteria evaluate results in light of
interpretability and usability (Law and Harrington 2016).
Information criteria include both absolute and relative goodness-of-fit measures.
The present analysis will not consider absolute model fit statistics in the class
enumeration step, as these are unreliable in latent profile analyses (Masyn 2013). The
log-likelihood chi-squared statistic, the most commonly used statistic of absolute model
fit in LCA and LPA models, is inaccurate for models with large numbers of manifest
variables or variables measured on a continuous measurement scale (Lanza, Bray, and
Collins 2012). Commonly used measures of relative model fit include the Akaike
Information Criterion (AIC) and the Bayesian Information Criterion (BIC) (Nylund,
Asparouhov, and Muthén 2007; Stanley, Kellermanns, and Zellweger 2016; Nylund-
Gibson and Choi 2018; MacDonald 2018; Petersen, Qualter, and Humphrey 2019). These
statistics measure model fit, but penalize for the increased number of classes estimated.
Lower values of AIC and BIC indicate better fit. Since these model fit statistics
tend to continually decrease as the number of specified classes increases, they are often
plotted and examined for an “elbow” point where the slopes noticeably change. The
number of classes associated with this point is often selected as the appropriate number of
Page 78
67
classes, since increasing the number of classes beyond this number results in diminished
returns of model fit (Lanza, Bray, and Collins 2012).
Once the number of classes has been selected, posterior probabilities for class
membership are calculated for each observation in the dataset. Posterior classification
probabilities range from 0 to 1 and reflect the model-estimated probability of an
observation belonging to a particular class in each model (Nylund, Asparouhov, and
Muthén 2007).
Analytical Method of Present Study
After extracting all relevant data from IPEDS and the Indiana University Center
for Postsecondary Research, I used Stata 15.1 for data merging and all subsequent data
management tasks, including allocating parent campus data to child campuses, generating
new variables, and dropping non-permitted colleges and universities from the sample. I
used the lclass option of the gsem command in Stata 15.1 (MacDonald 2018; StataCorp
2020) to fit latent profile models to the dataset and predict posterior probabilities of class
membership in a manner consistent with the steps of principled model building detailed
above. More detail is provided in Chapter 4.
Page 79
68
CHAPTER 4: RESULTS
This chapter will provide the results of the analysis, organized by the steps of
principled model-building described in the latent profile analysis literature (Nylund,
Asparouhov, and Muthén 2007; Lanza, Bray, and Collins 2012; Masyn 2013; Schmiege,
Masyn, and Bryan 2017; Porcu and Giambona 2017; Nylund-Gibson and Choi 2018).
This includes the steps of model specification, model identification, class enumeration,
and classification. A comparison of the results of the latent profile analysis to the 2018
Basic Carnegie Classification are also provided.
Model Specification
Following convention in the university classification literature, the present study
standardized all data with a z-score transformation. Figure 3 provides histograms of the
resulting variables. Although inspection of the distributions of manifest variables
revealed several non-normal distributions, assumptions of the distributions of manifest
variables within classes—rather than in the overall sample—determine the selection of
distributions and linking functions in the structural model. The present analysis assumed
manifest variables were normally-distributed within classes and used Gaussian
distributions within the structural model. Assumptions of within-class variable
distributions are required in LPA, although these distributional assumptions are
unverifiable because class-membership is not known (Oberski 2016).
Page 80
69
Various specifications of the structural model were attempted to accommodate the
nonnormally distributed variables, including Poisson, logit, and ordered probit. These
models encountered convergence issues or produced uninterpretable classes.
Various specifications of the within-class variance/covariance structures were
attempted. Models that did not assume local independence experienced convergence and
identification issues and were not able to be estimated and compared.
Page 81
70
Figure 3: Histograms of Standardized Variable Transformations
Page 82
71
The challenges of fully estimating variance-covariance structures in high-dimensional
datasets with latent profile analysis are known (Steinley and Brusco 2011). The present
study was only able to consider models that fixed covariance between classes to be equal.
Model Identification
Table 4.1 provides the log-likelihood estimates for models with 1-20 classes with
five different start seeds. Following the recommendation of the literature, the model for
each class solution that produced the highest log-likelihood estimate was selected for
subsequent stages of the analysis. The model selected for each class solution is bolded in
Table 3.
Table 3: Log Likelihood Estimates for Classes with Different Starting Seeds
Starting Seed
7 9 11 13 15
Class = k
1 -39069.1 -39069.1 -39069.1 -39069.1 -39069.1
2 -35609.5 -35609.5 -35609.5 -35609.5 -35609.5
3 -34542 -34542 -34059.2 -34542 -34542
4 -33024.1 -33179.1 -33179.1 -33179.1 -33179.1
5 -31789 -32737.8 -31700.9 -31696.2 -32436.1
6 -31221.7 -31276.8 -30941.5 -30941.5 -32330.2
7 -30959.8 -30630.5 -31007.3 -31529.9 -30959.8
8 -30167.5 -30167.5 -30167.1 -30167.5 -30167.1
9 -29666.3 -30023.5 -29790.2 -29754.3 -29735.5
10 -29420 -29148.5 -29174.8 -29420 -29268.7
11 -28749.8 -28776.9 -29026.4 -28887.5 -28987.5
12 -28653 -28614.7 -28870.4 -28492.9 -28535.9
13 -28612.4 -28151.3 -28151.3 -28390.7 -28107.6
14 -28048.7 -27865 -28161.2 -27787.3 -28009.9
15 -27223 -27179 -27222.5 -27542 -27362.1
16 -27140.4 -27332.2 -26861 -27464.3 -26928.1
17 -26608.6 -26838.1 -26837.7 -26634.6 -27077.4
18 -26681.6 -26529.1 -26883.4 -26619.2 -27156.3
Page 83
72
19 -26550.8 -27053.7 -26512.3 -26466.1 -26548.4
20 -26284.6 -26331.7 -26475.9 -26360.4 -26526.6
Class Enumeration
Figure 4 provides goodness-of-fit statistics for the candidate models with classes
ranging from 1-20. The elbow in the scree plot at k=5 suggests a 5 class solution.
Inspection of these five classes revealed insufficient class homogeneity and class
separation for the purpose of creating a classification of colleges and universities. As is
common with exploratory techniques, concerns of class interpretability and utility
dictated a different number of classes than suggested by only considering model fit
statistics (Masyn 2013; Oberski 2016). The 13 class solution was selected on the basis of
being the next elbow present within the plot. As such, it is considered the model that
balances explanation of the underlying structure of the data with model parsimony and
practical utility. The full model output for the 13-class solution is provided in Appendix
B.
Page 84
73
Figure 4: Goodness-of-fit Statistics for Identified Models
Classification
After selecting the number of classes within the dataset, the present study used
posterior probabilities to assign all observations to the enumerated classes. Posterior
classification probabilities range from 0 to 1 and reflect the model-estimated probability
of an observation belonging to a particular class in each model (Nylund, Asparouhov, and
Muthén 2007). Observations were assigned to the class for which they had the highest
posterior probability. Figure 5 provides a histogram of posterior probabilities of class
membership across the observations for the 13-class solution.
50000
55000
60000
65000
70000
75000
80000
1 2 3 4 5 6 7 8 9 10 11 12 13 14 15 16 17 18 19 20
ClassAIC BIC
Page 85
74
Figure 5: Histogram of Posterior Probabilities for Class Membership
The average posterior probability of membership was .959. There were 170
colleges and universities that had posterior probabilities of membership of 1, indicating
the highest confidence in class membership. Only three colleges and universities had
calculated posterior probabilities less than .5. These were:
Loyola University Chicago (.465)
Medaille College (.451)
Nyack College (.421)
Class Homogeneity
Class homogeneity is critical in evaluating the results from a latent profile
analysis as it captures how well the analysis has created homogeneous groupings from
the overall sample. It can be evaluated by comparing the within-class variances or
standard deviation of variables to these statistics in the overall sample (Masyn 2013).
Figure 6 provides the within-class variance for all 17 manifest variables across for each
Page 86
75
of the 13 derived classes. Since all manifest variables have been standardized, the
standard deviation for all variables in the overall sample is one. Thus, Figure 6 shows that
all within-class variable standard variations are significantly less than observed in the
overall sample. Classes 12 and 6 have the lowest levels of within-class variances across
the manifest variables, indicating the highest levels of class homogeneity. Class 11 is the
most heterogeneous class, although it is still significantly more homogeneous than the
overall sample. The within-class standard deviations observed in Figure 6 are tightly
coupled with the size of these classes: Class 12 contains 484 members while Class 4
contains only four members.
Class Separation
Class separation refers to the separation of class-specific variable mean
distributions (Masyn 2013). Less overlap between the distributions of class-specific
variable means indicates that classes are more separated or “distinct” on a particular
variable compared to a variable where more overlap between these distributions is
observed. Figure 7 plots the variable mean distributions for each class by variable.
Standard normal distributions, which correspond to the distributions of the variable
means observed in the overall population, are represented by dotted lines.
The highest-class separation is observed in tuition and fees, Pell-eligible
enrollment, and undergraduate degree offerings. The lowest class separation, the most
overlap in the distributions of class-specific variables means, is observed in
undergraduate enrollment, graduate enrollment, PhD offerings, and instructional
Page 87
76
expenditures per full-time equivalent student. For each of these variables, however, there
are classes where the variable mean distributions are significantly separated from a class
group of overlapping mean distributions. This indicates that there is still class separation
observed across these variables.
Page 88
77
Figure 6: Within-Class Standard Deviation of Manifest Variables by Class
Page 89
78
Figure 7: Class-specific Variable Mean Distributions by Variable
Page 90
79
Table 4: Class-specific Variable Means
Class (k=13)
1 2 3 4 5 6 7 8 9 10 11 12 13 Tot.
Admissions Rate, Percentage 0.73 0.60 0.55 0.66 0.31 0.75 0.89 0.70 0.78 0.14 0.77 0.70 0.70 0.69
Students Enrolled in Distance
Education, Percent
0.32 0.04 0.24 0.23 0.01 0.34 0.52 0.26 0.26 0.03 0.92 0.13 0.28 0.23
Undergraduate Enrollment, Count 1599
2.71
1241.
29
32075
.31
2766.
12
3541.
31
4787.
88
1791.
31
1683.
86
516.9
9
13114.
11
5860
1.00
2215.
27
20725
.65
5392.
66
Graduate Enrollment, Count 2839.
55
371.3
6
10672
.66
510.1
5
1504.
39
801.3
6
706.7
5
574.6
6
187.7
9
13549.
58
2240
0.25
733.4
7
5914.
95
1542.
68
FTFT Enrollment, Percent 0.16 0.23 0.20 0.24 0.26 0.17 0.11 0.20 0.15 0.22 0.05 0.23 0.19 0.20
Under-represented Minority Student
Enrollment, Percent
0.29 0.18 0.23 0.88 0.19 0.28 0.42 0.26 0.19 0.24 0.28 0.23 0.28 0.29
Pell Grant Enrollment, Percent 36.68 26.76 24.51 68.99 15.77 38.20 50.71 40.36 43.64 17.16 36.50 33.31 30.38 36.84
FTFT Geographic Concentration, HH
Index
7872.
67
2676.
92
5702.
89
4993.
84
1396.
03
7552.
37
6910.
65
4463.
65
6049.
46
1674.4
2
1054.
61
4855.
04
6036.
50
5477.
73
Net Price, Dollars 1022
3.81
2960
4.15
10036
.89
1594
2.14
1245
8.17
1113
4.58
1332
8.00
1902
8.21
1306
0.32
7736.7
4
2082
0.00
1936
6.86
12536
.23
1563
4.10
Tuition and Fees, Dollars 8959.
74
4075
1.29
13744
.86
1344
0.23
5075
7.74
1034
1.55
1301
7.90
2622
1.82
1455
8.12
45800.
42
1645
3.00
3422
2.93
13470
.01
2354
9.24
Instructional Expenditures, Dollars 7533.
30
1762
9.35
15760
.89
7550.
15
2660
0.05
7182.
74
5456.
08
6612.
91
8682.
06
60889.
62
1971.
69
9992.
86
12167
.56
1042
1.72
Number of Undergraduate Degrees
Offered, Count
55.55 5.42 75.40 23.22 36.21 29.70 11.44 22.37 3.13 58.16 40.25 32.54 64.15 31.39
Bachelor's Degree Production, HH
Index
1029.
15
8483.
15
1022.
38
1400.
60
1547.
60
1522.
26
3774.
73
2079.
08
9393.
40
1257.2
9
2185.
18
1526.
22
1041.
76
2301.
99
Tenure and Tenure-track Faculty,
Percent
0.73 0.26 0.64 0.68 0.74 0.76 0.04 0.03 0.06 0.58 0.00 0.78 0.67 0.57
Science and Engineering Research
Expenditures, Dollars
1613
1.76
1057.
73
58234
4.09
3117.
44
4729
0.24
1074.
31
0.00 119.6
3
0.00 10068
41.84
0.00 1268.
30
16135
1.75
3709
1.55
Non-Science and Engineering
Research Expenditures, Dollars
1381.
29
23.67 40946
.54
204.7
9
3521.
76
72.62 0.00 22.67 0.00 47415.
95
0.00 72.34 12539
.39
2416.
34
PhD Offerings, Count 3.42 0.25 20.00 1.35 4.06 0.45 0.35 0.33 0.15 19.26 2.00 0.54 14.75 2.26
Page 91
80
Description of 13 Classes
This section will provide a short description of the distinguishing attributes of
each class, listings of representative college and university members, and lists of
members that had the lowest calculated posterior probability of membership.
Unstandardized class-specific variable means are provided in Table 4.
The number that identifies each class in the section below does not correspond to
a hierarchy or rank of any kind. The class numbers are randomly assigned to classes by
Stata and are provided here to assist the reader in comparing results as well as subsequent
researchers replicating results with the same dataset and Stata syntax.
Class 1: Community-Scale Research Universities
Class 1 colleges and universities are high-access, low-cost, medium-scale colleges
and universities that largely serve students from the same state and operate small-scale
research enterprises. Class 1 colleges and universities have the highest geographic
concentration of FTFT freshman of any class, indicating they enroll mostly students from
the state in which they are located. They also have, on average, the lowest tuition and
fees of any class and one of the lowest net prices for low-income students. These colleges
and universities are comprehensive to the extent that they offer an average of 55
undergraduate degree options, which is the fourth highest across the 13 classes, and
degree production is well dispersed across the disciplines. Nearly three-quarters of
instructional faculty are tenured or tenure-track. Science and engineering research
expenditures per faculty averages $16,131, which ranks 4th highest of any class. The 110
Page 92
81
Community-Scale Research Universities identified in the sample enrolled 1,759,198
undergraduates and 312,351 graduate students in 2017-2018. The first 15 members by
alphabetical order of Class 1 include:
Appalachian State University
Arkansas State University-Main
Campus
Arkansas Tech University
Ball State University
Boise State University
Brigham Young University-
Idaho
California Polytechnic State
University-San Luis Obispo
California State Polytechnic
University-Pomona
California State University-Chico
California State University-
Dominguez Hills
California State University-East
Bay
California State University-
Fresno
California State University-
Fullerton
California State University-Long
Beach
California State University-Los
Angeles
Other representative members of class 1 include:
Louisiana Tech University
Northern Arizona University
Northern Illinois University
The University of Texas at San
Antonio
San Jose State University
University of Alaska Anchorage
University of Maryland-
Baltimore County
University of Wisconsin-
Oshkosh
Western Illinois University
Utah Valley University
The average maximum posterior classification probability for class 1 colleges and
universities was .9301. Table 5 provides the colleges and universities in Class 1 that are
least “attached” to this class, as measured by their posterior classification probability, and
the class for which they have second highest classification probability.
Page 93
82
Table 5: Lowest Posterior Probabilities Observed in Class 1
Institution Post. Prob. (k=1) Other Class
Florida Gulf Coast University 0.496476 8
Central Connecticut State University 0.547046 6
University of Minnesota-Duluth 0.565104 6
Western Illinois University 0.605517 6
Kean University 0.607708 6
California State University-Dominguez Hills 0.644361 6
California State University-East Bay 0.675677 6
Texas A & M University-Commerce 0.685495 6
University of North Georgia 0.686252 6
Class 2: Professional Schools
Class 2 colleges are small, professionally oriented colleges that offer degrees in a
small number of fields. These college and universities have small student bodies,
enrolling an average of 1,241 undergraduates and 371 graduate students. Almost all
instruction at class 2 members occurs face-to-face: an average 4% of students are
enrolled in some distance education. Although these colleges and universities draw
students from across the country, they have the lowest levels of under-represented
minority students in their undergraduate student bodies. At an average of $40,751, their
average tuition fees ranks fourth highest and the net price for low-income students is the
highest of any class. Few low-income students enroll in class 2 colleges. Only 26% of
faculty at Class 2 colleges are tenure or tenure-track and colleges have little science and
non-science research expenditures. The 55 colleges assigned to Class 2 enrolled a total of
68,271 undergraduates and 20,425 graduate students in 2017-18. The first 15 include:
Albany College of Pharmacy and
Health Sciences
Art Center College of Design
Babson College
Bentley University
Berklee College of Music
Bryant University
California Institute of the Arts
Page 94
83
Cleveland Institute of Art
Cleveland Institute of Music
College for Creative Studies
College of the Atlantic
Colorado School of Mines
Columbia College Hollywood
Columbus College of Art and
Design
Cornish College of the Arts
Other notable examples include:
The Juilliard School
Pratt Institute-Main
Ringling College of Art and
Design
Sarah Lawrence College
Rhode Island School of Design
The average posterior probability for colleges belonging to Class 2 is .97. Table 6
provides the ten schools that are least attached to Class 2.
Table 6: Lowest Posterior Probabilities Observed in Class 2
Institution Post. Prob. (k=2) Other Class
Milwaukee School of Engineering 0.596188 8
Pratt Institute-Main 0.702639 12
Montserrat College of Art 0.80917 8
Saint Joseph Seminary College 0.82928 9
Columbia College Hollywood 0.888561 9
John Paul the Great Catholic University 0.90701 9
New Hampshire Institute of Art 0.909532 9
Laguna College of Art and Design 0.938458 9
Columbus College of Art and Design 0.965422 3
Pacific Northwest College of Art 0.986354 9
Class 3: National-Scale Research Universities
Class 3 universities are large, comprehensive, research-intensive universities.
Members of Class 3 enroll an average of 32,075 undergraduate students and 10,672
graduate students, the second and third highest of any group, respectively. As a group,
tuition and fees and the net price for low-income students are lower than the average
observed in the overall sample of colleges and universities. However, the enrollment of
Pell-eligible and underrepresented minority students is also less than average in the
sample. The enrollment rate of FTFT freshman ranks in the middle of the other classes,
Page 95
84
indicating that these universities serve a combination of both traditional and non-
traditional students.
Class 3 universities are the most comprehensive universities observed in the
sample to the extent that they average the highest number of bachelor’s and PhD degree
offerings. An average of 64% of instructional faculty at these universities are tenure or
tenure-track and they average $582,344,000 in science and engineering research
expenditures. This is second highest of any class and 3.4 standard deviations above the
mean for the sample. The 35 Class 3 universities enrolled 1,122,636 undergraduates and
373,543 graduate students in 2017-18. The first 15 members include:
Arizona State University-Tempe
Boston University
Florida State University
Georgia Institute of Technology-
Main Campus
Georgia State University
Indiana University-Bloomington
Michigan State University
Ohio State University-Main
Campus
Pennsylvania State University-
Main Campus
Purdue University-Main Campus
Rutgers University-New
Brunswick
Syracuse University
Texas A & M University-College
Station
The University of Texas at
Austin
University of Arizona
Other representative members include:
University of California-
Berkeley
University of Florida
University of Illinois at Urbana-
Champaign
University of Minnesota-Twin
Cities
University of South Florida-Main
Campus
University of Wisconsin-
Madison
Posterior probabilities for membership in Class 3 averages .996 across members.
The least-attached members to Class 3 are provided in Table 7.
Page 96
85
Table 7: Lowest Posterior Probabilities Observed in Class 3
Institution Post. Prob. (k=3) Other Class
University of Colorado Boulder 0.885 13
Syracuse University 0.990 13
University of North Carolina at Chapel Hill 0.997 10
University of Virginia-Main Campus 0.997 13
Washington State University 0.998 13
Georgia State University 0.998 13
University of Iowa 0.999 13
Class 4: Legacy Access Universities
Class 4 schools have small, highly diverse but traditional undergraduate student
bodies comprised mostly of students from the local community. Under-represented
students comprise an average of 88% of undergraduate enrollment at Class 4 colleges and
universities, by far the highest rate of any grouping. They also enroll the highest
percentage of Pell-eligible students. Although several other classes have diverse student
bodies, Class 4 is unique to the extent that it has one of the highest rates of FTFT
freshman enrollment as well as average rates of distance education enrollment. The
majority of instructional faculty are tenured and tenure-track, but faculty at these colleges
engage in low levels of sponsored research and Ph.D. degree offerings are very limited.
Taken together, this indicates Class 4 organizations mostly serve young, traditional
learners with traditional learning environments.
Class 4 includes many historically black colleges and universities. There are 81
members in this class and they enrolled 224,056 undergraduates and 41,322 graduate
students in 2017-18. The first 15 members include:
Page 97
86
Alabama A & M University
Alabama State University
Alcorn State University
Allen University
Benedict College
Bennett College
Bethune-Cookman University
Bloomfield College
Bowie State University
Central State University
Cheyney University of
Pennsylvania
Chicago State University
Chowan University
Claflin University
Clark Atlanta University
Other representative members include:
Howard University
Jackson State University
Morehouse College
North Carolina A&T State
University
Talladega College
Tuskegee University
University of California-Merced
Posterior probabilities for membership in Class 3 averaged .98. Table 8 provides
the colleges and universities that are least attached to Class 4.
Table 8: Lowest Posterior Probabilities Observed in Class 4
Institution Post. Prob. (k=4) Other Class
Nyack College 0.42 12
Lincoln College 0.67 6
Virginia State University 0.69 6
The College of New Rochelle 0.81 12
Southern University at New Orleans 0.82 6
Shaw University 0.87 8
University of North Texas at Dallas 0.94 6
Howard University 0.96 12
Chicago State University 0.98 6
Virginia Union University 0.98 8
Class 5: Classical Academies
Class 5 contains highly selective, high-cost, low-diversity colleges and
universities that serve small numbers of undergraduates and graduate students. Class 5
Page 98
87
colleges and universities have the second-lowest average admissions rate, the highest
combined tuition and fees, and spend the second-highest amount on instruction per
student. Their instructional environments are highly traditional: on average, 26% of
undergraduates are FTFT freshman and only 1% of students are enrolled in distance
education coursework. Three-quarters of instructional faculty at these colleges and
universities are tenured or tenure-track. Research expenditures per faculty are above the
overall sample average but are still rank significantly below class leaders.
There are 84 colleges and universities assigned to Class 5. Together they enrolled
297,470 undergraduates and 126,369 graduate students in 2017-18. The first 15 members
include:
American University
Amherst College
Bard College
Barnard College
Bates College
Boston College
Bowdoin College
Brandeis University
Brown University
Bryn Mawr College
Bucknell University
California Institute of
Technology
Carleton College
Carnegie Mellon University
Case Western Reserve University
Other representative members include:
Claremont McKenna College
College of the Holy Cross
College of William and Mary
Dartmouth College
Fordham University
Georgetown University
Princeton University
Swarthmore College
Tufts University
The posterior probabilities of membership across Class 5 colleges and universities
average .96. There are several colleges that are only marginally attached to the Class 5, as
shown in Table 9. Compared to more strongly attached members of Class 5, these
Page 99
88
colleges and universities generally have higher admissions rates and lower research
intensity.
Table 9: Lowest Posterior Probabilities Observed in Class 5
Institution Post. Prob. (k=5) Other Class
Clark University 0.51 12
Worcester Polytechnic Institute 0.54 2
Santa Clara University 0.63 12
St Olaf College 0.65 12
Stevens Institute of Technology 0.68 12
The University of the South 0.71 12
Earlham College 0.77 12
Case Western Reserve University 0.77 13
Muhlenberg College 0.84 12
Furman University 0.85 12
College of William and Mary 0.85 12
Class 6: Community-Scale Access Colleges
Class 6 contains small-scale, low-cost, medium-access, non-research colleges and
universities. On most variables, Class 6 closely tracks the mean values observed across
all colleges and universities contained in the sample. They are distinguished by having
particularly low tuition and fees, but at the same time, low levels of financial aid: it is one
of the few classes where the net price for low-income students exceeds combined tuition
and fees. Their undergraduate student bodies also have the second-highest geographic
concentration of any class. Class 6 members have minimal research enterprises and few
PhD offerings despite having an instructional faculty that is, on average, 76% tenured or
tenure-track.
Page 100
89
Class 6 has one of the largest memberships of any class. There are 305 colleges
and universities assigned to this class and they enrolled 1,460,304 undergraduates and
244,414 graduate students in 2017-18. The first fifteen members include:
Adams State University
Angelo State University
Ashland University
Auburn University at
Montgomery
Augusta University
Aurora University
Austin Peay State University
Averett University-Non-
Traditional Programs
Bemidji State University
Black Hills State University
Bloomsburg University of
Pennsylvania
Bluefield State College
Brescia University
Bridgewater State University
California State University
Maritime Academy
Other representative members include:
California State University-
Bakersfield
Dickinson State University
Purdue University Fort Wayne
Slippery Rock University of
Pennsylvania
University of Wisconsin-Stevens
Point
Average maximum posterior probabilities for members of Class 6 average .94.
Examination of the least-attached members by class indicates that Class 6 is related to
both Class 1 and Class 12, with research intensity being a prime differentiator.
Table 10: Lowest Posterior Probabilities Observed in Class 6
Institution Post. Prob. (k=6) Other Class
CUNY Lehman College 0.50 1
St. Joseph's College-New York 0.51 12
Lee University 0.51 12
Southeast Missouri State University 0.52 1
Michigan Technological University 0.52 1
University of the Cumberlands 0.53 12
Southern Illinois University-Edwardsville 0.55 1
Toccoa Falls College 0.56 12
West Texas A & M University 0.56 1
Carlow University 0.58 12
Page 101
90
Campbellsville University 0.58 12
Class 7: Hybrid Professional Academies
Class 7 is comprised of small, non-research, access-oriented colleges and
universities that offer a limited number of degree programs largely through digital
teaching modalities. Class 7 members average the highest acceptance rate of any class
and they enroll the second highest percentage of low-income and under-represented
minority students of any class. Only 11% of their undergraduate student bodies are FTFT
freshman and 52% are enrolled in at least some distance education, indicating that these
colleges largely serve non-traditional learners. These schools offer, on average, just 11
undergraduate degree programs. Many members of Class 7 are affiliated with a religious
denomination. There are 80 colleges and universities assigned to Class 7. They
collectively enrolled 143,305 undergraduates and 56,540 graduate students in 2017-2018.
The first fifteen members include:
American Baptist College
Amridge University
Arlington Baptist University
Baptist Bible College
Baptist University of the
Americas
Bellevue University
Bethel University
Beulah Heights University
Boricua College
Brandman University
Calvary University
Cambridge College
Capitol Technology University
Carlos Albizu University-Miami
Central Methodist University-
College of Graduate and
Extended Studies
Other representative members include:
Brandman University
Divine Word College
Gods Bible School and College
Grace Christian University
Selma University
The Baptist College of Florida
Page 102
91
The maximum posterior probabilities for members of Class 7 averages .94. Table
11 lists the members of Class 7 with the lowest posterior probability of class
membership.
Table 11: Lowest Posterior Probabilities Observed in Class 7
Institution Post. Prob (k=7) Other Class
Mid-Atlantic Christian University 0.59 8
Randall University 0.60 8
Presentation College 0.67 8
Selma University 0.68 4
Trinity Baptist College 0.72 8
Baptist Bible College 0.73 9
Gwynedd Mercy University 0.74 8
National University 0.77 1
Wilmington University 0.77 8
Beulah Heights University 0.78 9
Class 8: Community-Scale Liberal Arts Colleges
Class 8 is comprised of small, non-research, medium-cost, access-oriented
colleges and universities. Class 8 is closely related to Class 7, although Class 8 schools
have significantly fewer students enrolled in distance education courses (.26 compared to
.52), charge higher tuition and fees ($26,221 compared to $13,017), and enroll lower
numbers of low-income and underrepresented minority students. Despite having similar
undergraduate and graduate enrollments, Class 8 offers twice as many undergraduate
degree programs than Class 7. The 187 colleges and universities classified as Class 8
enrolled 314,882 undergraduates and 107,462 graduates in 2017. The first 15 members
include:
Alaska Pacific University
Albertus Magnus College
Alice Lloyd College
Arizona Christian University
Page 103
92
Ave Maria University
Azusa Pacific University
Bacone College
Barclay College
Barry University
Bay Path University
Beacon College
Becker College
Bennington College
Bethany Lutheran College
Blue Mountain College
Other representative members include:
College of the Ozarks
Franklin Pierce University
Prescott College
St. Thomas University
The average posterior probabilities of membership for members of Class 8 are
.97. Table 12 provides the least-attached members of Class 8.
Table 12: Lowest Posterior Probabilities Observed in Class 8
Institution Post. Prob. (k=8) Other Class
Thomas University 0.50 7
Maharishi University of Management 0.55 7
Pennsylvania State University-Mont Alto 0.60 6
Regis University 0.61 12
Centenary University 0.62 12
Ohio Christian University 0.62 7
Robert Morris University Illinois 0.64 7
William Penn University 0.66 12
Lancaster Bible College 0.70 7
Greensboro College 0.74 12
Southwestern Christian University 0.76 7
Class 9: Seminaries, Yeshivas, and Other Colleges of Divinity
Class 9 colleges are exceptionally small and highly specialized organizations. On
average, they enroll just 516 undergraduates and 187 graduate students and offer only 3
different undergraduate degree programs. The vast majority of faculty at Class 9 colleges
are not tenured or tenure-track and do not engage in research associated with research
expenditures. Class 9 largely includes seminaries, schools of theology, yeshivas, and
Page 104
93
other types of organizations that prepare students for careers in religious ministry. There
are, however, a few number of small colleges specializing in one or two disciplines, such
as nursing or mining engineering, that are also included in Class 9. The 91 colleges
classified as Class 9 enrolled a total of 47,046 undergraduates and 17,089 in 2017-18.
The first 15 members include:
AdventHealth University
American Academy of Art
Apex School of Theology
Appalachian Bible College
Art Academy of Cincinnati
Baptist Memorial College of
Health Sciences
Be'er Yaakov Talmudic
Seminary
Bellin College
Bet Medrash Gadol Ateret Torah
Boise Bible College
Boston Architectural College
Bryan College of Health
Sciences
Central Christian College of the
Bible
Central Yeshiva Tomchei
Tmimim Lubavitz
Clarkson College
Other representative members include:
Franciscan Missionaries of Our
Lady University
Saint Louis Christian College
Hebrew Theological College
Mirrer Yeshiva Cent Institute
Sacred Heart Major Seminary
Sh'or Yoshuv Rabbinical College
The average maximum posterior probability for members of Class 9 is .98. The
least-attached members of the class are provided in Table 13.
Table 13: Lowest Posterior Probabilities Observed in Class 9
Institution Post. Prob. (k=9) Other Class
Hebrew Theological College 0.61 7
South Dakota School of Mines and Technology 0.70 6
Oregon College of Art and Craft 0.78 2
American Academy of Art 0.83 2
Criswell College 0.84 7
Logan University 0.89 7
Page 105
94
Massachusetts College of Art and Design 0.90 2
Thomas Aquinas College 0.91 2
Nazarene Bible College 0.94 7
Art Academy of Cincinnati 0.95 2
Class 10: High Intensity Research Universities
Class 10 universities are the most highly selective and research-intensive
universities in the country. Admitting an average of only 14% of students who apply for
undergraduate admissions, the enrollment capacity of Class 10 is the most constrained of
any class. These universities also charge the highest average tuition and fees of any class.
Although the net price of attendance for low-income students is second-lowest, indicating
the presence of generous financial aid policies, Class 10 enrolls the second-lowest
percentage of Pell-eligible students. Underrepresented minority enrollment is also the
second-lowest of any class. Geographic diversity of members of this class ranks third
lowest, meaning that a few states are highly represented in the undergraduate student
body. The knowledge enterprise of Class 10 universities is both intensive and
comprehensive: science and engineering and non-science research and development
expenditures average $1,006,841,000 and $47,415,000, respectively, by far the highest of
any class. These universities grant PhD degrees in an average of 19 disciplinary
categories, second to only Class 3 National Scale Research Universities.
There are only 19 universities classified as Class 10. These institutions enrolled
249,168 undergraduate and 257,442 graduate in 2017-18. The first 15 members include:
Columbia University in the City
of New York
Cornell University
Duke University
Emory University
Harvard University
Page 106
95
Johns Hopkins University
Massachusetts Institute of
Technology
New York University
Northwestern University
Stanford University
University of California-Los
Angeles
University of Chicago
University of Michigan-Ann
Arbor
University of Pennsylvania
University of Southern California
Other representative members include:
University of Washington-Seattle
Campus
Vanderbilt University
Washington University in St
Louis
Yale University
The average maximum posterior probability for members of Class 10 was 1,
indicating strong confidence of the model assigning observations to this class. There were
no minimally-attached members.
Class 11: National Scale Digital Access Universities
Class 11 is comprised of just four very large universities that are characterized by
exceptionally high enrollments of digitally-enrolled students. Over 90% of students at
these four universities are enrolled in some or all distance education courses and FTFT
enrollment as a percentage of undergraduate enrollment averages only 5%, indicating that
these universities largely serve non-traditional learners who attend part-time or are
transferring in previously completed college credit to complete a college degree.
Instructional expenditures per student average just $1,971, 18.9% of the average for all
colleges and universities and 3.2% of highest-ranked class on this measure. Low
instructional expenditures at these college likely relates to these universities not having
tenured or tenure-track faculty, or any research expenditures as measured by the NSF
HERD Survey.
Page 107
96
The four members of Class 11 enrolled a total of 234,404 undergraduate and
89,601 graduate students in 2017-18. The members include:
Liberty University
Southern New Hampshire
University
University of Maryland-
University College
Western Governors University
The average maximum posterior probability for members of Class 10 was 1,
indicating strong confidence of the model assigning observations to this class.
Class 12: Legacy Immersion Colleges and Universities
Class 12 colleges and universities are small, access-oriented colleges and
universities that serve traditional students on a mostly face-to-face basis. These colleges
and universities are distinguished by high admissions rates, high enrollment rates of
FTFT freshman students, moderately high tuition and fees, and high percentages of
faculty who are tenured and tenure-track. These colleges and universities engage in
minimal research. They are closely related to Class 4: Legacy Access Universities, but
are distinguished by significantly lower enrollment rates of underrepresented minority
students and Pell-eligible students. Containing 484 colleges and universities, Class 12 is
the largest class by membership. These organizations enrolled 1,074,408 undergraduates
and 355,732 graduate students in 2017-18. The first 15 members include:
Abilene Christian University
Adelphi University
Adrian College
Agnes Scott College
Albion College
Albright College
Alderson Broaddus University
Alfred University
Allegheny College
Alma College
Alvernia University
Alverno College
American International College
American Jewish University
Anderson University
Page 108
97
Other representative members include:
Berea College
Biola University
California Lutheran University
Drake University
Embry-Riddle Aeronautical
University-Prescott
Hampden-Sydney College
Lewis & Clark College
Marquette University
The average maximum posterior probability for members of Class 12 was .96.
Many of the marginally attached members of Class 6 charge tuition and fees lower than
the class average.
Table 14: Lowest Posterior Probabilities Observed in Class 12
Institution Post. Prob. (k=12) Other Class
Medaille College 0.45 6
University of Providence 0.52 6
Saint Peter's University 0.52 4
Chaminade University of Honolulu 0.53 6
Tennessee Wesleyan University 0.55 6
Pennsylvania State University-Altoona 0.56 6
Yeshiva University 0.58 5
Concordia University Texas 0.58 6
Kuyper College 0.59 6
Indiana Institute of Technology 0.59 6
Class 13: Regional-Scale Research Universities
Class 13 colleges and universities are medium-scale comprehensive research
universities. These universities closely resemble Class 3 National-Scale Research
Universities but are distinguished by smaller undergraduate and graduate enrollments and
lower research expenditures. Although their science and engineering research
expenditures average approximately a one-quarter that of Class 3 members, this class still
ranks third highest on this metric. Class 13 universities offer, on average, 64 different
Page 109
98
undergraduate degree offerings and grant PhD degrees in 14 disciplinary categories,
ranking 2nd and 3rd highest of any class. There are 84 universities classified in Class 13.
In aggregate, they enrolled 1,740,955 undergraduate and 496,856 graduate students in
2017-18. The first 15 members include:
Auburn University
Baylor University
Binghamton University
Bowling Green State University-
Main Campus
Brigham Young University-
Provo
Clemson University
Colorado State University-Fort
Collins
Drexel University
Florida Atlantic University
Florida International University
George Mason University
George Washington University
Indiana University-Purdue
University-Indianapolis
Iowa State University
Kansas State University
Other representative universities include:
Texas Tech University
Oregon State University
University of Louisville
University of California-
Riverside
University of Connecticut
The University of Texas at El
Paso
University of New Mexico-Main
Campus
Wayne State University
The average maximum posterior probability for members of Class 10 was .98.
Table 15: Lowest Posterior Probabilities Observed in Class 13
Institution Post. Prob. (k=13) Other Class
Loyola University Chicago 0.46 12
Texas Tech University 0.77 3
The University of Texas at El Paso 0.77 1
Texas State University 0.81 1
University of Vermont 0.81 1
Florida Atlantic University 0.82 1
Nova Southeastern University 0.85 8
New Mexico State University-Main Campus 0.97 1
University of Nevada-Reno 0.98 1
Page 110
99
Western Michigan University 0.99 1
Comparison of LPA results to 2018 Basic Carnegie Classification
There are 17 classes of the 2018 Basic Carnegie Classification represented in the
sample used for the present analysis. Table 16 tabulates the relationship of classifications
of the k=13 latent profile analysis solution against the 2018 Basic Carnegie
Classification. Figure 8 presents these tabulations graphically with a Sankey diagram.
While there are some correlations between class assignments across these two
classifications, there are many noticeable differences. For example, the 130 colleges and
universities in the sample that Carnegie classifies as Very High Research Activity
Doctoral Universities—also called “R1”—split between six different classes of the latent
profile analysis. The LPA-derived classes that these R1 colleges and universities split
into are also populated by institutions that Carnegie classifies as Doctoral Universities,
Master’s Colleges and Universities, and Baccalaureate Colleges.
Page 111
100
Table 16: Classification Comparison between 2018 Carnegie Classification and LPA Results
LPA –Derived Classes (k=13)
Carnegie Classification 2018: Basic 1 2 3 4 5 6 7 8 9 10 11 12 13 Total
Doctoral Universities: Very High Research Activity 1 0 35 0 16 1 0 0 0 19 0 0 58 130
Doctoral Universities: High Research Activity 45 1 0 12 14 11 0 2 0 0 0 15 26 126
Doctoral/Professional Universities 17 0 0 2 1 16 5 17 0 0 1 68 0 127
Master's Colleges & Universities: Larger Programs 42 1 0 9 0 117 12 28 0 0 3 100 0 312
Master's Colleges & Universities: Medium Programs 3 3 0 12 0 44 5 31 0 0 0 69 0 167
Master's Colleges & Universities: Small Programs 1 0 0 6 0 32 8 23 1 0 0 38 0 109
Baccalaureate Colleges: Arts & Sciences Focus 0 6 0 17 52 22 1 12 3 0 0 106 0 219
Baccalaureate Colleges: Diverse Fields 1 1 0 22 1 60 16 54 0 0 0 87 0 242
Baccalaureate/Associate's Colleges: Mixed Bacc./Associate's 0 0 0 1 0 1 2 3 0 0 0 0 0 7
Special Focus Four-Year: Faith-Related Institutions 0 2 0 0 0 0 18 11 51 0 0 1 0 83
Special Focus Four-Year: Other Health Professions Schools 0 4 0 0 0 0 5 2 21 0 0 0 0 32
Special Focus Four-Year: Engineering Schools 0 3 0 0 0 0 0 0 1 0 0 0 0 4
Special Focus Four-Year: Other Technology-Related Schools 0 0 0 0 0 0 3 0 0 0 0 0 0 3
Special Focus Four-Year: Business & Management Schools 0 3 0 0 0 1 2 2 2 0 0 0 0 10
Special Focus Four-Year: Arts, Music & Design Schools 0 31 0 0 0 0 1 2 10 0 0 1 0 45
Special Focus Four-Year: Other Special Focus Institutions 0 0 0 0 0 0 0 0 2 0 0 0 0 2
Tribal Colleges 0 0 0 0 0 0 2 0 0 0 0 0 0 2
Total 110 55 35 81 84 305 80 187 91 19 4 485 84 1,620
Page 112
101
Figure 8: Sankey Diagram Comparison between 2018 Carnegie Classification and LPA Results
Page 113
102
Relative class homogeneity in the LPA and Carnegie Classifications can be
compared by examining the distributions of class-specific variable standard deviations in
the two classifications. Figure 9 plots these values. Since all variables have been
standardized, standard deviations can be compared across variables and classifications in
this manner.
Figure 9: Histograms for Class-Specific Variable Standard Deviations by Classification
The class-specific variable standard deviations in the LPA model are considerably
lower than the class-specific variable standard deviations in the 2018 Basic Carnegie
Classification. This indicates that the classes latent profile analysis creates are
Page 114
103
considerably more homogeneous with respect to the 17 variables used in it. This is
particularly interesting given that the LPA results presented here have four fewer classes
than the 2018 Carnegie Classification. Additional research is needed to compare the
relative class homogeneity on other measures of university behaviors and outcomes, such
as graduation rates or degree production efficiency.
Page 115
104
CHAPTER 5: DISCUSSION
Colleges and universities are one of the most diverse sets of organizations that
exist. Formal classifications, which attempt to create groupings of organizations based on
similarities across one or more attributes of interest, are a key way the field uses to
understand and manage the complexity of organizational forms encountered. These
homogeneous groupings of colleges and universities serve a variety of more specific
purposes, such as assisting researchers investigating phenomena occurring in these
organizations by providing sample frames or the ability to account for unobserved
organizational characteristics within empirical models. These groupings also assist
political principals and organizational leaders in assessing organizational performance.
The development of theories and methods for separating colleges and universities
into homogeneous groups and the assignment of organizations into these groups has been
the subject of extensive applied work (Indiana University Center for Postsecondary
Research 2019; McCormick and Zhao 2005) and a small academic literature (Brint,
Riddle, and Hanneman 2006; Harmon et al. 2019; Kosar and Scott 2018; Crisp et al.
2019).
This study contributes to the literature in several ways. First, it grounds the
differentiation of organizations in the theory of realized publicness in order to create a
classification based on the ways in which colleges and universities engage in behaviors
that realize public values. It does not incorporate measures of the outcomes of these
behaviors. In this way, the present study explicitly separates organizational classification
Page 116
105
from organizational performance assessment. Second, this study engages the full
complexity of the higher education field to create a broad classification of types rather
than a classification of a small, pre-defined subset of colleges and universities. The study
created a classification from the analysis 17 variables across 1,620 colleges and
universities—1,000 observations more than other recently published university
classifications. Third, it introduces a new analytical method, latent profile analysis
(LPA), to the classification of colleges and universities and describes the steps of
principled model-building within this context.
Latent Profile Analysis of College and University Data
To summarize the findings relative to the research questions of the present study,
the analysis finds 13 distinct, identifiable organizational designs present in the sample of
four-year colleges and universities in the United States. Using posterior probabilities of
membership, this analysis finds that membership in these classes range from 4 members
to 484 members. Inspection of these probabilities, as well as class-specific variable
means, reveals the relationships among these classes.
The LPA produced groupings of colleges and universities significantly more
homogeneous than Carnegie’s 2018 Basic Classification classes. Even though colleges
and universities in the sample represented 17 classes in the 2018 Basic Classification—
four more than the LPA-derived solution—the class-specific variable standard deviations
within the 2018 Carnegie Classification were significantly higher than in the LPA-
derived classes.
Page 117
106
Limitations and Future Directions
In exploratory uses of LPA, the true number of classes present within a population
is not known a priori. Limitations to the method in general, as well as the specific use of
the method in the present study, may have resulted in the identification of spurious
classes or the under-extraction of classes. Future work can investigate the nature and
consequences of these possible issues.
First, future work can investigate alternative specifications of the structural
model. This includes employing other family and link functions, as appropriate, to
accommodate non-normal distributions of the manifest variables. Relative fit statistics
from competing specifications can be assessed to determine if alternative model
specifications better explain the data (Masyn 2013; Canette 2018; MacDonald 2018).
Second, future work can investigate alternative specifications of the within-class
variance structure. The model presented here assumed local interdependence of manifest
variables. Although latent profile models do not need conditional interdependence to
estimate models, specification of the within-class variance structure can impact the
number and composition of classes predicted by the models (Bauer and Curran 2004). The
present study attempted to relax assumptions about the within-class variance structures,
but these models quickly encountered convergence and identification issues. If future
work is not able to overcome the significant computational challenges in estimating these
models, research could examine models with fewer manifest variables or consolidate
variables by using metavariables or principal components (McLachlan 2011). While
Page 118
107
these choices may assist software packages in better estimating computationally intensive
models, it is also possible that these choices could reduce the ability of the model to form
interpretable groups.
Third, future work could investigate the inclusion of different manifest variables.
LPA assumes that the presence of homogeneous subpopulations can explain the
heterogeneity observed within the manifest variables. The heterogeneity observed across
the manifest variables, however, may be due to other phenomena beside membership in
classes. Incorporating different manifest variables or covariates in subsequent research, as
well as using derived latent classes in latent class regressions may help illuminate the
nature of this potential issue.
Beyond model specification issues, there are exciting possibilities to extend the
analysis to an even broader sample of the higher education field. Future research could
expand the analysis to include for-profit colleges and universities. Since these
organizations report on different accounting standards (National Center for Education
Statistics 2020a), possible analytical strategies include analyzing for-profit institutions
separately as a group or finding ways to create a fully harmonized dataset so that for-
profit organizations can be analyzed alongside public and private not-for-profit
organizations. Creating a unified sample of public, private not-for-profit, and private for-
profit organizations would likely cause the classes identified here to consolidate into
fewer classes with more observations.
Page 119
108
Subsequent investigations could put this methodological approach in motion
over time. LPA is cross-sectional in nature, meaning that it derives groups and classifies
observations into classes based on data captured at one point in time. Latent transition
analysis (LTA), on the other hand, considers the presence of group membership within a
population through time (Collins and Lanza 2009). This method allows researchers to fix
or vary the number of classes estimated across time periods. It may be particularly
interesting to examine the stability and emergence of college and university classes
through time. An LTA would present data difficulties, however, as IPEDS data
availability on my variables becomes a major concern in the years before 2000.
Conclusion
The present study has shown that latent profile analysis can be used to create
groupings of colleges and universities that are more homogeneous than the prevailing
classification scheme in higher education. The ultimate success of any classification,
however, is not entirely dependent on its ability to create homogeneous groupings of
observations. There are important additional considerations in the classification of
colleges and universities.
There may be practical reasons that dictate the classification of colleges and
universities with certain attributes. This analysis did not exclude or otherwise
differentially treat organizations belonging to any recognized group or alliance, such as
tribal colleges, historically Black colleges and universities, or Hispanic-serving
institutions; university sports leagues; or geographic regions within the United States.
Page 120
109
The simultaneous analytical consideration of all colleges and universities may or may not
be desirable in the context of a higher education classification scheme. If a subset of
certain organizations were removed from the sample and “forced” together in a class
before conducting a latent profile analysis, their omission from the sample would likely
affect both the number and characteristics of classes identified within the remaining
sample.
Given that academic researchers and practitioners often collapse the 27 sub-
classes of the Carnegie Basic Classification into broader classes, it is likely that
practitioners and users of classifications may desire a classification with a small number
of classes. The number of classes may also be a critical consideration for developers of
classifications who are interested in ensuring interpretability of the classification itself.
Research has shown that humans can hold 7+/-2 objects in short-term memory (G. A.
Miller 1956), indicating there may be practical considerations for advancing a
classification scheme with fewer than nine classes. Masyn (2013) notes that substantive
and theoretical knowledge can help practitioners decide on the utility of specific classes
when the number of classes dictated by practical parsimony is fewer than the number of
classes suggested by relative measures of model fit. There is, of course, a tradeoff
between the number of classes and the utility of those classes: the fewer the number of
classes for observations to be classified into, the more heterogeneity will be observed
within them and the less likely they will have clear, interpretable profiles.
Page 121
110
REFERENCES
AAAS. 2020. “R&D at Colleges and Universities.” American Association for the
Advancement of Science. 2020. https://www.aaas.org/programs/r-d-budget-and-
policy/rd-colleges-and-universities.
Anderson, Nick. 2016. “In New Sorting of Colleges, Dartmouth Falls out of an Exclusive
Group - The Washington Post.” The Washington Post, February 4, 2016.
https://www.washingtonpost.com/?utm_term=.3b9309dadece.
Andrews, Rhys, George A. Boyne, and Richard M. Walker. 2011. “Dimensions of
Publicness and Organizational Performance: A Review of the Evidence.” Journal
of Public Administration Research and Theory 21 (suppl 3): i301–19.
https://doi.org/10.1093/jopart/mur026.
Bauer, Daniel J., and Patrick J. Curran. 2004. “The Integration of Continuous and
Discrete Latent Variable Models: Potential Problems and Promising
Opportunities.” Psychological Methods 9 (1): 3–29. https://doi.org/10.1037/1082-
989X.9.1.3.
Borden, Victor M. H., and Alexander C. McCormick. 2019. “Accounting for Diverse
Missions: Can Classification Systems Contribute to Meaningful Assessments of
Institutional Performance?” Tertiary Education and Management, August.
https://doi.org/10.1007/s11233-019-09045-w.
Bozeman, Barry. 1987. All Organizations Are Public: Comparing Public and Private
Organizations. Beard Books.
———. 2007. Public Values and Public Interest: Counterbalancing Economic
Individualism. Georgetown University Press.
Bozeman, Barry, and Stuart Bretschneider. 1994. “The ‘Publicness Puzzle’ in
Organization Theory: A Test of Alternative Explanations of Differences between
Public and Private Organizations.” Journal of Public Administration Research
and Theory 4 (2): 197–224.
Bozeman, Barry, and Monica Gaughan. 2007. “Impacts of Grants and Contracts on
Academic Researchers’ Interactions with Industry.” Research Policy 36 (5): 694–
707. https://doi.org/10.1016/j.respol.2007.01.007.
Brint, Steven, Mark Riddle, and Robert Hanneman. 2006. “Reference Sets, Identities, and
Aspirations in a Complex Organizational Field: The Case of American Four-Year
Colleges and Universities.” Sociology of Education 79 (3): 229–52.
Page 122
111
Brownlee, Chip. 2018. “Auburn Named R1 Carnegie Research Institution, Achieving
Major Goal.” The Auburn Plainsman. December 17, 2018.
https://www.theplainsman.com/article/2018/12/auburn-named-r1-carnegie-
research-institution-achieving-major-goal.
Bush, Vannevar. 1945. “Science the Endless Frontier,” 1945.
https://www.nsf.gov/od/lpa/nsf50/vbush1945.htm.
California State Auditor. 2016. “The University of California: Its Admissions and
Financial Decisions Have Disadvantaged California Resident Students.” 2016.
https://www.auditor.ca.gov/pdfs/reports/2015-107.pdf.
Canette, Isabel. 2018. “Latent Class Analysis with Stata.” In , 26. Tlaxcala, Mexico.
https://www.stata.com/meeting/mexico18/slides/5_Mexico18_Canette.pdf.
Carnegie Commission on Higher Education. 1971. New Students and New Places. New
York: McGraw-Hill.
Cattani, Gino, Joseph F. Porac, and Howard Thomas. 2017. “Categories and
Competition.” Strategic Management Journal 38 (1): 64–92.
https://doi.org/10.1002/smj.2591.
Cole, Jonathan R. 2010. The Great American University: Its Rise to Preeminence, Its
Indispensable National Role, Why It Must Be Protected. PublicAffairs.
Collins, Linda M., and Stephanie T. Lanza. 2009. Latent Class and Latent Transition
Analysis: With Applications in the Social, Behavioral, and Health Sciences. John
Wiley & Sons.
Crisp, Gloria, Catherine L. Horn, Margaret Kuczynski, Qiong Zhou, and Elizabeth Cook.
2019. “Describing and Differentiating Four-Year Broad Access Institutions: An
Empirical Typology.” The Review of Higher Education 42 (4): 1373–1400.
https://doi.org/10.1353/rhe.2019.0069.
Crow, Michael, and Barry Bozeman. 1998. Limited by Design. 1 edition. New York:
Columbia University Press.
Crow, Michael M., and William B. Dabars. 2020. The Fifth Wave: The Evolution of
American Higher Education. JHU Press.
Page 123
112
Denhardt, Robert B., and Janet Vinzant Denhardt. 2000. “The New Public Service:
Serving Rather than Steering.” Public Administration Review 60 (6): 549–59.
https://doi.org/10.1111/0033-3352.00117.
Doty, D. Harold, and William H. Glick. 1994. “Typologies as a Unique Form of Theory
Building: Toward Improved Understanding and Modeling.” The Academy of
Management Review 19 (2): 230–51. https://doi.org/10.2307/258704.
Dugan, John P. 2011. “Students’ Involvement in Group Experiences and Connections to
Leadership Development.” New Directions for Institutional Research 2011 (S1):
17–32. https://doi.org/10.1002/ir.414.
Feeney, Mary K., and Eric W. Welch. 2012. “Realized Publicness at Public and Private
Research Universities.” Public Administration Review 72 (2): 272–84.
https://doi.org/10.1111/j.1540-6210.2011.02521.x.
Feldman, Maryann, Irwin Feller, Janet Bercovitz, and Richard Burton. 2002. “Equity and
the Technology Transfer Strategies of American Research Universities.”
Management Science 48 (1): 105–21.
https://doi.org/10.1287/mnsc.48.1.105.14276.
Friedman, Joseph, and Jonathan Silberman. 2003. “University Technology Transfer: Do
Incentives, Management, and Location Matter?” The Journal of Technology
Transfer 28 (1): 17–30. https://doi.org/10.1023/A:1021674618658.
Goodman, Leo A. 2002. “Latent Class Analysis: The Empirical Study of Latent Types,
Latent Variables, and Latent Structures.” Applied Latent Class Analysis.
Cambridge University Press. June 2002.
https://doi.org/10.1017/CBO9780511499531.002.
Granger, Herbert. 1985. “The Scala Naturae and the Continuity of Kinds.” Phronesis 30
(2): 181–200.
Hannan, Michael T. 2010. “Partiality of Memberships in Categories and Audiences.”
Annual Review of Sociology 36 (1): 159–81. https://doi.org/10.1146/annurev-soc-
021610-092336.
Harmon, Paul, Sarah McKnight, Laura Hildreth, Ian Godwin, and Mark Greenwood.
2019. “An Alternative to the Carnegie Classifications: Identifying Similar
Doctoral Institutions With Structural Equation Models and Clustering.” Statistics
and Public Policy 6 (1): 87–97. https://doi.org/10.1080/2330443X.2019.1666761.
Page 124
113
Harvard University. n.d. “History.” Harvard University. Accessed May 3, 2016.
http://www.harvard.edu/about-harvard/harvard-glance/history.
Herbert Simon. 1997. Administrative Behavior, 4th Edition.
http://books.simonandschuster.com/Administrative-Behavior-4th-Edition/Herbert-
A-Simon/9780684835822.
Higher Education Act of 1965. 1965. Stat. Vol. 79.
https://www.govinfo.gov/content/pkg/STATUTE-79/pdf/STATUTE-79-
Pg1219.pdf#page=37.
Hsu, Greta, and Michael T. Hannan. 2005. “Identities, Genres, and Organizational
Forms.” Organization Science 16 (5): 474–90.
https://doi.org/10.1287/orsc.1050.0151.
Hum, Karen R. 2016. “Using Latent Profile Methodology to Obtain A Midwestern
Community College Student Typology.” Dissertation, Muncie, Indiana: Ball State
University.
Indiana University Bloomington, and Alexander C. McCormick. 2013. “Clasificación de
Las Instituciones de Educación Superior: Lecciones de La Clasificación
Carnegie.” Pensamiento Educativo: Revista de Investigación Educacional
Latinoamericana 50 (1): 65–75. https://doi.org/10.7764/PEL.50.1.2013.6.
Indiana University Center for Postsecondary Research. 2019. “Carnegie Classifications |
Home Page.” 2019. http://carnegieclassifications.iu.edu/.
Indiana University Center for Postsecondary Research. 2019. “Research Activity Index –
Methodology Details.” Carnegie Classification of Institutions of Higher
Education. 2019.
https://carnegieclassifications.iu.edu/pdf/CCIHE2018_Research_Activity_Index_
Method.pdf.
Indiana University Center for Postsecondary Research. 2020. “Carnegie Classifications
2018 Public Data File.” 2020.
https://carnegieclassifications.iu.edu/downloads.php.
Jalote, Pankaj, Bijendra Nath Jain, and Sudhir Sopory. 2020. “Classification for Research
Universities in India.” Higher Education 79 (2): 225–41.
https://doi.org/10.1007/s10734-019-00406-3.
Jaquette, Ozan, and Edna E. Parra. 2014. “Using IPEDS for Panel Analyses: Core
Concepts, Data Challenges, and Empirical Applications.” In Higher Education:
Page 125
114
Handbook of Theory and Research: Volume 29, edited by Michael B. Paulsen,
467–533. Higher Education: Handbook of Theory and Research. Dordrecht:
Springer Netherlands. https://doi.org/10.1007/978-94-017-8005-6_11.
Kelchen, Robert. 2017. “Beware OPEIDs and Super OPEIDs.” Robert Kelchen (blog).
August 21, 2017. https://robertkelchen.com/2017/08/21/beware-opeids-and-super-
opeids/.
Kosar, Robert, and David W. Scott. 2018. “Examining the Carnegie Classification
Methodology for Research Universities.” Statistics and Public Policy 5 (1): 1–12.
https://doi.org/10.1080/2330443X.2018.1442271.
Lanza, Stephanie T., Bethany C. Bray, and Linda M. Collins. 2012. “An Introduction to
Latent Class and Latent Transition Analysis.” In Handbook of Psychology,
Second Edition. American Cancer Society.
https://doi.org/10.1002/9781118133880.hop202024.
Larme, Mary Colleen, and Brooke Thayer. 2017. “4 Initial Steps for Climbing the
Carnegie Classification® Ranks.” October 11, 2017.
https://www.eab.com/research-and-insights/university-research-forum/expert-
insights/2017/four-initial-steps-for-climbing-the-carnegie-classification-ranks.
Law, Ernest H, and Rachel Harrington. 2016. “A Primer on Latent Class Analysis.”
Value and Outcomes Spotlight November/December 2016: 2.
Lawson, Anton E. 2015. “Hypothetico-Deductive Method.” In Encyclopedia of Science
Education, edited by Richard Gunstone, 471–72. Dordrecht: Springer
Netherlands. https://doi.org/10.1007/978-94-007-2150-0_260.
Lazarsfeld, Paul F. And Neil W. Henry. 1968. Latent Structure Analysis. First Edition.
New York, NY: Houghton Mifflin Company.
MacDonald, Kristin. 2018. “Latent Class Analysis (LCA) in Stata.” Presented at the 2018
London Stata Conference, London, Great Britian.
Masyn, Katherine E. 2013. “Latent Class Analysis and Finite Mixture Modeling.” In The
Oxford Handbook of Quantitative Methods: Statistical Analysis, Vol. 2, 551–611.
Oxford Library of Psychology. New York, NY, US: Oxford University Press.
McCormick, Alexander C., Gary R. Pike, George D. Kuh, and Pu-Shih Daniel Chen.
2009. “Comparing the Utility of the 2000 and 2005 Carnegie Classification
Systems in Research on Students’ College Experiences and Outcomes.” Research
in Higher Education 50 (2): 144–67. https://doi.org/10.1007/s11162-008-9112-9.
Page 126
115
McCormick, Alexander C., and Chun-Mei Zhao. 2005. “Rethinking and Reframing the
Carnegie Classification.” Change: The Magazine of Higher Learning 37 (5): 51–
57. https://doi.org/10.3200/CHNG.37.5.51-57.
McKelvey, Bill. 1982. Organizational Systematics-Taxonomy, Evolution, Classification.
Berkeley: Univ of California Pr.
McKeown-Moak, Mary P., and Christopher M. Mullin. 2014. Higher Education Finance
Research: Policy, Politics, and Practice. IAP.
McLachlan, Geoffrey J. 2011. “Commentary on Steinley and Brusco (2011):
Recommendations and Cautions.” Psychological Methods 16 (1): 80–81.
https://doi.org/10.1037/a0021141.
Metzger, Walter P. 1961. Academic Freedom in the Age of the University. Columbia
University Press.
Miller, George A. 1956. “The Magical Number Seven, plus or Minus Two: Some Limits
on Our Capacity for Processing Information.” Psychological Review 63 (2): 81–
97. https://doi.org/10.1037/h0043158.
Miller, Susan M., and Stephanie Moulton. 2013. “Publicness in Policy Environments: A
Multilevel Analysis of Substance Abuse Treatment Services.” Journal of Public
Administration Research and Theory, January, mus065.
https://doi.org/10.1093/jopart/mus065.
Morse, Robert, Eric Brooks, and Matt Mason. 2019. “How U.S. News Calculated the
2020 Best Colleges Rankings.” US News & World Report. 2019.
https://www.usnews.com/education/best-colleges/articles/how-us-news-
calculated-the-rankings.
Moulton, Stephanie. 2009. “Putting Together the Publicness Puzzle: A Framework for
Realized Publicness.” Public Administration Review 69 (5): 889–900.
https://doi.org/10.1111/j.1540-6210.2009.02038.x.
Moulton, Stephanie, and Barry Bozeman. 2011. “The Publicness of Policy Environments:
An Evaluation of Subprime Mortgage Lending.” Journal of Public Administration
Research and Theory 21 (1): 87–115. https://doi.org/10.1093/jopart/muq005.
National Center for Education Statistics. 2020a. “IPEDS Finance Data FASB and GASB
- What’s the Difference? A Guide for Data Users.” 2020.
Page 127
116
https://nces.ed.gov/ipeds/report-your-data/data-tip-sheet-distinguishing-finance-
standards-fasb-gasb.
———. 2020b. “IPEDS Glossary.” IPEDS 2019-20 Data Collection System. February
29, 2020. https://surveys.nces.ed.gov/ipeds/VisGlossaryAll.aspx.
NCES. 2020. “CIP Codes.” CIP Codes. 2020.
https://www.google.com/search?q=cip+codes&rlz=1C1GCEA_enUS779US779&
oq=cip+co&aqs=chrome.0.69i59j69i57j0l6.2159j0j7&sourceid=chrome&ie=UTF
-8.
NCES National Center for Education Statistics. 2018. “Digest of Education Statistics.”
2018. https://nces.ed.gov/programs/digest/d15/tables/dt15_301.20.asp.
Núñez, Anne-Marie, Gloria Crisp, and Diane Elizondo. 2016. “Mapping Hispanic-
Serving Institutions: A Typology of Institutional Diversity.” The Journal of
Higher Education 87 (1): 55–83.
https://doi.org/10.1080/00221546.2016.11777394.
Nylund, Karen L., Tihomir Asparouhov, and Bengt O. Muthén. 2007. “Deciding on the
Number of Classes in Latent Class Analysis and Growth Mixture Modeling: A
Monte Carlo Simulation Study.” Structural Equation Modeling: A
Multidisciplinary Journal 14 (4): 535–69.
https://doi.org/10.1080/10705510701575396.
Nylund-Gibson, Karen, and Andrew Young Choi. 2018. “Ten Frequently Asked
Questions about Latent Class Analysis.” Translational Issues in Psychological
Science 4 (4): 440–61. https://doi.org/10.1037/tps0000176.
Oberski, Daniel. 2016. “Mixture Models: Latent Profile and Latent Class Analysis.” In
Modern Statistical Methods for HCI, edited by Judy Robertson and Maurits
Kaptein, 275–87. Human–Computer Interaction Series. Cham: Springer
International Publishing. https://doi.org/10.1007/978-3-319-26633-6_12.
Petersen, Kimberly J., Pamela Qualter, and Neil Humphrey. 2019. “The Application of
Latent Class Analysis for Investigating Population Child Mental Health: A
Systematic Review.” Frontiers in Psychology 10.
https://doi.org/10.3389/fpsyg.2019.01214.
Pew Research Center. 2011. “Is College Worth It?” Pew Research Center’s Social &
Demographic Trends Project (blog). May 15, 2011.
http://www.pewsocialtrends.org/2011/05/15/is-college-worth-it/.
Page 128
117
Phusavat, Kongkiti, Suphattra Ketsarapong, Jayanthi Ranjan, and Binshan Lin. 2011.
“Developing a University Classification Model from Performance Indicators.”
Performance Measurement and Metrics 12 (3): 183–213.
https://doi.org/10.1108/14678041111196668.
Pike, Gary, George Kuh, and Robert Gonyea. 2003. “The Relationship Between
Institutional Mission and Students’ Involvement and Educational Outcomes.”
Research in Higher Education 44 (April).
https://doi.org/10.1023/A:1022055829783.
Pontikes, Elizabeth, and Michael Hannan. 2014. “An Ecology of Social Categories.”
Sociological Science 1: 311–43. https://doi.org/10.15195/v1.a20.
Popper, Karl. 2012. The Open Society and Its Enemies. Routledge.
https://doi.org/10.4324/9780203439913.
Porac, Joseph F., and Howard Thomas. 1990. “Taxonomic Mental Models in Competitor
Definition.” The Academy of Management Review 15 (2): 224–40.
https://doi.org/10.2307/258155.
Porcu, Mariano, and Francesca Giambona. 2017. “Introduction to Latent Class Analysis
With Applications.” The Journal of Early Adolescence 37 (1): 129–58.
https://doi.org/10.1177/0272431616648452.
Rich, Philip. 1992. “The Organizational Taxonomy: Definition and Design.” The
Academy of Management Review 17 (4): 758–81. https://doi.org/10.2307/258807.
Rindova, Violina P., Luis L. Martins, Santosh B. Srinivas, and David Chandler. 2018.
“The Good, the Bad, and the Ugly of Organizational Rankings: A
Multidisciplinary Review of the Literature and Directions for Future Research.”
Journal of Management 44 (6): 2175–2208.
https://doi.org/10.1177/0149206317741962.
Rudolph, Frederick. 1962. The American College and University: A History. University
of Georgia Press.
———. 2011. The American College and University: A History. University of Georgia
Press.
Schmiege, Sarah J., Katherine E. Masyn, and Angela D. Bryan. 2017. “Confirmatory
Latent Class Analysis: Illustrations of Empirically Driven and Theoretically
Driven Model Constraints.” Organizational Research Methods, December.
https://doi.org/10.1177/1094428117747689.
Page 129
118
Scott, Patrick G., and Santa Falcone. 1998. “Comparing Public and Private Organizations
An Exploratory Analysis of Three Frameworks.” The American Review of Public
Administration 28 (2): 126–45. https://doi.org/10.1177/027507409802800202.
Servicemen’s Readjustment Act of 1944. 1944. Stat. Vol. 1767.
https://www.loc.gov/law/help/statutes-at-large/78th-congress/session-
2/c78s2ch268.pdf.
Shin, Jung Cheol. 2009. “Classifying Higher Education Institutions in Korea: A
Performance-Based Approach.” Higher Education 57 (2): 247–66.
https://doi.org/10.1007/s10734-008-9150-4.
Sneath, P. H. A., and Robert R. Sokal. 1962. “Numerical Taxonomy.” Nature 193 (4818):
855–60. https://doi.org/10.1038/193855a0.
Solis, Jeniffer. 2018. “Carnegie Shuffle Moves UNLV up to ‘R1’ Status.” Nevada
Current (blog). December 19, 2018.
https://www.nevadacurrent.com/blog/carnegie-shuffle-moves-unlv-up-to-r1-
status/.
Stanley, Laura, Franz W. Kellermanns, and Thomas M. Zellweger. 2016. “Latent Profile
Analysis: Understanding Family Firm Profiles.” Family Business Review,
November. https://doi.org/10.1177/0894486516677426.
StataCorp. 2020. “Latent Class Analysis (LCA) | Stata.” Stata User Guide. 2020.
https://www.stata.com/features/overview/latent-class-analysis/.
Steinley, Douglas, and Michael J. Brusco. 2011. “Evaluating Mixture Modeling for
Clustering: Recommendations and Cautions.” Psychological Methods 16 (1): 63–
79. https://doi.org/10.1037/a0022673.
Su, Xuhong. 2016. “Dimensional Publicness and Serving the Vulnerable Analyses of
Specialized Substance Abuse Treatment Programs.” The American Review of
Public Administration, 0275074016643816.
University of California. 2020. “Universitywide Organization Charts | UCOP.” 2020.
https://www.ucop.edu/business-operations/universitywide-organization-
charts.html.
Urick, Angela, and Alex J. Bowers. 2014. “What Are the Different Types of Principals
Across the United States? A Latent Class Analysis of Principal Perception of
Leadership.” Educational Administration Quarterly 50 (1): 96–134.
https://doi.org/10.1177/0013161X13489019.
Page 130
119
Vermunt, Jeroen K. 2004. “Latent Profile Model.” In The SAGE Encyclopedia of Social
Science Research Methods, by Michael Lewis-Beck, Alan Bryman, and Tim
Futing Liao. 2455 Teller Road, Thousand Oaks California 91320 United States of
America: Sage Publications, Inc. https://doi.org/10.4135/9781412950589.n474.
Villanova University. 2016. “Villanova University Receives New Carnegie Classification
Change, Signaling the University’s Forward Momentum & Academic Strength |
Villanova University.” 2016.
https://www1.villanova.edu/villanova/media/pressreleases/2016/0203.html.
Zuckerman, Ezra W. 1999. “The Categorical Imperative: Securities Analysts and the
Illegitimacy Discount.” American Journal of Sociology 104 (5): 1398–1438.
https://doi.org/10.1086/210178.
Page 131
120
APPENDIX A
APPENDIX TABLE: 2018 BASIC CLASSIFICATION DESCRIPTIVE STATISTICS
Page 132
121
Appendix Table: 2018 Basic Classification Descriptive Statistics
n
Total
Undergrad
Enrollment
, 2017
Total
Graduate
Enrollment
, 2017
Avg.
Undergrad
Enrollment,
2017
Average
Graduate
Enrollme
nt, 2017
Associate's Colleges:
High Transfer-High
Traditional 122 1,621,743 0 13,293 0
Associate's Colleges:
High Transfer-Mixed
Traditional/Nontraditi
onal 118 1,642,224 0 13,917 0
Associate's Colleges:
High Transfer-High
Nontraditional 82 717,312 0 8,748 0
Associate's Colleges:
Mixed
Transfer/Vocational
& Technical-High
Traditional 123 1,244,859 8 10,121 0
Associate's Colleges:
Mixed
Transfer/Vocational
& Technical-Mixed
Traditional/Nontraditi
onal 106 1,026,254 0 9,682 0
Associate's Colleges:
Mixed
Transfer/Vocational
& Technical-High
Nontraditional 111 925,732 0 8,416 0
Associate's Colleges:
High Vocational &
Technical-High
Traditional 138 461,234 0 3,575 0
Associate's Colleges:
High Vocational &
Technical-Mixed
Traditional/Nontraditi
onal 97 434,773 0 4,675 0
Associate's Colleges:
High Vocational & 101 553,195 0 5,645 0
Page 133
122
Technical-High
Nontraditional
Special Focus Two-
Year: Health
Professions 262 196,337 0 779 0
Special Focus Two-
Year: Technical
Professions 65 51,361 0 815 0
Special Focus Two-
Year: Arts & Design 30 8,050 0 278 0
Special Focus Two-
Year: Other Fields 66 29,000 0 483 0
Baccalaureate/Associ
ate's Colleges:
Associate's Dominant 111 1,284,297 148 11,675 1
Doctoral Universities:
Very High Research
Activity 131 3,043,419 1,251,059 23,232 9550
Doctoral Universities:
High Research
Activity 135 1,726,450 540,154 13,179 4001
Doctoral/Professional
Universities 152 1,232,394 701860 8,216 4618
Master's Colleges &
Universities: Larger
Programs 350 2,967,096 820163 8575 2343
Master's Colleges &
Universities: Medium
Programs 196 648309 118459 3359 604
Master's Colleges &
Universities: Small
Programs 139 366522 60647 2675 436
Baccalaureate
Colleges: Arts &
Sciences Focus 240 394962 23922 1653 100
Baccalaureate
Colleges: Diverse
Fields 330 624581 25751 1934 78
Baccalaureate/Associ
ate's Colleges: Mixed
Baccalaureate/Associ
ate's 151 557713 4721 3873 31
Page 134
123
Special Focus Four-
Year: Faith-Related
Institutions 300 48661 57843 253 193
Special Focus Four-
Year: Medical
Schools & Centers 56 15966 114858 726 2051
Special Focus Four-
Year: Other Health
Professions Schools 259 201859 104490 1062 403
Special Focus Four-
Year: Engineering
Schools 7 10423 1656 1737 237
Special Focus Four-
Year: Other
Technology-Related
Schools 13 23560 6898 1963 531
Special Focus Four-
Year: Business &
Management Schools 75 89218 32730 1394 436
Special Focus Four-
Year: Arts, Music &
Design Schools 118 112384 15266 1031 129
Special Focus Four-
Year: Law Schools 35 41 20424 41 584
Special Focus Four-
Year: Other Special
Focus Institutions 36 14072 19719 612 548
Tribal Colleges 34 24076 257 708 8
Not in Carnegie
universe (not
accredited or non-
degree-granting)
256
8 677718 5397 292 2
Grand Total 22975795 3926430 3669.1 572.6
Page 135
124
APPENDIX B
APPENDIX TABLE: LPA MODEL OUTPUT
Page 136
125
Appendix Table: LPA Model Output
Coef. Var. 95% CI
Constant 1b.A 0 0 0 0
2.A -0.69954 0.031177 -1.04561 -0.35347
3.A -1.14954 0.040819 -1.54553 -0.75356
4.A -0.285 0.025219 -0.59626 0.026251
5.A -0.2812 0.025793 -0.59597 0.033578
6.A 1.023002 0.01716 0.766253 1.279752
7.A -0.32578 0.027233 -0.64922 -0.00235
8.A 0.522922 0.017831 0.261201 0.784644
9.A -0.20276 0.023522 -0.50335 0.09784
10.A -1.76346 0.064314 -2.26051 -1.26641
11.A -3.32176 0.26168 -4.32437 -2.31915
12.A 1.464842 0.014124 1.231916 1.697769
13.A -0.28194 0.024373 -0.58793 0.024052
Admissions Rate, Percentage 1.A 0.204812 0.007072 0.039994 0.36963
2.A -0.40512 0.01434 -0.63983 -0.17041
3.A -0.65063 0.019799 -0.92641 -0.37485
4.A -0.09617 0.009488 -0.28709 0.09474
5.A -1.74665 0.01035 -1.94605 -1.54725
6.A 0.262655 0.002484 0.164981 0.360329
7.A 0.909301 0.012799 0.687569 1.131034
8.A 0.040157 0.004002 -0.08383 0.16414
9.A 0.409091 0.007994 0.233848 0.584333
10.A -2.55054 0.035936 -2.92209 -2.17899
11.A 0.37567 0.170714 -0.43414 1.185479
12.A 0.045749 0.001515 -0.03055 0.122046
13.A 0.040252 0.008816 -0.14378 0.224281
Students Enrolled in Distance Education, Percent
1.A 0.384437 0.007602 0.213546 0.555328
2.A -0.814 0.013082 -1.03818 -0.58983
3.A 0.057946 0.020863 -0.22515 0.341047
4.A 0.006748 0.00915 -0.18074 0.194233
5.A -0.93633 0.00862 -1.1183 -0.75436
Page 137
126
6.A 0.462642 0.002594 0.362828 0.562456
7.A 1.216698 0.013089 0.992463 1.440933
8.A 0.113737 0.004844 -0.02268 0.250152
9.A 0.124694 0.008561 -0.05665 0.306038
10.A -0.874 0.037804 -1.25508 -0.49292
11.A 2.916808 0.179591 2.08621 3.747405
12.A -0.43022 0.001696 -0.51092 -0.34951
13.A 0.199498 0.009047 0.01307 0.385926
Undergraduate Enrollment, Count 1.A 1.291478 0.004375 1.161836 1.421119
2.A -0.50804 0.004431 -0.6385 -0.37758
3.A 3.278032 0.006895 3.115287 3.440777
4.A -0.31994 0.002956 -0.4265 -0.21339
5.A -0.22683 0.002963 -0.33352 -0.12015
6.A -0.0805 0.001048 -0.14394 -0.01707
7.A -0.45362 0.003671 -0.57237 -0.33487
8.A -0.45046 0.001317 -0.52159 -0.37932
9.A -0.59965 0.002636 -0.70027 -0.49903
10.A 0.948523 0.012541 0.729031 1.168015
11.A 6.535326 0.059555 6.057017 7.013635
12.A -0.38817 0.000512 -0.43253 -0.3438
13.A 1.877588 0.005135 1.737142 2.018034
Graduate Enrollment, Count 1.A 0.435401 0.003337 0.322176 0.548625
2.A -0.39053 0.005261 -0.53269 -0.24837
3.A 3.082667 0.009224 2.894428 3.270906
4.A -0.34403 0.003424 -0.45872 -0.22934
5.A -0.01433 0.004264 -0.14231 0.113653
6.A -0.25448 0.001013 -0.31687 -0.19208
7.A -0.29859 0.00496 -0.43663 -0.16056
8.A -0.32288 0.001804 -0.40612 -0.23964
9.A -0.45862 0.003094 -0.56765 -0.3496
10.A 4.059969 0.014733 3.822069 4.297869
11.A 7.052878 0.069931 6.534576 7.571179
12.A -0.26909 0.000625 -0.3181 -0.22008
13.A 1.468698 0.004376 1.339044 1.598353
FTFT Enrollment, Percent
Page 138
127
1.A -0.53606 0.007028 -0.70037 -0.37175
2.A 0.468269 0.013239 0.242753 0.693786
3.A -0.05256 0.019651 -0.32731 0.222195
4.A 0.631939 0.011378 0.422875 0.841004
5.A 0.828648 0.008387 0.649159 1.008138
6.A -0.40001 0.00259 -0.49975 -0.30027
7.A -1.34513 0.013224 -1.57052 -1.11975
8.A 0.059667 0.004264 -0.06832 0.187652
9.A -0.72771 0.008107 -0.90418 -0.55124
10.A 0.348564 0.03626 -0.02465 0.72178
11.A -2.19611 0.17226 -3.00958 -1.38264
12.A 0.456548 0.001684 0.37612 0.536976
13.A -0.21123 0.008668 -0.39371 -0.02876
Under-represented Minority Student Enrollment, Percent
1.A 0.026276 0.006548 -0.13232 0.184873
2.A -0.48462 0.009759 -0.67825 -0.291
3.A -0.26618 0.014866 -0.50515 -0.02721
4.A 2.821221 0.007823 2.647862 2.994579
5.A -0.44713 0.00628 -0.60245 -0.29181
6.A -0.02132 0.002253 -0.11435 0.071715
7.A 0.590436 0.010181 0.392674 0.788197
8.A -0.1463 0.002991 -0.25349 -0.0391
9.A -0.46163 0.006451 -0.61906 -0.30421
10.A -0.21074 0.027177 -0.53385 0.112366
11.A -0.01574 0.12911 -0.71999 0.688512
12.A -0.26784 0.001207 -0.33593 -0.19975
13.A -0.04361 0.007143 -0.20926 0.122036
Pell Grant Enrollment, Percent 1.A -0.01345 0.005938 -0.16448 0.137574
2.A -0.64217 0.011534 -0.85266 -0.43168
3.A -0.77833 0.016338 -1.02885 -0.52781
4.A 2.022212 0.007797 1.849152 2.195273
5.A -1.3273 0.00697 -1.49093 -1.16367
6.A 0.095207 0.002143 0.004477 0.185937
7.A 0.859031 0.010081 0.662239 1.055824
8.A 0.219138 0.003468 0.103722 0.334554
9.A 0.44812 0.007014 0.283977 0.612263
10.A -1.24717 0.030094 -1.58718 -0.90716
Page 139
128
11.A -0.02174 0.142964 -0.76281 0.719335
12.A -0.23818 0.001406 -0.31167 -0.16469
13.A -0.41772 0.007366 -0.58594 -0.2495
FTFT Geographic Concentration, HH Index
1.A 0.8409 0.006667 0.680864 1.000936
2.A -0.98805 0.012056 -1.20326 -0.77285
3.A 0.090954 0.018493 -0.17558 0.357487
4.A -0.12442 0.009629 -0.31674 0.067904
5.A -1.45241 0.007948 -1.62714 -1.27768
6.A 0.727641 0.002354 0.632554 0.822727
7.A 0.49937 0.011522 0.288989 0.709751
8.A -0.35422 0.003702 -0.47347 -0.23497
9.A 0.205609 0.007527 0.03557 0.375649
10.A -1.35293 0.033333 -1.71076 -0.99509
11.A -1.57382 0.15817 -2.35331 -0.79433
12.A -0.23107 0.001536 -0.30788 -0.15425
13.A 0.19205 0.009627 -0.00026 0.384361
Net Price, Dollars 1.A -0.75026 0.00598 -0.90182 -0.59869
2.A 1.922908 0.013038 1.699116 2.146701
3.A -0.77227 0.017247 -1.02967 -0.51488
4.A -0.00114 0.008476 -0.18159 0.179308
5.A -0.43692 0.010464 -0.63741 -0.23642
6.A -0.60046 0.002336 -0.69518 -0.50573
7.A -0.28409 0.009014 -0.47017 -0.09801
8.A 0.45677 0.003538 0.340187 0.573352
9.A -0.35259 0.007658 -0.5241 -0.18108
10.A -1.08938 0.031744 -1.43859 -0.74018
11.A 0.715308 0.150796 -0.04579 1.47641
12.A 0.521261 0.001364 0.448868 0.593653
13.A -0.43959 0.008044 -0.61538 -0.2638
Tuition and Fees, Dollars 1.A -1.01265 0.002376 -1.10819 -0.91711
2.A 1.202915 0.005754 1.054244 1.351587
3.A -0.68724 0.006756 -0.84834 -0.52614
4.A -0.70268 0.003406 -0.81705 -0.5883
5.A 1.901325 0.003063 1.792849 2.0098
Page 140
129
6.A -0.89428 0.001256 -0.96373 -0.82482
7.A -0.70834 0.003492 -0.82417 -0.59251
8.A 0.175571 0.001588 0.097471 0.253671
9.A -0.63081 0.002835 -0.73517 -0.52645
10.A 1.55349 0.012403 1.335212 1.771767
11.A -0.49557 0.058631 -0.97015 -0.02099
12.A 0.747166 0.000648 0.697267 0.797066
13.A -0.71288 0.004758 -0.84808 -0.57769
Instructional Expenditures, Dollars 1.A -0.31415 0.00365 -0.43256 -0.19573
2.A 0.777871 0.007734 0.605509 0.950233
3.A 0.571319 0.01146 0.3615 0.781138
4.A -0.30987 0.004797 -0.44561 -0.17413
5.A 1.745725 0.007162 1.579861 1.911588
6.A -0.35062 0.001301 -0.42131 -0.27992
7.A -0.52904 0.00508 -0.66874 -0.38934
8.A -0.40649 0.002152 -0.49741 -0.31557
9.A -0.19132 0.004677 -0.32537 -0.05728
10.A 5.464602 0.020636 5.183047 5.746158
11.A -0.91506 0.097351 -1.52659 -0.30353
12.A -0.0441 0.000894 -0.1027 0.014512
13.A 0.196154 0.005344 0.052874 0.339434
Number of Undergraduate Degrees Offered, Count
1.A 1.256153 0.004042 1.131549 1.380757
2.A -1.3589 0.006334 -1.51489 -1.20292
3.A 2.319709 0.009098 2.132759 2.506659
4.A -0.41986 0.004088 -0.54517 -0.29454
5.A 0.257675 0.004112 0.131993 0.383357
6.A -0.09262 0.00145 -0.16725 -0.01799
7.A -1.05221 0.004752 -1.18733 -0.9171
8.A -0.47477 0.001899 -0.56017 -0.38936
9.A -1.49077 0.003506 -1.60682 -1.37473
10.A 1.409114 0.016566 1.156852 1.661375
11.A 0.466428 0.078687 -0.08337 1.016222
12.A 0.065317 0.000712 0.013003 0.117631
13.A 1.722988 0.004 1.599032 1.846945
Bachelor's Degree Production, HH Index
Page 141
130
1.A -0.53171 0.00124 -0.60074 -0.46269
2.A 2.626134 0.004533 2.494177 2.758092
3.A -0.5439 0.003623 -0.66188 -0.42592
4.A -0.3848 0.00168 -0.46513 -0.30447
5.A -0.32995 0.001869 -0.41469 -0.24522
6.A -0.32553 0.000476 -0.36831 -0.28275
7.A 0.619003 0.003645 0.500672 0.737335
8.A -0.08772 0.000888 -0.14612 -0.02932
9.A 3.018553 0.001964 2.931699 3.105407
10.A -0.44387 0.006692 -0.6042 -0.28353
11.A -0.04962 0.03179 -0.39908 0.29983
12.A -0.33241 0.000288 -0.36567 -0.29915
13.A -0.53569 0.001564 -0.61321 -0.45817
Tenure and Tenure-track Faculty, Percent
1.A 0.458016 0.002458 0.360838 0.555193
2.A -0.93046 0.005745 -1.07901 -0.78191
3.A 0.213387 0.005619 0.066474 0.3603
4.A 0.318388 0.003024 0.210617 0.426158
5.A 0.507575 0.00253 0.408999 0.60615
6.A 0.570533 0.000725 0.517778 0.623288
7.A -1.5954 0.002665 -1.69658 -1.49423
8.A -1.60471 0.001216 -1.67305 -1.53637
9.A -1.53082 0.002437 -1.62758 -1.43406
10.A 0.025846 0.01034 -0.17345 0.225143
11.A -1.69586 0.049117 -2.13023 -1.26148
12.A 0.614436 0.000444 0.573131 0.655742
13.A 0.310292 0.002576 0.210814 0.409769
Science and Engineering Research Expenditures, Dollars
1.A -0.13505 0.002019 -0.22312 -0.04698
2.A -0.22834 0.003856 -0.35005 -0.10663
3.A 3.465326 0.009556 3.273731 3.656922
4.A -0.21725 0.002544 -0.31612 -0.11839
5.A 0.067427 0.003277 -0.04478 0.179632
6.A -0.23065 0.000689 -0.28211 -0.1792
7.A -0.23679 0.002649 -0.33766 -0.13591
8.A -0.23588 0.001134 -0.30188 -0.16988
9.A -0.23678 0.002342 -0.33164 -0.14192
10.A 6.190893 0.01116 5.983845 6.397942
Page 142
131
11.A -0.23679 0.052992 -0.68797 0.214395
12.A -0.22994 0.000448 -0.27143 -0.18845
13.A 0.807378 0.003066 0.698854 0.915903
Non-Science and Engineering Research Expenditures, Dollars
1.A -0.10576 0.003541 -0.22239 0.010863
2.A -0.24152 0.005809 -0.39091 -0.09213
3.A 3.922193 0.009682 3.72934 4.115045
4.A -0.22436 0.003837 -0.34577 -0.10294
5.A 0.11103 0.004008 -0.01305 0.235111
6.A -0.2387 0.001039 -0.30187 -0.17554
7.A -0.24553 0.003993 -0.36938 -0.12167
8.A -0.24316 0.001709 -0.32418 -0.16213
9.A -0.24552 0.003531 -0.36199 -0.12906
10.A 4.572332 0.016823 4.318118 4.826547
11.A -0.24553 0.079887 -0.7995 0.308446
12.A -0.23778 0.000668 -0.28841 -0.18714
13.A 1.025839 0.006448 0.868451 1.183227
PhD Offerings, Count 1.A 0.228015 0.003344 0.114676 0.341353
2.A -0.38257 0.003621 -0.50051 -0.26463
3.A 3.499883 0.005222 3.358254 3.641512
4.A -0.18541 0.002278 -0.27896 -0.09185
5.A 0.33836 0.003741 0.218479 0.458241
6.A -0.35871 0.000637 -0.40818 -0.30925
7.A -0.37685 0.002292 -0.47069 -0.28301
8.A -0.37795 0.000993 -0.43972 -0.31619
9.A -0.41629 0.002 -0.50394 -0.32864
10.A 3.354089 0.009503 3.163026 3.545152
11.A -0.05102 0.045136 -0.46741 0.365384
12.A -0.3351 0.00041 -0.37477 -0.29543
13.A 2.467646 0.003041 2.359556 2.575736
/ var(e.zadm~A 0.682855 0.000607 0.634554 0.731156
var(e.zadm~A 0.682855 0.000607 0.634554 0.731156
var(e.zadm~A 0.682855 0.000607 0.634554 0.731156
var(e.zadm~A 0.682855 0.000607 0.634554 0.731156
var(e.zadm~A 0.682855 0.000607 0.634554 0.731156
Page 143
132
var(e.zadm~A 0.682855 0.000607 0.634554 0.731156
var(e.zadm~A 0.682855 0.000607 0.634554 0.731156
var(e.zadm~A 0.682855 0.000607 0.634554 0.731156
var(e.zadm~A 0.682855 0.000607 0.634554 0.731156
var(e.zadm~A 0.682855 0.000607 0.634554 0.731156
var(e.zadm~A 0.682855 0.000607 0.634554 0.731156
var(e.zadm~A 0.682855 0.000607 0.634554 0.731156
var(e.zadm~A 0.682855 0.000607 0.634554 0.731156
var(e.zdis~A 0.718365 0.000711 0.66612 0.77061
var(e.zdis~A 0.718365 0.000711 0.66612 0.77061
var(e.zdis~A 0.718365 0.000711 0.66612 0.77061
var(e.zdis~A 0.718365 0.000711 0.66612 0.77061
var(e.zdis~A 0.718365 0.000711 0.66612 0.77061
var(e.zdis~A 0.718365 0.000711 0.66612 0.77061
var(e.zdis~A 0.718365 0.000711 0.66612 0.77061
var(e.zdis~A 0.718365 0.000711 0.66612 0.77061
var(e.zdis~A 0.718365 0.000711 0.66612 0.77061
var(e.zdis~A 0.718365 0.000711 0.66612 0.77061
var(e.zdis~A 0.718365 0.000711 0.66612 0.77061
var(e.zdis~A 0.718365 0.000711 0.66612 0.77061
var(e.zdis~A 0.718365 0.000711 0.66612 0.77061
var(e.zeft~A 0.238222 0.000092 0.219426 0.257017
var(e.zeft~A 0.238222 0.000092 0.219426 0.257017
var(e.zeft~A 0.238222 0.000092 0.219426 0.257017
var(e.zeft~A 0.238222 0.000092 0.219426 0.257017
var(e.zeft~A 0.238222 0.000092 0.219426 0.257017
var(e.zeft~A 0.238222 0.000092 0.219426 0.257017
var(e.zeft~A 0.238222 0.000092 0.219426 0.257017
var(e.zeft~A 0.238222 0.000092 0.219426 0.257017
var(e.zeft~A 0.238222 0.000092 0.219426 0.257017
var(e.zeft~A 0.238222 0.000092 0.219426 0.257017
var(e.zeft~A 0.238222 0.000092 0.219426 0.257017
var(e.zeft~A 0.238222 0.000092 0.219426 0.257017
var(e.zeft~A 0.238222 0.000092 0.219426 0.257017
var(e.zeft~A 0.279724 0.00015 0.255739 0.303708
var(e.zeft~A 0.279724 0.00015 0.255739 0.303708
var(e.zeft~A 0.279724 0.00015 0.255739 0.303708
var(e.zeft~A 0.279724 0.00015 0.255739 0.303708
var(e.zeft~A 0.279724 0.00015 0.255739 0.303708
var(e.zeft~A 0.279724 0.00015 0.255739 0.303708
Page 144
133
var(e.zeft~A 0.279724 0.00015 0.255739 0.303708
var(e.zeft~A 0.279724 0.00015 0.255739 0.303708
var(e.zeft~A 0.279724 0.00015 0.255739 0.303708
var(e.zeft~A 0.279724 0.00015 0.255739 0.303708
var(e.zeft~A 0.279724 0.00015 0.255739 0.303708
var(e.zeft~A 0.279724 0.00015 0.255739 0.303708
var(e.zeft~A 0.279724 0.00015 0.255739 0.303708
var(e.zftf~A 0.689041 0.000686 0.637716 0.740366
var(e.zftf~A 0.689041 0.000686 0.637716 0.740366
var(e.zftf~A 0.689041 0.000686 0.637716 0.740366
var(e.zftf~A 0.689041 0.000686 0.637716 0.740366
var(e.zftf~A 0.689041 0.000686 0.637716 0.740366
var(e.zftf~A 0.689041 0.000686 0.637716 0.740366
var(e.zftf~A 0.689041 0.000686 0.637716 0.740366
var(e.zftf~A 0.689041 0.000686 0.637716 0.740366
var(e.zftf~A 0.689041 0.000686 0.637716 0.740366
var(e.zftf~A 0.689041 0.000686 0.637716 0.740366
var(e.zftf~A 0.689041 0.000686 0.637716 0.740366
var(e.zftf~A 0.689041 0.000686 0.637716 0.740366
var(e.zftf~A 0.689041 0.000686 0.637716 0.740366
var(e.zurm~A 0.516441 0.000425 0.47602 0.556862
var(e.zurm~A 0.516441 0.000425 0.47602 0.556862
var(e.zurm~A 0.516441 0.000425 0.47602 0.556862
var(e.zurm~A 0.516441 0.000425 0.47602 0.556862
var(e.zurm~A 0.516441 0.000425 0.47602 0.556862
var(e.zurm~A 0.516441 0.000425 0.47602 0.556862
var(e.zurm~A 0.516441 0.000425 0.47602 0.556862
var(e.zurm~A 0.516441 0.000425 0.47602 0.556862
var(e.zurm~A 0.516441 0.000425 0.47602 0.556862
var(e.zurm~A 0.516441 0.000425 0.47602 0.556862
var(e.zurm~A 0.516441 0.000425 0.47602 0.556862
var(e.zurm~A 0.516441 0.000425 0.47602 0.556862
var(e.zurm~A 0.516441 0.000425 0.47602 0.556862
var(e.zPel~A 0.571855 0.000444 0.53056 0.613149
var(e.zPel~A 0.571855 0.000444 0.53056 0.613149
var(e.zPel~A 0.571855 0.000444 0.53056 0.613149
var(e.zPel~A 0.571855 0.000444 0.53056 0.613149
var(e.zPel~A 0.571855 0.000444 0.53056 0.613149
var(e.zPel~A 0.571855 0.000444 0.53056 0.613149
var(e.zPel~A 0.571855 0.000444 0.53056 0.613149
Page 145
134
var(e.zPel~A 0.571855 0.000444 0.53056 0.613149
var(e.zPel~A 0.571855 0.000444 0.53056 0.613149
var(e.zPel~A 0.571855 0.000444 0.53056 0.613149
var(e.zPel~A 0.571855 0.000444 0.53056 0.613149
var(e.zPel~A 0.571855 0.000444 0.53056 0.613149
var(e.zPel~A 0.571855 0.000444 0.53056 0.613149
var(e.zHHI~A 0.632679 0.000537 0.587243 0.678115
var(e.zHHI~A 0.632679 0.000537 0.587243 0.678115
var(e.zHHI~A 0.632679 0.000537 0.587243 0.678115
var(e.zHHI~A 0.632679 0.000537 0.587243 0.678115
var(e.zHHI~A 0.632679 0.000537 0.587243 0.678115
var(e.zHHI~A 0.632679 0.000537 0.587243 0.678115
var(e.zHHI~A 0.632679 0.000537 0.587243 0.678115
var(e.zHHI~A 0.632679 0.000537 0.587243 0.678115
var(e.zHHI~A 0.632679 0.000537 0.587243 0.678115
var(e.zHHI~A 0.632679 0.000537 0.587243 0.678115
var(e.zHHI~A 0.632679 0.000537 0.587243 0.678115
var(e.zHHI~A 0.632679 0.000537 0.587243 0.678115
var(e.zHHI~A 0.632679 0.000537 0.587243 0.678115
var(e.zNet~A 0.603184 0.000525 0.558272 0.648095
var(e.zNet~A 0.603184 0.000525 0.558272 0.648095
var(e.zNet~A 0.603184 0.000525 0.558272 0.648095
var(e.zNet~A 0.603184 0.000525 0.558272 0.648095
var(e.zNet~A 0.603184 0.000525 0.558272 0.648095
var(e.zNet~A 0.603184 0.000525 0.558272 0.648095
var(e.zNet~A 0.603184 0.000525 0.558272 0.648095
var(e.zNet~A 0.603184 0.000525 0.558272 0.648095
var(e.zNet~A 0.603184 0.000525 0.558272 0.648095
var(e.zNet~A 0.603184 0.000525 0.558272 0.648095
var(e.zNet~A 0.603184 0.000525 0.558272 0.648095
var(e.zNet~A 0.603184 0.000525 0.558272 0.648095
var(e.zNet~A 0.603184 0.000525 0.558272 0.648095
var(e.zTui~A 0.234523 0.000177 0.208433 0.260613
var(e.zTui~A 0.234523 0.000177 0.208433 0.260613
var(e.zTui~A 0.234523 0.000177 0.208433 0.260613
var(e.zTui~A 0.234523 0.000177 0.208433 0.260613
var(e.zTui~A 0.234523 0.000177 0.208433 0.260613
var(e.zTui~A 0.234523 0.000177 0.208433 0.260613
var(e.zTui~A 0.234523 0.000177 0.208433 0.260613
var(e.zTui~A 0.234523 0.000177 0.208433 0.260613
Page 146
135
var(e.zTui~A 0.234523 0.000177 0.208433 0.260613
var(e.zTui~A 0.234523 0.000177 0.208433 0.260613
var(e.zTui~A 0.234523 0.000177 0.208433 0.260613
var(e.zTui~A 0.234523 0.000177 0.208433 0.260613
var(e.zTui~A 0.234523 0.000177 0.208433 0.260613
var(e.zins~t 0.389402 0.000199 0.361744 0.417061
var(e.zins~t 0.389402 0.000199 0.361744 0.417061
var(e.zins~t 0.389402 0.000199 0.361744 0.417061
var(e.zins~t 0.389402 0.000199 0.361744 0.417061
var(e.zins~t 0.389402 0.000199 0.361744 0.417061
var(e.zins~t 0.389402 0.000199 0.361744 0.417061
var(e.zins~t 0.389402 0.000199 0.361744 0.417061
var(e.zins~t 0.389402 0.000199 0.361744 0.417061
var(e.zins~t 0.389402 0.000199 0.361744 0.417061
var(e.zins~t 0.389402 0.000199 0.361744 0.417061
var(e.zins~t 0.389402 0.000199 0.361744 0.417061
var(e.zins~t 0.389402 0.000199 0.361744 0.417061
var(e.zins~t 0.389402 0.000199 0.361744 0.417061
var(e.zUG_~A 0.314748 0.000139 0.29161 0.337886
var(e.zUG_~A 0.314748 0.000139 0.29161 0.337886
var(e.zUG_~A 0.314748 0.000139 0.29161 0.337886
var(e.zUG_~A 0.314748 0.000139 0.29161 0.337886
var(e.zUG_~A 0.314748 0.000139 0.29161 0.337886
var(e.zUG_~A 0.314748 0.000139 0.29161 0.337886
var(e.zUG_~A 0.314748 0.000139 0.29161 0.337886
var(e.zUG_~A 0.314748 0.000139 0.29161 0.337886
var(e.zUG_~A 0.314748 0.000139 0.29161 0.337886
var(e.zUG_~A 0.314748 0.000139 0.29161 0.337886
var(e.zUG_~A 0.314748 0.000139 0.29161 0.337886
var(e.zUG_~A 0.314748 0.000139 0.29161 0.337886
var(e.zUG_~A 0.314748 0.000139 0.29161 0.337886
var(e.zHHI~A 0.127159 2.55E-05 0.117259 0.137059
var(e.zHHI~A 0.127159 2.55E-05 0.117259 0.137059
var(e.zHHI~A 0.127159 2.55E-05 0.117259 0.137059
var(e.zHHI~A 0.127159 2.55E-05 0.117259 0.137059
var(e.zHHI~A 0.127159 2.55E-05 0.117259 0.137059
var(e.zHHI~A 0.127159 2.55E-05 0.117259 0.137059
var(e.zHHI~A 0.127159 2.55E-05 0.117259 0.137059
var(e.zHHI~A 0.127159 2.55E-05 0.117259 0.137059
var(e.zHHI~A 0.127159 2.55E-05 0.117259 0.137059
Page 147
136
var(e.zHHI~A 0.127159 2.55E-05 0.117259 0.137059
var(e.zHHI~A 0.127159 2.55E-05 0.117259 0.137059
var(e.zHHI~A 0.127159 2.55E-05 0.117259 0.137059
var(e.zHHI~A 0.127159 2.55E-05 0.117259 0.137059
var(e.zTen~A 0.196468 8.43E-05 0.178477 0.214458
var(e.zTen~A 0.196468 8.43E-05 0.178477 0.214458
var(e.zTen~A 0.196468 8.43E-05 0.178477 0.214458
var(e.zTen~A 0.196468 8.43E-05 0.178477 0.214458
var(e.zTen~A 0.196468 8.43E-05 0.178477 0.214458
var(e.zTen~A 0.196468 8.43E-05 0.178477 0.214458
var(e.zTen~A 0.196468 8.43E-05 0.178477 0.214458
var(e.zTen~A 0.196468 8.43E-05 0.178477 0.214458
var(e.zTen~A 0.196468 8.43E-05 0.178477 0.214458
var(e.zTen~A 0.196468 8.43E-05 0.178477 0.214458
var(e.zTen~A 0.196468 8.43E-05 0.178477 0.214458
var(e.zTen~A 0.196468 8.43E-05 0.178477 0.214458
var(e.zTen~A 0.196468 8.43E-05 0.178477 0.214458
var(e.zCC_~A 0.211969 6.87E-05 0.195727 0.228211
var(e.zCC_~A 0.211969 6.87E-05 0.195727 0.228211
var(e.zCC_~A 0.211969 6.87E-05 0.195727 0.228211
var(e.zCC_~A 0.211969 6.87E-05 0.195727 0.228211
var(e.zCC_~A 0.211969 6.87E-05 0.195727 0.228211
var(e.zCC_~A 0.211969 6.87E-05 0.195727 0.228211
var(e.zCC_~A 0.211969 6.87E-05 0.195727 0.228211
var(e.zCC_~A 0.211969 6.87E-05 0.195727 0.228211
var(e.zCC_~A 0.211969 6.87E-05 0.195727 0.228211
var(e.zCC_~A 0.211969 6.87E-05 0.195727 0.228211
var(e.zCC_~A 0.211969 6.87E-05 0.195727 0.228211
var(e.zCC_~A 0.211969 6.87E-05 0.195727 0.228211
var(e.zCC_~A 0.211969 6.87E-05 0.195727 0.228211
var(e.zCC~1. 0.319549 0.000162 0.294569 0.34453
var(e.zCC~2. 0.319549 0.000162 0.294569 0.34453
var(e.zCC~3. 0.319549 0.000162 0.294569 0.34453
var(e.zCC~4. 0.319549 0.000162 0.294569 0.34453
var(e.zCC~5. 0.319549 0.000162 0.294569 0.34453
var(e.zCC~6. 0.319549 0.000162 0.294569 0.34453
var(e.zCC~7. 0.319549 0.000162 0.294569 0.34453
var(e.zCC~8. 0.319549 0.000162 0.294569 0.34453
var(e.zCC~9. 0.319549 0.000162 0.294569 0.34453
var(e.zCC~10 0.319549 0.000162 0.294569 0.34453
Page 148
137
var(e.zCC~11 0.319549 0.000162 0.294569 0.34453
var(e.zCC~12 0.319549 0.000162 0.294569 0.34453
var(e.zCC~13 0.319549 0.000162 0.294569 0.34453
var(e.zPhD~A 0.180544 7.18E-05 0.163935 0.197153
var(e.zPhD~A 0.180544 7.18E-05 0.163935 0.197153
var(e.zPhD~A 0.180544 7.18E-05 0.163935 0.197153
var(e.zPhD~A 0.180544 7.18E-05 0.163935 0.197153
var(e.zPhD~A 0.180544 7.18E-05 0.163935 0.197153
var(e.zPhD~A 0.180544 7.18E-05 0.163935 0.197153
var(e.zPhD~A 0.180544 7.18E-05 0.163935 0.197153
var(e.zPhD~A 0.180544 7.18E-05 0.163935 0.197153
var(e.zPhD~A 0.180544 7.18E-05 0.163935 0.197153
var(e.zPhD~A 0.180544 7.18E-05 0.163935 0.197153
var(e.zPhD~A 0.180544 7.18E-05 0.163935 0.197153
var(e.zPhD~A 0.180544 7.18E-05 0.163935 0.197153
var(e.zPhD~A 0.180544 7.18E-05 0.163935 0.197153