42
Using Lattice to Plot Grouped Data Richard Pugh 4 th December 2012
| Date post: | 18-Dec-2015 |
| Category: |
Documents |
| Upload: | dinah-watkins |
| View: | 214 times |
| Download: | 0 times |

Using Lattice to Plot Grouped DataRichard Pugh4th December 2012
Agenda
• What are Lattice Graphics?• Panel Functions• Grouped data• The mechanics of grouped plots• Plotting more than 1 group• Summary

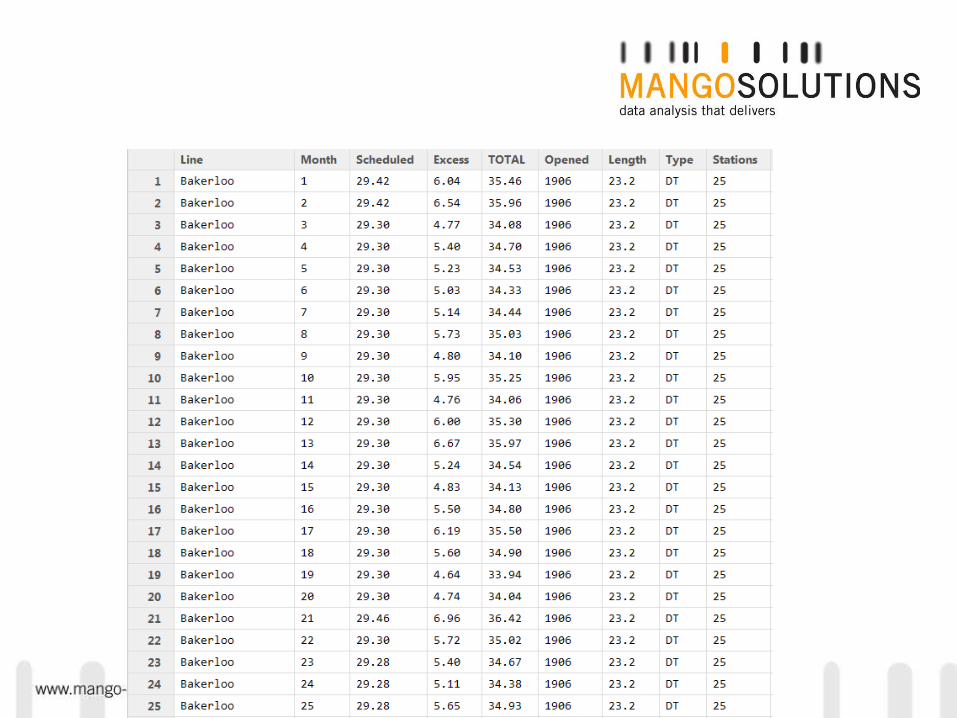
The Data We Will Use
• Something relevant and sector independent • London Tube Performance Data from the TFL
website• Excess Travel Hours by Line
http://data.london.gov.uk/datastore/package/tube-network-performance-data http://en.wikipedia.org/wiki/London_Underground
What are Lattice Graphics?

Overview of Lattice Graphics
• One of the graphic systems of R (others include “Traditional” and “GGPlot”)
• An implementation of the S+ “Trellis” Graphics
• Written by Deepayan Sarkar, Fred Hutchinson Cancer Research Center

Panel Functions

Panel Functions
• For each lattice graph, R performs the following actions:• Partitions the data• Draws the graph “outline” (i.e. the “panels”)• Passes the data for each panel into the “panel”
function
• We can overwrite this panel function and supply our own …

Panel Functions
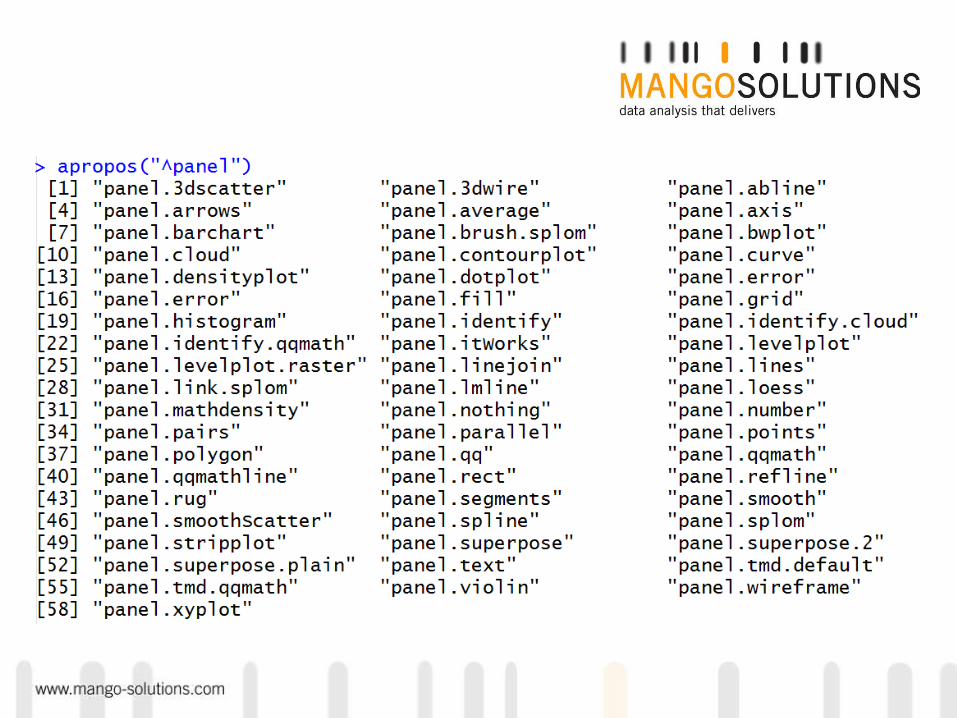
• The default “panel” function for a lattice function is “panel.NameOfFunction”
• Let’s look at panel.xyplot …

Arguments for styling
Jitter & other less used bits
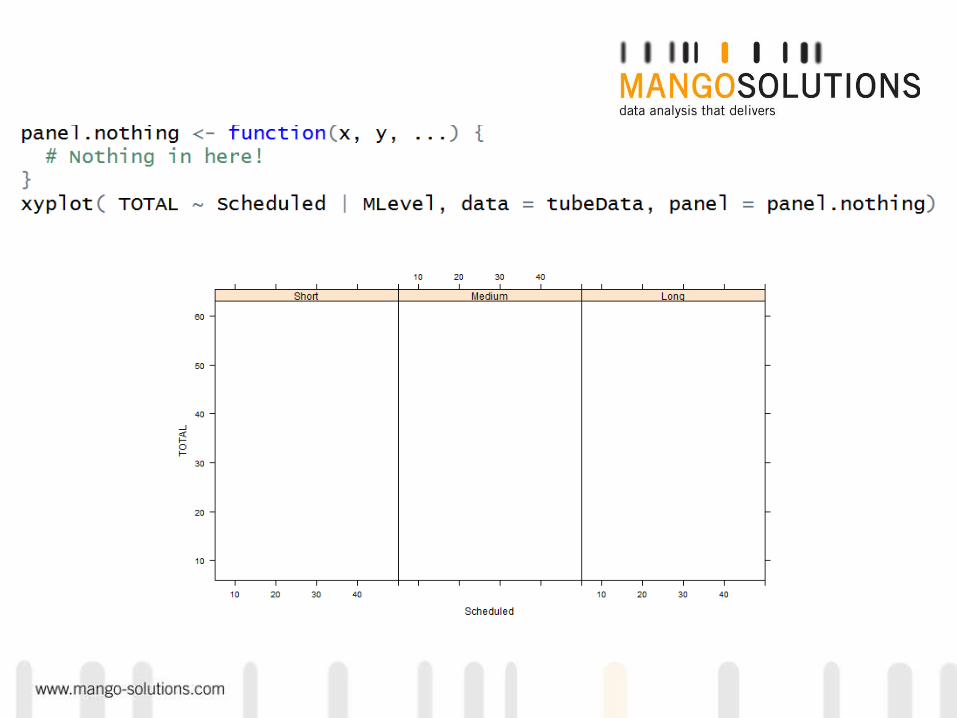
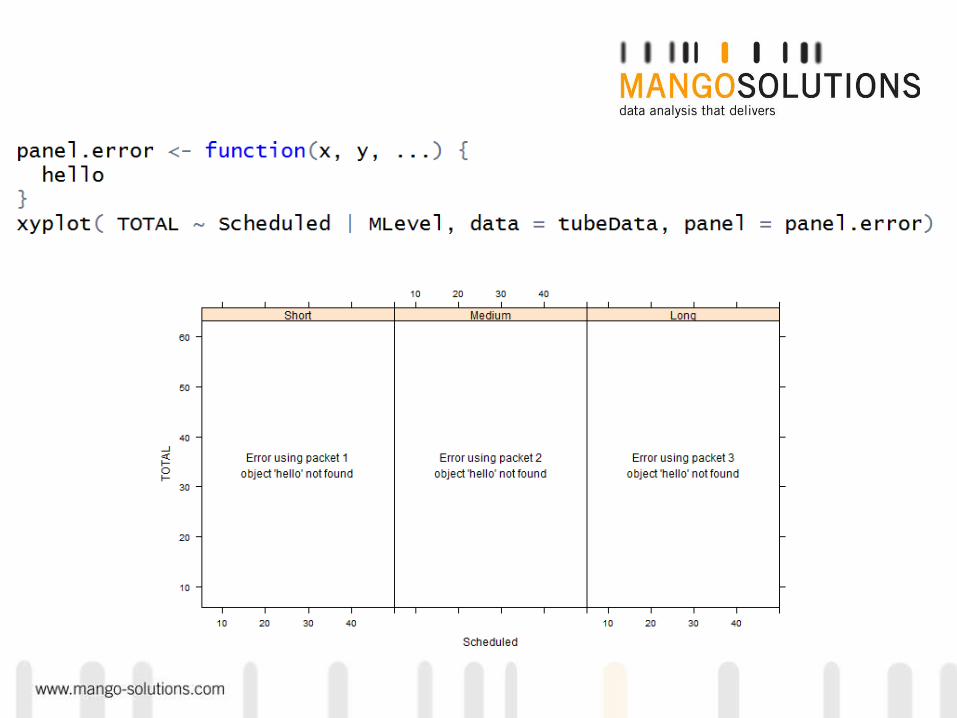
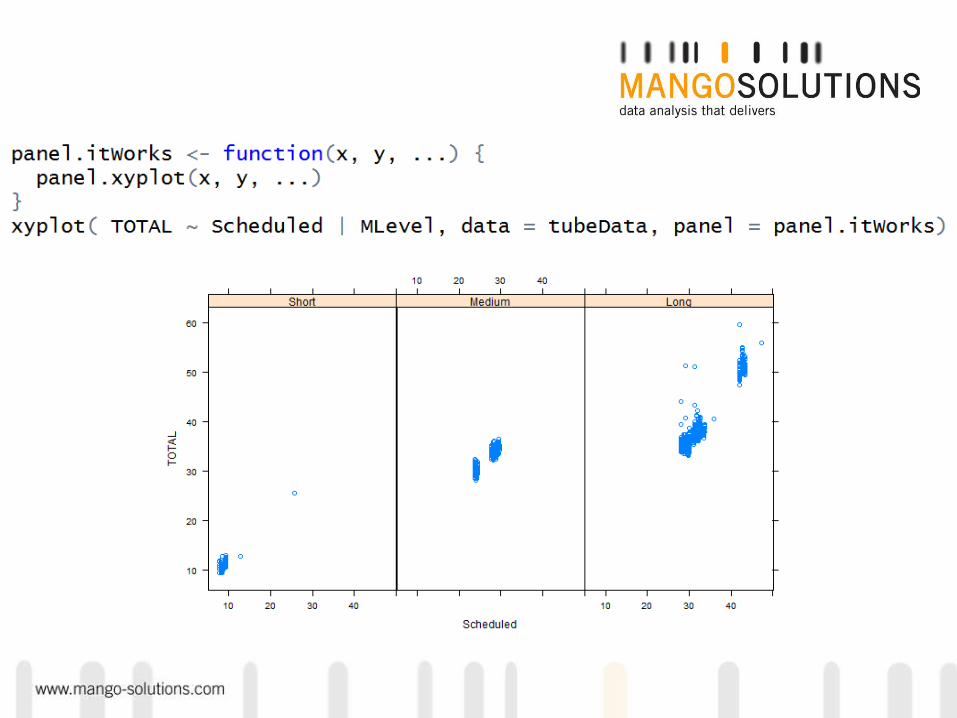
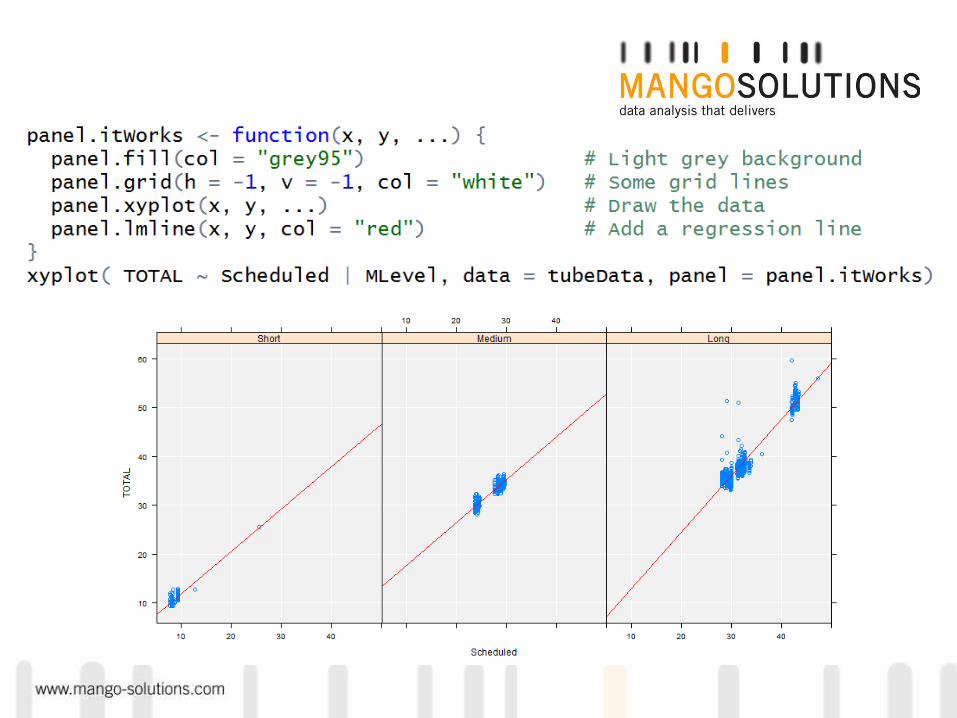
Let’s write our own panel function …….

Now what?
• Now we can insert other functions into a panel function which will then impact each individual plot panel
• We can call:• Lattice “low level functions” (lpoints, ltext, llines, lpolygon etc)
• Existing “panel.” functions that exist for this purpose
Grouped Data

Grouped Data
• Many datasets will have inherit groupings• Examples may include:
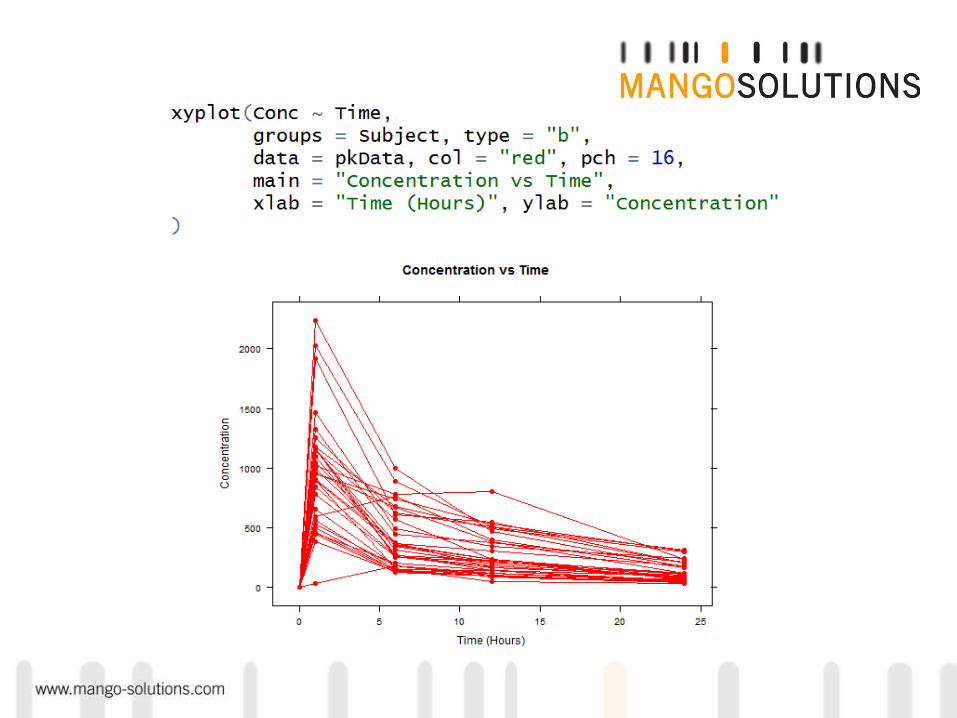
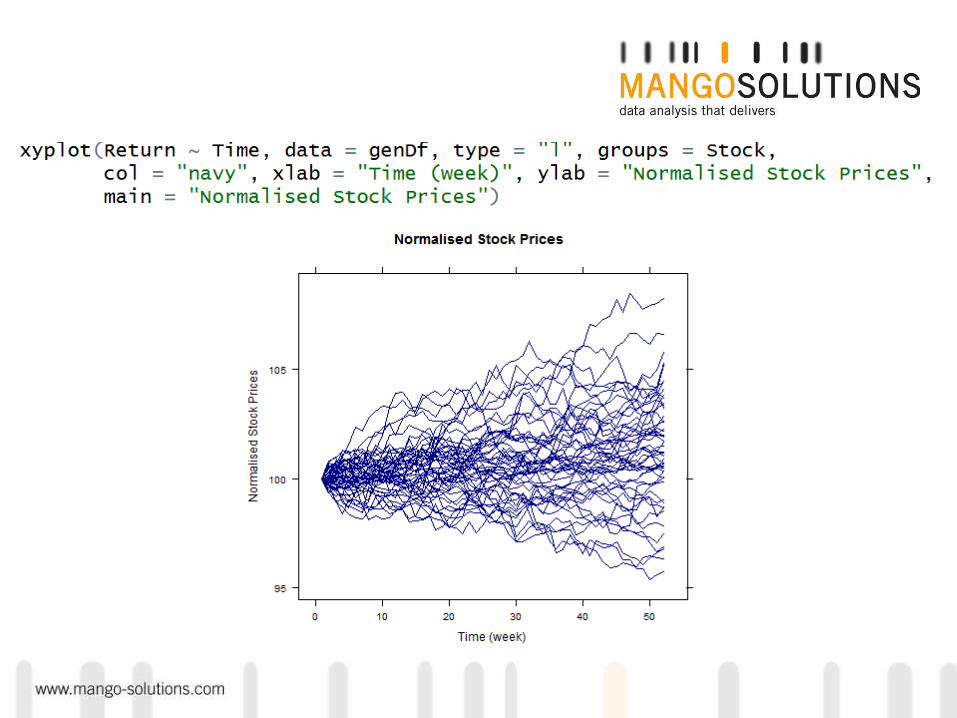
• “Stock” for finance data• “Subject” for pharma data
• We *always* want to take this into account when working with graphics

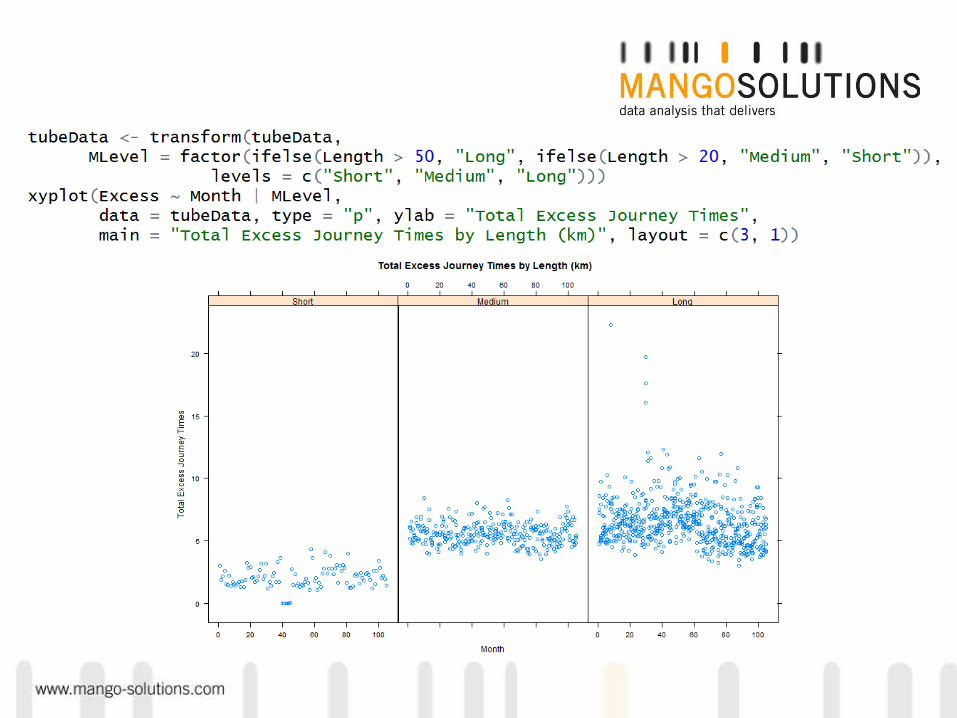
Grouped Data
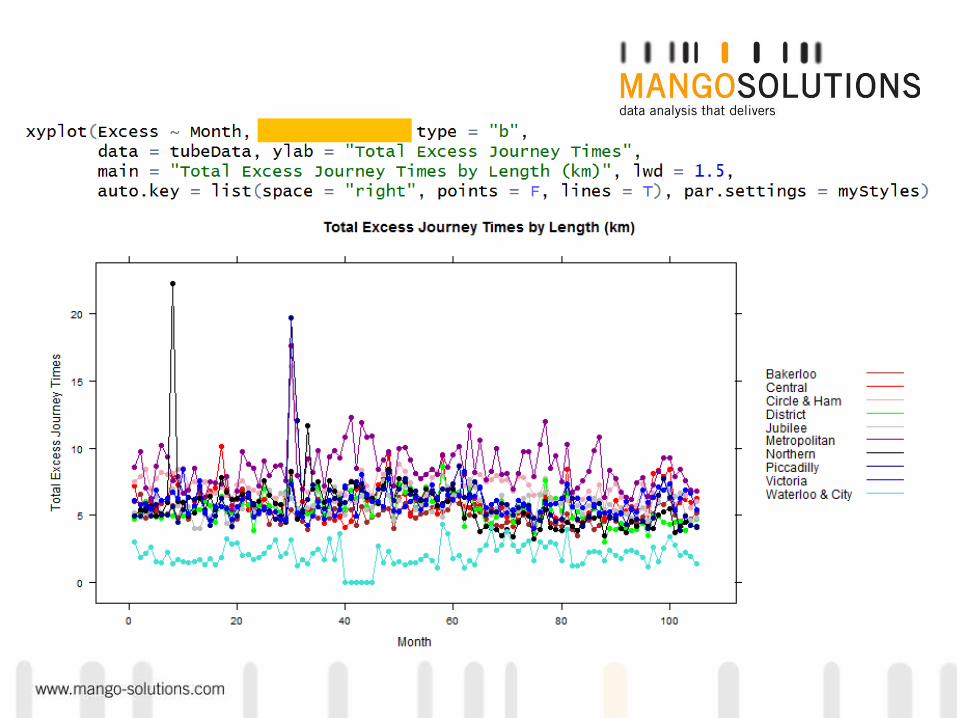
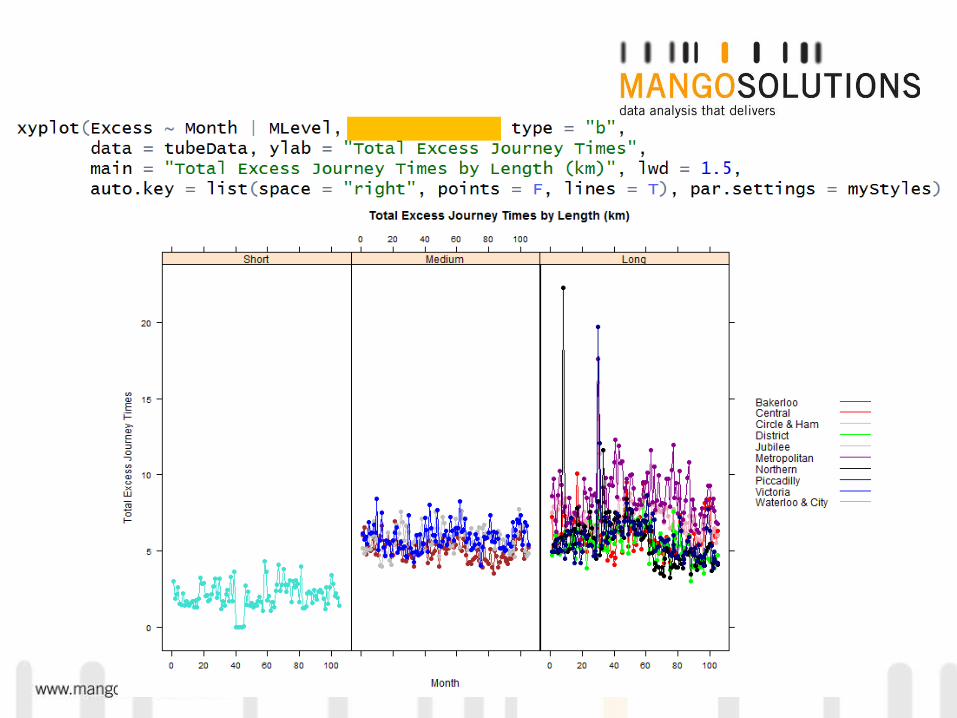
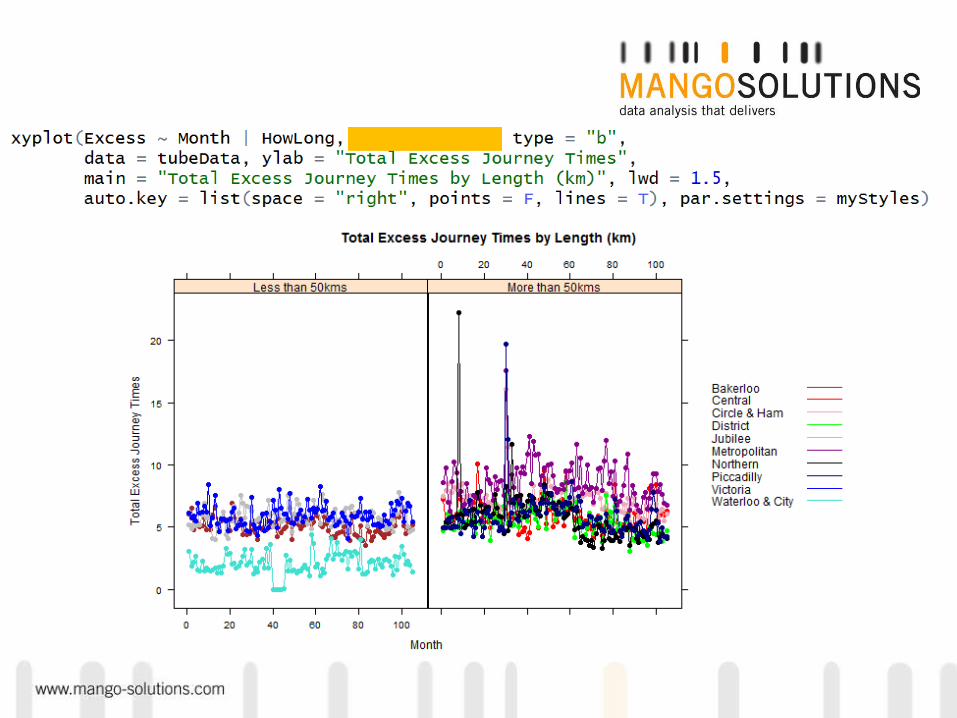
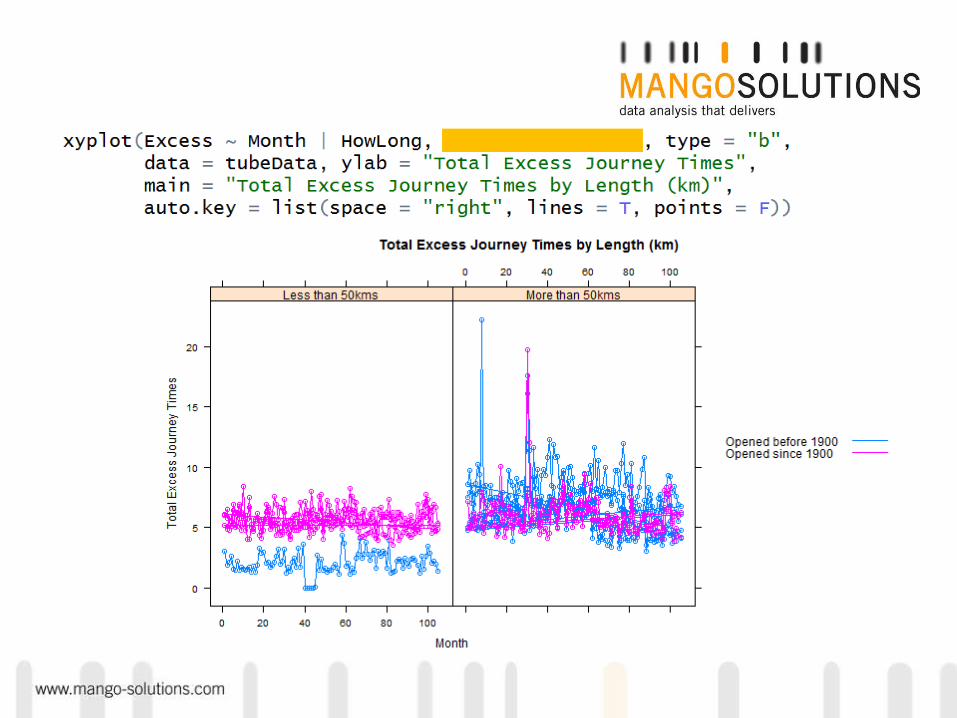
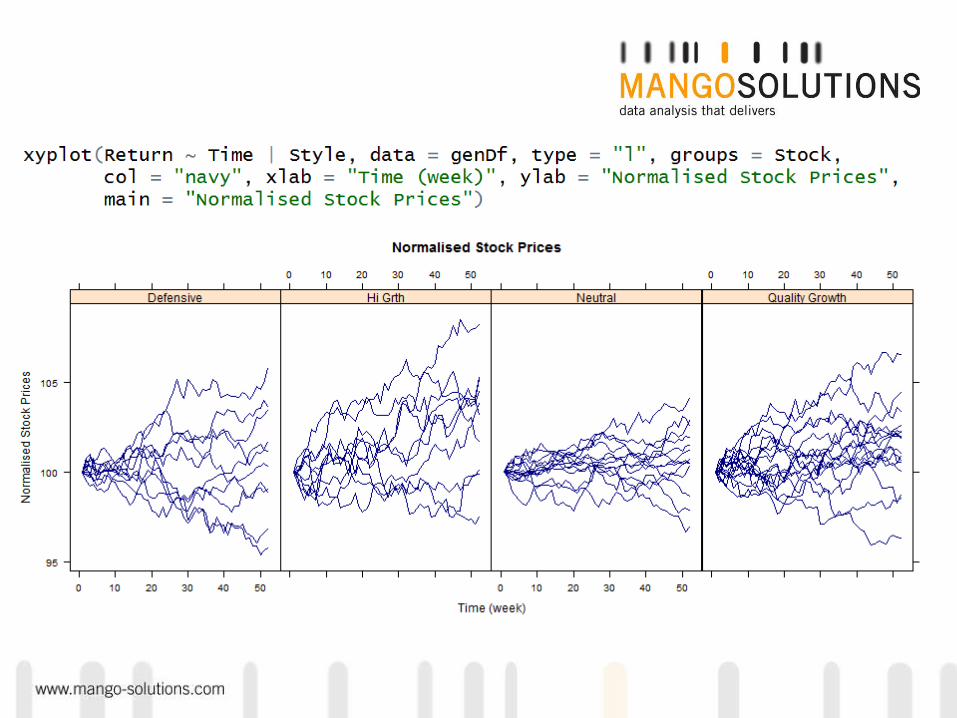
• We can specify groupings within our data in order to plot these groupings separately
• By default, lattice will vary styling of the groups specified
• The key argument is the “groups” argument

The Mechanics of Grouped Data


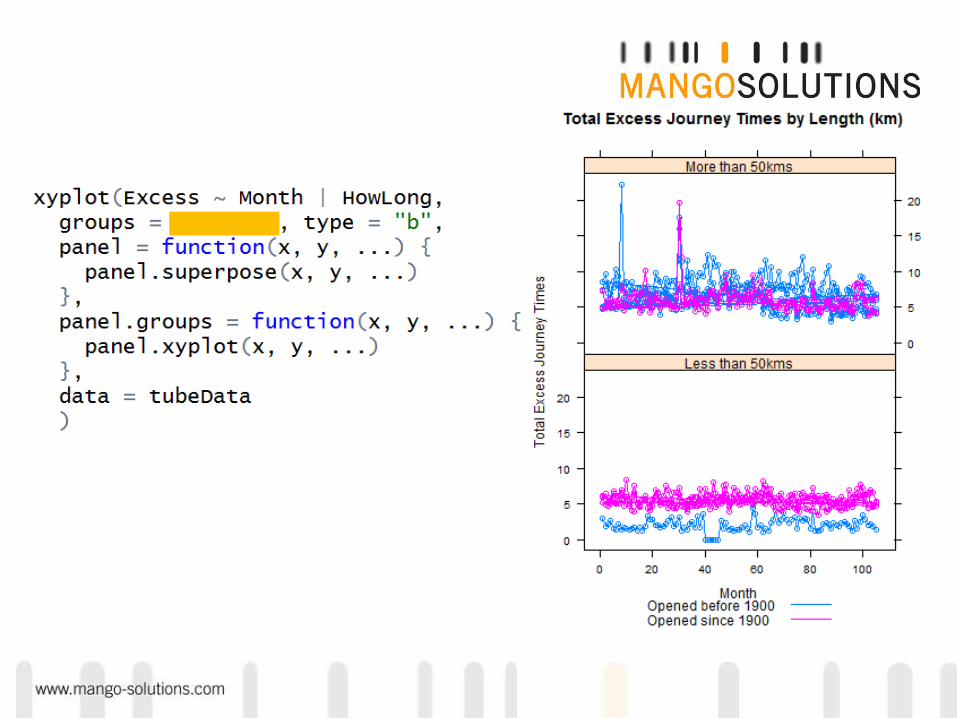
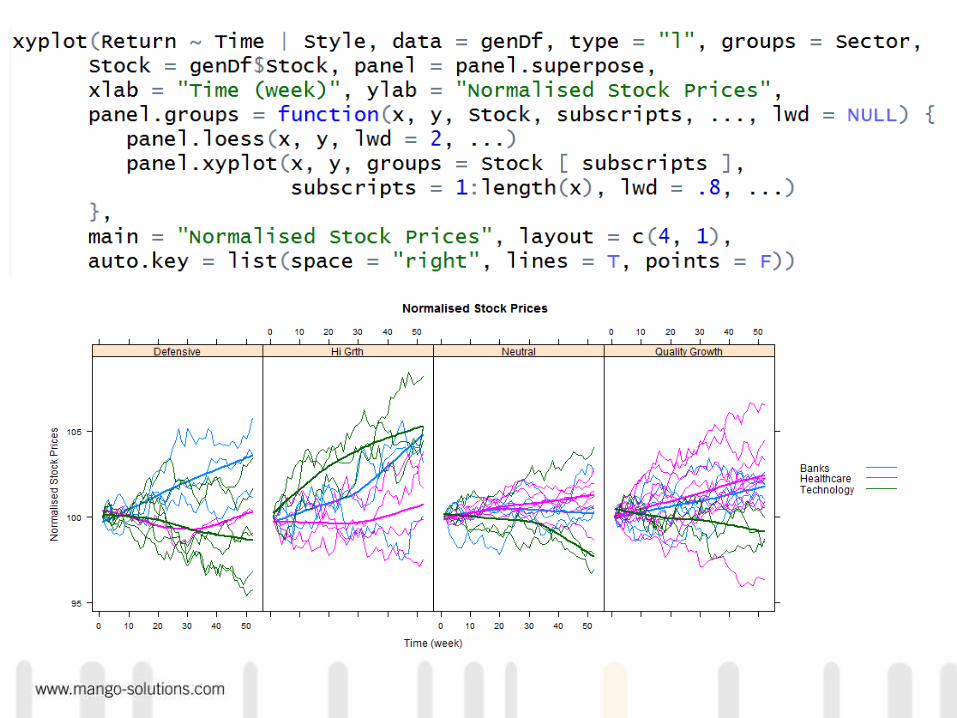
Plotting more than 1 group of data
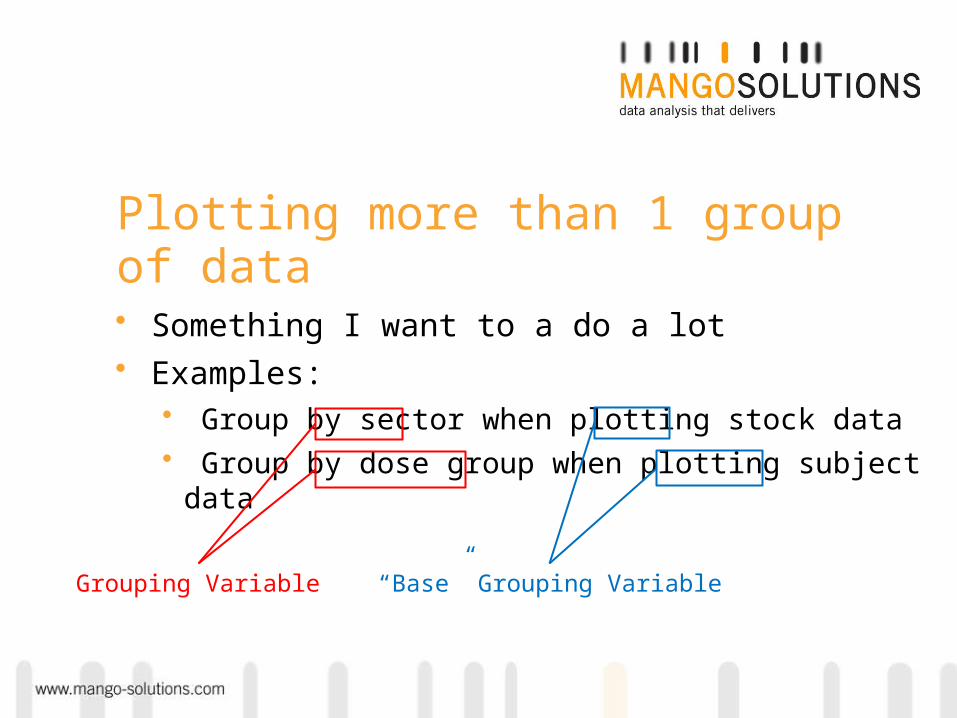
Plotting more than 1 group of data• Something I want to a do a lot• Examples:
• Group by sector when plotting stock data• Group by dose group when plotting subject data
Grouping Variable “Base” Grouping Variable


Summary

Summary
• Lattice is a great framework to use when your data is highly structured
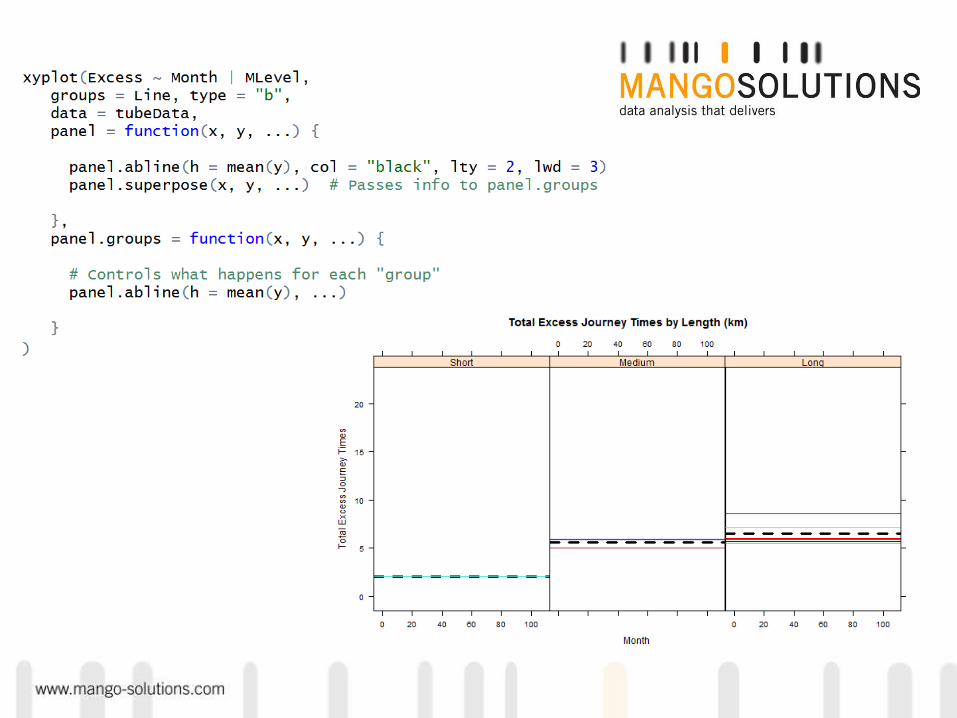
• We can use the “panel.groups” structure in order to ensure a “base” grouping variable is always taken into account
• Slides, Data and Scripts will be at LondonR.org soon

Questions?


