Page 1
USING LEAN TECHNIQUES TO REDUCE WASTE AND IMPROVE
PERFORMANCE IN MUNICIPAL CONSTRUCTION
PROJECT DELIVERY
by
YASIR E. ABDELRAZIG
Presented to the Faculty of the Graduate School of
The University of Texas at Arlington in Partial Fulfillment
of the Requirements
for the Degree of
MASTER OF SCIENCE IN CIVIL ENGINEERING
THE UNIVERSITY OF TEXAS AT ARLINGTON
May 2015
Page 2
ii
Copyright © by Yasir E. Abdelrazig 2015
All Rights Reserved
Page 3
iii
Acknowledgements
Though only my name appears on the cover of this thesis, a great many people
have contributed to its production. I owe my gratitude to all those people who have made
this thesis possible and because of whom my graduate experience has been one that I
will cherish forever.
My deepest gratitude is to my advisor, Dr. Mohammad Najafi, P.E., F. ASCE /
Director, Construction Engineering & Management at the University of Texas at Arlington.
I have been amazingly fortunate to have an advisor who gave me the freedom to explore
on my own and at the same time the guidance to recover when my steps faltered. He has
inspired me to become an independent researcher, and also to demonstrate what a
brilliant and hard-working engineer can accomplish.
I am very thankful to my thesis committee member, Dr. Mohsen Shahandashti,
Ph.D. and Dr. Mostafa Ghandehari, Ph.D. for taking the time out from their extremely
busy schedules for my thesis, and for their suggestions and recommendations.
I am also grateful to Aloysius Attach, P.E., President of the Construction Division
of the Institute of Industrial Engineers (IIE), founder and owner of MACVAL Associates,
LLC an engineering firm at Dallas, TX. I am extremely thankful and indebted to him for
sharing expertise, and sincere and valuable guidance and encouragement extended to
me.
I would like to express my gratitude to my mom for her love and support
throughout my life. Thank you for giving me strength to reach the stars and chase my
dreams. My wife, brothers, sisters, and friends deserve my wholehearted thanks as well.
April 15, 2015
Page 4
iv
Abstract
USING LEAN TECHNIQUES TO REDUCE WASTE AND IMPROVE
PERFORMANCE IN MUNICIPAL CONSTRUCTION
PROJECT DELIVERY
Yasir E. Abdelrazig, M.S.
The University of Texas at Arlington, 2015
Supervising Professor: Mohammad Najafi
The basic concepts of lean thinking in construction projects are to reduce waste,
improve communication, and promote teamwork integration through a common set of
tools and techniques. With increased demand for public works projects, there is a need to
focus attention on the efficient delivery of construction project services in the public
sector, and in particular, on municipal project delivery. Municipal projects are a part of the
public works which include a broad category of infrastructure projects, financed and
constructed by the local government, for uses in the greater community. Municipal
construction projects have special challenges that may differ from other construction
projects. These projects include a vast area and scatter around the city and local
government region. The objectives of this thesis are to analyze how lean construction
techniques improve performance and productivity in municipal project delivery, and
provide a new knowledge of how lean techniques can reduce non-physical waste related
to project delivery process. The scope of the thesis is limited to use of lean construction
techniques to overcome problems, facilitate project progress, and offer recommendations
for better municipal construction project processes. This study adapts and extends a non-
physical controllable waste classification using the Analytical Hierarchy Process (AHP).
Page 5
v
Utilizing AHP, this thesis determines a goal, identifies and categorizes the waste, and
takes the action by applying the appropriate lean techniques. A comparison-based survey
was conducted to quantify relative priorities for a given set of alternatives on a ratio scale
based on the judgment of the construction professionals’ experience. Through the AHP
approach, the thesis identified and prioritized parameters to reach the optimum goal of
waste reduction and performance improvement.
Page 6
vi
Table of Contents
Acknowledgements .............................................................................................................iii
Abstract .............................................................................................................................. iv
List of Illustrations ............................................................................................................... x
List of Tables ......................................................................................................................xii
Chapter 1 INTRODUCTION ................................................................................................ 1
1.1 Motivation ................................................................................................................. 2
1.2 Need Statement ........................................................................................................ 2
1.3 Thesis Statement and Question ............................................................................... 3
1.4 Thesis Objectives ..................................................................................................... 4
1.5 Thesis Methodology ................................................................................................. 6
1.6 Thesis Organization .................................................................................................. 7
1.7 Expected Outcome ................................................................................................... 8
1.8 Chapter Summary..................................................................................................... 8
Chapter 2 BACKGROUND AND LITERATURE REVIEW .................................................. 9
2.1 Municipal Construction Project Methods .................................................................. 9
2.1.1 Limitations in Traditional Construction Method ............................................... 10
2.1.2 Process Methodology in Traditional Construction Method .............................. 11
2.1.3 Limitations of Traditional Contracting Contracts ............................................. 12
2.1.4 Philosophical Differences between Lean Construction and
Traditional Construction .................................................................................. 12
2.2 Lean Construction................................................................................................... 13
2.2.1 Defining Lean Construction ............................................................................. 14
2.2.2 Lean Principles ................................................................................................ 14
2.2.3 Lean Construction Tools and Techniques ....................................................... 15
Page 7
vii
2.2.4 Systems Perspective of Lean .......................................................................... 15
2.2.5 Lean Construction Fundamentals and Opportunities ...................................... 17
2.3 Waste in Construction ............................................................................................ 18
2.3.1 Definition of Waste in Construction ................................................................. 18
2.3.2 Classification of Waste in Construction ........................................................... 19
2.3.3 Controllable Waste in Construction ................................................................. 19
2.3.4 Waste in Lean Construction Thinking ............................................................. 21
2.4 Information System and Communication ............................................................... 21
2.4.1 Communication Failures in Projects ................................................................ 22
2.4.2 Mutual Trust Relationships .............................................................................. 23
2.5 Productivity and Performance Measurement ......................................................... 24
2.6 Chapter Summary................................................................................................... 25
Chapter 3 RESEARCH METHODOLOGY ........................................................................ 26
3.1 Introduction ............................................................................................................. 26
3.2 Research Method ................................................................................................... 26
3.2.1 The Analytical Hierarchy Process (AHP) ........................................................ 26
3.2.2 The Basic Approach of AHP ............................................................................ 27
3.2.3 The AHP Method Procedures ......................................................................... 28
3.2.4 The Core of AHP Method ................................................................................ 28
3.2.5 The Advantages of the AHP Method ............................................................... 29
3.3 Research Approach ................................................................................................ 30
3.4 Construction Project Waste Classification .............................................................. 30
3.5 Research Survey .................................................................................................... 32
3.5.1 Survey Population and Techniques................................................................. 34
3.6 Chapter Summary................................................................................................... 35
Page 8
viii
Chapter 4 DATA ANALYSIS AND RESULTS ................................................................... 36
4.1 Data Collected ........................................................................................................ 36
4.1.1 Distribution of Survey Respondents ................................................................ 36
4.1.2 Perfection of Responses ................................................................................. 38
4.2 Data Analysis .......................................................................................................... 38
4.2.1 Preferences Analysis ....................................................................................... 38
4.2.2 Preferences Weighing ..................................................................................... 39
4.2.3 Comparison Matrix .......................................................................................... 41
4.2.4 Computation of Priorities ................................................................................. 42
4.2.5 Percent Ratio of Priorities and Results............................................................ 44
4.2.5.1 Level 1 ...................................................................................................... 44
4.2.5.2 Level 2 ...................................................................................................... 44
4.2.5.3 Level 3 ...................................................................................................... 45
4.3 Method Validation ................................................................................................... 50
4.3.1 Consistency Analysis ...................................................................................... 50
4.3.2 Consistency Measure ...................................................................................... 50
4.3.3 Consistency Index (C.I.) .................................................................................. 51
4.3.4 Random Index (R.I.) ........................................................................................ 52
4.3.5 Consistency Ratio (C.R.) ................................................................................. 52
4.3.6 Consistency Results ........................................................................................ 53
4.3.7 Consistency Adjustment .................................................................................. 53
4.4 Analysis of Results ................................................................................................. 58
4.5 Discussion of Results ............................................................................................. 58
4.6 Chapter Summary................................................................................................... 59
Page 9
ix
Chapter 5 CONCLUSION AND RECOMMENDATIONS FOR FURTURE
RESEARCH ...................................................................................................................... 61
5.1 Research Summary ................................................................................................ 61
5.2 Conclusions ............................................................................................................ 62
5.3 Limitations ............................................................................................................... 63
5.4 Recommendations for Implementation ................................................................... 63
5.5 Recommendations for Future Research ................................................................ 64
Appendix A RESEARCH SURVEY ................................................................................... 65
Appendix B DATA ANALYSIS .......................................................................................... 73
Appendix C DATA VALIDATION .................................................................................... 124
References ...................................................................................................................... 134
Biographical Information ................................................................................................. 136
Page 10
x
List of Illustrations
Figure 1.1 Thesis Statement ............................................................................................... 4
Figure 1.2 Thesis Objectives .............................................................................................. 6
Figure 1.3 The Overall Research Methodology .................................................................. 7
Figure 2.1 Design-Bid-Build Method ................................................................................. 10
Figure 2.2 Traditional Design-Bid-Build Construction Phases (Ahmed & Forbes, 2011) . 11
Figure 2.3 Serial Iteration Process .................................................................................... 12
Figure 2.4 Lean Concept of Integration System ............................................................... 13
Figure 2.5 Impact of Value-added vs. Non-value added Time in a Typical Construction
Process ............................................................................................................................. 16
Figure 2.6 Common Understanding of Project Information .............................................. 22
Figure 2.7 Construction Productivity in Decline (Stevens, 2014) ..................................... 25
Figure 3.1 Example of the Hierarchy Structure (Bunruamkaew, 2012) ............................ 27
Figure 3.2 The Advantages of the AHP Method (Saaty, 1982) ........................................ 29
Figure 3.3 Research Approach ......................................................................................... 30
Figure 3.4 The Decision-Making Problem into a Hierarchy of Criteria and Alternatives .. 33
Figure 3.5 Pair-wise Comparison Scale for AHP Preferences ......................................... 33
Figure 3.6 Pair-wise Comparison Matrix for Level 2 ......................................................... 34
Figure 4.1 Map of United States Depicting Areas of Survey Response ........................... 36
Figure 4.2 Distribution of Survey Respondents by Location ............................................. 37
Figure 4.3 Distribution of Survey Respondents by Sector ................................................ 37
Figure 4.4 Distribution of Survey Respondents by Position.............................................. 38
Figure 4.5 Preferences Analysis Example for Comparison 1.2 ........................................ 39
Figure 4.6 Weighing Scale ................................................................................................ 41
Figure 4.7 Level 1 Priority Rate ........................................................................................ 44
Page 11
xi
Figure 4.8 Level 2 Priority Rate ........................................................................................ 45
Figure 4.9 Supervision/Control Priority Rate..................................................................... 46
Figure 4.10 Decision-Making Priority Rate ....................................................................... 46
Figure 4.11 Quality Priority Rate ....................................................................................... 47
Figure 4.12 Resources Priority Rate ................................................................................. 47
Figure 4.13 Planning Priority Rate .................................................................................... 48
Figure 4.14 Method Priority Rate ...................................................................................... 49
Figure 4.15 Information Priority Rate ................................................................................ 49
Figure 4.16 Overall Analysis of Results ............................................................................ 58
Page 12
xii
List of Tables
Table 4.1 Pair-wise Comparison Scale (Saaty, 1980) ...................................................... 40
Table 4.2 Comparison Matrix for Level 2 .......................................................................... 41
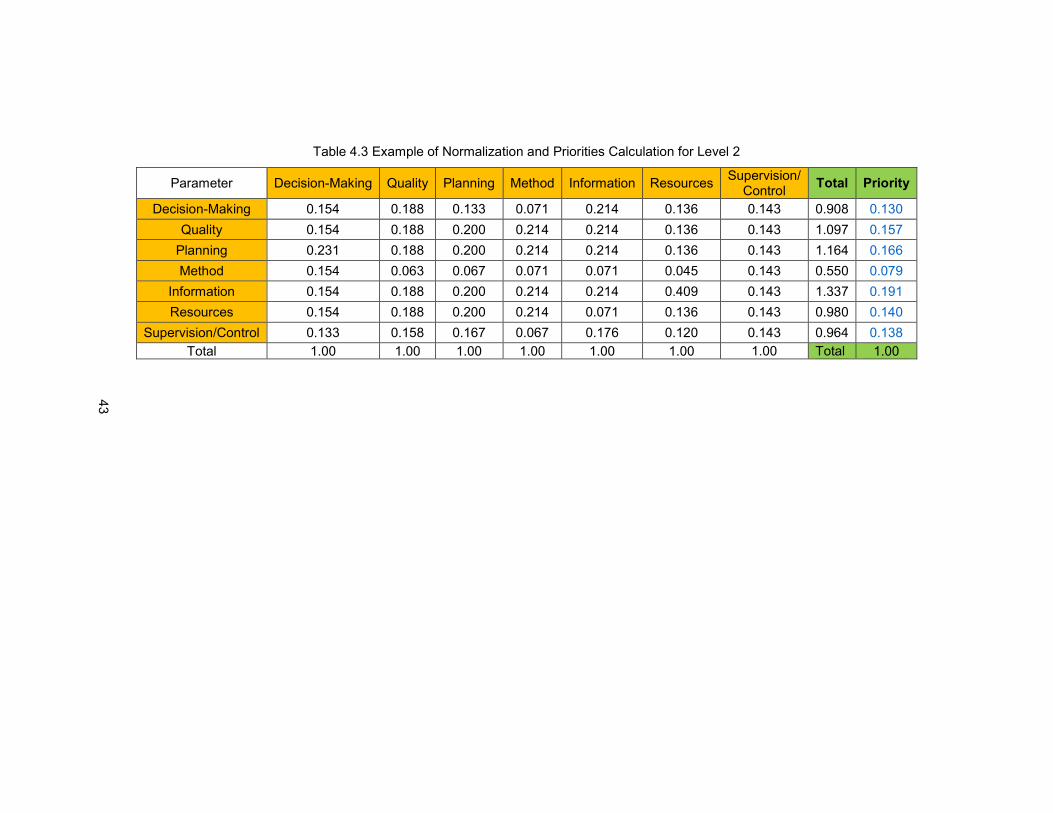
Table 4.3 Example of Normalization and Priorities Calculation for Level 2 ...................... 43
Table 4.4 Random Index Scale ......................................................................................... 52
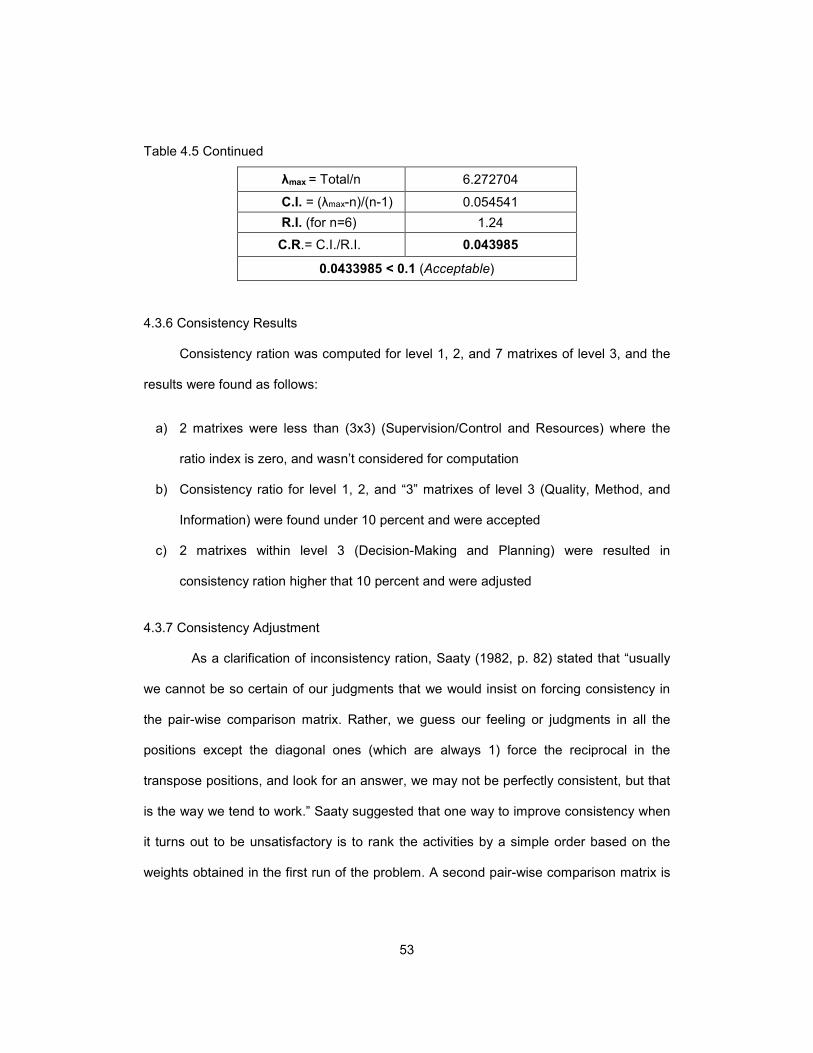
Table 4.5 Consistency Calculation for Level 2 .................................................................. 52
Table 4.6 Actual Result of Planning Matrix ....................................................................... 54
Table 4.7 Adjusted Result of Planning Matrix ................................................................... 55
Table 4.8 Actual Result of Decision-Making Matrix .......................................................... 56
Table 4.9 Adjusted Result of Decision-Making Matrix ...................................................... 57
Page 13
1
Chapter 1
INTRODUCTION
Reducing the time from start to delivery by eliminating the source of waste in the
work flow is one of the basic concepts of lean enterprise. In construction, lean techniques
are used to reduce waste and increase productivity. Lean enterprise is to achieve owner
expectations through the use of the absolute minimum amount of man, machine, and
material. This is achieved by continuous pursuit, identification and elimination of waste
through a systematic approach that relies on team-integration and effective
communication (Odomirok, 2015). Improper information and communication process in
the construction industry leads to change orders, rework, decreased constructability, cost
overruns, and delays, making it one of the biggest causes of waste, especially in the
public sector. The municipal construction projects is one of the sectors where
improvement is very much needed due to the frequent incompatibility and discrepancy
between the design information provided and the actual site conditions, especially for the
improvement and renovation projects in the old urban areas. To improve these projects,
the concept of lean techniques offers new insight into the dynamics of innovation and
provides a clear vision of what these projects are trying to achieve in regards to the
impact of the work method governing these projects. Some of the lean techniques used
in this thesis include, detection of incompatibility and discrepancy, look-ahead planning,
percentage of planned completed, root cause analysis, process evaluation, constraint
analysis, concurrent engineering, standardization of work process, and others that will be
defined later in the following chapters.
Page 14
2
1.1 Motivation
In August 2014, City of A (a City with 200,000 people in North Texas) decided to
suspend construction of a $600,000 project of a sidewalk, hardscaping1 and landscape
improvement in its downtown area due to improper design. The problem had arisen after
detection of incompatibility and discrepancy between the design information provided and
the site actual conditions. The poor level of communication between the three parties,
owner, designer, and contractor, contributed to the failure of the construction process and
led in project suspension.
The project appeared to be simple, but several constraints beyond the
contractor’s control had severely impacted the construction schedule and caused delays.
Initial issues with condition survey, drainage, gas line, old and deteriorated water pipe
leaks, underground electrical conduit, differing surface conditions, and restriction with
project sequencing due to limited access to shopping center parking areas all affected
construction efficiency, and impacted the construction activities.
This case is an example of the necessity for improvement with the information
and communication processes within traditional contract practices that are used in these
types of projects. Moreover, communicating with general contractors indicated similar
situations in previous projects within North Texas, which give these problems a
redundancy feature that might continue affecting contractors in similar projects in the
future.
1.2 Need Statement
As per Aziz and Hafez (2013), several partial studies from various countries have
confirmed that waste in the construction industry represents a relatively large percentage
1 The placement of non-plant elements such as fences, walkways, paving, and lighting in a planned outdoor
area (www.en.wikipedia.org).
Page 15
3
of production costs. Furthermore, they argued that “the existence of significant number of
waste types in the construction industry has depleted overall performance and
productivity in the industry, and certain serious measures have to be taken to rectify the
current situation.” Literature review investigation does not show specific research in
applying lean concepts in municipal project delivery. Furthermore, it shows similar
situations and issues facing the construction projects regarding this subject, and the
previous researchers acknowledged that improvement is needed, for example Jones
(2009), Hosseini et al. (2012), and Aziz & Hafez (2013).
1.3 Thesis Statement and Question
It is hypothesized that the implementation of lean techniques is directly related to
the improvement of performance and productivity in municipal construction projects. The
main purpose of lean techniques is to find the waste in each process and isolate them.
Waste does not improve the value; it only increases the cost, at the same time
decreasing the quality, productivity, and satisfaction of the project owner. Waste can be
removed by adequate planning, proper supervision, right decision making, quality
standards, accurate information and methods, better resource use, and effective
execution led by the construction team. Hence the careful elimination of waste leads,
foremost, to cost reductions and performance improvement. Generally, all the
construction companies aim for high quality projects, on-time, and within budget
completions. Construction companies implementing lean techniques in their work-sites
will have improved performance due to the inherent characteristics of lean construction.
These characteristics, such as the stabilization of work process, the use of
concurrent engineering2, and the last planer system3, encourage waste reduction in the
2 Parallel execution of various tasks by multidisciplinary project teams with equal goal and vision
Page 16
4
work process, an orderly work performance, and overall increased task predictability and
flow reliability. The research conducted for this thesis addresses the existing synergy
between the implementation of lean construction techniques and process practices and
how these results are prioritized to reduce waste and improve performance and
productivity. Figure 1.1 demonstrates the concept of research being applied in order to
eliminate the waste in the project process to reach better project outcome. From the left
to the right, eliminating the waste in the construction project process is possible through
adopting lean principles and using lean techniques to improve performance and obtain
better outcome.
1.4 Thesis Objectives
The key question this thesis presents is: How does the implementation of lean
techniques affect project performance? This question was further narrowed down into the
3 An effective methodology that advantageously improves workflow efficiency by stabilizing the workflow in
construction sites while protecting it from variability.
Figure 1.1 Thesis Statement
Page 17
5
following sub-questions: (a) what specific techniques and methods of lean construction
reduce waste and improve performance efforts? (b) what is the correlation, if any,
between the implementation of lean construction techniques, controllable waste, and
performance? And (c) what are the priorities and consistency measurements to evaluate
lean alternatives to find out the best criteria to attain their goal?
As a response to above questions and the construction problems previously
discussed, the objectives of this thesis are:
(1) To analyze how lean construction techniques improve performance and
productivity in municipal project delivery.
(2) To provide a new knowledge to the existing literature on the topic of how lean
techniques can reduce waste in municipal project delivery process.
(3) To gain a better understanding of the nature of information and communication
process between the construction firms and their clients through the eyes of
those directly involved in the industry.
Figure 1.2 demonstrates the thesis objective as a set of toothed wheels that work
together, where application of lean techniques clockwise will gear up to reduces the
waste counter-clockwise, which in turn drives up the wheel of performance and
productivity improvement in construction project process.
Page 18
6
1.5 Thesis Methodology
A research methodology approach known as The Analytic Hierarchy Process
(AHP) was applied in this thesis. AHP is a method for the mathematical treatment of
decision problems, and it is recommended for stakeholder’s decision-makers. This
research approach is utilized to prioritize lean techniques and how they reduce waste,
obtain required results, and look for continuous construction improvement. The thesis
methodology is conducted through the following steps:
1) Identify the waste associated with the municipal construction projects process
2) Specify waste in certain categories
3) Structure the decision factors in a hierarchy
4) Conduct survey of industry professionals
5) Analyze the data and discuss the results
Figure 1.3 illustrates the overall thesis methodology starting from the top left quarter
where problem observation sparks motivation. This helps to establish the given point of
departure in the next right quarter by reviewing the literature and determining the thesis
Figure 1.2 Thesis Objectives
Page 19
7
method. Research task followed in the bottom right quarter, and it was generated through
data collection, analysis and result. The methodology ends in the bottom left quarter as
predicted improvement outcome and recommendations offer for future research.
1.6 Thesis Organization
Chapter 1 presents background, motivation, need statement, research statement
and question, objective, methodology, and expected outcome of this thesis. Chapter 2
provides background and a literature review on the municipal project delivery methods,
lean construction, waste in construction, information system and communication, and
productivity and performance measurement. Chapter 3 outlines in details a methodology
behind this thesis by giving a step by step narrative on the research performed. Chapter
4 outlines results of the thesis. Chapter 5 draws conclusions and offers recommendations
for implementation and further research. References and appendices are provided at the
end of this thesis.
Figure 1.3 The Overall Research Methodology
Page 20
8
1.7 Expected Outcome
This thesis is expected to provide more efficient information on methods, better
communication processes, and to facilitate project team-integration by using lean
techniques. This integration will help entrepreneurs, owners, designers, and
stakeholders, especially in the municipal construction projects to reduce waste, increase
productivity, and open the door for more application in public work projects in the United
States. This research will discuss principles, methods, techniques, and implementation
phases of lean construction showing the waste in construction and how it could be
minimized. Improvements using lean techniques are considered to overcome these
problems and offer recommendation for better performance, improvement, and project
success.
1.8 Chapter Summary
Waste reduction in order to improve performance and productivity is one of the
basic concepts of lean thinking. A case sparks a concern of the necessity for
improvement with the construction delivery process within traditional method practices in
municipal construction project. The main research objective is to analyze how lean
construction techniques can improve performance and productivity in municipal project
delivery. Lean techniques provide a clear vision of what these projects are trying to
achieve in regards to the impact of the work method. The research method used in this
thesis will discuss principles, methods, techniques, and implementation phases of lean
construction showing the waste in construction. This chapter presented motivation, need
statement, objectives, methodology, and expected outcome for this thesis.
Page 21
9
Chapter 2
BACKGROUND AND LITERATURE REVIEW
Chapter one discussed the motivation behind the thesis, need statement,
objectives, methodology, and the expected outcome. This chapter provides background
and a literature review on the subject of improving performance and productivity in
municipal projects. It covers research that has been previously conducted on methods
used by municipal construction projects as well as lean construction, waste in
construction, productivity and performance measurement, and information system and
communication.
2.1 Municipal Construction Project Methods
Municipalities as a public work sector or local government have a variety of
choices in project delivery methods available for construction projects. Design-Bid-Build
(DBB), Design-Build (DB), Construction Manager at Risk (CMR), and Competitive Sealed
Proposal (CSP) are most often used on municipal construction projects. Public works
projects (as historically recognized in the United States) include public buildings
(municipal buildings, schools, hospitals), transport infrastructure (roads, railroads,
bridges, pipelines, canals, ports, airports), public spaces (public squares, parks,
beaches), public services (water supply, sewage, electrical grid, dams), and other,
usually long-term, physical assets and facilities. Maurer (2001) stated that “almost all of
its work is completed with the traditional design, bid and build mode used in municipal
engineering as required by state statute.” In addition, Ahmed and Forbes (2011) stated
the following:
“DBB has many well-known shortcomings: there is [a] greatly protected process
[for] programming, design, bidding and bid award, followed by construction.
Oftentimes, delay[s] further extend the [duration of project] and may result in cost
Page 22
10
inflation as the time extends. Litigation and dispute are very common with this
method of construction delivery because of dissonance between the expectations
of the three parties—owners, designers, and contractors. Furthermore, the lack
of communication and the fragility of the information process connecting all those
three parties during the construction phase result in frequent failure.” (p. 10)
Figure 2.1 illustrates the relationship between the parties involved in the Design-Bid-Build
process where the owner engages an engineer to prepare the design and presented to
contractors who bid for the work and possibly engage subcontractors to provide specialty
construction of the project (Hasan, 2010).
2.1.1 Limitations in Traditional Construction Method
The traditional Design-Bid-Build (DBB) method has been used by construction
industry for several decades. DBB requires an architectural consulting team to develop
the project documents for the owner, after which the owner sends the plans out for
competitive pricing from contractors and then selects a contractor to build the project. In
this case, the owner is at risk to contractor for design errors. Design and construction are
Figure 2.1 Design-Bid-Build Method
Page 23
11
sequential, typically resulting in longer schedules, and construction cost is unknown until
contract award. Figure 2.2 demonstrates the Design-Bid-Build construction phases from
top to bottom, where traditional project management is very limited in its ability to reduce
project variability.
2.1.2 Process Methodology in Traditional Construction Method
Figure 2.3 illustartes the serial iteration process in the manufacturing industry,
which depends on a methodical process from organization to organization until a project
is finally delivered. However, the construction industry follows the same process
methodology in its traditional delivery method in which organizational barriers (fences)
prevent contractor and designer relationships from developing. One result of this is that
errors usually are not detected until after the work has been passed on. In the end, this
process leads to costly rework. Although the project eventually gets delivered, the
process usually takes too long and costs too much, and the end project may be of
Figure 2.2 Traditional Design-Bid-Build Construction Phases (Ahmed & Forbes, 2011)
Page 24
12
questionable quality. Traditional project management also involves a culture of “pushing”
work assignment to subcontractors in order to meet the master schedule, whether or not
these procedures have all the needed resources to complete those assignments in the
given week (Ahmed and Forbes, 2011).
2.1.3 Limitations of Traditional Contracting Contracts
Traditional contracts have many disadvantages which need to be considered
upon selection. In Ahmed and Forbes (2011), the authors pointed to four systemic
problems presented by Matthew and Howell (2005) with traditional contracting that can
be addressed with a relational contracting approach: (1) Design ideas often lack field
input, (2) cooperation and innovation are inhibited, (3) planning systems are not
coordinated, and (4) self-preservation is the subcontractors’ mantra. Ahmed and Forbes
(2011) argued that “the traditional contracts provide little incentive for subcontractors to
collaborate or cooperate with each other, as each is driven by contract language to
selfishly focus on [timely] completion of their portion of the project within budget.”
2.1.4 Philosophical Differences between Lean Construction and Traditional Construction
The application of DBB and lean construction method in construction project
process is widely different, where each method emphasizes a specific performance
concept. According to Ahmed and Forbes (2011):
Figure 2.3 Serial Iteration Process
Page 25
13
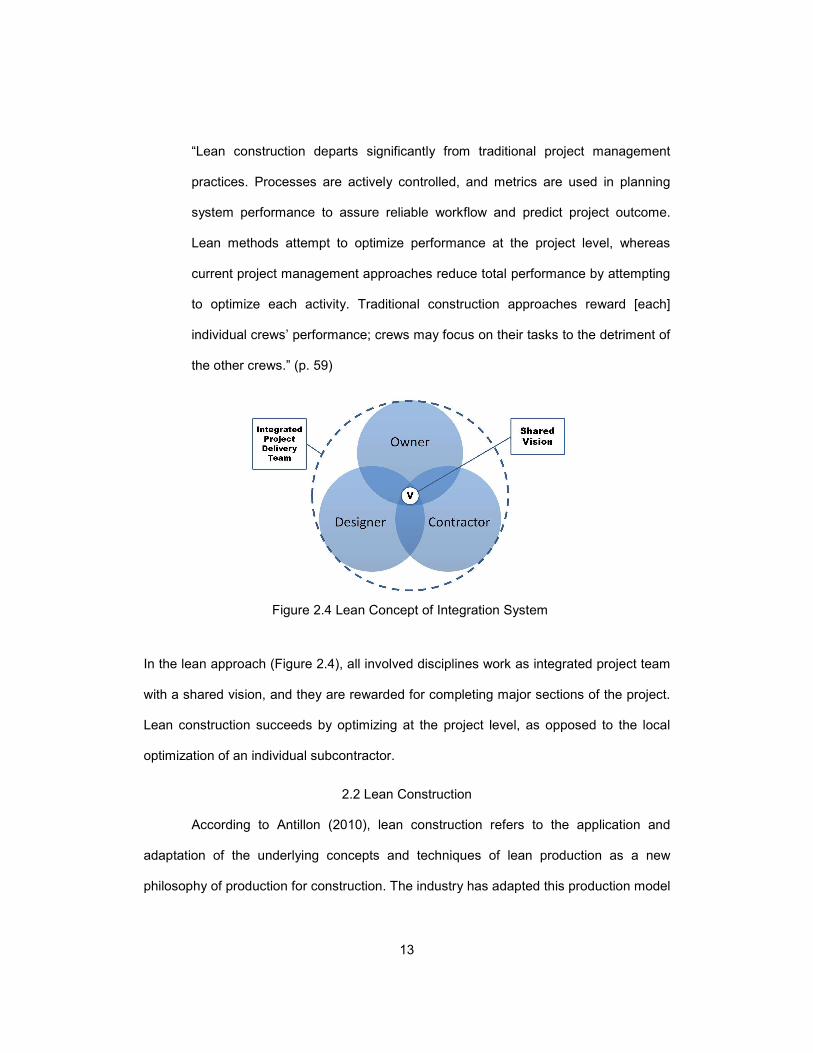
“Lean construction departs significantly from traditional project management
practices. Processes are actively controlled, and metrics are used in planning
system performance to assure reliable workflow and predict project outcome.
Lean methods attempt to optimize performance at the project level, whereas
current project management approaches reduce total performance by attempting
to optimize each activity. Traditional construction approaches reward [each]
individual crews’ performance; crews may focus on their tasks to the detriment of
the other crews.” (p. 59)
In the lean approach (Figure 2.4), all involved disciplines work as integrated project team
with a shared vision, and they are rewarded for completing major sections of the project.
Lean construction succeeds by optimizing at the project level, as opposed to the local
optimization of an individual subcontractor.
2.2 Lean Construction
According to Antillon (2010), lean construction refers to the application and
adaptation of the underlying concepts and techniques of lean production as a new
philosophy of production for construction. The industry has adapted this production model
Figure 2.4 Lean Concept of Integration System
Page 26
14
as a means for improving its performance and reducing the waste that tends to exist in
the construction industry. Lean production focuses on the reduction of waste, increase of
value to the owners, and continuous improvement. Several of these lean production
concepts and techniques have been successfully implemented in the construction
industry from which effective lean construction tools, such as the Last Planner System,
have been developed (Antillon, 2010).
2.2.1 Defining Lean Construction
Lean construction has been defined in several ways as the concept continues to
evolve. The Construction Industry Institute (CII) has defined lean construction as “the
continuous process of eliminating waste, meeting or exceeding all owner requirements,
focusing on the entire value stream, and pursuing perfection in the execution of a
constructed project” (CII Lean Principles in Construction Project Team, PT 191). As per
Ahmed and Forbes (2011), Koskela (2002) described lean construction as “a way to
design production systems to minimize waste of materials, time, and effort in order to
generate the maximum possible amount of value for the customer (both internal and
external).” (p. 45).
2.2.2 Lean Principles
Lean thinking has been summarized in the following five principles, which are the
core concepts of lean production as presented by Ahmed and Forbes (2011) according to
Womack and Jones (1996): (1) Precisely specify value by specific product, (2) Identify
the value stream for each, (3) Make value flow without interruptions, (4) Let the customer
pull value from the producer (use a pull logistic), and (5) Pursue perfection. As per
Antillon (2010), Womack and Jones (1996, p. 15) also concisely summarized these
principles of lean production in lean thinking in which the authors stated that “a lean way
of thinking allows companies to specify value, line up value-creating actions in the best
Page 27
15
sequence, conduct these activities without interruption whenever someone requests
them, and perform them more and more effectively.”
2.2.3 Lean Construction Tools and Techniques
Lean production has several tools and techniques that have evolved since the
beginning of it is application in the construction industry. These tools and techniques
continue to develope as more understanding and experience develops. Lean construction
has been identified as trying to develop a list of the most prominent and exhaustive tools
and techniques that are being implemented in today’s construction industry and that
might also impact performance practices. Some of the tools related to the topic of study
are: [Constraint analysis, look-ahead planning, the Percent Plan Complete (PPC)
measurement, concurrent engineering, just-in-time, resources managing, immediate
problem detection, standardization, detection of incompatibility and discrepancy, process
evaluation, team integration, use of visual indicators and continuous improvement]4. The
implementation of such lean tools and techniques had significantly reduced waste and
improved performance in construction projects.
2.2.4 Systems Perspective of Lean
The system perspective of lean, as presented by Ahmed and Forbes (2011),
stated that the time a product spends in a production system is an important measure of
efficiency. Figure 2.5 demonstrates the impact of value-added (process time) versus non-
value added time (move, wait, and setup time) in construction project activity.
Ahmed and Forbes listed three assumptions for the systems perspective of lean,
the cost of a product related to the length of time in the system, the shorter the time in the
4 These terms are defined in Appendix A, page 67 & 68.
Page 28
16
system, the better the producer can meet the owner’s delivery requirement, and the
shorter the time in the system, the smaller the probability of operational problems.
Ahmed and Forbes (2011) described the system components in four time zones,
move time, wait time, setup time, and process time, and they desribed it as follows:
“Move time represent the time required to move a product or service from one
work station to another or from a queue to a processing activity. Move time does
not add value. Wait time which is the sum of all phases in a system in which a
product or service is waiting to be transformed. Efficiency is negatively impacted
the longer the wait time, as it does not add value. This wait time is directly
influenced by such issues as equipment downtime, material shortages, and
unbalanced lines. Setup time is the time where preparations are made for a
process by adjusting equipment, material, procedures, and so forth in anticipation
of processing activities. No value is added in this phase. And finally process time
which is represent the only value-added phase; that is, the time a product is
actually undergoing transformation by equipment and/or operators. It is the sum
total of all processing activities.” (p. 63)
Figure 2.5 Impact of Value-added vs. Non-value added Time in a Typical Construction Process
Page 29
17
2.2.5 Lean Construction Fundamentals and Opportunities
The Construction Industry Institute (CII) identified five lean construction principles
in their study PT 191: (1) Customer focus, (2) culture and people, (3) workplace
organization and standardization, (4) elimination waste, and (5) continuous improvement
and built-in quality. Ahmed and Forbes (2011, p. 67) illustrated three connected
opportunities in design and construction projects as a foundation for lean construction
quoted as follows:
1) Impeccable coordination seeks to overcome the unpredictability that is typical of
traditional construction projects; lack of coordination results in an average of only
55% or fewer of promised tasks being completed in a specific week as promised.
Project success depends on the predictability of workflow that results when
commitments are met between various disciplines and trades involved in a
project.
2) Organizing projects as production systems align the roles of the parties in the
project to maximize overall performance. It emphasizes productions system
design to meet the owner’s value proposition; conversations between contractors
and designers inform the process of translating design to the built environment.
Project executions strategies take advantage of technology or best practices
such as prefabrication, modularization, and concurrent multi-trade coordination.
3) Projects are a collective enterprise. Aligning financial incentives with project-wide
optimization motivates project team members to adopt an investment mindset for
improving performance. Sharing resources avoids expensive duplication and
waste—the savings derived benefit both the team and the owner/client. Team
orientation and trust are essential for mobilizing creativity and reducing waste.
Page 30
18
2.3 Waste in Construction
Construction waste is normally described as physical construction waste
generated as a result of construction work. As per lean construction theory, there are
noticeable wastes in the construction processes which are named “non value-adding
activities or non-physical waste.” In recent decades, various methods are utilized in order
to reduce construction waste and mitigate its effects. Hosseini et al. (2012) argued that
“many research efforts have been done in order to classify construction waste according
to different attributes such as kind, quantity, [location, among others]. In spite of different
classifications, all of them follow the same basic concept.” Waste could be referred to
several connotations, and clarification of what intended in this research will be illustrated
in the following sections.
2.3.1 Definition of Waste in Construction
Waste was defined by researches in different ways in which it could be classified
and recognized. Excess materials, delays, rework and defects are some of those waste
commonly mentioned by researchers (Senaratne and Wijesiri, 2008). Hosseini et al.
(2012) stated that “Formoso et al. (2002) recommended a broader definition of waste to
include not only material waste, but also waste generated in a construction project such
as waiting times, transportation times, [and setup time].” This reveals the production of
non-physical waste within the construction processes, which is the basis of waste
concept adopted by lean construction approach and by this research as well. Koskela
(1992) also states that a systematic attempt for identifying waste in construction
processes (flow wastes in lean thinking terms) has not been done by the construction
management practitioners until the lean construction concept was introduced (Hosseini et
al., 2012).
Page 31
19
2.3.2 Classification of Waste in Construction
Formoso, et al. (1999) proposed the main classification of waste based on an
analysis of several Brazilian building sites; using the following categories:
Overproduction, substitution, waiting time, transportation, processing, inventories,
movement, production, and others. Overproduction was related to the production of a
quantity greater than required or earlier than necessary, while monetary referred to the
waste caused by the substitution of a material by a more expensive one (with
unnecessary better performance). Waiting time was related to the idle time caused by
lack of synchronization and leveling of material flows and pace of work by different
groups or equipment. Transportation was concerned with the internal movement of
materials on site, while processing was related to the nature of the processing
(conversion) activity which could only be avoided by changing construction technology.
On other hand, inventories was related to excessive or unnecessary inventories which
lead to material waste (by deterioration, losses due to inadequate stock conditions on
site, robbery, and vandalism) and monetary losses due to the capital that is tied up.
Movement was concerned with unnecessary or inefficient movements made by workers
during their job. Furthermore, Formoso et al. (1999) related the production of defective
products to the waste occurs when the final or intermediate product does not fit the
quality specifications, and other waste to any other nature than the previous ones, such
as burglary, vandalism, inclement weather, and accidents (Aziz and Hafez, 2013).
2.3.3 Controllable Waste in Construction
According to Aziz and Hafez (2013), a research by (Alarcon, 1994, 1997) divided
the controllable waste into three different activities as follows:
1) Controllable Causes Associated with Flows
a) Resources
Page 32
20
i) Materials: lack of materials at the work place; materials are not well distributed;
inadequate transportation means
ii) Equipment: non-availability; inefficient utilization; inadequate equipment for
work needs
iii) Labor: personal attitudes of workers; rebellion of workers
b) Information
i) Lack of information
ii) Poor information quality
iii) Timing of delivery is inadequate
2) Controllable Causes Associated with Conversions
a) Method
i) Deficient design of work crews
ii) Inadequate procedures
iii) Inadequate support to work activities
b) Planning
i) Lack of work space
ii) Too much people working in reduced space
iii) Poor work conditions
c) Quality
i) Poor execution of work
ii) Damages to work already finished
3) Controllable Causes Associated with Management Activities
a) Decision-Making
i) Poor allocation of work to labor
ii) Poor distribution of personnel
Page 33
21
b) Ineffective Supervision/Control: Poor or lack of supervision
2.3.4 Waste in Lean Construction Thinking
Lean thinking pay lots of attentions to the waste produced over a construction
process. Hosseini et al. (2012) argued that “although the construction industry witnesses
[a] noticeable share of waste in [the] construction process, effective practices for reducing
[this waste] are performed rarely.” However, lean construction thinking through a
consideration of an integrated view of production and shared vision, attempts to reveals
the importance in neglected concepts of designing and engineering in the construction
processes. Through their study of reinforcement operations of a six-floor building
construction, Hosseini et al. (2012) affirmed that there is great potentiality for such
principles in improving construction processes and also reducing waste generated during
these processes. Furthermore, they argued that the construction operations have a high
potential for optimizing efficiency through application of lean principles and simulation
which will finally lead to a drastic promotion in construction industry.
2.4 Information System and Communication
Each effective project team will proactively work towards identification of project
requirements while demonstrating the needs of planning and maintaining effective
communication, information, and collaboration. Ahmed and Forbes (2011) argued that:
“New approaches to construction management such as relational contracting and
lean design and construction are built on a foundation of team integration and
open sharing of project-related information. With the use of lean techniques and
relational contracting, it is possible to use improved information and
communication methods for potential problems and concerns and maintaining
the involvement of shareholders in a project, which is vital for project success.
Page 34
22
Thus, organizational leaders in the construction industry need to have a strong
foundation in information processing to effectively communicate.” (p. 203)
Furthermore, Jones (2009) presented an argument by Rowlinson and Cheung (2004) in
which the authors stated “the problem often occurs when information is not shared, or
misrepresented, and one of the many groups involved in a project is not aware of what is
taking place in other areas.” Figure 2.6 describes a crucial aspect of communications
among the project team members upon project starting where information is often missed
in the handoff.
2.4.1 Communication Failures in Projects
Communication in projects is a critical factor in a project’s success, and many
times, it fails if project team doesn’t communicate effectively during the construction
process. Cervone (2014) stated that:
“While communication failures in projects are caused by many factors, the project
team ultimately bears the burden for ensuring successful communication within a
project. The realm of mistakes that can be made related to communication is
Figure 2.6 Common Understanding of Project Information
(Adapted from businessballs, 2014)
Page 35
23
boundless. Too often, unsuccessful project communication is due to the project
team emphasizing communication status updates and expectations of project
participants in an outward, unidirectional manner.”
Furthermore, Cervone illustrated his argument by stating that “this manner of
communicating provides neither the project team nor the stakeholders with a complete
understanding of the issues and challenges within a project. It is rare for a stakeholder
group to have the same level or type of engagement with a project as does the project
team.” With emphasizing the mean of effective communication between project team and
their stakeholders, communication will generally lead to better outcomes and for overall
project success.
2.4.2 Mutual Trust Relationships
Many successful stakeholders’ relationship was built on trust, and thus played a
significant role in the project performance and success. Jones (2009) stated that there is
general agreement that the level of success in major projects is well below expectations
due to mistrust. A review of the construction industry and the interests of the stakeholders
can assist in alleviating this problem, especially from the viewpoint of trust. The exact
nature and extent of mistrust in the construction industry, as well as the role that an
improved information system and communication process might play in building trust,
have not been effectively recognized and developed. The result of Jones’ study indicates
that improving communications via information technologies offers potential for significant
improvement of industry efficiency and business attitudes between the major
stakeholders. Moreover, Ahmed and Forbes (2011) stated that “one of the explanations
for distrust [and/or] conflict between construction firms and clients may be the fault in the
integrative approach necessitating complex communication systems in the generation
and transfer of information required in construction projects.”
Page 36
24
2.5 Productivity and Performance Measurement
In June 2014, the National Society of Professional Engineers published a chart
created by Matt Stevens (University of Melbourne Senior Lecturer in Construction) with
data from the US Department of Labor and the US Bureau of Economic and Analysis,
showing construction productivity in decline (Figure 2.7). Stevens likewise found that,
with the exception of a productivity surge in 2008 and 2009, the construction industry’s
productivity is in decline, lower now than it was in 1993. Stevens (2014) argued that
“Generally, the negative changes over the last three decades have outpaced the positive
changes. Lack of consistent engagement by construction project stakeholders to each
other has made project information flow unevenly, causing chaos. The contracts continue
to be draconian, so each party acts with as much legal insulation as possible.” This
declination in productivity sparks the necessity for more improvement efforts and
measurement. Productivity and performance measurement provide a foundation for
improving design and construction delivery, regardless of the methods utilized in each
respective project. This foundation is especially helpful with lean construction methods,
as they are based on a culture of learning and continuous improvement (Ahmed and
Forbes, 2011).
To improve the implementation of lean construction, Aziz and Hafez (2013)
stated that “Miller et al. (2002) proposed the harmonization between main contractors
and subcontractors as a prerequisite, while Thomas et al. (2004) proposed reducing
variability to improve performance and labor flow reliability for better productivity
presented as lean construction principles.”
Page 37
25
2.6 Chapter Summary
This chapter provided a literature review of several aspects related to the
research objectives. These aspects include the traditional delivery method of municipal
project, lean construction, waste definition and classification, and measurement of
construction productivity. Moreover, the literature review demonstrated the significant role
of the information system and communication to improve construction process.
Figure 2.7 Construction Productivity in Decline (Stevens, 2014)
Page 38
26
Chapter 3
RESEARCH METHODOLOGY
Chapter 2 provided backgrounds and literature review covering several aspects
of the thesis objective. This chapter presents the research methodology, which includes
method, approach, and survey used in this thesis.
3.1 Introduction
A research approach known as a The Analytic Hierarchy Process (AHP) was
applied in this thesis. The research identified a group of controllable waste associated
with the municipal construction project process. A controllable waste classification
presented by Aziz and Hafez (2013) presented by Alarcon (1994, 1997) has been
adapted and extended, and lean techniques have been hypothesized to develop
significant improvement upon application. To further gather data on the application of
lean techniques, the decision factors were structured in a hierarchy, and a survey was
sent to industry professionals. AHP process was then applied and analyzed to prioritize
these techniques in each level of the process in order to examine the relationship
between lean construction techniques and its objective.
3.2 Research Method
3.2.1 The Analytical Hierarchy Process (AHP)
The Analytical Hierarchy Process (AHP) is a decision-aiding method aimed at
quantifying relative priorities for a given set of alternatives on a ratio scale, based on the
judgment of the decision-maker, and stresses the importance of the intuitive judgments of
a decision-maker as well as the consistency of the comparison of alternatives in the
decision-making process (Saaty, 1980). As per Perera and Sutrisna (2011), AHP
philosophy is based on the intention to provide a comprehensive and rational framework
for structuring a decision problem, for representing and quantifying its elements, for
Page 39
27
relating those elements to overall goals, and for evaluating alternative solutions. It is
based on mathematics and psychology, but more specifically matrixes and processes.
Also, AHP is a ‘normative’ model of decision making. Opposed to a ‘descriptive’ model
which allows for describing the way a decision-makers actually makes decision, a
normative model enables a decision-maker to defend his choice over competing
alternatives in specific steps. Figure 3.1 shows decompose of a decision-making problem
into a hierarchy of criteria and alternatives. On the top is the goal of the analysis. Level 1
is multi-criteria that consist of several criterions; also several other levels of sub-criteria
could be added, and the last level is the alternative choices.
3.2.2 The Basic Approach of AHP
Saaty (1982) stated that the fundamental problem of decision theory is how to
derive weights for a set of activities according to importance. Importance is usually
judged by several criteria that may be shared by some or all of the activities. Weighing of
activities with respect to importance is a process of multi-criterion decision making. The
objective of this approach is to use the weights, also known as priorities, to allocate a
resource among the activities, or if precise weights cannot be obtained, to simply
implement the most important activities by rank. The problem then, is to find the relative
Figure 3.1 Example of the Hierarchy Structure (Bunruamkaew, 2012)
Page 40
28
strength or priority of each activity with respect to each objective and then compose the
results to obtain a single overall priority for all the activities. Frequently, the objectives
themselves must be prioritized or ranked in terms of yet another set of higher-level
objectives. These priorities are then used as weighted factors for the priorities derived for
the activities.
3.2.3 The AHP Method Procedures
The basic steps in determining a solution for problem solving using AHP are
summarized by Goepel (2013) it in the following steps:
(1) Define the goal of the decision – what do I want to decide, for what purpose, and
what are my alternatives?
(2) Structure the decision problem in a hierarchy – what are the categories and
criteria that Figure into my decision?
(3) Pair comparison of criteria in each category – e.g., blue or green? Which do I
prefer, and by how much do I prefer one or the other color?
(4) Calculate the priorities and a consistency index – were my comparisons logical
and consistent?
(5) Evaluate alternatives according to the priorities identified – what alternative
optimum solution is there to the decision problem?
3.2.4 The Core of AHP Method
As per Goepel (2013), the core of AHP is the comparison of pairs instead of
sorting (ranking), voting (assigning points), or the free assignment of priorities. Validation
of the method in practical testing shows surprisingly good agreement with actual
measured values. Furthermore, Goepel (2013) stated that “AHP has been used
successfully in many institutions and companies. One of AHP’s great advantages is the
ability to use it for group decisions in which all participants evaluate pairs and the group
Page 41
29
result is mathematically determined as the optimum consensus. In practice the solutions
arrived at by the method are well accepted since the results are objective and free of
political influence.”
3.2.5 The Advantages of the AHP Method
Figure 3.2 illustrates a summarization of the advantages of the AHP method as
presented by Saaty (1982).
Figure 3.2 The Advantages of the AHP Method (Saaty, 1982)
Page 42
30
3.3 Research Approach
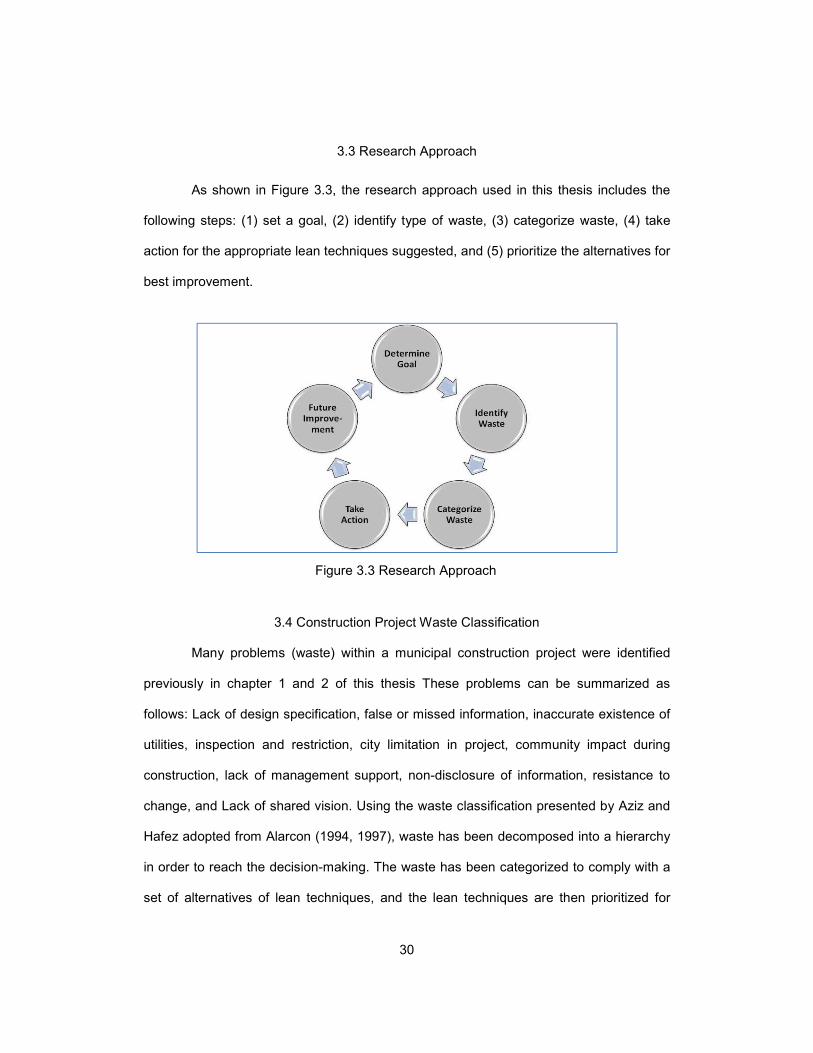
As shown in Figure 3.3, the research approach used in this thesis includes the
following steps: (1) set a goal, (2) identify type of waste, (3) categorize waste, (4) take
action for the appropriate lean techniques suggested, and (5) prioritize the alternatives for
best improvement.
3.4 Construction Project Waste Classification
Many problems (waste) within a municipal construction project were identified
previously in chapter 1 and 2 of this thesis These problems can be summarized as
follows: Lack of design specification, false or missed information, inaccurate existence of
utilities, inspection and restriction, city limitation in project, community impact during
construction, lack of management support, non-disclosure of information, resistance to
change, and Lack of shared vision. Using the waste classification presented by Aziz and
Hafez adopted from Alarcon (1994, 1997), waste has been decomposed into a hierarchy
in order to reach the decision-making. The waste has been categorized to comply with a
set of alternatives of lean techniques, and the lean techniques are then prioritized for
Figure 3.3 Research Approach
Page 43
31
decision-making. The waste categorization and lean techniques application could be
described as follows:
1) Controllable Causes Associated with Flows include:
(a) Resources; could be improved by:
(i) Resources availability
(ii) Resources leveling
(b) Information; could be improved by:
(iii) Accurate information
(iv) Clear specifications
(v) Effective communication
(vi) Detection of incompatibility and discrepancy
2) Controllable Causes Associated with Conversions include:
(a) Method; could be improved by:
(i) Team integration
(ii) Concurrent engineering
(iii) Standardization of work process
(b) Planning; could be improved by:
(i) Constraint analysis
(ii) Root cause analysis
(iii) Look-ahead planning
(iv) Percentage of planned completed
(c) Quality; could be improved by:
(i) Process evaluation
(ii) Immediate problem detection
(iii) Systematic procedures
Page 44
32
(iv) Inspection and enforcement
2) Controllable Causes Associated with Management Activities include:
(a) Decision-Making; could be improved by:
(i) Use of visual indicators
(ii) Take decisions slowly, implement them quickly
(iii) Take decision at construction site
(b) Ineffective Supervision/Control; could be improved by:
(i) Management support
(ii) Transparency
Figure 3.4 demonstrates the decision-making problem as a hierarchy of criteria
and alternatives. On top is the goal that each level works toward reaching in the
municipal construction project. Level 1 illustrates the categories of controllable waste,
while level 2 shows the sub-level of the controllable waste, and level 3 shows where
implementation of lean techniques were considered for improving performance and
productivity.
3.5 Research Survey
The survey was conducted based on comparison that relies upon AHP for its
methodology. The survey objective is to quantify relative priorities for a given set of
factors and alternatives on a ratio scale, based on the judgment of the construction
professionals’ experience. A pair-wise comparison matrix has been constructed for all
elements within the same level, and for each of the lower levels with one matrix for each
element in the level immediately above. The pair-wise comparisons are done in terms of
which element dominates the other using the relative scale measurement shown in
Figure 3.5.
Page 45
33
Level of Preference of Each Factor
1. Significantly Less Important
2. Less Important
3. Equally Important
4. More Important
5. Significantly More Important
Figure 3.5 Pair-wise Comparison Scale for AHP Preferences
For more understanding of the main concept of the various parameters, a table of
definitions has been attached in the survey. A description of these definitions is shown in
Appendix A.
Figure 3.4 The Decision-Making Problem into a Hierarchy of Criteria and Alternatives
Page 46
34
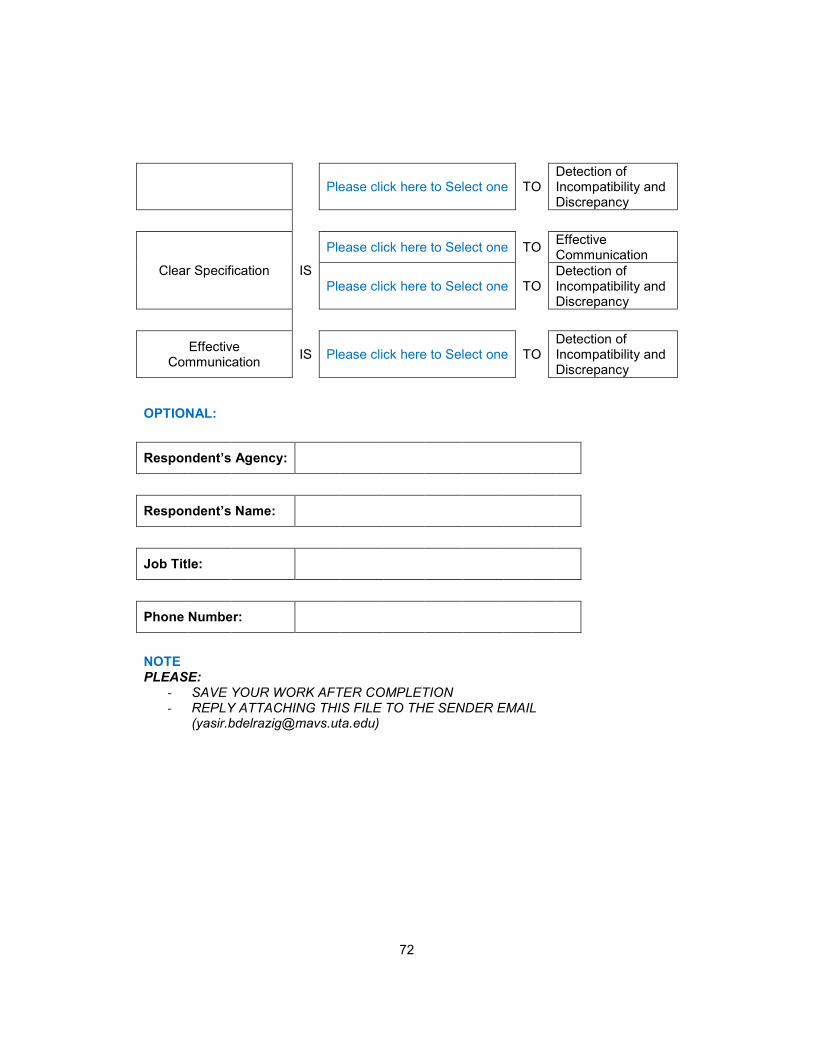
Figure 3.6 provides an example of the survey where pair-wise comparison matrix
constructed for all elements within level 2.
3.5.1 Survey Population and Techniques
The survey was sent to construction professionals who were actively engaged in a
major public construction project. Geographically, the survey attempted to focus in Texas
entities as a targeted region, and to include both private and public sectors. The survey
was selected to be in standardized format and targeting decision-makers
(Directors/Principals), Process Managers (Project Managers/Engineers), and related
Disciplines. The fact that all participants received the survey in the same manner was an
Figure 3.6 Pair-wise Comparison Matrix for Level 2
Page 47
35
important aspect for the standardization of research methods. The survey targeted more
than 300 participants, and they were picked in accordance to their participation in public
work or local government projects in Texas. The reason for choosing Texas construction
professionals was because of familiarity with the Texas municipal projects and
involvement of survey respondents with these projects. Although the majority of survey
respondents were from Texas, the result is generic and can be applied to other states.
However, only 18 responded and 2 were found to be relocated out of Texas at the time of
the survey sent, and were included in the survey analysis since they were familiar with
the municipal’s construction project method. The survey was emailed to the participants
in an excel file format in such a way that it was easy for the participants to select out their
responses. Once the participants had selected out their responses, the participants were
able to email their responses back to the sender for archival and analysis.
3.6 Chapter Summary
A decision-making method quantifying relative priorities for a given set of
alternatives was used in this thesis. The Analytical Hierarchy Process (AHP) provides a
comprehensive and rational framework for structuring a decision problem, representing
and quantifying its elements, relating those elements to overall goals, and for evaluating
alternative solutions. This research approach determined a goal, categorized the waste,
and took into action by applying the appropriate lean techniques. A comparison-based
survey was conducted to quantify relative priorities for a given set of alternatives on a
ratio scale based on the judgment of the construction professionals’ experience.
Page 48
36
Chapter 4
DATA ANALYSIS AND RESULTS
Chapter 3 discussed the research methodology, method, approach, and survey
used in this thesis. This chapter demonstrates data collection process, analysis,
validation, and the final results obtained. This chapter explains utilization of AHP method
and presents the results of this thesis.
4.1 Data Collected
4.1.1 Distribution of Survey Respondents
The Data from the 18 respondents of the survey were analyzed according to the
location (In Texas/Other States), sector (Private/Public), and position (Director/Principal,
Project Manager/Engineer, and Others) as illustrated in Figure 4.1, 4.2, 4.3, and 4.4
respectively.
Figure 4.1 Map of United States Depicting Areas of Survey Response
Page 49
37
Figure 4.2 Distribution of Survey Respondents by Location
Based on 18 Respondents
Figure 4.3 Distribution of Survey Respondents by Sector
Based on 18 Respondents
Page 50
38
4.1.2 Perfection of Responses
There were 50 comparison questions included in the survey with response rate of
96.3%. The responses were received within 3 weeks from the date of sending.
4.2 Data Analysis
4.2.1 Preferences Analysis
To evaluate the pair-wise comparison questions judged by the construction
professionals’ experience, first the most dominant preference has to be determined for
every pair-wise in each level. Figure 4.5 shows an example for comparison 1.2
preferences analysis. Appendix B illustrates the preferences calculations and results for
all 50 pair-wise comparisons used in this research.
Figure 4.4 Distribution of Survey Respondents by Position
Based on 18 Respondents
Page 51
39
Comparison 1.2
Controllable Waste Associated with Management Activities Vs.
Controllable Waste Associated with Flows
Total responses 16 Out of 18 Response rate 88.89%
Level of Preference Quantity
% of Total % of Answered
1. Significantly Less Important 0 0.00% 0.00%
2. Less Important 3 16.67% 18.75%
3. Equally Important 7 38.89% 43.75%
4. More Important 4 22.22% 25.00%
5. Significantly More Important 2 11.11% 12.50%
16 1
Figure 4.5 Preferences Analysis Example for Comparison 1.2
4.2.2 Preferences Weighing
According to Saaty (2009) “the fundamental scale of the AHP is a scale of
absolute numbers used to answer the basic question in all pair wise comparisons: how
many times more dominant is one element than the other with respect to a certain
criterion or attribute?” Based on this principle, to obtain the set of overall priorities for a
decision problem, synthesize the judgment was made in the pair-wise comparison.
However, following this synthesis, the data is weighed and added in order to give a single
43.8%25.0% 18.8% 12.5%
0.0%0.0%
20.0%
40.0%
60.0%
3. Equally
Important
4. More
Important
2. Less Important 5. Significantly
More Important
1. Significantly
Less Important
Controllable Waste Associated with Management Activities Vs
Controllable Waste Associated with Flows
% of Answered
Page 52
40
number to indicate the priority of each element. Saaty (1980, p. 54) based the pair-wise
comparison on a scale of 1 to 9 as per the definition of weights given in Table 4.1.
Table 4.1 Pair-wise Comparison Scale (Saaty, 1980)
Weight Definition Explanation
1 Equal importance
Two activities contribute equally to the objective
3 Weak importance of one over another
Experience and judgment slightly favor one activity over another
5 Essential or strong importance
Experience and judgment strongly favor one activity over another
7 Very strong or demonstrated importance
An activity is favored very strongly over another; its dominance demonstrated in practice
9 Absolute importance
The evidence favoring one activity over another is of the highest possible order of affirmation
2, 4, 6, 8 Intermediate values between the two adjacent scale values
When compromise is needed
Reciprocals of above nonzero
If factor i has one of the above nonzero numbers assigned to it when compared to factor j, then j has the reciprocal value when compared with i
A reasonable assumption
Rationales Ratios arising from the scale
If consistency were to be forced by obtaining n numerical values to span the matrix
Page 53
41
Suggested numbers expressing the degree of preference or importance as
assigned by participants was established in the matrix for each level within the hierarchy.
Figure 4.6 shows the weight scale suggested and the way it was applied for each
preference.
Figure 4.6 Weighing Scale
4.2.3 Comparison Matrix
To evaluate the pair-wise comparison, a comparison matrix was created for all
levels of the hierarchy (level 1, 2, and 3). Figure 4.5 illustrated the matrix for level 2 as an
example, where the remaining matrixes and calculations for the research were illustrated
in Appendix C.
Table 4.2 Comparison Matrix for Level 2
Parameter Decision-Making
Quality Planning Method Information Resources Supervision/
Control Decision-Making
1 1 0.667 1 1 1 1
Quality 1 1 1 3 1 1 1
Planning 1/3 1 1 3 1 1 1
Method 1 1/3 1/3 1 1/3 1/3 1
Information 1 1 1 1/3 1 3 1
Resources 1 1 1 1/3 1/3 1 1
Supervision/ Control
1 1 1 1 1 1 1
Total 6.499 5.333 5.000 14.006 4.666 7.333 7.000
The matrix was established by making rows and columns to have the same
parameters. For example, if the first row is Decision-Making, the first column is also
Decision-Making; if the second row is Quality, the second column is also Quality. The
matrix was arranged and a score range of 1 to 9 was selected and allocated, where a
Page 54
42
maximum score implies that the row is more important than the column. The diagonal of
the matrix was allocated at a score of 1. Proceeding column-wise, the value in the
corresponding column just below the diagonal is reciprocal of the scores in the
corresponding row. Likewise all the columns were calculated and added to arrive at the
total.
4.2.4 Computation of Priorities
To compute the priorities, scores were normalized first. This step is to normalize
the matrix by totaling the numbers in each column. Each entry in the column is then
divided by the column sum to yield its normalized score. The sum of each column is 1.
The mathematical normalization steps can be summarized as follows:
For the matrix of pair-wise elements:
��11 �12 �13�21 �22 �23�31 �32 �33� 1) Sum the values in each column of the pair-wise matrix
C ij = � � = 1 = C ij 2) Divide each element in the matrix by its column total to generate a normalized pair-
wise matrix
X ij = � ��∑ � ������ ��11 �12 �13�21 �22 �23�31 �32 �33�
3) Divide the sum of the normalized column of matrix by the number of criteria used
(n) to generate weighted matrix
W ij = ∑ � ������ ��11�21�31�
Table 4.3 illustrates an example for normalization and priorities calculation for level 2.
Page 55
43
Table 4.3 Example of Normalization and Priorities Calculation for Level 2
Parameter Decision-Making Quality Planning Method Information Resources Supervision/
Control Total Priority
Decision-Making 0.154 0.188 0.133 0.071 0.214 0.136 0.143 0.908 0.130
Quality 0.154 0.188 0.200 0.214 0.214 0.136 0.143 1.097 0.157
Planning 0.231 0.188 0.200 0.214 0.214 0.136 0.143 1.164 0.166
Method 0.154 0.063 0.067 0.071 0.071 0.045 0.143 0.550 0.079
Information 0.154 0.188 0.200 0.214 0.214 0.409 0.143 1.337 0.191
Resources 0.154 0.188 0.200 0.214 0.071 0.136 0.143 0.980 0.140
Supervision/Control 0.133 0.158 0.167 0.067 0.176 0.120 0.143 0.964 0.138
Total 1.00 1.00 1.00 1.00 1.00 1.00 1.00 Total 1.00
Page 56
44
4.2.5 Percent Ratio of Priorities and Results
Through normalization and computation of all matrix scores in each level,
prioritization was achieved. The obtained result could be discussed as follows:
4.2.5.1 Level 1
As shown in Figure 4.7, through comparing the three level factors to each other,
the result demonstrates that Management Activities and Flows have the same priority
level with 43%, while Conversion has a priority of 14%. This result very much supports
lean construction principles where management activities and process flows have a
significant impact over the project performance.
4.2.5.2 Level 2
Figure 4.8 illustrates the priorities of level 2, where Information obtained the most
importance rate with 19.1%, followed by Planning with 16.6%, Quality 15.7%, Resources
14%, Supervision/Control 13.8%, Decision-Making 13%, and Method with 7.9%. The
construction professionals rated Information as the most important factor among the
Figure 4.7 Level 1 Priority Rate
Page 57
45
other level’s factors to achieving the superior-goal (Level 1). These results confirm the
significant contributing role of Information in project performance and productivity.
4.2.5.3 Level 3
Level 3 represents the sub of level 2, where each element in level 2 was
factored, and all the factors within each sub level were compared to each other. Priorities
in this level were illustrated as follows:
1) Supervision/Control:
As Shown in Figure 4.9, two factors were compared to each other, Management
Support and Transparency. Result demonstrates that both factors have the same
level of importance, and they could be considered even.
Figure 4.8 Level 2 Priority Rate
Page 58
46
2) Decision-Making
Three factors were evaluated and compared under this element. Decision at
Construction Site found to be more priorities with 49%, Taking Decision Slowly and
Implement them Quickly comes next with 31%, and the Use of Visual Indicators has
the least rate with 20% (Figure 4.10).
Figure 4.9 Supervision/Control Priority Rate
Figure 4.10 Decision-Making Priority Rate
Page 59
47
3) Quality
Immediate Problem Detection was found dominant with 32%, Process Evaluation
was next with rates of 29% followed by Inspection and Enforcement with 20%, and
Systematic Procedures last with a rate of 19% (Figure 4.11).
Figure 4.11 Quality Priority Rate
Figure 4.12 Resources Priority Rate
Page 60
48
4) Resources
Resources have two factors compared to each other. Resources Availability with a
rate of 75% has more priority than Resources Leveling with 25% (Figure 4.12).
5) Planning
Among four factors compared to each other, Look-ahead Planning was first with a
rate of 34%. Root Cause Analysis, Constraint Analysis, and Percentage of Planned
Completed were next with rate of 29%, 24%, and 14% respectively (Figure 4.13).
6) Method
Method’s factors shared their priorities evenly, and each one obtained a rate of
33%. These results reflect the role of method elements and its equal importance in
the project process (Figure 4.14).
Figure 4.13 Planning Priority Rate
Page 61
49
7) Information
Information has four factors compared to each other. Clear Specification and
Effective Communication were shared the most priority rates with 31% each.
Accurate Information was next with 24%, and Detection of Incompatibility and
Discrepancy were last with a rate of 14% (Figure 4.15).
Figure 4.14 Method Priority Rate
Figure 4.15 Information Priority Rate
Page 62
50
4.3 Method Validation
To validate the results and methods used in these decision-making problems, it
is important to know how good its consistency is. The importance of this step is to not
base the decision on judgments that have such low consistency that they appear to be
random.
4.3.1 Consistency Analysis
As per Saaty (1980), consistency means that “when we have a basic amount of
row data, all other data can be logically deduced from it. In doing pair-wise comparison to
relate n activities so that each one is represented in the data at least once, we do n-1
pair-wise comparison judgments. From them all other judgments can be deduced simply
by using the following kind of relation.” Consistency could be computed by calculating the
consistency measure, index, and ratio for each level comparison.
4.3.2 Consistency Measure
Decision accuracy refers to the extent to which classifications based on test
scores match those that would have been made if the scores did not contain any
measurement error. Accuracy must be estimated because errorless test scores do not
exist. As per Saaty (1980), “to get a crude estimate of consistency, we multiply the matrix
of comparisons on the right by the estimated solution vector obtaining a new vector5. If
we divide the first components of this vector by the first component of the estimated
solution vector, the second component of the new vector by the second component of the
estimated solution vector and so on, we obtain another vector. If we take the some of the
components of this vector and divide by the number of components we have an
5 Matrix consisting of one row or one column is called vector.
Page 63
51
approximation to a number λmax to use in estimating the consistency as reflected in the
proportionality of preferences.” The following steps illustrate the estimation process:
a) Consistency Vector was calculated by multiplying the pair-wise matrix by the weights
vector
��11 �12 �13�21 �22 �23�31 �32 �33� x ��11�21�31� = ���11��21��31�
b) Then it was accomplished by dividing the weighted sum vector with criterion weight
Cv11 = 1�11 ��11�11 + �12�21 + �13�31� Cv21 = 1�21 ��21�11 + �22�21 + �23�31� Cv31 = 1�31 ��31�11 + �32�21 + �33�31�
c) λ was calculated by averaging the value of the Consistency Vector
λ = � � = 1 Cv ij
4.3.3 Consistency Index (C.I.)
Deviation from consistency called Consistency Index and can be calculated using
the following steps:
a) Multiply each column of the pair-wise comparison matrix by the corresponding
weight
b) Divide sum of the row entries by the corresponding weight
c) Compute the average of the values from step b, denote it by λmax
d) The approximate CI is:
( max − )( − 1)
Page 64
52
4.3.4 Random Index (R.I.)
The consistency index of a randomly generated reciprocal matrix from the scale
1 to 9, with reciprocal forced called Random Index (R.I.) (Saaty, 1980). An average of R.I.
for matrixes of order 1-15 using a sample size of 100 was generated by Oak Ridge
National Laboratory used in this research as presented by Saaty. Table 4.4 gives the
order of the matrix (first row) and the average R.I. (second row) determined as described
above.
Table 4.4 Random Index Scale
1 2 3 4 5 6 7 8 9 10 11 12 13 14 15
0.00 0.00 0.58 0.90 1.12 1.24 1.32 1.41 1.45 1.49 1.51 1.48 1.56 1.57 1.59
4.3.5 Consistency Ratio (C.R.)
As per Saaty (1980), “the AHP measures the overall consistency of judgments by
means of as Consistency Ratio. The value of the consistency ration should be 10 percent
or less. If it is more that 10 percent, the judgments may be somewhat random and should
be revised. The Consistency Ration was calculated by taking the ratio of C.I. to the
average R.I. for the same order matrix.” A ration of 0.10 or less is considered acceptable.
Table 4.5 shows the consistency calculation example for level 2 which was
illustrated earlier and the remaining calculations for the research were illustrated in
Appendix C.
Table 4.5 Consistency Calculation for Level 2
Average (Priority) Consistency
15% 6.251005
18% 6.275808
20% 6.246776
8% 6.178372
23% 6.432085
16% 6.252179
Total 37.63623
Page 65
53
Table 4.5 Continued
λmax = Total/n 6.272704
C.I. = (λmax-n)/(n-1) 0.054541
R.I. (for n=6) 1.24
C.R.= C.I./R.I. 0.043985
0.0433985 < 0.1 (Acceptable)
4.3.6 Consistency Results
Consistency ration was computed for level 1, 2, and 7 matrixes of level 3, and the
results were found as follows:
a) 2 matrixes were less than (3x3) (Supervision/Control and Resources) where the
ratio index is zero, and wasn’t considered for computation
b) Consistency ratio for level 1, 2, and “3” matrixes of level 3 (Quality, Method, and
Information) were found under 10 percent and were accepted
c) 2 matrixes within level 3 (Decision-Making and Planning) were resulted in
consistency ration higher that 10 percent and were adjusted
4.3.7 Consistency Adjustment
As a clarification of inconsistency ration, Saaty (1982, p. 82) stated that “usually
we cannot be so certain of our judgments that we would insist on forcing consistency in
the pair-wise comparison matrix. Rather, we guess our feeling or judgments in all the
positions except the diagonal ones (which are always 1) force the reciprocal in the
transpose positions, and look for an answer, we may not be perfectly consistent, but that
is the way we tend to work.” Saaty suggested that one way to improve consistency when
it turns out to be unsatisfactory is to rank the activities by a simple order based on the
weights obtained in the first run of the problem. A second pair-wise comparison matrix is
Page 66
54
then developed with this knowledge of ranking in mind. The consistency generally is
better (Saaty, 1982, p. 85). Based on Saaty’s suggestion, a second pair-wise comparison
was developed for Planning and Decision-Making matrixes as shown in table 4.6, 4.7,
4.8, and 4.9 respectively.
Table 4.6 Actual Result of Planning Matrix
Parameter Constraint Analysis
Root C. Analysis
Look A. Planning
Inspection & Enforcement
Constraint Analysis
1 0.333 1 3
Root Cause Analysis
3.000 1 0.333 3
Look-ahead Planning
1 3.000 1 3
Inspection.& Enforcement
0.333 0.333 0.333 1
Total 5.333 4.667 2.667 10.000
Parameter Const.
Analysis Root C. Analysis
Look A. Planning
Inspection & Enforcement
. Total Ave. Consist.
Const. Analysis
0.187 0.071 0.375 0.300 0.934 23% 4.194
Root C. Analysis
0.563 0.214 0.125 0.300 1.202 30% 4.645
Look-ahead Planning
0.187 0.643 0.375 0.300 1.505 38% 4.731
Inspection.& Enforcement
0.062 0.071 0.125 0.100 0.359 9% 4.381
Total 1.000 1.000 1.000 1.000 Total 100% 17.951
λmax 4.488
C.I. 0.163
R.I. 0.900
CR > 0.1 (Not Acceptable) CR 0.181
Page 67
55
Table 4.7 Adjusted Result of Planning Matrix
Parameter Constraint Analysis
Root C. Analysis
Look A. Planning
% of Planned
Completed Const.
Analysis 1 0.5 1 2
Root C. Analysis
2 1 0.5 2
Look-ahead Planning
1 2 1 2
% of Planned
Completed 0.5 0.5 0.5 1
Total 4.500 4.000 3.000 7.000
Parameter Const.
Analysis Root C. Analysis
Look A. Planning
% of Planned
Completed Total Ave. Consist.
Const. Analysis
0.222 0.125 0.333 0.286 0.966 24% 4.111
Root C. Analysis
0.444 0.250 0.167 0.286 1.147 29% 4.221
Look-ahead Planning
0.222 0.500 0.333 0.286 1.341 34% 4.244
% of Planned
Completed 0.111 0.125 0.167 0.143 0.546 14% 4.165
Total 1.000 1.000 1.000 1.000 Total 100% 16.742
λmax 4.185
C.I. 0.062
R.I. 0.900
CR < 0.1 ( Acceptable) CR 0.069
Page 68
56
Table 4.8 Actual Result of Decision-Making Matrix
Parameter Use of Visual
Indicators
Decision at Construction
Site
Take Decision Slowly, Implement
them Quickly Use of Visual
Indicators 1 0.333 0.333
Decision at Construction
Site 3.003 1 3
Take Decision Slowly,
Implement them Quickly
3.003 0.333 1
Total 7.006 1.666 4.333
Parameter Use of Visual
Indicators
Decision at Construction
Site
Take Decision Slowly, Implement
them Quickly Total Ave. Consist.
Use of Visual Indicators
0.143 0.200 0.077 0.419 14% 3.049
Decision at Construction
Site 0.429 0.600 0.692 1.721 57% 3.230
Take Decision Slowly,
Implement them Quickly
0.429 0.200 0.231 0.859 29% 3.133
Total 1.000 1.000 1.000 Total 100% 9.412
λmax 3.137
CI 0.069
RI 0.580
CR > 0.1 (Not Acceptable) CR 0.118
Page 69
57
Table 4.9 Adjusted Result of Decision-Making Matrix
Parameter Use of Visual
Indicators
Decision at Construction
Site
Take Decision Slowly, Implement
Quickly Use of Visual
Indicators 1 0.5 0.5
Decision at Construction
Site 2 1 2
Take Decision Slowly,
Implement them Quickly
2 0.5 1
Total 5.000 2.000 3.500
Parameter Use of Visual
Indicators
Decision at Construction
Site
Take Decision Slowly, Implement
them Quickly Total Ave. Consist.
Use of Visual Indicators
0.200 0.250 0.143 0.593 20% 3.030
Decision at Construction
Site 0.400 0.500 0.571 1.471 49% 3.078
Take Decision Slowly,
Implement them Quickly
0.400 0.250 0.286 0.936 31% 3.053
Total 1.000 1.000 1.000 Total 100% 9.161
λmax 3.053
CI 0.027
RI 0.58
CR < 0.1 (Acceptable) CR 0.046
Page 70
58
4.4 Analysis of Results
The survey results previously described, not only helped in gaining an insight into
the way of how lean construction techniques could improve construction process, but
also provided the basis for prioritizing alternatives for the stakeholder’s decision-making.
Furthermore, it provided a reality check and consistency for the goal achieved, thus
ensuring that the decision was based on sound logic. The overall analysis of results could
be illustrated as shown in Figure 4.16.
4.5 Discussion of Results
As illustrated in Figure 4.16, the survey result assessed the importance of the
waste factors and lean techniques in order to help decision-makers to make tradeoffs
among them. To reach the optimum goal of improvement, the result demonstrates the
following:
Figure 4.16 Overall Analysis of Results
Page 71
59
1) Controllable waste associated with Management Activities and Flows are the most
important factors in reducing the process waste (Figure 4.7). This result
demonstrates the necessity for giving the priority for waste reduction to activities
associated with Management Activities (Supervision/Control and Decision-Making),
and Flows (Information and Resources). Application of lean techniques should
have more consideration and importance in these activities in order to improve
performance and productivity.
2) While each controllable waste was subdivided to different factors, waste due to
Information was found the most importance among the other six factors, and
Method found to be the least; see Figure 4.8. Information then has to be
considered through the suggested lean techniques which include: (Accurate
information, clear specification, effective communication, and detection of
incompatibility and discrepancy).
3) The result provides a set of priorities for how application of lean techniques (level
3) could be categorized, and it demonstrates the importance of the alternatives for
reaching the superior goal (level 2); please refer to section 4.2.5.3, and see Figures
4.9 through 4.15.
4.6 Chapter Summary
A survey was sent out to professionals in the construction industry including both
private and public sectors. The majority of the survey participants were from Texas, and
they belonged to various areas of the construction including directors, project managers,
and others. The survey approach was to use the weights, or priorities, to allocate a
resource among the activities to simply implement the most important activities by rank.
To validate the results and methods used in these decision-making problems,
consistency was computed to determine its acceptability. To improve the consistency of
Page 72
60
some of the results obtained, activities have been re-ranked by a simple order based on
the weights obtained in the first run of the problem, and the consistency obtained was
better. To help decision-makers make tradeoffs, the survey results assessed the
importance of the waste factors and lean techniques.
Page 73
61
Chapter 5
CONCLUSIONS AND RECOMMENDATIONS FOR FUTURE RESEARCH
Chapter 4 illustrated the data collection process, analysis, validation, and the
final results obtained. This chapter includes the summary of this thesis and the
conclusions drawn from the research conducted on applying lean techniques for
municipal project delivery improvement. The limitations to the research and
recommendations for implementation and future research were also discussed in this
chapter.
5.1 Research Summary
A case sparked the necessity for improvement of the construction project
process within traditional method practices used by municipal projects. This research
aimed to propose the application of lean techniques to reduce waste and improve
performance and productivity in municipal project delivery. A literature review on the
existing body of knowledge pertaining to this thesis was concluded. This literature review
covered methods used by municipal construction projects as well as lean construction,
waste in construction, productivity and performance measurement, and information
system and communication. This thesis developed a framework in which lean theory can
be put into practical experiences through the Analytical Hierarchy Process approach
(AHP). AHP is a decision-aiding method aimed at quantifying relative priorities for a given
set of alternatives on a ratio scale, based on the judgment of the decision-maker. For this
purpose, a comparison-based survey was conducted targeting the construction
professionals’ experience. The research approach aimed for optimum success that could
be reached by applying the appropriate techniques to reduce the waste, obtain required
results, and look for continuous improvement for future application. Many alternatives of
Page 74
62
lean techniques were identified and prioritized to support in reaching the optimum goal of
waste reduction and performance improvement.
5.2 Conclusions
The following conclusions can be derived from this thesis:
1) Waste in the construction process were defined and isolated as a
controllable waste in which it was classified, recognized, and controlled.
2) This thesis provided better understanding of lean techniques application as a
waste controller and improvement provider.
3) Many alternatives of lean techniques were identified to support in reaching
the optimum goal of waste reduction and performance and productivity
improvement.
4) Through the AHP approach, the survey result helped the decision-makers to
reach their goal through demonstrating the decision-making problem as a
hierarchy of criteria and alternatives.
5) The survey result clearly assessed the importance of the waste factors and
lean techniques alternatives in order to help decision-makers to make
tradeoffs among them.
6) The analysis of the survey result was prioritized the controllable waste
associated with Management Activities and Flows as the most important
factors need to be focused on with a rate of 43% for each.
7) Waste associated with Information was found the most important factor
among the controllable waste sub-factors with a rate of 19%, followed by
Planning 16.6%, Quality 15.7, Resources 14%, Supervision/Control 13.8%,
Decision-Making 13%, and Method found to be the least with 7.9%.
Page 75
63
8) Lean techniques were specified as alternatives for each sub-level waste, and
prioritized for better application; see Figures 4.9 through 4.15 in chapter 4.
5.3 Limitations
There are several limitations that need to be addressed in regards to the
development of this thesis:
• This research investigated problems in the municipal construction project
delivery in Texas region as a specimen sample, and assigned to a known
construction method practices (Design-Bid-Build).
• This research selected specific lean techniques to be implemented to solve
the research problems presented in this thesis.
• The results obtained from this research were related to a data collected
according to construction professionals’ experience and the research topic
investigation, and further consideration might be needed for future research.
• In this research, respondents were selected in one geographic area, which
may have influenced the results.
5.4 Recommendations for Implementation
The following topics are recommended on the subject of using lean techniques in
construction industry:
• The results of this thesis could lead to improved relationships between
owners, consultants, and contractors through the suggested techniques.
• Construction firms need to be aware of the intensity of the miscommunication
that exist in the construction industry and encourage relations that build on
team integration and transparency.
Page 76
64
• In terms of social change, this thesis presented the opportunity to change the
way in which the stakeholders interact with each others in construction
industry for continuous improvement.
• Knowledge gained from this thesis could also be incorporated into training
techniques for leaders in the construction industry to ensure successful
project completion.
• The results of this study may also serve as an influence to members of the
construction industry who are hesitant to implement lean techniques for
waste reduction and performance improvement.
• This research can help to provide the construction industry increased
knowledge that is needed to change its own public image, as well as to
improve the performance through interactions between stakeholders.
5.5 Recommendations for Future Research
• It is hoped that this study will inspire future research regarding lean
construction, and the use of lean techniques in many areas within the
construction industry.
• Because this study focused on a specific sector and project delivery method,
future research should be conducted to include more sectors and delivery
methods used by the construction industry and other types of projects.
• Future research should also consider the construction industry on a national
or even global scale; however, such an endeavor was outside the scope of
this research.
Page 77
65
Appendix A
RESEARCH SURVEY
Page 78
66
Re: Research Survey My name is Yasir Abdelrazig and I am a graduate student at University of Texas at Arlington (UTA) conducting a thesis research for my master degree evaluating: “Using Lean Techniques to Reduce Waste and Improve Performance in Construction Project Delivery” Objective
- To analyze and gain a better understanding on the topic of how lean techniques could reduce waste and improve performance in of the traditional municipal project delivery based on construction professionals’ experience.
Methodology - To conduct a pair-wise computation to identify the weight of several factors. - To calculate an overall score of the factors using the Analytic Hierarchy Process
(AHP). - Figure 1: Provides a hierarchy chart of the rating factors (in the attached survey file). - Table 1: Provide the definitions of the various rating factors.
Note:
The Analytical Hierarchy Process (AHP) is a decision-aiding method aims at quantifying relative priorities for a given set of alternatives on a ratio scale, based on the judgment of the Decision-Maker.
Confidentiality - The information provided will be used only in support of this research project. - Your completion of this survey is completely voluntary. - No IP address from which you are responding will be tracked (names of participants
to remain anonymous). - All participants information collected will be kept confidential by the researcher, and
you will receive a summary report describing the findings of the study upon request.
Please download the Excel file and select the appropriate level of preferences for each pair of comparison by clicking on the drop down arrow on the middle table on the attached survey, save the file and reply to the sender email. Contact: If you have any concern about this survey, please contact:
- Yasir Abdelrazig ([email protected] ); Graduate Student at UTA, (817) 987-7671.
- Dr. Mohammad Najafi ([email protected] ); Professor and Director, Construction Engineering and Management, University of Texas at Arlington (UTA) at (817) 272-0507.
We would like to thank you in advance for your assistance. Sincerely, Yasir Abdelrazig Graduate Student College of Civil Engineering University of Texas at Arlington
Page 79
67
Three Level AHP Structure for Lean Techniques Rating
Title Definition
Accurate Information Provide a valid and accurate information required to complete the job
Clear Specification Provide detailed requirement or characteristics of the product, service, outcome, or result of the project
Concurrent Engineering
Parallel execution of various tasks by multidisciplinary project teams with equal goal and vision
Constraint Analysis Determine what must be done for a given work assignment before execution
Decision at Construction Site
Getting on the project site and see what the real problem is
Detection of Incompatibility and Discrepancy
Detection of a conflict or variation, as between the given facts and the actual condition
Effective Communication
Efficient and effective communication process among the stakeholders
Immediate Problem Detection
Create continuous process flow and review to bring problems to the surface on time
Inspection and Enforcement
Adding inspections, and increasing tracking of defects, rather than reducing waste by preventing defects
Page 80
68
Look-ahead Planning Expresses what CAN be done after the master plan defines what SHOULD be done
Management Support Involvement of managers in the process at the project level
Percentage of Planned Completed
Systematically comparing the plans committed to the plans executed in a project
Process Evaluation Evaluation of project performance and process efficiency at site and project level
Resources Availability Availability of a resource that is committable, operable, or usable upon demand
Resources Leveling The process allocate and smoothing out daily resources demands (Labor - Equipment - Material)
Root Cause Analysis Tracking and analyzing for nonconformance with the plan in order to develop a future plan
Standardization of Work Process
Using stable, repeatable methods everywhere to maintain the predictability, regular timing, and regular output of processes
Systematic Procedures
Increase output value through systematic consideration of owner requirements
Take Decision Slowly, Implement them Quickly
Take decisions slowly after total consensus of all the stakeholders, implement them quickly on project
Team Integration Members from all the organizations needed to develop, build, and deliver the project
Transparency The availability of full information required for collaboration, cooperation, and collective decision making
Visual Indicators Effective techniques such as the fishbone, cause and effect diagram, and A4 chart
Level of Preference
of Each Factor
1. Significantly Less Important
2. Less Important
3. Equally Important
4. More Important
5. Significantly More Important
FROM THE MIDDLE TABLE, PLEASE SELECT THE APPROPRIATE LEVEL OF PREFERENCE OF EACH FACTOR ON THE LEFT TO THE FACTOR ON THE RIGHT BY CLICKING THE DROP DOWN ARROW EXAPMLE:
Page 81
69
AHP Level 2
FACTOR
IS
Level of Preference FACTOR
Decision-Making
Please click here to Select one TO Quality
Please click here to Select one TO Planning
Please click here to Select one TO Method
Please click here to Select one TO Information
Please click here to Select one TO Resources
Please click here to Select one TO Supervision/Control
FACTOR
IS
Level of Preference FACTOR
Quality
Please click here to Select one TO Planning
Please click here to Select one TO Method
Please click here to Select one TO Information
Please click here to Select one TO Resources
Please click here to Select one TO Supervision/Control
FACTOR
IS
Level of Preference FACTOR
Planning
Please click here to Select one TO Method
Please click here to Select one TO Information
Please click here to Select one TO Resources
Please click here to Select one TO Supervision/Control
FACTOR
IS
Level of Preference FACTOR
Method
Please click here to Select one TO Information
Please click here to Select one TO Resources
Please click here to Select one TO Supervision/Control
FACTOR
IS
Level of Preference FACTOR
Information Please click here to Select one TO Resources
Please click here to Select one TO Supervision/Control
FACTOR IS
Level of Preference FACTOR
Resources Please click here to Select one TO Supervision/Control
Page 82
70
AHP Level 3
FACTOR Level of Preference FACTOR
Management Support/Control
IS Please click here to Select one TO Transparency
AHP Level 3
FACTOR
Level of Preference FACTOR
Use of visual indicators IS Please click here to Select one TO
Take Decisions Slowly Implement Them Quickly
Please click here to Select one TO Decision at Construction Site
Take Decisions Slowly Implement them Quickly
IS Please click here to Select one TO Decision at Construction Site
AHP Level 3
FACTOR
Level of Preference FACTOR
Process Evaluation IS
Please click here to Select one TO Immediate Problem Detection
Please click here to Select one TO Systematic Procedures
Please click here to Select one TO Inspection and Enforcement
Immediate Problem Detection
IS Please click here to Select one TO
Systematic Procedures
Please click here to Select one TO Inspection and Enforcement
Systematic Procedures IS Please click here to Select one TO Inspection and Enforcement
AHP Level 3
FACTOR Level of Preference FACTOR
Resources Availability IS Please click here to Select one TO
Resources Leveling
Page 83
71
AHP Level 3
FACTOR
Level of Preference FACTOR
Constraint Analysis IS
Please click here to Select one TO Root Cause Analysis
Please click here to Select one TO Look-ahead Planning
Please click here to Select one TO Percentage of Planned Completed
Root Cause Analysis IS
Please click here to Select one TO Look-ahead Planning
Please click here to Select one TO Percentage of Planned Completed
Look-ahead Planning IS Please click here to Select one TO Percentage of Planned Completed
AHP Level 3
FACTOR
Level of Preference FACTOR
Team Integration IS Please click here to Select one TO
Concurrent Engineering
Please click here to Select one TO Standardization of Work Processes
Concurrent Engineering IS Please click here to Select one TO Standardization of Work Processes
AHP Level 3
FACTOR
Level of Preference FACTOR
Accurate Information IS Please click here to Select one TO Clear Specification
Please click here to Select one TO Effective Communication
Page 84
72
Please click here to Select one TO Detection of Incompatibility and Discrepancy
Clear Specification IS
Please click here to Select one TO Effective Communication
Please click here to Select one TO Detection of Incompatibility and Discrepancy
Effective Communication
IS Please click here to Select one TO Detection of Incompatibility and Discrepancy
OPTIONAL:
Respondent’s Agency:
Respondent’s Name:
Job Title:
Phone Number:
NOTE PLEASE:
- SAVE YOUR WORK AFTER COMPLETION - REPLY ATTACHING THIS FILE TO THE SENDER EMAIL
([email protected] )
Page 85
73
Appendix B
DATA ANALYSIS
Page 86
74
LEVEL 1
Comparison 1.1
Controllable Waste Associated with Management Activities Vs.
Controllable Waste Associated with Conversions
Total responses 16 Out of 18 Response rate 88.89%
Level of Preference Quantity
% of Total % of Answered
1. Significantly Less Important 0 0.00% 0.00%
2. Less Important 2 11.11% 12.50%
3. Equally Important 5 27.78% 31.25%
4. More Important 7 38.89% 43.75%
5. Significantly More Important 2 11.11% 12.50%
16 1
43.8%31.3%
12.5% 12.5%0.0%0.0%
20.0%
40.0%
60.0%
4. More
Important
3. Equally
Important
2. Less
Important
5. Significantly
More Important
1. Significantly
Less Important
Controllable Waste Associated with Management Activities Vs
Controllable Waste Associated with Conversions
% of Answered
Page 87
75
Comparison 1.2
Controllable Waste Associated with Management Activities Vs.
Controllable Waste Associated with Flows
Total responses 16 Out of 18 Response rate 88.89%
Level of Preference Quantity
% of Total % of Answered
1. Significantly Less Important 0 0.00% 0.00%
2. Less Important 3 16.67% 18.75%
3. Equally Important 7 38.89% 43.75%
4. More Important 4 22.22% 25.00%
5. Significantly More Important 2 11.11% 12.50%
16 1
43.8%25.0% 18.8% 12.5%
0.0%0.0%
20.0%
40.0%
60.0%
3. Equally
Important
4. More
Important
2. Less
Important
5. Significantly
More Important
1. Significantly
Less Important
Controllable Waste Associated with Management Activities Vs
Controllable Waste Associated with Flows
% of Answered
Page 88
76
Comparison 1.3
Controllable Waste Associated with Flows Vs.
Controllable Waste Associated with Conversions
Total responses 16 Out of 18 Response rate 88.89%
Level of Preference Quantity
% of Total % of Answered
1. Significantly Less Important 0 0.00% 0.00%
2. Less Important 3 16.67% 18.75%
3. Equally Important 5 27.78% 31.25%
4. More Important 8 44.44% 50.00%
5. Significantly More Important 0 0.00% 0.00%
16 1
50.0%31.3%
18.8%0.0% 0.0%0.0%
20.0%
40.0%
60.0%
4. More
Important
3. Equally
Important
2. Less
Important
5. Significantly
More Important
1. Significantly
Less Important
Controllable Waste Associated with Flows Vs Controllable
Waste Associated with Conversions
% of Answered
Page 89
77
LEVEL 2
Comparison 2.1
Decision-Making Vs.
Quality
Total responses 17 Out of 18 Response rate 94.44%
Level of Preference Quantity
% of Total % of Answered
1. Significantly Less Important 0 0.00% 0.00%
2. Less Important 4 22.22% 23.53%
3. Equally Important 7 38.89% 41.18%
4. More Important 5 27.78% 29.41%
5. Significantly More Important 1 5.56% 5.88%
17 1
41.2%29.4% 23.5%
5.9% 0.0%0.0%
10.0%
20.0%
30.0%
40.0%
50.0%
3. Equally
Important
4. More
Important
2. Less
Important
5. Significantly
More Important
1. Significantly
Less Important
Decision Making Vs Quality
% of Answered
Page 90
78
Comparison 2.2
Decision-Making Vs.
Planning
Total responses 17 Out of 18 Response rate 94.44%
Level of Preference Quantity
% of Total % of Answered
1. Significantly Less Important 0 0.00% 0.00%
2. Less Important 6 33.33% 35.29%
3. Equally Important 6 33.33% 35.29%
4. More Important 3 16.67% 17.65%
5. Significantly More Important 2 11.11% 11.76%
17 1
35.3% 35.3%
17.7%11.8%
0.0%0.0%
10.0%
20.0%
30.0%
40.0%
2. Less
Important
3. Equally
Important
4. More
Important
5. Significantly
More Important
1. Significantly
Less Important
Decision-Making Vs Planning
% of Answered
Page 91
79
Comparison 2.3
Decision-Making Vs.
Method
Total responses 17 Out of 18 Response rate 94.44%
Level of Preference Quantity
% of Total % of Answered
1. Significantly Less Important 0 0.00% 0.00%
2. Less Important 1 5.56% 5.88%
3. Equally Important 8 44.44% 47.06%
4. More Important 6 33.33% 35.29%
5. Significantly More Important 2 11.11% 11.76%
17 1
47.1%35.3%
11.8% 5.9% 0.0%0.0%
10.0%
20.0%
30.0%
40.0%
50.0%
3. Equally
Important
4. More
Important
5. Significantly
More Important
2. Less
Important
1. Significantly
Less Important
Decision-Making Vs Method
% of Answered
Page 92
80
Comparison 2.4
Decision-Making Vs.
Information
Total responses 17 Out of 18 Response rate 94.44%
Level of Preference Quantity
% of Total % of Answered
1. Significantly Less Important 1 5.56% 5.88%
2. Less Important 4 22.22% 23.53%
3. Equally Important 8 44.44% 47.06%
4. More Important 3 16.67% 17.65%
5. Significantly More Important 1 5.56% 5.88%
17 1
47.1%
23.5% 17.7%5.9% 5.9%0.0%
10.0%
20.0%
30.0%
40.0%
50.0%
3. Equally
Important
2. Less
Important
4. More
Important
5. Significantly
More Important
1. Significantly
Less Important
Decision Making Vs Information
% of Answered
Page 93
81
Comparison 2.5
Decision-Making Vs.
Resources
Total responses 17 Out of 18 Response rate 94.44%
Level of Preference Quantity
% of Total % of Answered
1. Significantly Less Important 1 5.56% 5.88%
2. Less Important 4 22.22% 23.53%
3. Equally Important 6 33.33% 35.29%
4. More Important 4 22.22% 23.53%
5. Significantly More Important 2 11.11% 11.76%
17 1
35.3%23.5% 23.5%
11.8%5.9%
0.0%
10.0%
20.0%
30.0%
40.0%
3. Equally
Important
4. More
Important
2. Less
Important
5. Significantly
More Important
1. Significantly
Less Important
Decision-Making Vs Resources
% of Answered
Page 94
82
Comparison 2.6
Decision-Making VS.
Supervision/Control
Total responses 17 Out of 18 Response rate 94.44%
Level of Preference Quantity
% of Total % of Answered
1. Significantly Less Important 0 0.00% 0.00%
2. Less Important 3 16.67% 17.65%
3. Equally Important 9 50.00% 52.94%
4. More Important 3 16.67% 17.65%
5. Significantly More Important 2 11.11% 11.76%
17 1
52.9%
17.7% 17.7% 11.8%0.0%0.0%
20.0%
40.0%
60.0%
3. Equally
Important
4. More
Important
2. Less Important 5. Significantly
More Important
1. Significantly
Less Important
Decision-Making Vs Supervision/Control
% of Answered
Page 95
83
Comparison 2.7
Quality Vs.
Planning
Total responses 17 Out of 18 Response rate 94.44%
Level of Preference Quantity
% of Total % of Answered
1. Significantly Less Important 1 5.56% 5.88%
2. Less Important 1 5.56% 5.88%
3. Equally Important 10 55.56% 58.82%
4. More Important 3 16.67% 17.65%
5. Significantly More Important 2 11.11% 11.76%
17 1
58.8%
17.7% 11.8% 5.9% 5.9%0.0%
20.0%
40.0%
60.0%
80.0%
3. Equally
Important
4. More
Important
5. Significantly
More Important
1. Significantly
Less Important
2. Less
Important
Quality Vs Planning
% of Answered
Page 96
84
Comparison 2.8
Quality Vs.
Method
Total responses 17 Out of 18 Response rate 94.44%
Level of Preference Quantity
% of Total % of Answered
1. Significantly Less Important 0 0.00% 0.00%
2. Less Important 2 11.11% 11.76%
3. Equally Important 5 27.78% 29.41%
4. More Important 8 44.44% 47.06%
5. Significantly More Important 2 11.11% 11.76%
17 1
47.1%
29.4%
11.8% 11.8%0.0%0.0%
10.0%
20.0%
30.0%
40.0%
50.0%
4. More
Important
3. Equally
Important
5. Significantly
More Important
2. Less
Important
1. Significantly
Less Important
Quality Vs Method
% of Answered
Page 97
85
Comparison 2.9
Quality Vs.
Information
Total responses 17 Out of 18 Response rate 94.44%
Level of Preference Quantity
% of Total % of Answered
1. Significantly Less Important 0 0.00% 0.00%
2. Less Important 2 11.11% 11.76%
3. Equally Important 9 50.00% 52.94%
4. More Important 4 22.22% 23.53%
5. Significantly More Important 2 11.11% 11.76%
17 1
52.9%
23.5%11.8% 11.8%
0.0%0.0%
20.0%
40.0%
60.0%
3. Equally
Important
4. More
Important
2. Less
Important
5. Significantly
More Important
1. Significantly
Less Important
Quality Vs Information
% of Answered
Page 98
86
Comparison 2.10
Quality Vs.
Resources
Total responses 17 Out of 18 Response rate 94.44%
Level of Preference Quantity
% of Total % of Answered
1. Significantly Less Important 2 11.11% 11.76%
2. Less Important 3 16.67% 17.65%
3. Equally Important 6 33.33% 35.29%
4. More Important 5 27.78% 29.41%
5. Significantly More Important 1 5.56% 5.88%
17 1
35.3%29.4%
17.7%11.8%
5.9%0.0%
10.0%
20.0%
30.0%
40.0%
3. Equally
Important
4. More
Important
2. Less
Important
1. Significantly
Less Important
5. Significantly
More Important
Quality Vs Resources
% of Answered
Page 99
87
Comparison 2.11
Quality Vs.
Supervision/Control
Total responses 17 Out of 18 Response rate 94.44%
Level of Preference Quantity
% of Total % of Answered
1. Significantly Less Important 2 11.11% 11.76%
2. Less Important 2 11.11% 11.76%
3. Equally Important 10 55.56% 58.82%
4. More Important 3 16.67% 17.65%
5. Significantly More Important 0 0.00% 0.00%
17 1
58.8%
17.7% 11.8% 11.8%0.0%0.0%
20.0%
40.0%
60.0%
80.0%
3. Equally
Important
4. More
Important
2. Less Important 5. Significantly
More Important
1. Significantly
Less Important
Quality Vs Supervision/Controll
% of Answered
Page 100
88
Comparison 2.12
Planning Vs.
Method
Total responses 17 Out of 18 Response rate 94.44%
Level of Preference Quantity
% of Total % of Answered
1. Significantly Less Important 0 0.00% 0.00%
2. Less Important 1 5.56% 5.88%
3. Equally Important 3 16.67% 17.65%
4. More Important 9 50.00% 52.94%
5. Significantly More Important 4 22.22% 23.53%
17 1
52.9%
23.5% 17.7%5.9% 0.0%0.0%
20.0%
40.0%
60.0%
4. More
Important
5. Significantly
More Important
3. Equally
Important
2. Less
Important
1. Significantly
Less Important
Planning VS Method
% of Answered
Page 101
89
Comparison 2.13
Planning Vs.
Information
Total responses 17 Out of 18 Response rate 94.44%
Level of Preference Quantity
% of Total % of Answered
1. Significantly Less Important 0 0.00% 0.00%
2. Less Important 3 16.67% 17.65%
3. Equally Important 7 38.89% 41.18%
4. More Important 6 33.33% 35.29%
5. Significantly More Important 1 5.56% 5.88%
17 1
41.2% 35.3%
17.7%5.9% 0.0%0.0%
10.0%
20.0%
30.0%
40.0%
50.0%
3. Equally
Important
4. More
Important
2. Less
Important
5. Significantly
More Important
1. Significantly
Less Important
Planning Vs Information
% of Answered
Page 102
90
Comparison 2.14
Planning Vs.
Resources
Total responses 17 Out of 18 Response rate 94.44%
Level of Preference Quantity
% of Total % of Answered
1. Significantly Less Important 1 5.56% 5.88%
2. Less Important 3 16.67% 17.65%
3. Equally Important 6 33.33% 35.29%
4. More Important 5 27.78% 29.41%
5. Significantly More Important 2 11.11% 11.76%
17 1
35.3%29.4%
17.7%11.8%
5.9%0.0%
10.0%
20.0%
30.0%
40.0%
3. Equally
Important
4. More
Important
2. Less
Important
5. Significantly
More Important
1. Significantly
Less Important
Planning Vs Resources
% of Answered
Page 103
91
Comparison 2.15
Planning Vs.
Supervision/Control
Total responses 17 Out of 18 Response rate 94.44%
Level of Preference Quantity
% of Total % of Answered
1. Significantly Less Important 0 0.00% 0.00%
2. Less Important 0 0.00% 0.00%
3. Equally Important 11 61.11% 64.71%
4. More Important 6 33.33% 35.29%
5. Significantly More Important 0 0.00% 0.00%
17 1
64.7%
35.3%
0.0% 0.0% 0.0%0.0%
20.0%
40.0%
60.0%
80.0%
3. Equally
Important
4. More
Important
2. Less Important 5. Significantly
More Important
1. Significantly
Less Important
Decision-Making Vs Supervision/Control
% of Answered
Page 104
92
Comparison 2.16
Method Vs.
Information
Total responses 17 Out of 18 Response rate 94.44%
Level of Preference Quantity
% of Total % of Answered
1. Significantly Less Important 0 0.00% 0.00%
2. Less Important 9 50.00% 52.94%
3. Equally Important 5 27.78% 29.41%
4. More Important 1 5.56% 5.88%
5. Significantly More Important 2 11.11% 11.76%
17 1
52.9%
29.4%11.8% 5.9% 0.0%0.0%
20.0%
40.0%
60.0%
2. Less Important 3. Equally
Important
5. Significantly
More Important
4. More
Important
1. Significantly
Less Important
Method Vs Information
% of Answered
Page 105
93
Comparison 2.17
Method Vs.
Resources
Total responses 17 Out of 18 Response rate 94.44%
Level of Preference Quantity
% of Total % of Answered
1. Significantly Less Important 1 5.56% 5.88%
2. Less Important 7 38.89% 41.18%
3. Equally Important 6 33.33% 35.29%
4. More Important 2 11.11% 11.76%
5. Significantly More Important 1 5.56% 5.88%
17 1
41.2% 35.3%
11.8% 5.9% 5.9%0.0%
10.0%
20.0%
30.0%
40.0%
50.0%
2. Less Important 3. Equally
Important
4. More
Important
5. Significantly
More Important
1. Significantly
Less Important
Method Vs Resources
% of Answered
Page 106
94
Comparison 2.18
Method Vs.
Supervision/Control
Total responses 17 Out of 18 Response rate 94.44%
Level of Preference Quantity
% of Total % of Answered
1. Significantly Less Important 1 5.56% 5.88%
2. Less Important 3 16.67% 17.65%
3. Equally Important 7 38.89% 41.18%
4. More Important 5 27.78% 29.41%
5. Significantly More Important 1 5.56% 5.88%
17 1
41.2%29.4%
17.7%5.9% 5.9%0.0%
10.0%
20.0%
30.0%
40.0%
50.0%
3. Equally
Important
4. More
Important
2. Less
Important
5. Significantly
More Important
1. Significantly
Less Important
Method Vs Supervision/Control
% of Answered
Page 107
95
Comparison 2.19
Information Vs.
Resources
Total responses 17 Out of 18 Response rate 94.44%
Level of Preference Quantity
% of Total % of Answered
1. Significantly Less Important 1 5.56% 5.88%
2. Less Important 1 5.56% 5.88%
3. Equally Important 6 33.33% 35.29%
4. More Important 7 38.89% 41.18%
5. Significantly More Important 2 11.11% 11.76%
17 1
41.2% 35.3%
11.8% 5.9% 5.9%0.0%
10.0%
20.0%
30.0%
40.0%
50.0%
4. More
Important
3. Equally
Important
5. Significantly
More Important
1. Significantly
Less Important
2. Less Important
Information Vs Resources
% of Answered
Page 108
96
Comparison 2.20
Information Vs.
Supervision/Control
Total responses 17 Out of 18 Response rate 94.44%
Level of Preference Quantity
% of Total % of Answered
1. Significantly Less Important 0 0.00% 0.00%
2. Less Important 0 0.00% 0.00%
3. Equally Important 9 50.00% 52.94%
4. More Important 6 33.33% 35.29%
5. Significantly More Important 2 11.11% 11.76%
17 1
52.9%35.3%
11.8%0.0% 0.0%0.0%
20.0%
40.0%
60.0%
3. Equally
Important
4. More
Important
5. Significantly
More Important
1. Significantly
Less Important
2. Less Important
Information Vs Supervision/Control
% of Answered
Page 109
97
Comparison 2.21
Resources Vs.
Supervision/Control
Total responses 17 Out of 18 Response rate 94.44%
Level of Preference Quantity
% of Total % of Answered
1. Significantly Less Important 1 5.56% 5.88%
2. Less Important 2 11.11% 11.76%
3. Equally Important 11 61.11% 64.71%
4. More Important 3 16.67% 17.65%
5. Significantly More Important 0 0.00% 0.00%
17 1
64.7%
17.7% 11.8% 5.9% 0.0%0.0%
20.0%
40.0%
60.0%
80.0%
3. Equally
Important
4. More
Important
2. Less Important 1. Significantly
Less Important
5. Significantly
More Important
Resources Vs Supervision/Control
% of Answered
Page 110
98
LEVEL 3
Comparison 3.1
Supervision/Control
Management Support/Control Vs.
Transparency
Total responses 16 Out of 18 Response rate 88.89%
Level of Preference Quantity
% of Total % of Answered
1. Significantly Less Important 0 0.00% 0.00%
2. Less Important 2 11.11% 12.50%
3. Equally Important 8 44.44% 50.00%
4. More Important 6 33.33% 37.50%
5. Significantly More Important 0 0.00% 0.00%
16 1
50.0%37.5%
12.5%0.0% 0.0%0.0%
10.0%
20.0%
30.0%
40.0%
50.0%
60.0%
3. Equally
Important
4. More
Important
2. Less Important 5. Significantly
More Important
1. Significantly
Less Important
Management Support/Control Vs Transparency
% of Answered
Page 111
99
Comparison 3.2
Supervision/Control
Use of Visual Indicators Vs.
Take Decisions Slowly Implement them Quickly
Total responses 17 Out of 18 Response rate 94.44%
Level of Preference Quantity
% of Total % of Answered
1. Significantly Less Important 1 5.56% 5.88%
2. Less Important 8 44.44% 47.06%
3. Equally Important 3 16.67% 17.65%
4. More Important 5 27.78% 29.41%
5. Significantly More Important 0 0.00% 0.00%
17 1
47.1%
29.4%17.7%
5.9% 0.0%0.0%
10.0%
20.0%
30.0%
40.0%
50.0%
2. Less Important 4. More
Important
3. Equally
Important
1. Significantly
Less Important
5. Significantly
More Important
Use of Visual Indicators Vs Take Decisions Slowly Implement
Them Quickly
% of Answered
Page 112
100
Comparison 3.3
Decision-Making
Use of Visual Indicators Vs.
Decision at Construction Site
Total responses 16 Out of 18 Response rate 88.89%
Level of Preference Quantity
% of Total % of Answered
1. Significantly Less Important 3 16.67% 18.75%
2. Less Important 7 38.89% 43.75%
3. Equally Important 4 22.22% 25.00%
4. More Important 2 11.11% 12.50%
5. Significantly More Important 0 0.00% 0.00%
16 1
43.8%
25.0%18.8%
12.5%0.0%0.0%
10.0%
20.0%
30.0%
40.0%
50.0%
2. Less Important 3. Equally
Important
1. Significantly
Less Important
4. More
Important
5. Significantly
More Important
Use of Visual Indicators Vs Decision at Construction Site
% of Answered
Page 113
101
Comparison 3.4
Decision-Making
Take Decisions Slowly Implement them Quickly Vs.
Decision at Construction Site
Total responses 17 Out of 18 Response rate 94.44%
Level of Preference Quantity
% of Total % of Answered
1. Significantly Less Important 3 16.67% 17.65%
2. Less Important 10 55.56% 58.82%
3. Equally Important 3 16.67% 17.65%
4. More Important 1 5.56% 5.88%
5. Significantly More Important 0 0.00% 0.00%
17 1
58.8%
17.7% 17.7%5.9% 0.0%0.0%
20.0%
40.0%
60.0%
80.0%
2. Less Important 3. Equally
Important
1. Significantly
Less Important
4. More
Important
5. Significantly
More Important
Take Decisions Slowly Implement Them Quickly Vs Decision at
Construction Site
% of Answered
Page 114
102
Comparison 3.5
Quality
Process Evaluation Vs.
Immediate Problem Detection
Total responses 17 Out of 18 Response rate 94.44%
Level of Preference Quantity
% of Total % of Answered
1. Significantly Less Important 1 5.56% 5.88%
2. Less Important 7 38.89% 41.18%
3. Equally Important 8 44.44% 47.06%
4. More Important 0 0.00% 0.00%
5. Significantly More Important 1 5.56% 5.88%
17 1
47.1%41.2%
5.9% 5.9%0.0%0.0%
10.0%
20.0%
30.0%
40.0%
50.0%
3. Equally
Important
2. Less Important 1. Significantly
Less Important
5. Significantly
More Important
4. More
Important
Process Evaluation VS Immediate Problem Detection
% of Answered
Page 115
103
Comparison 3.6
Quality
Process Evaluation Vs.
Systematic Procedures
Total responses 17 Out of 18 Response rate 94.44%
Level of Preference Quantity
% of Total % of Answered
1. Significantly Less Important 0 0.00% 0.00%
2. Less Important 0 0.00% 0.00%
3. Equally Important 12 66.67% 70.59%
4. More Important 5 27.78% 29.41%
5. Significantly More Important 0 0.00% 0.00%
17 1
70.6%
29.4%
0.0% 0.0% 0.0%0.0%
20.0%
40.0%
60.0%
80.0%
3. Equally
Important
4. More
Important
5. Significantly
More Important
1. Significantly
Less Important
2. Less Important
Process Evaluation Vs Systematic Procedures
% of Answered
Page 116
104
Comparison 3.7
Quality
Process Evaluation Vs.
Inspection and Enforcement
Total responses 17 Out of 18 Response rate 94.44%
Level of Preference Quantity
% of Total % of Answered
1. Significantly Less Important 0 0.00% 0.00%
2. Less Important 5 27.78% 29.41%
3. Equally Important 6 33.33% 35.29%
4. More Important 6 33.33% 35.29%
5. Significantly More Important 0 0.00% 0.00%
17 1
35.3% 35.3%29.4%
0.0% 0.0%0.0%
10.0%
20.0%
30.0%
40.0%
3. Equally
Important
4. More
Important
2. Less Important 5. Significantly
More Important
1. Significantly
Less Important
Process Evaluation Vs Inspection and Enforcement
% of Answered
Page 117
105
Comparison 3.8
Quality
Immediate Problem Detection Vs.
Systematic Procedures
Total responses 17 Out of 18 Response rate 94.44%
Level of Preference Quantity
% of Total % of Answered
1. Significantly Less Important 0 0.00% 0.00%
2. Less Important 4 22.22% 23.53%
3. Equally Important 4 22.22% 23.53%
4. More Important 8 44.44% 47.06%
5. Significantly More Important 1 5.56% 5.88%
17 1
47.1%
23.5% 23.5%
5.9%0.0%0.0%
10.0%
20.0%
30.0%
40.0%
50.0%
4. More
Important
2. Less Important 3. Equally
Important
5. Significantly
More Important
1. Significantly
Less Important
Immediate Problem Detection VS Systematic Procedures
% of Answered
Page 118
106
Comparison 3.9
Quality
Immediate Problem Detection Vs.
Inspection and Enforcement
Total responses 17 Out of 18 Response rate 94.44%
Level of Preference Quantity
% of Total % of Answered
1. Significantly Less Important 0 0.00% 0.00%
2. Less Important 1 5.56% 5.88%
3. Equally Important 10 55.56% 58.82%
4. More Important 4 22.22% 23.53%
5. Significantly More Important 2 11.11% 11.76%
17 1
58.8%
23.5%11.8% 5.9% 0.0%0.0%
20.0%
40.0%
60.0%
80.0%
3. Equally
Important
4. More
Important
5. Significantly
More Important
2. Less Important 1. Significantly
Less Important
Immediate Problem Detection Vs Inspection and Enforcement
% of Answered
Page 119
107
Comparison 3.10
Quality
Systematic Procedures Vs.
Inspection and Enforcement
Total responses 17 Out of 18 Response rate 94.44%
Level of Preference Quantity
% of Total % of Answered
1. Significantly Less Important 0 0.00% 0.00%
2. Less Important 5 27.78% 29.41%
3. Equally Important 10 55.56% 58.82%
4. More Important 2 11.11% 11.76%
5. Significantly More Important 0 0.00% 0.00%
17 1
58.8%
29.4%11.8%
0.0% 0.0%0.0%
20.0%
40.0%
60.0%
80.0%
3. Equally
Important
2. Less Important 4. More
Important
5. Significantly
More Important
1. Significantly
Less Important
Systematic Procedures Vs Inspection and Enforcement
% of Answered
Page 120
108
Comparison 3.11
Resources
Resources Availability Vs.
Resources Leveling
Total responses 17 Out of 18 Response rate 94.44%
Level of Preference Quantity
% of Total % of Answered
1. Significantly Less Important 0 0.00% 0.00%
2. Less Important 1 5.56% 5.88%
3. Equally Important 6 33.33% 35.29%
4. More Important 8 44.44% 47.06%
5. Significantly More Important 2 11.11% 11.76%
17 1
47.1%35.3%
11.8%5.9%
0.0%0.0%
10.0%
20.0%
30.0%
40.0%
50.0%
4. More
Important
3. Equally
Important
5. Significantly
More Important
2. Less Important 1. Significantly
Less Important
Resources Availability Vs Resources Leveling
% of Answered
Page 121
109
Comparison 3.12
Planning
Constraint Analysis Vs.
Root Cause Analysis
Total responses 18 Out of 18 Response rate 100.00%
Level of Preference Quantity
% of Total % of Answered
1. Significantly Less Important 4 22.22% 22.22%
2. Less Important 9 50.00% 50.00%
3. Equally Important 4 22.22% 22.22%
4. More Important 1 5.56% 5.56%
5. Significantly More Important 0.00% 0.00%
18 1
50.0%
22.2% 22.2%
5.6% 0.0%0.0%
10.0%
20.0%
30.0%
40.0%
50.0%
60.0%
2. Less Important 3. Equally
Important
1. Significantly
Less Important
4. More
Important
5. Significantly
More Important
Constraint Analysis VS Root Cause Analysis
% of Answered
Page 122
110
Comparison 3.13
Planning
Constraint Analysis Vs.
Look-ahead Planning
Total responses 18 Out of 18 Response rate 100.00%
Level of Preference Quantity
% of Total % of Answered
1. Significantly Less Important 1 5.56% 5.56%
2. Less Important 2 11.11% 11.11%
3. Equally Important 8 44.44% 44.44%
4. More Important 5 27.78% 27.78%
5. Significantly More Important 2 11.11% 11.11%
18 1
44.4%
27.8%
11.1% 11.1%5.6%0.0%
10.0%
20.0%
30.0%
40.0%
50.0%
3. Equally
Important
4. More
Important
5. Significantly
More Important
2. Less Important 1. Significantly
Less Important
Constraint Analysis Vs Look-ahead Planning
% of Answered
Page 123
111
Comparison 3.14
Planning
Constraint Analysis Vs.
Percentage of Planned Completed
Total responses 18 Out of 18 Response rate 100.00%
Level of Preference Quantity
% of Total % of Answered
1. Significantly Less Important 0 0.00% 0.00%
2. Less Important 3 16.67% 16.67%
3. Equally Important 5 27.78% 27.78%
4. More Important 9 50.00% 50.00%
5. Significantly More Important 1 5.56% 5.56%
18 1
50.0%
27.8%16.7%
5.6% 0.0%0.0%
10.0%
20.0%
30.0%
40.0%
50.0%
60.0%
4. More
Important
3. Equally
Important
2. Less Important 5. Significantly
More Important
1. Significantly
Less Important
Constraint Analysis Vs Percentage of Planned Completed
% of Answered
Page 124
112
Comparison 3.15
Planning
Root Cause Analysis Vs.
Look-ahead Planning
Total responses 18 Out of 18 Response rate 100.00%
Level of Preference Quantity
% of Total % of Answered
1. Significantly Less Important 0 0.00% 0.00%
2. Less Important 8 44.44% 44.44%
3. Equally Important 5 27.78% 27.78%
4. More Important 5 27.78% 27.78%
5. Significantly More Important 0 0.00% 0.00%
18 1
44.4%
27.8% 27.8%
0.0% 0.0%0.0%
10.0%
20.0%
30.0%
40.0%
50.0%
2. Less Important 3. Equally
Important
4. More
Important
5. Significantly
More Important
1. Significantly
Less Important
Root Cause Analysis Vs Look-ahead Planning
% of Answered
Page 125
113
Comparison 3.16
Planning
Root Cause Analysis Vs.
Percentage of Planned Completed
Total responses 18 Out of 18 Response rate 100.00%
Level of Preference Quantity
% of Total % of Answered
1. Significantly Less Important 0 0.00% 0.00%
2. Less Important 5 27.78% 27.78%
3. Equally Important 3 16.67% 16.67%
4. More Important 10 55.56% 55.56%
5. Significantly More Important 0 0.00% 0.00%
18 1
55.6%
27.8%16.7%
0.0% 0.0%0.0%
10.0%
20.0%
30.0%
40.0%
50.0%
60.0%
4. More
Important
2. Less Important 3. Equally
Important
5. Significantly
More Important
1. Significantly
Less Important
Root Cause Analysis Vs Percentage of Planned Completed
% of Answered
Page 126
114
Comparison 3.17
Planning
Look-ahead Planning Vs.
Percentage of Planned Completed
Total responses 18 Out of 18 Response rate 100.00%
Level of Preference Quantity
% of Total % of Answered
1. Significantly Less Important 0 0.00% 0.00%
2. Less Important 6 33.33% 33.33%
3. Equally Important 3 16.67% 16.67%
4. More Important 7 38.89% 38.89%
5. Significantly More Important 2 11.11% 11.11%
18 1
38.9%33.3%
16.7%11.1%
0.0%0.0%
10.0%
20.0%
30.0%
40.0%
50.0%
4. More
Important
2. Less Important 3. Equally
Important
5. Significantly
More Important
1. Significantly
Less Important
Look-ahead Planning VS Percentage of Planned Completed
% of Answered
Page 127
115
Comparison 3.18
Method
Team Integration Vs.
Concurrent Engineering
Total responses 18 Out of 18 Response rate 100.00%
Level of Preference Quantity
% of Total % of Answered
1. Significantly Less Important 0 0.00% 0.00%
2. Less Important 1 5.56% 5.56%
3. Equally Important 8 44.44% 44.44%
4. More Important 6 33.33% 33.33%
5. Significantly More Important 3 16.67% 16.67%
18 1
44.4%33.3%
16.7%5.6%
0.0%0.0%
10.0%
20.0%
30.0%
40.0%
50.0%
3. Equally
Important
4. More
Important
5. Significantly
More Important
2. Less Important 1. Significantly
Less Important
Team Integration Vs Concurrent Engineering
% of Answered
Page 128
116
Comparison 3.19
Method
Team Integration Vs.
Standardization of Work Processes
Total responses 18 Out of 18 Response rate 100.00%
Level of Preference Quantity
% of Total % of Answered
1. Significantly Less Important 0 0.00% 0.00%
2. Less Important 4 22.22% 22.22%
3. Equally Important 8 44.44% 44.44%
4. More Important 3 16.67% 16.67%
5. Significantly More Important 3 16.67% 16.67%
18 1
44.4%
22.2%16.7% 16.7%
0.0%0.0%
10.0%
20.0%
30.0%
40.0%
50.0%
3. Equally
Important
2. Less Important 4. More
Important
5. Significantly
More Important
1. Significantly
Less Important
Team Integration Vs Standardization of Work Processes
% of Answered
Page 129
117
Comparison 3.20
Method
Concurrent Engineering Vs.
Standardization of Work Processes
Total responses 18 Out of 18 Response rate 100.00%
Level of Preference Quantity
% of Total % of Answered
1. Significantly Less Important 1 5.56% 5.56%
2. Less Important 4 22.22% 22.22%
3. Equally Important 7 38.89% 38.89%
4. More Important 6 33.33% 33.33%
5. Significantly More Important 0 0.00% 0.00%
18 1
38.9%33.3%
22.2%
5.6%0.0%0.0%
10.0%
20.0%
30.0%
40.0%
50.0%
3. Equally
Important
4. More
Important
2. Less Important 1. Significantly
Less Important
5. Significantly
More Important
Concurrent Engineering Vs Standardization of Work Processes
% of Answered
Page 130
118
Comparison 3.21
Information
Accurate Information Vs.
Clear Specification
Total responses 18 Out of 18 Response rate 100.00%
Level of Preference Quantity
% of Total % of Answered
1. Significantly Less Important 0 0.00% 0.00%
2. Less Important 0 0.00% 0.00%
3. Equally Important 13 72.22% 72.22%
4. More Important 3 16.67% 16.67%
5. Significantly More Important 2 11.11% 11.11%
18 1
72.2%
16.7% 11.1%0.0% 0.0%0.0%
20.0%
40.0%
60.0%
80.0%
3. Equally
Important
4. More
Important
5. Significantly
More Important
1. Significantly
Less Important
2. Less Important
Accurate Information Vs Clear Specification
% of Answered
Page 131
119
Comparison 3.22
Information
Accurate Information Vs.
Effective Communication
Total responses 18 Out of 18 Response rate 100.00%
Level of Preference Quantity
% of Total % of Answered
1. Significantly Less Important 0 0.00% 0.00%
2. Less Important 2 11.11% 11.11%
3. Equally Important 13 72.22% 72.22%
4. More Important 2 11.11% 11.11%
5. Significantly More Important 1 5.56% 5.56%
18 1
72.2%
11.1% 11.1% 5.6% 0.0%0.0%
20.0%
40.0%
60.0%
80.0%
3. Equally
Important
4. More
Important
2. Less Important 5. Significantly
More Important
1. Significantly
Less Important
Accurate Information Vs Effective Communication
% of Answered
Page 132
120
Comparison 3.23
Information
Accurate Information Vs.
Detection of Incompatibility and Discrepancy
Total responses 18 Out of 18 Response rate 100.00%
Level of Preference Quantity
% of Total % of Answered
1. Significantly Less Important 0 0.00% 0.00%
2. Less Important 2 11.11% 11.11%
3. Equally Important 9 50.00% 50.00%
4. More Important 7 38.89% 38.89%
5. Significantly More Important 0 0.00% 0.00%
18 1
50.0%38.9%
11.1%0.0% 0.0%0.0%
20.0%
40.0%
60.0%
3. Equally
Important
4. More
Important
2. Less Important 5. Significantly
More Important
1. Significantly
Less Important
Accurate Information Vs Detection of Incompatibility and
Discrepancy
% of Answered
Page 133
121
Comparison 3.24
Information
Clear Specification Vs.
Effective Communication
Total responses 18 Out of 18 Response rate 100.00%
Level of Preference Quantity
% of Total % of Answered
1. Significantly Less Important 0 0.00% 0.00%
2. Less Important 1 5.56% 5.56%
3. Equally Important 12 66.67% 66.67%
4. More Important 5 27.78% 27.78%
5. Significantly More Important 0 0.00% 0.00%
18 1
66.7%
27.8%
5.6% 0.0% 0.0%0.0%
20.0%
40.0%
60.0%
80.0%
3. Equally
Important
4. More
Important
2. Less Important 5. Significantly
More Important
1. Significantly
Less Important
Clear Specification Vs Effective Communication
% of Answered
Page 134
122
Comparison 3.25
Information
Clear Specification Vs.
Detection of Incompatibility and Discrepancy
Total responses 18 Out of 18 Response rate 100.00%
Level of Preference Quantity
% of Total % of Answered
1. Significantly Less Important 0 0.00% 0.00%
2. Less Important 1 5.56% 5.56%
3. Equally Important 8 44.44% 44.44%
4. More Important 9 50.00% 50.00%
5. Significantly More Important 0 0.00% 0.00%
18 1
50.0% 44.4%
5.6% 0.0% 0.0%0.0%
20.0%
40.0%
60.0%
4. More
Important
3. Equally
Important
2. Less Important 5. Significantly
More Important
1. Significantly
Less Important
Clear Specification VS Detection of Incompatibility and
Discrepancy
% of Answered
Page 135
123
Comparison 3.26
Information
Effective Communication Vs.
Detection of Incompatibility and Discrepancy
Total responses 18 Out of 18 Response rate 100.00%
Level of Preference Quantity
% of Total % of Answered
1. Significantly Less Important 0 0.00% 0.00%
2. Less Important 1 5.56% 5.56%
3. Equally Important 4 22.22% 22.22%
4. More Important 8 44.44% 44.44%
5. Significantly More Important 5 27.78% 27.78%
18 1
44.4%
27.8% 22.2%
5.6% 0.0%0.0%
10.0%
20.0%
30.0%
40.0%
50.0%
4. More
Important
5. Significantly
More Important
3. Equally
Important
2. Less Important 1. Significantly
Less Important
Effective Communication Vs Detection of Incompatibility and
Discrepancy
% of Answered
Page 136
124
Appendix C
DATA VALIDATION
Page 137
125
LEVEL 1
Parameter Management
Activities Conversion Flows
Management Activities
1 3 1
Conversion 0.333 1 0.333
Flows 1 3 1
Total 2.333 7.000 2.333
Parameter Management
Activities Conversion Flows Total Average Consistency
Management Activities
0.429 0.429 0.429 1.286 42.9% 3.0000
Conversion 0.143 0.143 0.143 0.429 14.3% 3.0000
Flows 0.429 0.429 0.429 1.286 42.9% 3.0000
Total 1.000 1.000 1.000 Total 100% 9.0000
λmax 3.000
CI 0.000
RI = 0.580
CR= CI/RI 0.000
Page 138
126
126
LEVEL 2
Parameter Decision Making
Quality Planning Method Information Resources Supervision
/Control Decision Making
1 1 0.667 1 1 1 1
Quality 1 1 1 3 1 1 1
Planning 1.499 1 1 3 1 1 1
Method 1 0.333 0.333 1 0.333 0.333 1
Information 1 1 1 3.003 1 3 1
Resources 1 1 1 3.003 0.333 1 1
Supervision/Control
1 1 1 1 1 1 1
Total 7.499 6.333 6.000 15.006 5.666 8.333 7.000
Parameter Decision Making
Quality Planning Method Information Resources Supervision
/Control Total Average Consistency.
Decision Making
0.133 0.158 0.111 0.067 0.176 0.120 0.143 0.908 0.130 7.279
Quality 0.133 0.158 0.167 0.200 0.176 0.120 0.143 1.097 0.157 7.382
Planning 0.200 0.158 0.167 0.200 0.176 0.120 0.143 1.164 0.166 7.350
Method 0.133 0.053 0.056 0.067 0.059 0.040 0.143 0.550 0.079 7.180
Information 0.133 0.158 0.167 0.200 0.176 0.360 0.143 1.337 0.191 7.523
Resources 0.133 0.158 0.167 0.200 0.059 0.120 0.143 0.980 0.140 7.359
Supervision/Control
0.133 0.158 0.167 0.067 0.176 0.120 0.143 0.964 0.138 7.262
Total 1.000 1.000 1.000 1.000 1.000 1.000 1.000 Total 100% 51.335
λmax 7.334
CI 0.0556
RI 1.320
CR= CI/RI 0.043
Page 139
127
127
LEVEL 3
DECISION-MAKING
Parameter Use Visual Indicators
Decision at Construction Site
Take Decision Slowly, Implement them Quickly
Use Visual Indicators 1 0.5 0.5
Decision at Construction Site 2 1 2
Take Decision Slowly, Implement them Quickly
2 0.5 1
Total 5.000 2.000 3.500
Parameter Use Visual Indicators
Decision at Construction Site
Take Decision Slowly, Implement them Quickly
Total Average Consistency
Use Visual Indicators 0.200 0.250 0.143 0.593 20% 3.030
Decision at Construction Site 0.400 0.500 0.571 1.471 49% 3.078
Take Decision Slowly, Implement them Quickly
0.400 0.250 0.286 0.936 31% 3.053
Total 1.000 1.000 1.000 Total 100% 9.161
λmax 3.054
CI 0.027
RI = 0.580
CR= CI/RI 0.046
Page 140
128
128
LEVEL 3
QUALITY
Parameter Process
Evaluation Immediate
Problem Detection Systematic Procedures
Inspection & Enforcement
Process Evaluation
1 1 1 2
Immediate Problem Detection
1 1 3 1
Systematic Procedures
1 0.333 1 1
Inspection & Enforcement
0.5 1 1 1
Total 3.500 3.333 6.000 5.000
Parameter Process
Evaluation Immediate
Problem Detection Systematic Procedures
Inspection & Enforcement
Total Average Consistency
Process Evaluation
0.286 0.300 0.167 0.400 1.152 28.8% 4.174
Immediate Problem Detection
0.286 0.300 0.500 0.200 1.286 32.1% 4.281
Systematic Procedures
0.286 0.100 0.167 0.200 0.752 18.8% 4.177
Inspection & Enforcement
0.143 0.300 0.167 0.200 0.810 20.2% 4.229
Total 1.000 1.000 1.000 1.000 Total 100% 16.862
λmax 4.215
CI 0.072
RI = 0.900
CR= CI/RI 0.080
Page 141
129
129
LEVEL 3
PLANNING
Parameter Constraint Analysis
Root Cause Analysis
Look-ahead Planning
% of Planned Completed
Constraint Analysis
1 0.5 1 2
Root Cause Analysis
2 1 0.5 2
Look-ahead Planning
1 2 1 2
% of Planned Completed
0.5 0.5 0.5 1
Total 4.5 4 3 7
Parameter Constraint Analysis
Root Cause Analysis
Look-ahead Planning
% of Planned Completed
Total Average Consistency
Constraint Analysis
0.222 0.125 0.333 0.286 0.966 24.2% 4.111
Root Cause Analysis
0.444 0.250 0.167 0.286 1.147 28.7% 4.221
Look-ahead Planning
0.222 0.500 0.333 0.286 1.341 33.5% 4.244
% of Planned Completed
0.111 0.125 0.167 0.143 0.546 13.6% 4.165
Total 1.000 1.000 1.000 1.000 Total 100% 16.742
λmax 4.185
CI 0.062
RI 0.900
CR= CI/RI 0.069
Page 142
130
130
LEVEL 3
INFORMATION
Parameter Accurate
Information Clear
Specification Effective
Communication Detection of Incompatibility
& Discrepancy
Accurate Information 1 1 1 1
Clear Specification 1 1 1 3
Effective Communication 1 1 1 3
Detection of Incompatibility & Discrepancy
1 0.333 0.333 1
Total 4.000 3.333 3.333 8.000
Parameter Accurate
Information Clear
Specification Effective
Communication Detection of Incompatibility
& Discrepancy Total Average Consistency
Accurate Information 0.250 0.300 0.300 0.125 0.975 24.4% 4.103
Clear Specification 0.250 0.300 0.300 0.375 1.225 30.6% 4.204
Effective Communication 0.250 0.300 0.300 0.375 1.225 30.6% 4.204
Detection of Incompatibility & Discrepancy
0.250 0.100 0.100 0.125 0.575 14.4% 4.116
Total 1.000 1.000 1.000 1.000 Total 100% 16.627
λmax 4.157
CI 0.052
RI 0.900
CR= CI/RI 0.058
Page 143
131
LEVEL 3
METHOD
Parameter Team
Integration Concurrent Engineering
Standardization of Work Process
Team Integration 1 1 1
Concurrent Engineering 1 1 1
Standardization of Work Process
1 1 1
Total 3 3 3
Parameter Team
Integration Concurrent Engineering
Standardization of Work Process
Total Average Consistency
Team Integration 0.333 0.333 0.333 1.000 33.3% 3.000
Concurrent Engineering 0.333 0.333 0.333 1.000 33.3% 3.000
Standardization of Work Process
0.333 0.333 0.333 1.000 33.3% 3.000
Total 1.000 1.000 1.000 Total 100% 9.000
λmax 3.000
CI 0.000
RI = 0.580
CR= CI/RI 0.000
Page 144
132
LEVEL 3
SUPERVISION/CONTROL
Parameter Management
Support Transparency
Management Support
1 1
Transparency 1 1
Total 2 2
Parameter Management
Support Transparency Total Average Consistency
Management Support
0.500 0.500 1.000 50% 2.0000
Transparency 0.500 0.500 1.000 50% 2.0000
Total 1.000 1.000 Total 100% 4.0000
λmax 2.000
CI 0.000
RI = 0.000
CR= CI/RI 0.000
Page 145
133
LEVEL 3
RESOURCES
Parameter Resources Availability
Resources Leveling
Resources Availability
1 3
Resources Leveling
0.333 1
Total 1.333 4.000
Resources Availability
Resources Leveling
Total Average Consistency
Resources Availability
0.750 0.750 1.500 75.0% 2.000
Resources Leveling
0.250 0.250 0.500 25.0% 2.000
Total 1.000 1.000 Total 100% 4.000
λmax 2.000
CI 0.000
RI = 0.000
CR = CI/RI
Not Applicable
Page 146
134
References
Ahmed, S., and Forbes, L. (2011). Modern Construction: Lean Project Delivery and
Integrated Practices. CRC Press, New York, NY.
Antillon, E. I. (2010). "A research synthesis on the Interface between lean construction
and safety management," thesis, presented to University of Colorado, CO, in partial
fulfillment of the requirements for the degree of Master of Civil Engineering.
Aziz, R. F., and Hafez, S. M. (2013). "Applying lean thinking in construction and
performance improvement." Alexandria Engineering Journal, 52(4), 679-695.
Bunruamkaew, K. (2012). "How to do AHP analysis in excel." Division of Spatial
Information Science Graduate.
Cervone, H. Frank (2014),"Effective communication for project success." OCLC Systems
and Services: International digital library perspectives, 30(2), 74 - 77
Formoso, C. T., Hirota, E. H., and Isatto, E. L. (1999). "Method for waste control in the
building industry." Proceedings IGLC-7, 325 - 334.
Goepel, K. D. (2013). "Principia Mathematica Decernendi." Business Performance
Management, <http://bpmsg.com/ahp-introduction/> (Feb. 24,2015)
Hasan, S. W. (2010). "Evaluation of project delivery methods for trenchless construction,"
thesis, presented to The University of Texas at Arlington, TX, in partial fulfillment of the
requirements for the degree of Master of Civil Engineering.
Hardscape (n.d). Wikipedia the Free Encyclopedia, <http://en.wikipedia.org/wiki/ Hardscape> (Jan. 10, 2015)
Hosseini, S., Nikakhtar, A., Wong, K., and Zavichi, A. (2012). "Implementing Lean Construction Theory into Construction Processes' Waste Management." International Conference on Sustainable Design and Construction.
Jones, M. (2009). "An analysis of the impact on information systems on the level of trust
in the construction industry," thesis, presented to Walden University, online learning, in
partial fulfillment of the requirements for the degree of Doctor of Philosophy.
Maurer, R. (2001). "An alternative project delivery method for fast-tracked municipal construction projects." Project Management Institute, <http://www.pmi.org/learning/ project-delivery-method-municipal-construction-7833> (Feb. 15, 2015).
Odomirok, P. (2015). "Lean green belt." Institute of Industrial Engineers, <http://www.iienet.org> (April 10,2015).
Page 147
135
Perera, N., and Sustrina, M. (2011). "The use of analytic hierarchy process (AHP) in the analysis of delay claims in construction projects in the UAE." The Built & Human Environment Review, 3(1), 29-48.
Saaty, T. L. (1980). The analytical hierarchy process: planning, priority setting, resource
allocation. McGraw-Hill, New York.
Saaty, T. L. (1982). Decision Making for Leaders: The analytical hierarchy process for decisions in a complex world. Lifetime Learning Publications, Belmont, CA. Saaty, T. L. (2009). Theory and Applications of the Analytic Network Process – Decision making with benefits, opportunities, costs, and risks. RWS Publications, Pittsburgh, PA. Senaratne, S., and Wijesiri, D. (2008). "Lean construction as a strategic option: testing its suitability and acceptability in Sri Lanka." Lean Construction Journal, 34-48. Stevens, M. (2014). "Construction Productivity in Decline." The Magazine for Professional Engineers, 13. "Tree Swing Pictures." Businessballs.com, <www.businessballs.com/treeswing. htm> (Dec. 8, 2014).
Page 148
136
Biographical Information
Yasir Abdelrazig earned his Bachelor’s of Science Engineering Degree in
Construction Engineering Technology from University of North Texas (UNT) in 2013.
While pursuing his undergraduate studies, he started a Fast-Track graduate program in
Construction Management at UNT. Abdelrazig maintained a strong academic standing
and decided to pursue his Master’s in the area of Construction Engineering and
Management at the University of Texas at Arlington (UTA) in 2013.
Abdelrazig has been the recipient of numerous honors and awards from
prestigious organizations, including TEXO Education and Research Foundation
Scholarship and The Association of General Contractors (AGC) Education and Research
Foundation Scholarship. Furthermore, he serves as an Exceptional Engineers Tutor at
UNT Learning Center.
While earning his Master’s Degree, Abdelrazig participated in the Institute of
Industrial Engineers (IIE) - Construction Division International Student Paper
Competition, and his paper was selected as second place in the competition. Abdelrazig
serves as Student Liaison of the Construction Division at the Institute of Industrial
Engineers. In addition, he awarded the Lean Greenbelt Certification.
Abdelrazig represented UTA at the American Society of Civil Engineers (ASCE)
Student Competition in the ASCE’S Pipelines Conference, August 3-6, 2014 in Portland,
Oregon.