37
Using Lean to Engage Employees and Delight Customers Cindy Swank ASQ Charlotte: Quality Conference of the Carolinas April 2015
| Date post: | 24-Dec-2015 |
| Category: |
Documents |
| Upload: | jason-jones |
| View: | 214 times |
| Download: | 0 times |

Using Lean to Engage Employees andDelight Customers
Cindy SwankASQ Charlotte: Quality Conference of the CarolinasApril 2015

2
Service Value Commitment - A way of life
Virtuous Cycle
More engaged employees
Increased productivity, efficiency and enhanced service
value to customers
Greater customer success and loyalty drive more business
Greater financial flexibility
Financial resource allocation:- Shareholders- Customers - Employees
- Comp/Rewards- Employee Selection- Work Environment
- Process Design- Job Design- Training- Employee Tools
Investment in:
Without a linkage to strategy, lean is viewed as just another exercise in management by best seller.
3
ENGAGING EMPLOYEES

4
To begin, one must have a sense of urgency
It’s hard to get people to change without a burning platform
People are reluctant to move outside of their comfort zone
There is almost a natural law that people will gravitate back to where they were before the change
Change of any kind is scary and unsettling
Creating awareness and desire first, leads to sustainability. Check out the ADKAR change model for more information.
5
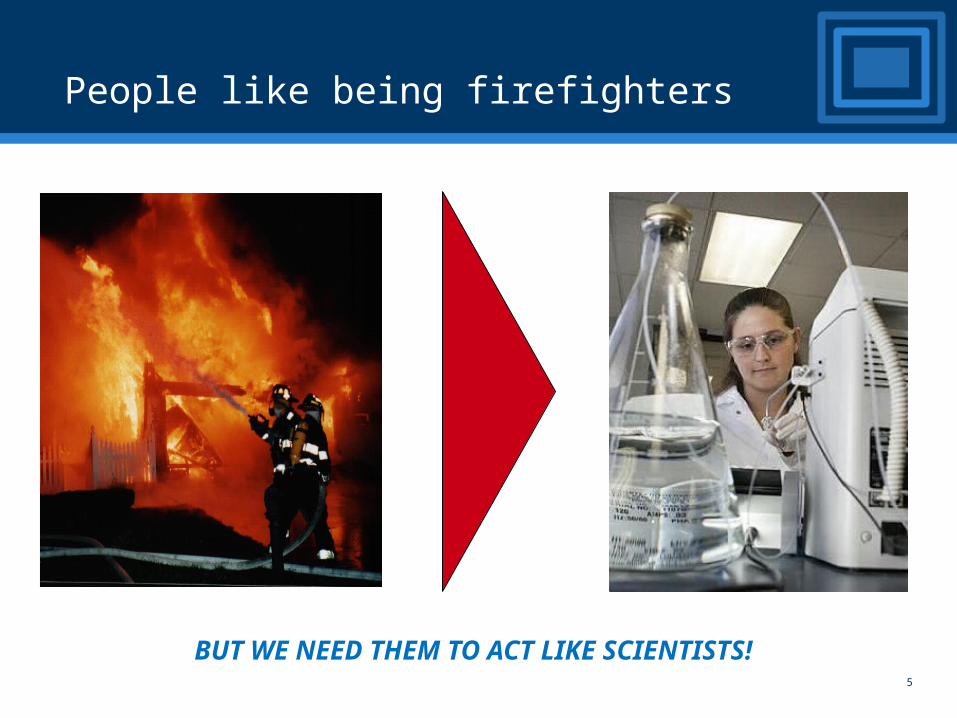
People like being firefighters
BUT WE NEED THEM TO ACT LIKE SCIENTISTS!

6
Making problems visible sounds good in theory
IS THIS REALLY WHAT THEY MEANT???

7
People learn a much different approach early in life
8
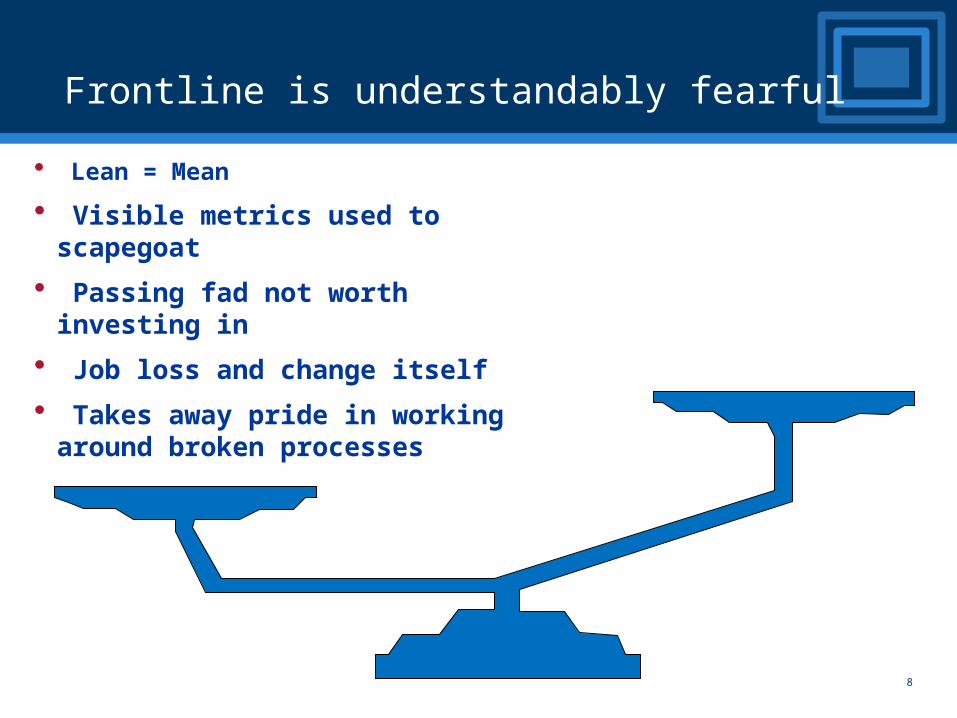
Frontline is understandably fearful
• Lean = Mean
• Visible metrics used to scapegoat
• Passing fad not worth investing in
• Job loss and change itself
• Takes away pride in working around broken processes

9
•Regular meetings with management ensure voice in change process
•Suggestions incorporated to improve process
• Ideas rewarded not recovery efforts
•White boards make individual contributions visible
But they quickly embrace empowerment
10
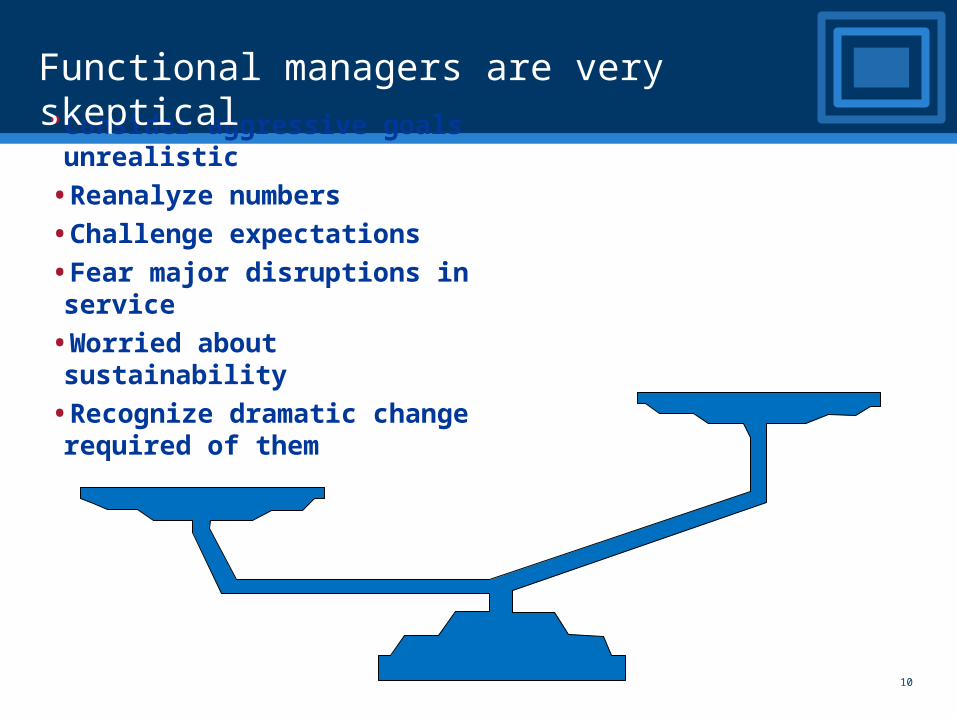
•Consider aggressive goals unrealistic
•Reanalyze numbers
•Challenge expectations
•Fear major disruptions in service
•Worried about sustainability
•Recognize dramatic change required of them
Functional managers are very skeptical

11
• Proves goals are attainable
• Visible to all
• Changeable on the fly
• Minimizes impact
• Offers opportunity to practice
• Results in positive feedback
Pilots or model cells reduce manager’s concerns
12
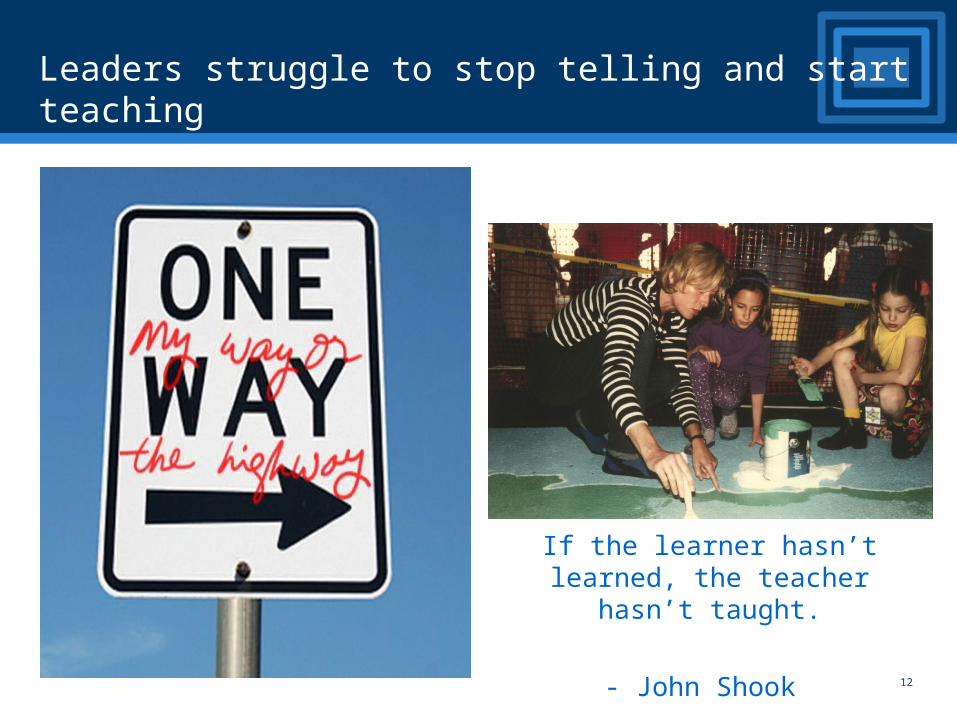
Leaders struggle to stop telling and start teaching
If the learner hasn’t learned, the teacher hasn’t taught.
- John Shook

13
Great coaches constantly pace the sidelines, evaluate performance, review stats,
watch the clock, make adjustments and talk to their players.
It’s a whole new game!
Comparing lean leaders to coaches helps

14
“We’re o.k.” ConvictionAwareness Courage Action
“Someone ought to do something about…”
“We could fix it if we…”
“If I had my way, I would…”
“I said it would work, didn’t I?”
Inform on situation,make problems
visible
Acting as a trusted advisor makes achieving buy-in easier
Evaluate options,solicit ideas
Build commitment,remove barriers
Give incentives,praise successes
TrustedAdvisor
Role

15
Recognize that your loudest critics usually become your
most fervent disciples
Point to Ponder
16
CASE STUDY
NEW BUSINESS APPLICATIONSHow to Delight Your Biggest Customer
While Engaging Employees

17
Started by creating a value stream map in a crunch

18
The next more “portable” iteration

19
Using root-cause problem solving techniques, the team identified many opportunities for improvement
Scan, Index
App Data Entry
Exam Ordered
First Review
Order Addl’ Reqs
UW CM Review
Call Out Offer
Final Action/Issue
SF Agent Customer
3 Days1 Day
0 Days 22 Days7 Days
5 Days1 Day
42 Days9 Days
Exam Results
12 Days0 Days
8 5116
State Farm DSO Improvement Value Stream Map
Application is confusingHigh Not In Good Order rate
Often difficult to schedule
Lab/ExamOrdered
ScheduledAppt
Exam Occurs
Exam/LabsResults
8 Days0 Days
5-6 Days2 Days
10 Days5 Days
22-23 Days7 Days
66 24 27
1st APS Ordered
1st APS Received
18 Days9 Days
2 46
EXAM PROCESS DETAIL34% Have APS Ordered
Reduce to 1 day
“Linked” case signals work required
Visual tray system moves cases in real
time
Agent schedules
exam
Work w/ vendor to
reduce time
Eliminate complex
cases from speed
Core and speed desk have similar process and process
performance
Refine Speed selection criteria CM approves
for issue on clean cases
Core aggressively
track and resolve
Autoissue clean cases
X
XX
X
Simplify App/eApp
IMPROVEMENT VALUE STREAM MAP
20
Scan, Index
App Data Entry
First Review
Order Addl’ Reqs
CM Review
Call Out Offer
Final Action/Issue
SF Agent Customer
1 Day 0 Days 7 Days 1 Day 9 Days
Exam Results
0 Days
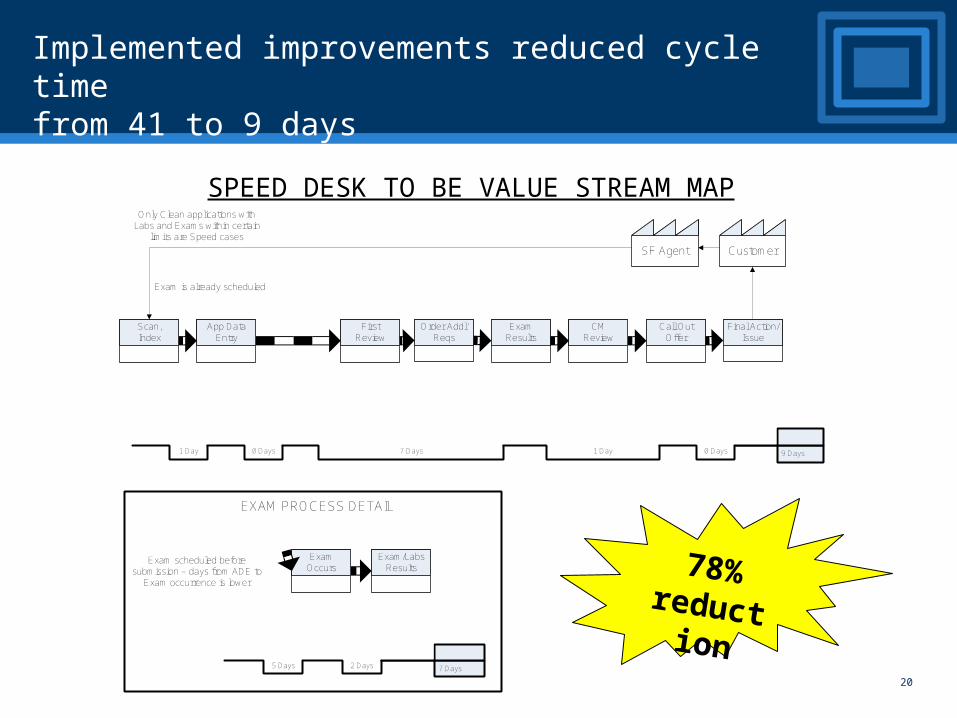
State Farm SPEED TO BE Value Stream Map
Exam Occurs
Exam/LabsResults
2 Days5 Days 7 Days
EXAM PROCESS DETAIL
Only Clean applications with Labs and Exams within certain
limits are Speed cases
Exam is already scheduled
Exam scheduled before submission – days from ADE to
Exam occurrence is lower
SPEED DESK TO BE VALUE STREAM MAP
Implemented improvements reduced cycle time from 41 to 9 days
78%reduction
21
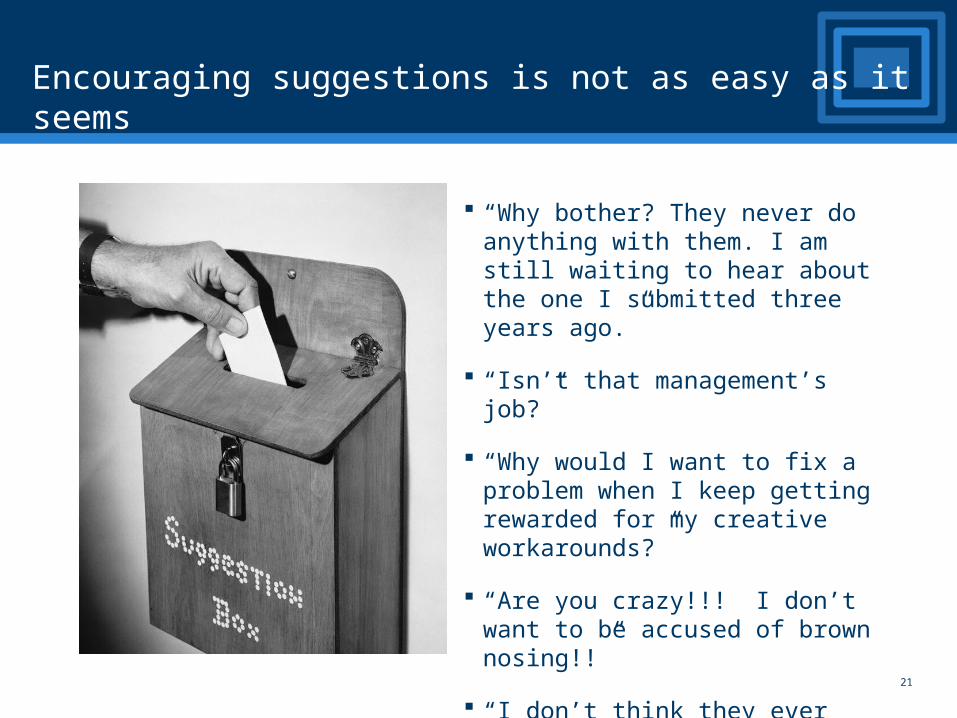
Encouraging suggestions is not as easy as it seems
“Why bother? They never do anything with them. I am still waiting to hear about the one I submitted three years ago.”
“Isn’t that management’s job?”
“Why would I want to fix a problem when I keep getting rewarded for my creative workarounds?”
“Are you crazy!!! I don’t want to be accused of brown nosing!!”
“I don’t think they ever check the box. And by the way, do you know why the box is locked?”
22
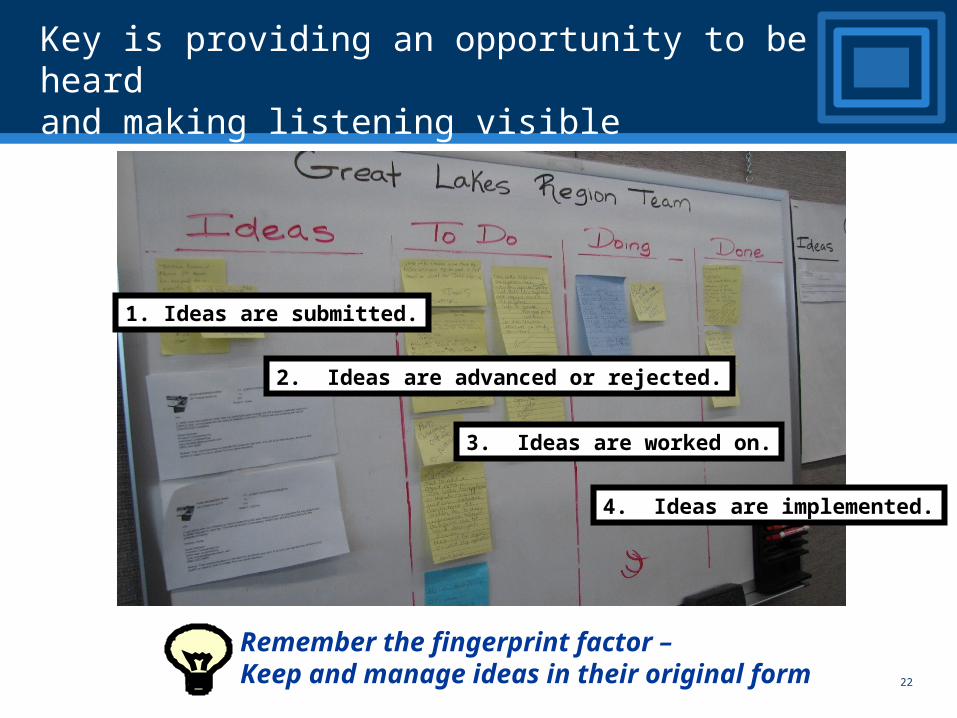
Key is providing an opportunity to be heard and making listening visible
3. Ideas are worked on.
1. Ideas are submitted.
2. Ideas are advanced or rejected.
4. Ideas are implemented.
Remember the fingerprint factor – Keep and manage ideas in their original form

23
Case Manager
Huddle Area
Manager
Daily Metrics
Visual Controls
Underwriter
Team Idea Board
The team quickly saw the benefits of moving from sitting in functional areas to being organized as a team
24
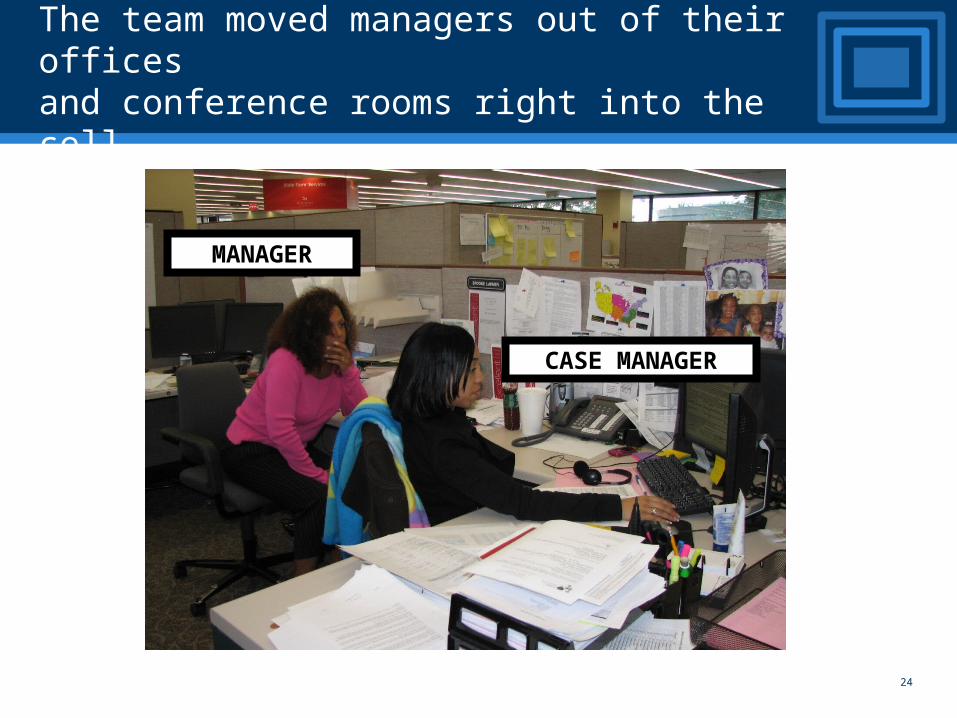
The team moved managers out of their offices and conference rooms right into the cell
MANAGER
CASE MANAGER

25
The team implemented ways to make a previously invisible process and status available for all to see

26
Simple visual metrics drove team root cause problem solving daily
“Society has reached the point where one can push a button and be immediately deluged with technical and managerial information. This is all very convenient, of course, but if one is not careful there is a danger of losing the ability to think. We must remember that in the end it is the individual human being who must solve the problems.
-- Eiji Toyoda, Toyota Motor Corporation, 1983

27
As employee ideas were implemented real improvement emerged
0%
10%
20%
30%
40%
50%
60%
70%
80%
90%
100%
6/20 7/18 8/15 9/19 10/17 11/21 12/19 1/16 2/13
0-22 Days 23-40 Days 41-60 Days 61-90 Days
% o
f C
as
es
Is
su
ed
Percentage of Cases Issued by Days Started implementing lean
28
0 500 1,000 1,500 2,000 2,500 3,000 3,500
1/26 (Week 4)
12/29 (Week 52)
11/28 (Week 48)
10/31 (Week 44)
9/26 (Week 37)
7/23 (Week 30)
6/3 (Week 22)
5/7 (Week 19)
4/7 (Week 15)
3/14 (Week 11)
2/21 (Week 8)
1/16 (Week 3)
0-20 Days 21-30 Days 31-40 Days 41+ Days
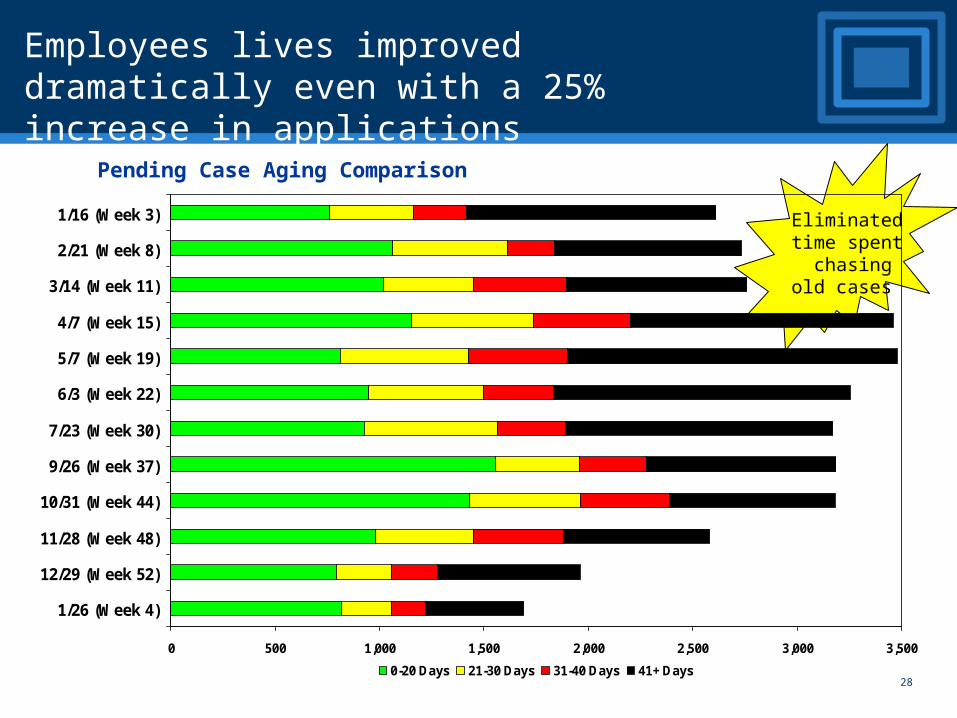
Employees lives improved dramatically even with a 25% increase in applications
Pending Case Aging Comparison
Eliminated time spent chasing old cases
29
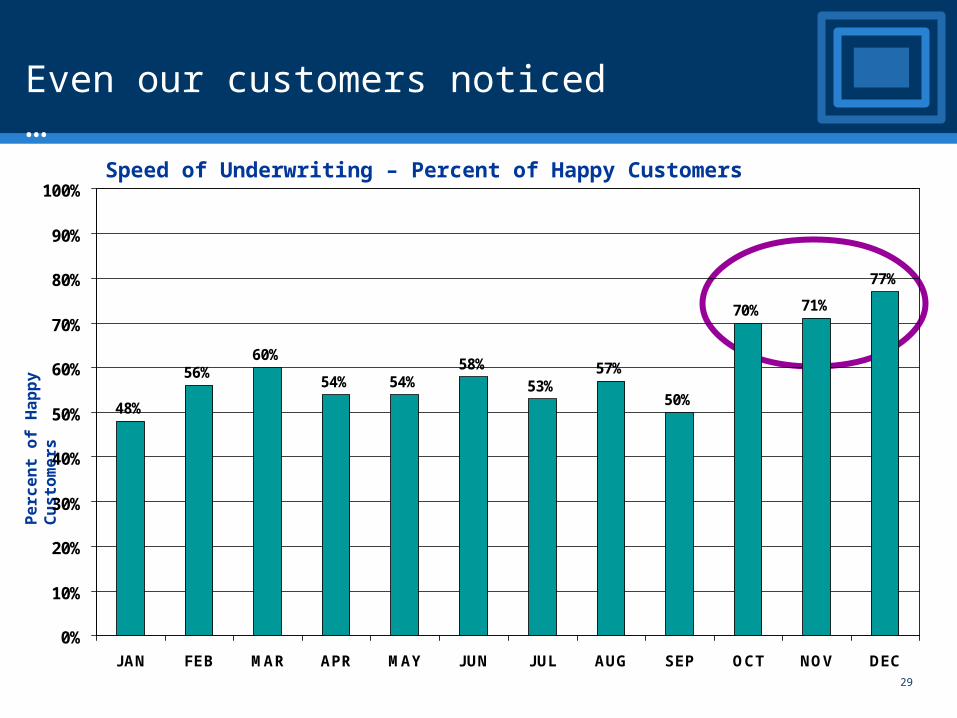
Even our customers noticed …
48%
56%60%
54%58%
53%57%
50%
70% 71%
77%
54%
0%
10%
20%
30%
40%
50%
60%
70%
80%
90%
100%
JAN FEB MAR APR MAY JUN JUL AUG SEP OCT NOV DEC
Speed of Underwriting – Percent of Happy Customers
Pe
rce
nt
of
Ha
pp
y
Cu
sto
me
rs
30
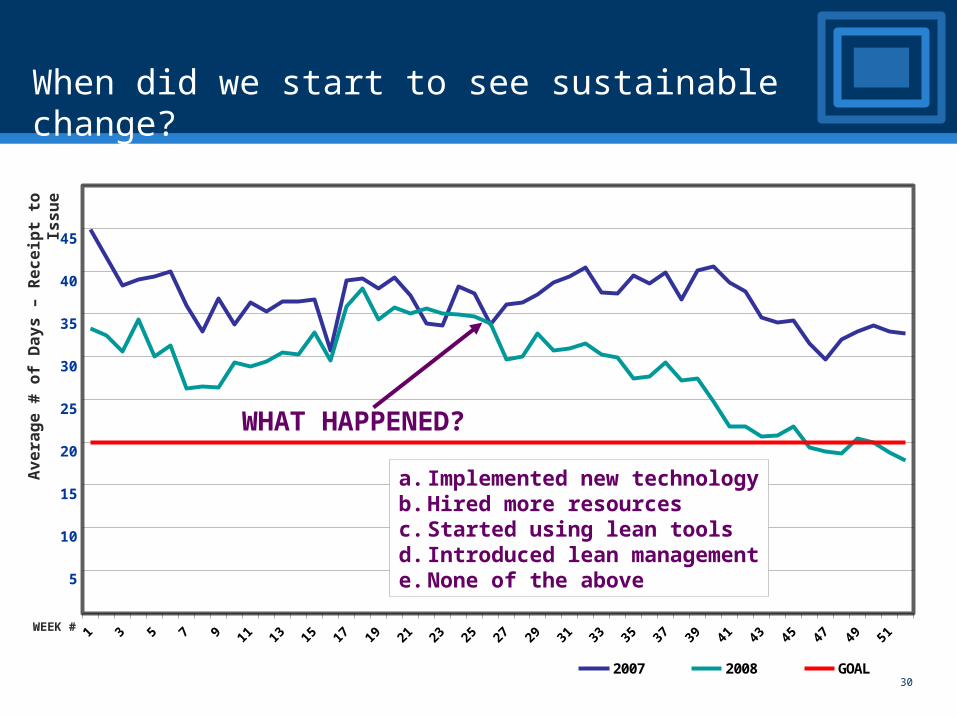
When did we start to see sustainable change?
1 3 5 7 9 11 13 15 17 19 21 23 25 27 29 31 33 35 37 39 41 43 45 47 49 51
2007 2008 GOAL
Av
era
ge
# o
f D
ay
s –
Re
ce
ipt
to I
ss
ue
WEEK #
WHAT HAPPENED?
a. Implemented new technologyb. Hired more resourcesc. Started using lean toolsd. Introduced lean managemente. None of the above
45
40
35
30
25
20
15
10
5

31
PUTTING IT ALL TOGETHER
32
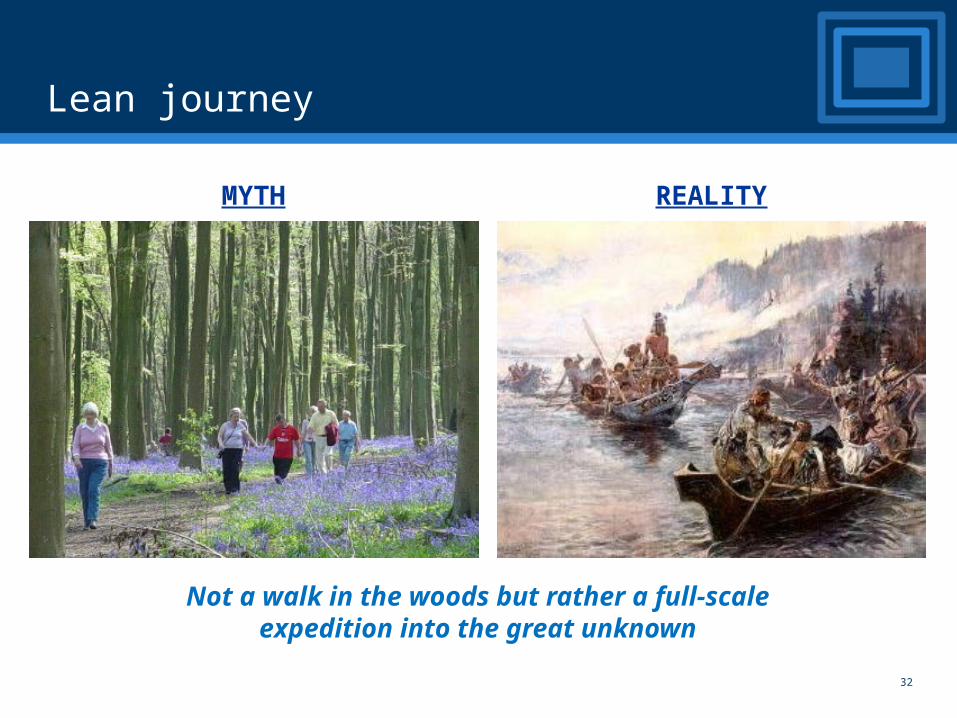
Lean journey
Not a walk in the woods but rather a full-scale expedition into the great unknown
REALITYMYTH
33
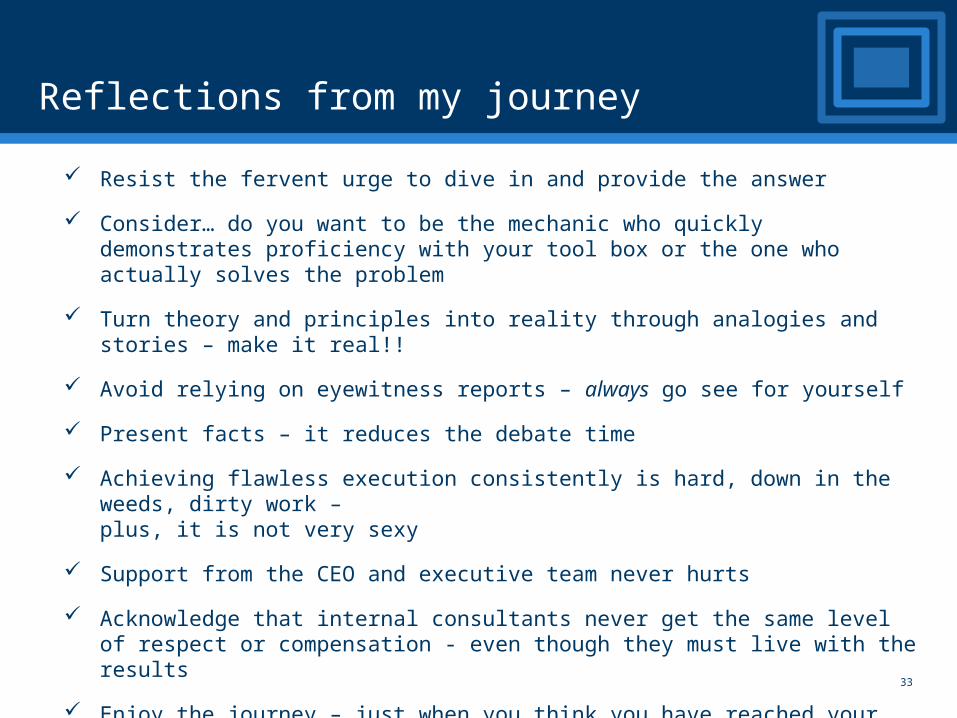
Reflections from my journey
Resist the fervent urge to dive in and provide the answer
Consider… do you want to be the mechanic who quickly demonstrates proficiency with your tool box or the one who actually solves the problem
Turn theory and principles into reality through analogies and stories – make it real!!
Avoid relying on eyewitness reports – always go see for yourself
Present facts – it reduces the debate time
Achieving flawless execution consistently is hard, down in the weeds, dirty work – plus, it is not very sexy
Support from the CEO and executive team never hurts
Acknowledge that internal consultants never get the same level of respect or compensation - even though they must live with the results
Enjoy the journey – just when you think you have reached your destination, you realize how much farther you need to go

34
If a solution doesn’t make you a bit uneasy, then ask yourself
if you have pushed hard enough.
And finally
35
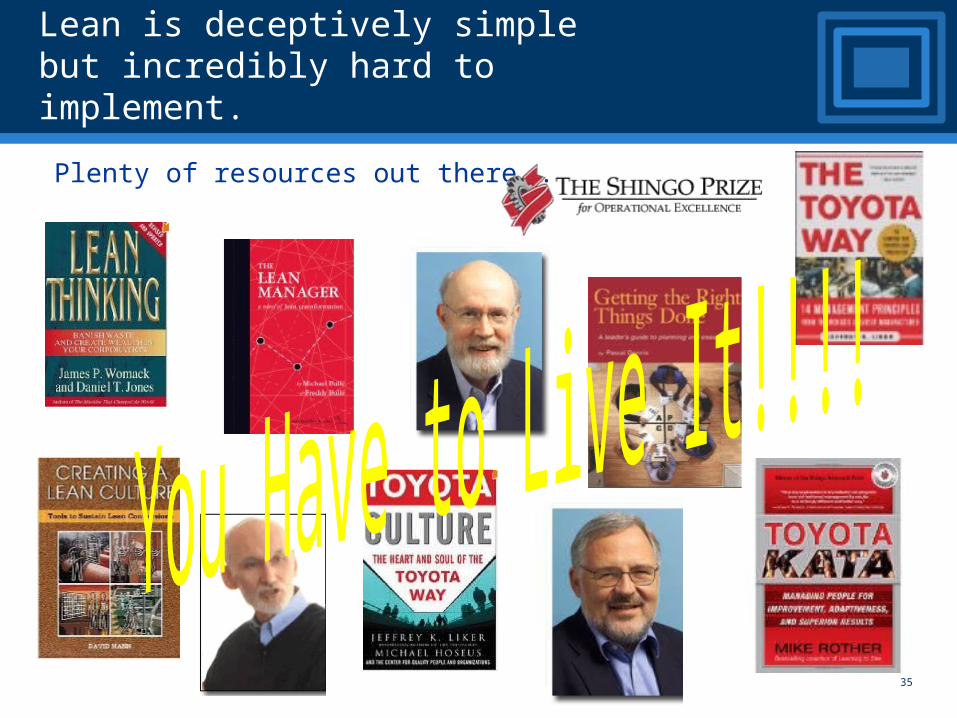
Lean is deceptively simple but incredibly hard to implement.
Plenty of resources out there …

36
We Must Think From The Customer’sPerspective When Determining Value!
And just for fun…

37
Thank You!!!!
For more information please contact me at:


