Using multi criteria decision analysis to estimate relative drug risks and harms Prof. David Nutt FMedSci Edmond J Safra Prof of Neuropsychopharmacology Imperial College London Chair ISCD drugscience.org.uk [email protected]
Transcript
Using multi criteria decision analysis to estimate relative drug risks and harms
Prof. David Nutt FMedSci Edmond J Safra Prof of Neuropsychopharmacology
Imperial College London Chair ISCD drugscience.org.uk
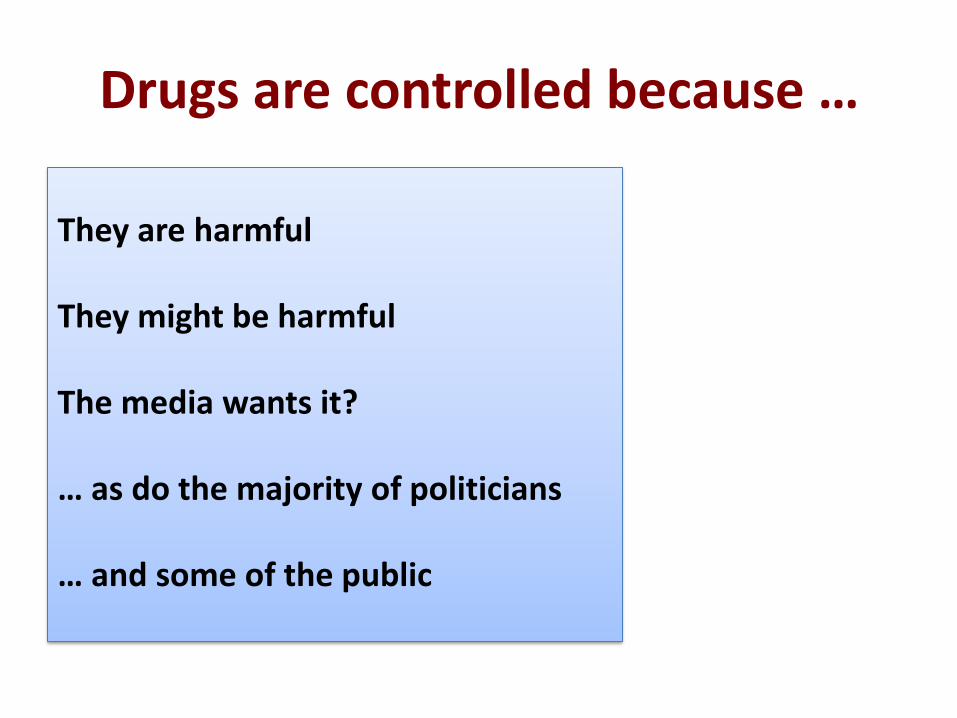
They are harmful They might be harmful The media wants it? … as do the majority of politicians … and some of the public
So getting the best estimate of harms is vital
But difficult
• Poor data on existing controlled drugs because illegality covert use
• And less for new entrants to the field, “legal highs”
4 key issues
1. Relative harms of drugs - and comparisons with alcohol and tobacco
2. Comparative harms –v- other risky activities
1. Proportionality of penalties cf health harms
2. Benefit-harm equation of the law?
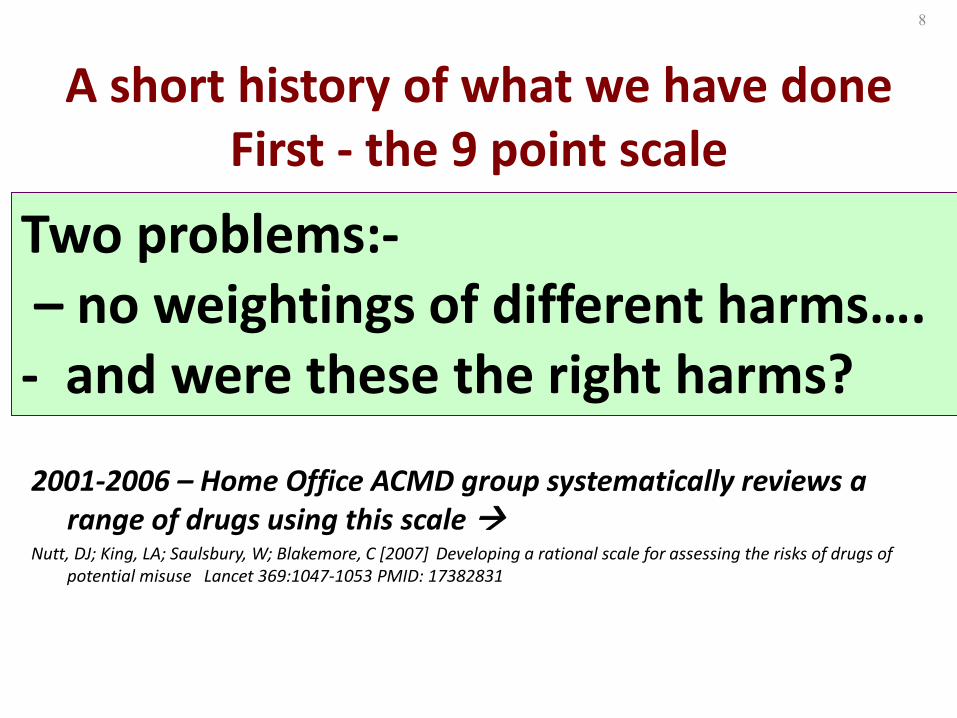
A short history of what we have done First - the 9 point scale
2000 Runciman report: develop the 9 point harm assessment scale Drugs and the Law: Report of the Independent Inquiry into the Misuse of Drugs Act 1971.
Members of Inquiry: Viscountess Runciman (Chairman), A Chesney, R Fortson, J Hamilton PQPM, S Jenkins, A Maynard, L G Murray, DJ Nutt, D O’Connor QPM, G Pearson, I Wardle, B Williams, A Zera. Report published in 2000.
2001-2006 – Home Office ACMD group systematically reviews a range of drugs using this scale
Nutt, DJ; King, LA; Saulsbury, W; Blakemore, C [2007] Developing a rational scale for assessing the risks of drugs of potential misuse Lancet 369:1047-1053 PMID: 17382831
5
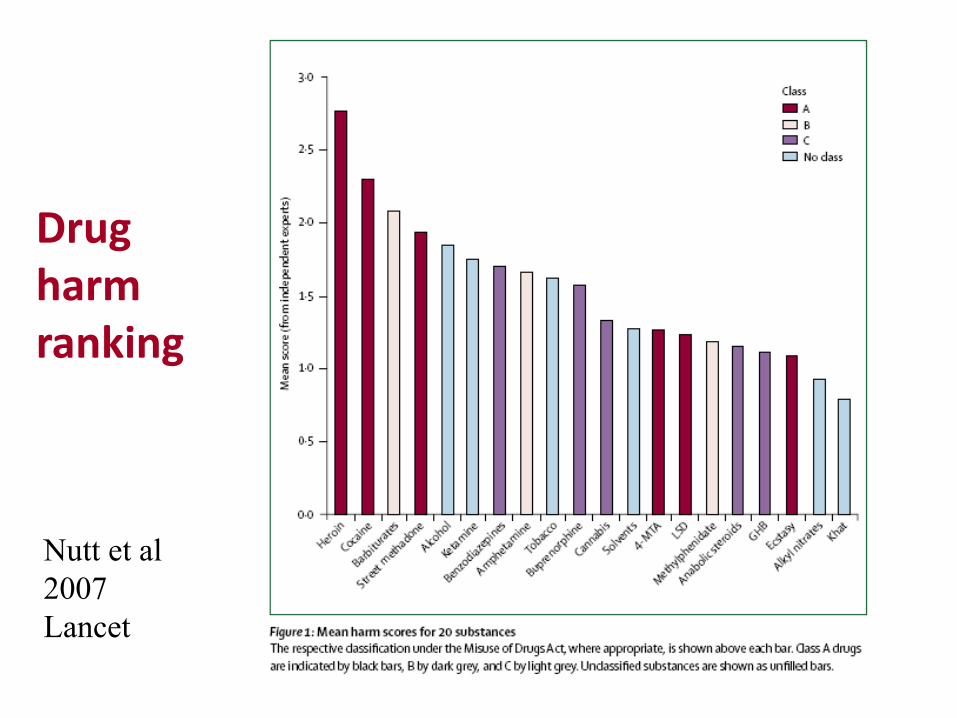
The nine point scale
Drug harm ranking
Nutt et al
2007
Lancet
A short history of what we have done First - the 9 point scale
2000 Runciman report: develop the 9 point harm assessment scale Drugs and the Law: Report of the Independent Inquiry into the Misuse of Drugs Act 1971.
Members of Inquiry: Viscountess Runciman (Chairman), A Chesney, R Fortson, J Hamilton PQPM, S Jenkins, A Maynard, L G Murray, DJ Nutt, D O’Connor QPM, G Pearson, I Wardle, B Williams, A Zera. Report published in 2000.
2001-2006 – Home Office ACMD group systematically reviews a range of drugs using this scale
Nutt, DJ; King, LA; Saulsbury, W; Blakemore, C [2007] Developing a rational scale for assessing the risks of drugs of potential misuse Lancet 369:1047-1053 PMID: 17382831
8
Two problems:- – no weightings of different harms…. - and were these the right harms?
March & June 2009 ▫Medical Research Council and
Home Office co-sponsor research project ▫ Advisory Council on the Misuse of Drugs, (ACMD),
David Nutt as Chair, meets to develop an MCDA model and to test its potential for evaluating drug harms
9
July 2010 ▫ ACMD publishes the MCDA framework developed
in 2009 ▫ http://www.homeoffice.gov.uk/publications/drugs/acm
• The most harmful drug on each criterion was scored at 100.
• All other drugs were scored relative to that drug.
• E.g., a drug considered half as harmful was given a score of 50.
• This creates a unique ratio scale for each criterion.
100 ┬ Most harm
┤
80 ┤
┤
60 ┤
┤
40 ┤
┤
20 ┤
┤
0 ┴ No harm
26
27
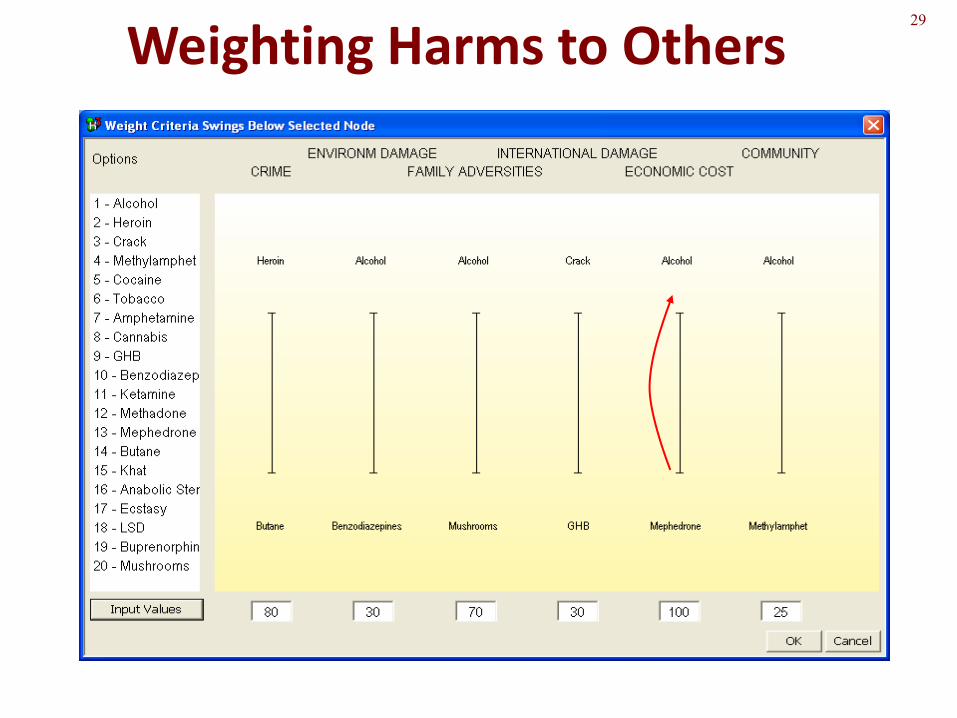
Weighting the criteria
• Some criteria represent more harm than others.
• Swing-weights equate the units of harm on all the criteria: the swing in harm from the ‘no harm’ drug on a criterion to the ‘most harmful’.
• The group considered this question to compare the levels of ‘most harm’ on the criteria:
– “How big is the difference in harm and how much do you care about that difference?”
100 ┬ Most harm
┤
80 ┤
┤
60 ┤
┤
40 ┤
┤
20 ┤
┤
0 ┴ No harm
28
29
Weighting Harms to Others
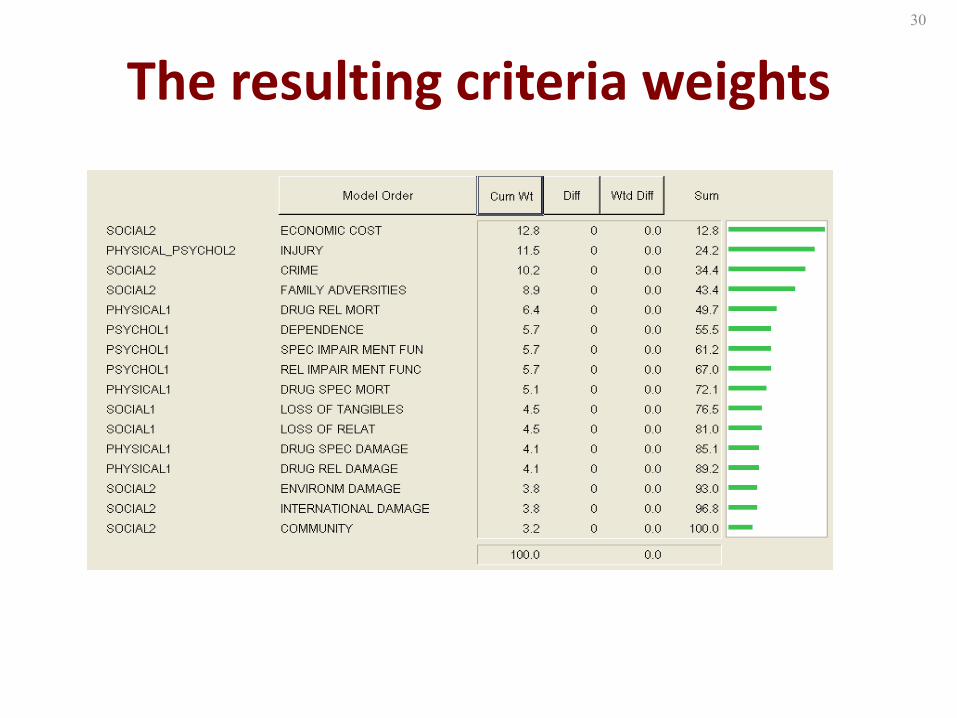
The resulting criteria weights
30
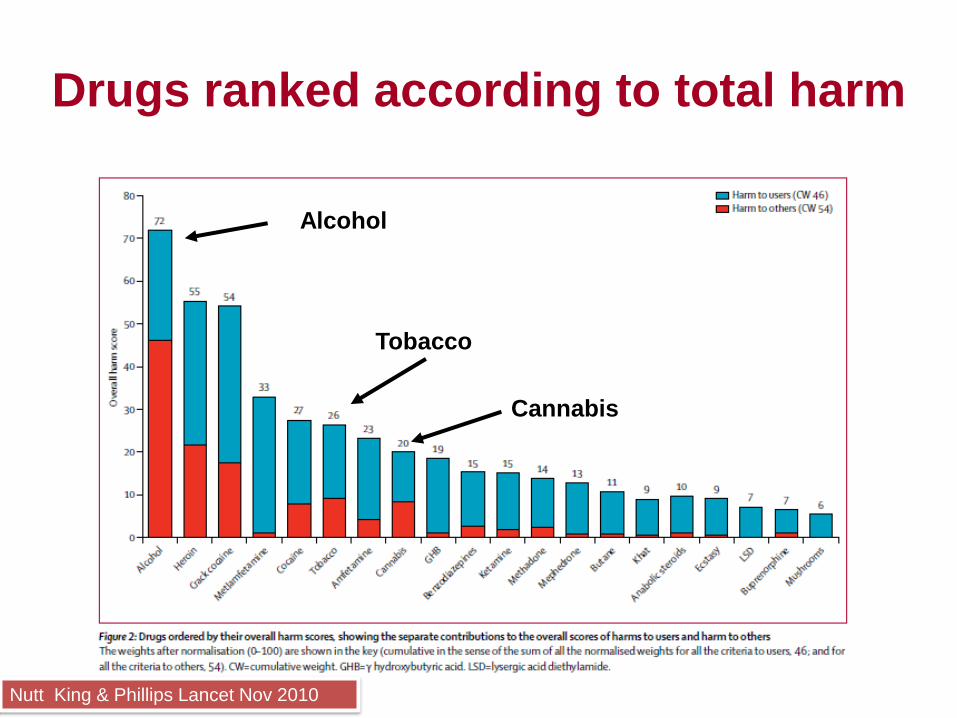
Drugs ranked according to total harm
Nutt King & Phillips Lancet Nov 2010
Alcohol
Cannabis
Tobacco
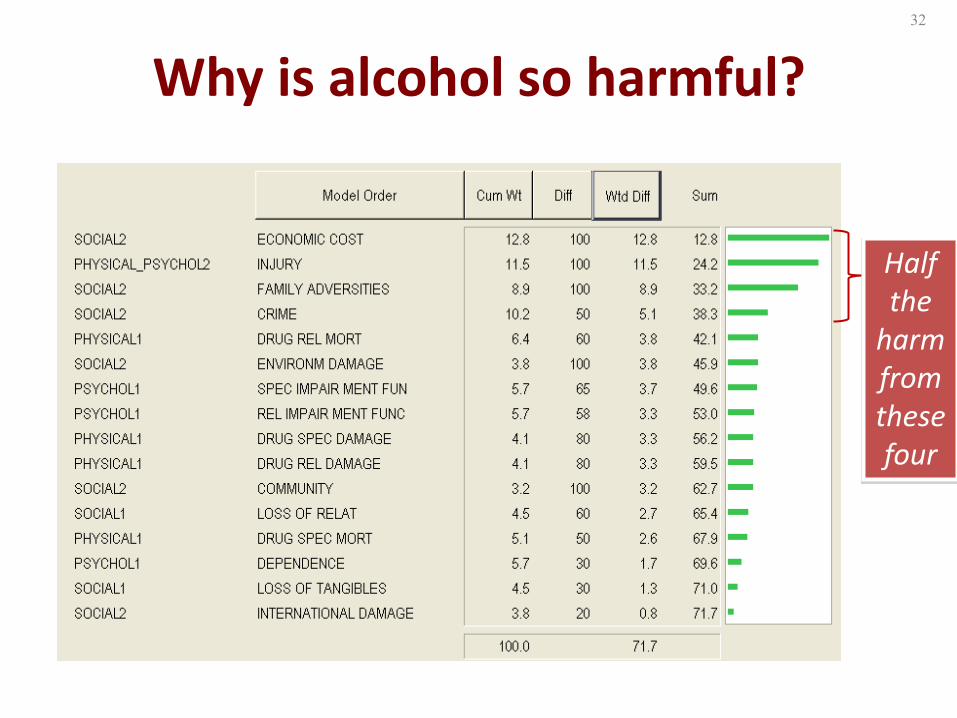
Why is alcohol so harmful? 32
Half the
harm from these four
Correlations of ISCD scores with...
...van Amsterdam population
0
1
2
3
0 20 40 60 80
VA
po
pu
lati
on
res
ult
s
ISCD results
exponential r = 0.88
...van Amsterdam individual
0
1
2
3
0 20 40 60 80
VA
ind
ivid
ual
res
ult
s
ISCD results
linear r = 0.83
exponential r = 0.91
33
linear r = 0.84
Reference: van Amsterdam, J. G. C., Opperhuizen, A., Koeter, M., & van den Brink, W. (2010). Ranking the harm of alcohol, tobacco and illicit drugs for the individual and the population. European Addiction Research, 16, 202-207.
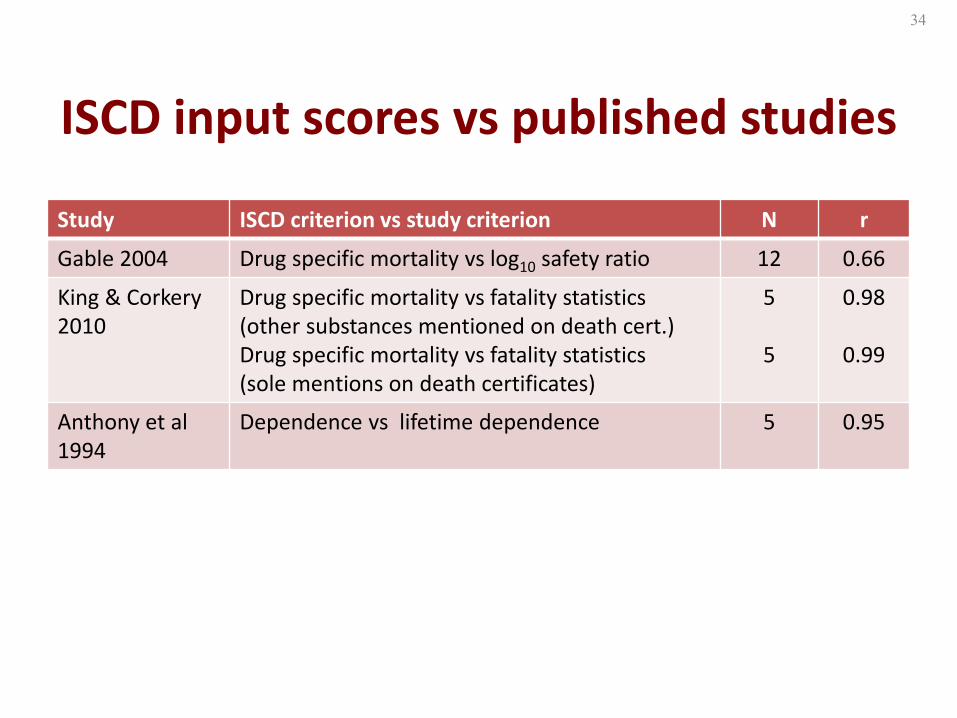
ISCD input scores vs published studies
Study ISCD criterion vs study criterion N r
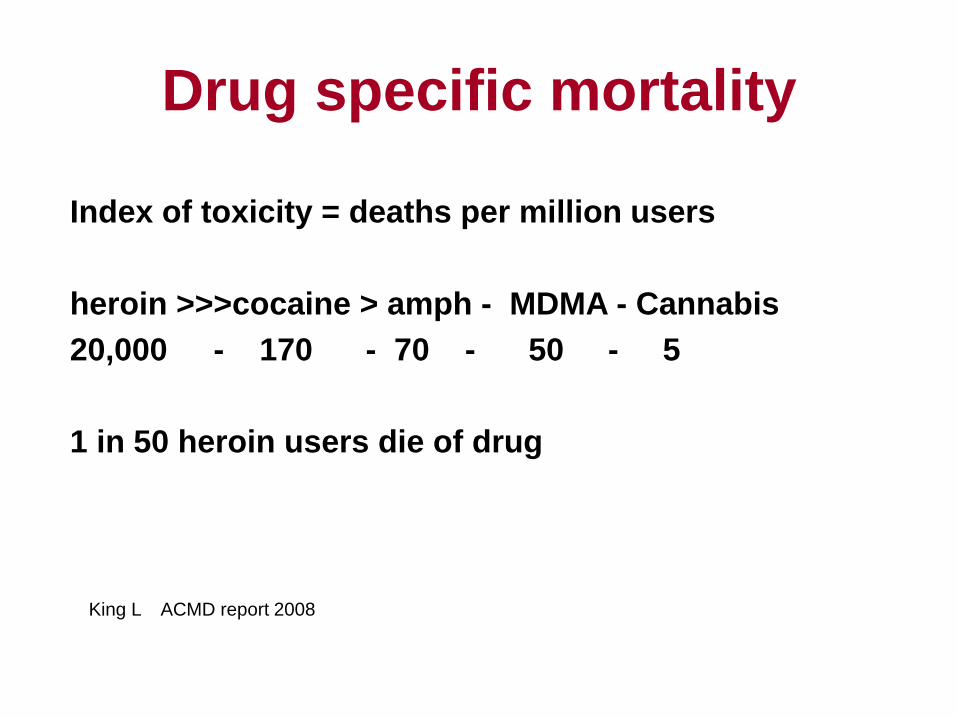
Gable 2004 Drug specific mortality vs log10 safety ratio 12 0.66
King & Corkery 2010
Drug specific mortality vs fatality statistics (other substances mentioned on death cert.) Drug specific mortality vs fatality statistics (sole mentions on death certificates)
5
5
0.98
0.99
Anthony et al 1994
Dependence vs lifetime dependence 5 0.95
34
No correlation of UK Drugs Act classification with ISCD results
35
0
1
2
3
4
5
0 20 40 60 80
UK
Dru
gs
Act
cla
ssif
icat
ion
ISCD results
A
C
B
U
linear r = 0.04
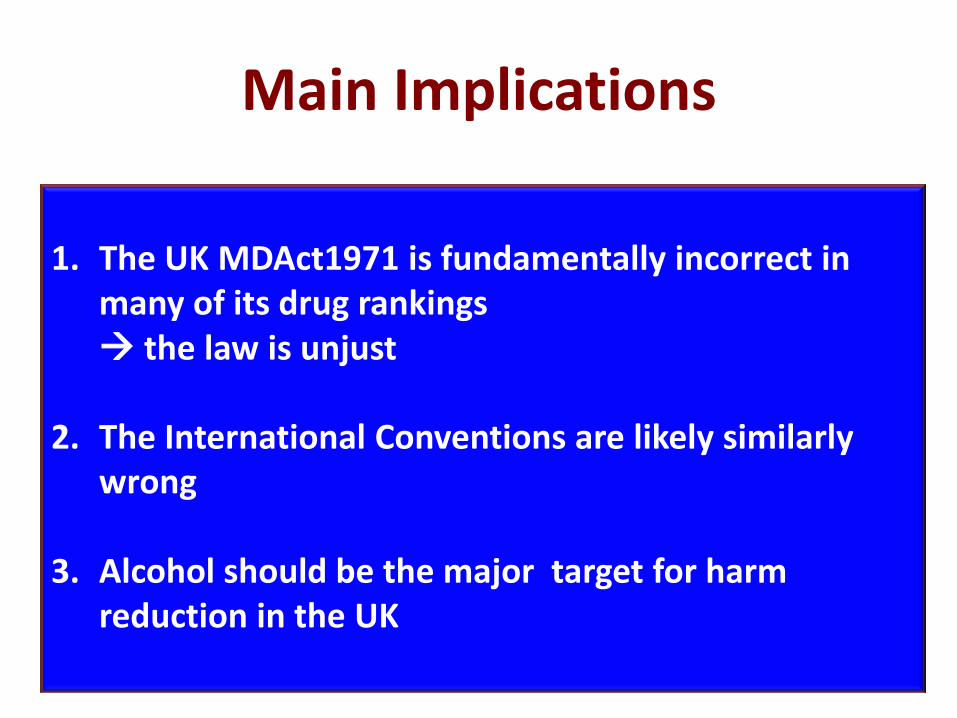
Main Implications
1. The UK MDAct1971 is fundamentally incorrect in
many of its drug rankings the law is unjust
2. The International Conventions are likely similarly
wrong
3. Alcohol should be the major target for harm reduction in the UK
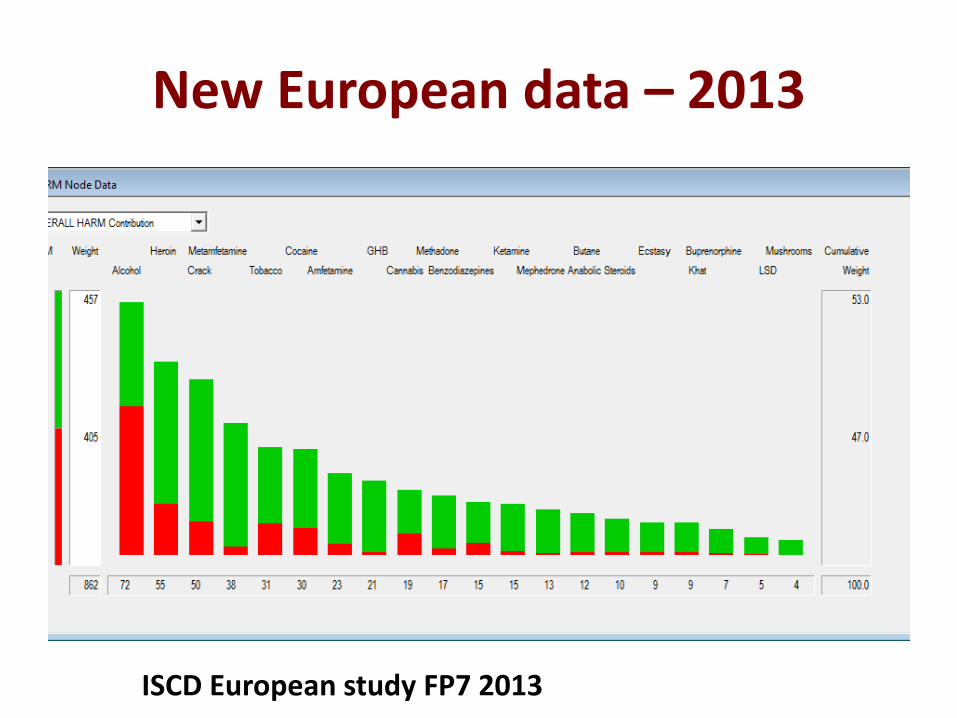
What about other countries?
EU funded European study 30 experts from 20 countries – May 2013 MCDA on same 20 drugs as UK experts
New European data – 2013
ISCD European study FP7 2013
Looking at different formulations of the same drug
Nicotine – tobacco –v- other delivery systems e.g. electronic cigarettes and gum/patches