Tongji University Meritorious Winner Administered by With support from Certificate of Achievement ® Lingjun Zhou Yunhao Zhang Zhihao Li Long Meng Interdisciplinary Contest In Modeling Be It Known That The Team Of With Faculty Advisor Of Was Designated As D. Chris Arney, Contest Director 2014 Tina R. Hartley, Head Judge
Transcript
Tongji University
Meritorious Winner
Administered by
With support from
Certificate of Achievement®
Lingjun Zhou
Yunhao ZhangZhihao Li
Long Meng
Interdisciplinary Contest In Modeling
Be It Known That The Team Of
With Faculty Advisor
Of
Was Designated As
D. Chris Arney, Contest Director
2014
Tina R. Hartley, Head Judge
For office use onlyT1T2T3T4
Team Control Number
24266Problem Chosen
C
For office use onlyF1F2F3F4
2014 Mathematical Contest in Modeling (ICM) Summary Sheet
Summary
With the trend of globalization, interactions among people become increasinglyfrequent, leading to a fact that people nowadays are more eager than ever to knowtheir network, enhance their impact and eventually gain dominance in the network.Network science is such an emerging subject to analyze the social and researchnetwork.
In this paper, we first build the co-authorship network of researchers who hascollaborated with mathematician Paul Erdos. After analyzing the properties of thisnetwork, we build an Entropy-Weight-Based Gray Relational Analysis (EWGRA)model, a quantitative method for analyzing the correlation between two subjectsand could, to a large extent, avoid human interference in the weighting process. Weput classic centralities, including degree, betweenness and closeness, to the model,and innovatively combine the EWGRA with PageRank to take interactions betweenadjacent nodes into consideration. Applying this new model, we could obtain theresult that the most influential researcher in the co-authorship network is ALON,NOGA M. To evaluate the significance of research papers, we propose a Food ChainModel (FCM) measure, which simulates the nutrition-deriving procedure of food-chain in ecosystem. Then we feed the significance calculated by FCM together withother centrality measures to EWGRA model and get the result that the paper enti-tled Collective dynamics of ’small-world’ networks is the most influential researchpaper in the citation network.
We then extend our model to totally different areas. Building a network amongmen’s single tennis players, we develop a metric for player’s influence and use themodel to get the predicted influence rank of those players at the end of 2013, whichnicely conforms to the real rank. Furthermore, we make an analysis on how tomake use of the influence model to be more successful in career.
Although bearing some slight weaknesses, our model is merited in many as-pects. It comprehensively considered all the factors that could affect the networkinfluence and could be transplanted to other fields with minor modifications.
Network science is an emerging interdisciplinary subject that can be used to analyze thehidden influence factor of a network such as co-authorship network and other social networks.A list of researchers with co-author relationship is given and we are supposed to build the co-authorship network of them for further analysis. Given the network, an influence measure isneeded to determine the rank of influence factor of the researchers.
Whether a research paper is cited by important works is a typical metric to determine theinfluence of a paper, so that an algorithm is required to be used to seek the most influentialresearch paper in one scientific field. Such algorithm could also be transplanted to other socialand scientific area to conclude methodology for organizations and individuals to make wisedecisions.
2 Assumptions
• One researcher could be more influential if he collaborates with other researchers.
When two or more researchers cooperate, they are more likely to propose new findingsand get acquaintance with more researchers in their research field. These are facts thatmay make them more influential.
• Restricting the network in the small circle of the members we concern does not influencethe relative influence of the members.
In our discussion, the circle of members consist most of the influential members in thefield. So that the influences from outside world have tiny impact the members of thenetwork.
• If one research paper is cited by another influential paper, we could confer that the paperbeen cited also has great impact factor.
As we know that professional researchers hardly cite useless papers, if a paper is cited byan influential paper, it must have some contribution to the paper that cited it.
3 Notations
Notations Descriptions⇠i(k) the correlation coefficient of the kth measure of the ith evaluation objectx00(k) the best value of the kth measure⇢ recognition differentialHk the entropy of the kthmeasurew(k) the entropy weight of the kth measure
CD(ni) Degree centralityCC(ni) Closeness centralityCB(ni) Betweenness centralityd(ni, nj) the distance of ni between nj
Team # 24266 Page 5 of 17
4 Model design
4.1 Network analysis
4.1.1 Network Building
Figure 1: Co-authorship Network
As there are over 9,000 researchers in the Erdos1 table, we have to limit the size of thenetwork for more accurate analysis. We only retain the 511 researchers who have the co-authorrelationship with Erdos (Assumption 1). By regarding the researchers as nodes and the co-author relationships as links, we build the network in the right:
In Fig 1, The size of the nodes represent it’s degree and the nodes with the same degree isaligned in the same ray from the center of the circle.
4.1.2 Properties Analysis
Global Graph metrics:
Table 1: Matrix of NetworkProperties Diameter Mean node number of clustering
Small world: Our network has a clustering coefficient of 0.263, and a characteristic pathlength of 3.844. With a similarly sized connected random graph, the clustering coefficient is
Team # 24266 Page 6 of 17
0.31 and the characteristic path length is 3.66. This means that the co-authorship network ofErdos1 is a small world graph as can be expected.
Individual actor properties:
Table 2: Properties of Individual NodesProperties Closeness Betweenness PageRank Degree
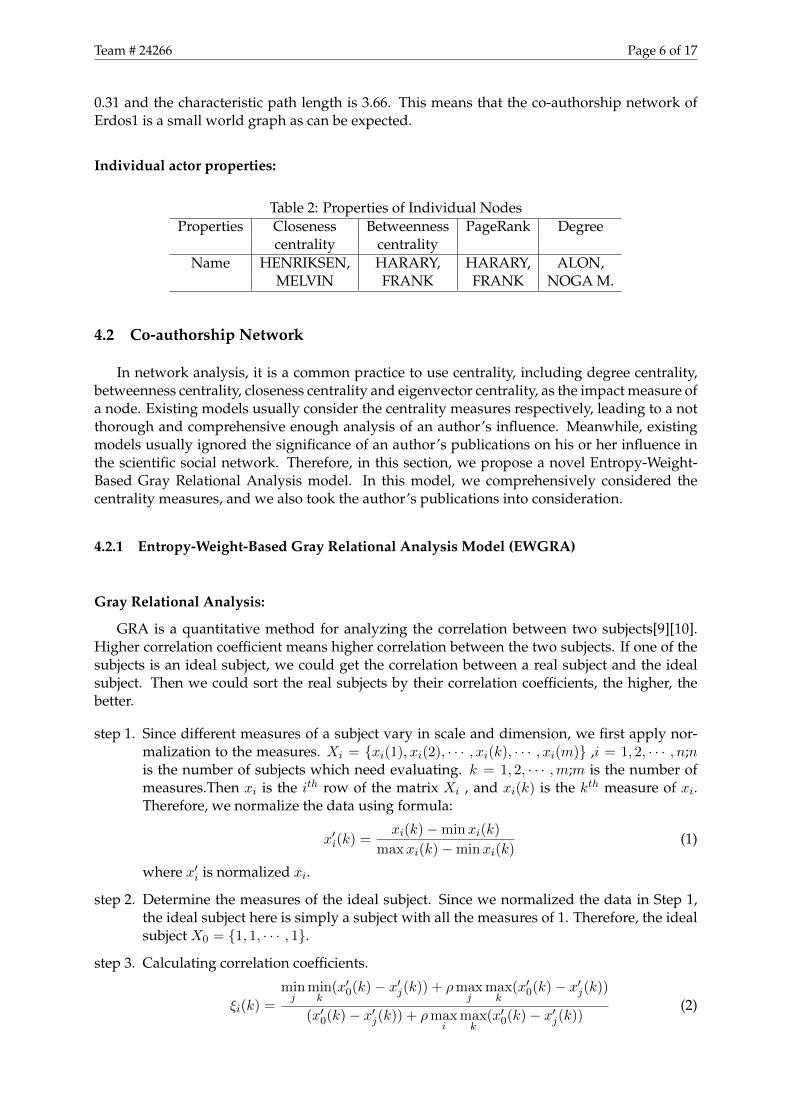
In network analysis, it is a common practice to use centrality, including degree centrality,betweenness centrality, closeness centrality and eigenvector centrality, as the impact measure ofa node. Existing models usually consider the centrality measures respectively, leading to a notthorough and comprehensive enough analysis of an author’s influence. Meanwhile, existingmodels usually ignored the significance of an author’s publications on his or her influence inthe scientific social network. Therefore, in this section, we propose a novel Entropy-Weight-Based Gray Relational Analysis model. In this model, we comprehensively considered thecentrality measures, and we also took the author’s publications into consideration.
4.2.1 Entropy-Weight-Based Gray Relational Analysis Model (EWGRA)
Gray Relational Analysis:
GRA is a quantitative method for analyzing the correlation between two subjects[9][10].Higher correlation coefficient means higher correlation between the two subjects. If one of thesubjects is an ideal subject, we could get the correlation between a real subject and the idealsubject. Then we could sort the real subjects by their correlation coefficients, the higher, thebetter.
step 1. Since different measures of a subject vary in scale and dimension, we first apply nor-malization to the measures. Xi = {xi(1), xi(2), · · · , xi(k), · · · , xi(m)} ,i = 1, 2, · · · , n;nis the number of subjects which need evaluating. k = 1, 2, · · · ,m;m is the number ofmeasures.Then xi is the ith row of the matrix Xi , and xi(k) is the kth measure of xi.Therefore, we normalize the data using formula:
x0i(k) =xi(k)�minxi(k)
maxxi(k)�minxi(k)(1)
where x0i is normalized xi.
step 2. Determine the measures of the ideal subject. Since we normalized the data in Step 1,the ideal subject here is simply a subject with all the measures of 1. Therefore, the idealsubject X0 = {1, 1, · · · , 1}.
step 3. Calculating correlation coefficients.
⇠i(k) =
min
jmin
k(x00(k)� x0j(k)) + ⇢max
jmax
k(x00(k)� x0j(k))
(x00(k)� x0j(k)) + ⇢max
imax
k(x00(k)� x0j(k))
(2)
Team # 24266 Page 7 of 17
in this equation, i = 1, 2, · · · , n; k = 1, 2, · · · ,m. Besides, ⇠i(k) represents the correlationcoefficient of the kth measure of the ith evaluation object; x00(k) represents the best valueof the kth measure; ⇢ is the recognition differential, using to improve the significance ofthe difference between the coefficients of correlation. We usually assign 0.5 to it.
In information theory, entropy is a measure of uncertainty in the information content[10].The lower the entropy of the information is, the higher the usefulness of the information. Byapplying entropy into our model, we could avoid taking artifact factors into the consideration.
In a given problem where there are n evaluation objects and m measures. The kth entropyis defined by:
Hk = �pnX
j=1
fkj ln fkj (4)
fkj =
x0ikjPnj=1 x
0ikj
(5)
p = 1/ lnn (6)
Besides, k = 1, 2, · · · ,m; x0ikj represents the normalization of the kth measure of the jth evalua-tion objects. And then the entropy weight of the kth measure can be calculated by :
w(k) =
1HkPm
k=11Hk
(7)
mX
k=1
w(k) = 1 (8)
w(k) is the weight of the kth measure; Hk is the entropy of the kth measure.As mentioned above,the entropy and weight are of antidependence relationship.
4.2.2 EWGRA Based Influence Model for Coauthor Network
Centrality Measures
It is proved that a person in central position can influence the group by withholding or dis-torting information in transmission[8]. Therefore, we should consider centrality measures[4]in our model. Meanwhile, as mentioned above, an author’s influence is also determined by anauthor’s publications, and hence, we also take the total number of publications of an author,the maximum citation of an author, and the total citations of an author into consideration.
Team # 24266 Page 8 of 17
• Degree centrality This equals the number of ties that a node has with other nodes. Nodeswith higher degree usually have more impact in the network. In this case, the higher de-gree an author has indicates that he or she actively cooperates with others, and, therefore,it is more probable for him or her to exert impact on others.
CD(ni) = d(ni) (9)
where d(ni) is the degree of the node ni.
• Closeness centrality This measures the geodesic distance from each node to others andfocuses on the extent of influence over the entire network. In this case, it is a metric of“how long it will take information to spread from a given author to others in the networ”.
CC(ni) =
NX
i=1
1
d(ni, nj)(10)
• Betweenness centrality This is based on the number of shortest paths passing througha node. Nodes with higher betweenness are“pivot points of knowledge flow in the net-wor”, and it represents the interdisciplinarity of scholars in the co-author network.
CB(ni) =
X
j,k 6=i
gjikgjk
(11)
In this equation, gjk is the geodesic distance. between the vertices of j and k.
• Eigenvector centrality and PageRank[7] Eigenvector centrality is based on the idea thatthe importance of a node depends on the importance of its neighbors. However, it ne-glects the fact that nodes with more adjacent nodes should exert less influence on eachof its adjacent nodes. Therefore, we take advantage of PageRank, which is the principaleigenvector of the transition matrix M:
Mij =1� d
N+ d
1
C(pi)Aij ,
and therefore can be seen as a variation of eigenvector centrality.
• Number of publications This is the total number of publications published by the author.
• Maximum Citation This is the number of citation of the paper that is cited by most otherpapers.
• Total Citations This is the total number of times that the papers of the author are citedfor.
Experiment
In this model, we’ve got 7 parameters(measures).We collected 511 data records of numberof publications, maximum citation, and total citations from MathSciNet[2]. Put the networkdata from the question 1 into the model, we then could get the respective measures of eachnode(see Table 3). Then we calculate the correlation coefficients, and sort the data (see Table 4).
HENRIKSEN, MELVIN HARARY, FRANK* ALON, NOGA M. ALON, NOGA M.GILLMAN, LEONARD SOS, VERA TURAN GRAHAM, RONALD LEWIS GRAHAM, RONALD LEWIS
BOES, DUANE CHARLES STRAUS, ERNST GABOR* HARARY, FRANK* HARARY, FRANK*GAAL, STEVEN A. RUBEL, LEE ALBERT* RODL, VOJTECH RODL, VOJTECHSCHERK, PETER* POMERANCE, CARL BERNARD TUZA, ZSOLT TUZA, ZSOLTHERZOG, FRITZ* ALON, NOGA M. SOS, VERA TURAN SOS, VERA TURAN
BONAR, DANIEL DONALD GRAHAM, RONALD LEWIS BOLLOBAS, BELA BOLLOBAS, BELACARROLL, FRANCIS WIILLIAM FUREDI, ZOLTAN FUREDI, ZOLTAN FUREDI, ZOLTAN
DARLING, DONALD A. PACH, JANOS SPENCER, JOEL H. SPENCER, JOEL H.VAN KAMPEN, EGBERTUS RUDOLF* HAJNAL, ANDRAS POMERANCE, CARL BERNARD PACH, JANOS
WINTNER, AUREL FRIEDRICH* BOLLOBAS, BELA PACH, JANOS CHUNG, FAN RONG KINGHUNT, GILBERT AGNEW TUZA, ZSOLT HAJNAL, ANDRAS HAJNAL, ANDRAS
SIRAO, TUNEKITI RUZSA, IMRE Z. CHUNG, FAN RONG KING LOVASZ, LASZLOBAGEMIHL, FREDERICK ODLYZKO, ANDREW MICHAEL STRAUS, ERNST GABOR* FAUDREE, RALPH JASPER, JR.
KHARE, SATGUR PRASAD SARKOZY, ANDRAS SARKOZY, ANDRAS POMERANCE, CARL BERNARDSMITH, BRENT PENDLETON KLEITMAN, DANIEL J. LOVASZ, LASZLO NESETRIL, JAROSLAV
DARST, RICHARD BRIAN SPENCER, JOEL H. NESETRIL, JAROSLAV KLEITMAN, DANIEL J.FELLER, WILLI K. (WILLIAM)* RODL, VOJTECH FAUDREE, RALPH JASPER, JR. SZEMEREDI, ENDREJACKSON, STEPHEN CRAIG SCHINZEL, ANDRZEJ KLEITMAN, DANIEL J. GYARFAS, ANDRAS
VIJAYAN, KAIPILLIL SHIELDS, ALLEN LOWELL* SZEMEREDI, ENDRE STRAUS, ERNST GABOR*
Table 4: Rank by Correlation CoefficientsRank GRA Name
1 0.730005579 ALON, NOGA M.2 0.602836556 HARARY, FRANK*3 0.588431962 GRAHAM, RONALD LEWIS4 0.565383561 BOLLOBAS, BELA5 0.546964138 RODL, VOJTECH6 0.545439769 SHELAH, SAHARON7 0.51811051 LOVASZ, LASZLO8 0.511504097 TUZA, ZSOLT9 0.505746662 SPENCER, JOEL H.10 0.503490531 FUREDI, ZOLTAN11 0.499874352 SOS, VERA TURAN12 0.487420155 HENRIKSEN, MELVIN13 0.48300931 PACH, JANOS14 0.475723158 CHUNG, FAN RONG KING15 0.46562863 SZEMEREDI, ENDRE16 0.461775187 NESETRIL, JAROSLAV17 0.460549514 POMERANCE, CARL BERNARD18 0.458779327 GILLMAN, LEONARD19 0.457257127 FAUDREE, RALPH JASPER, JR.20 0.457006357 HAJNAL, ANDRAS
Result Analysis
We use SPSS to do Spearman analysis to analyze the sort result of the correlation coeffi-cients and the sort result of other common measures. The result (see Table 5) presents that ourmeasure is plausible.
Table 5: Correlations Sig.Name Spearman’s rho Sig.
Total Publication 0.020Max Reference 0.095Total Reference 0.044
4.3 Determine Model for Networks
When analyzing the significance of a research paper, some important works that followfrom it could be utilized as a measure. In this section, we collect 327 important papers thatfollow the fundamental set of publications and construct a citation network among them. Then,
Team # 24266 Page 10 of 17
we propose a Food Chain Model to measure the significance of a paper basing on its followersand evaluate the relative influence of the fundamental papers.
4.3.1 Food Chain Model (FCM)
Food Chain Model (FCM) is inspired by the ecosystem. The significance of first-comers(fundamental papers) feeds on that of the latter-comers (following papers).
step 1. Normalization. In order to make the FCM significance standardized, which means tomake the FCM significance of different papers possible to compare with each other, weneed to first normalize the latter-comers’ significance before calculating. The normal-ization formula is:
x0i =xi �minxi
maxxi �minxi(12)
where x0i is the normalized xi.
step 2. Calculation. The first-comer significance is calculated simply by add up the normalizedFCM significance.
Since citation network could be abstracted as a tree structure, the model could be applied ina level-to-level bottom-up manner. We assume that the leaf nodes, which are almost the latest-comers, have the FCM significance of 0 and nodes of which all children are leaf nodes have theFCM significance of normalized citations per year.
4.3.2 Experiment
Data Source
We collected 811 data records made up by 327 research papers following the fundamentalpaper set from Google Scholar[3]. Our criteria for choosing these papers are based on the rulethat important works should be cited more than 500 times. Our fundamental paper set consistsof 18 papers, 16 of them are from the paper set provided by the problem description, and theother 2 are papers of high citation (more than 10,000 times) in the Network Science field andfollow the provided fundamental papers .
Table 6: Fundamental Papers in Network Science Fieldreference name
A family of measuresCollective dynamics of ’small-world’ networks
Community structure in social and biological networksEmergence of scaling in random
Exploring complex networksIdentifying sets of key players in a network
Identity and search in social networksModels of core/periphery structures
Navigation in a small worldNetworks, influence, and public opinion formation
On properties of a well-known graph or what is your ramsey number?On random graphs
Scientific collaboration networks. II. Shortest paths, weighted networks, and centralitySocial network thresholds in the diffusion of innovations
Statistical mechanics of complex networksStatistical models for social networks
The structure and function of complex networksThe structure of scientific collaboration networks.
Team # 24266 Page 11 of 17
Figure 2: Citation Network of Research Papers
Model calculation
• FCM Since our major concern is the relative influence of papers in the fundamental set,we treat every paper outside the fundamental set as a node of which the children are allleaf nodes for simplicity. Then, we could get the FCM significance for each node in thenetwork.
• Centrality Measures Then, we calculate the centrality measures including degree cen-trality and closeness centrality. Betweenness is ignored here since the citation network isunidirectional, and the betweenness is meaningless in the network.
• EWGAR Finally, we put the centrality measures and FCM significance into EWGAR mod-el and get the relative ranking as follow(see Table7)
Team # 24266 Page 12 of 17
Table 7: Rank of Influence Measures of Fundamental PapersRank Label GRA
1 Collective dynamics of ‘small-world’ networks 0.8281915662 Emergence of scaling in random 0.6385347993 Identity and search in social networks 0.5653885834 A family of measures 0.5255243825 Community structure in social and biological networks 0.491090656 The structure of scientific collaboration networks 0.4730754667 Navigation in a small world 0.4692853738 The structure and function of complex networks 0.4657747069 On Random Graphs 0.455678303
10 Exploring complex networks 0.45383002211 Statistical mechanics of complex networks 0.4516943812 Scientific collaboration networks. II. Shortest paths, weighted networks, and centrality 0.4418791813 Models of core/periphery structures 0.37098800414 Social network thresholds in the diffusion of innovations 0.37070622815 Networks, influence, and public opinion formation 0.36931776416 Identifying sets of key players in a network 0.33333333317 On properties of a well-known graph or what is your ramsey number? 0.33333333318 Statistical models for social networks 0.333333333
Result
In the EWGAR model, several measures was considered and their final weight is listedbelow:
Table 8: Weight of MeasuresDegree Closeness Centrality Cite Weight
0.264753 0.33200714 0.40323985
Methodology
The EWGAR model could be used to measure networks other than citation network as longas members of the network have analogous relationship with the citation network. We wouldneed the following data: the relationship of the members including the nodes and weight ofthe links, the initial values of their influence or measures that could be regard as their influ-ence. For example, if we want to measure the impact of a university, we would need to build anetwork of universities by gathering such information like the number of academic activities auniversity held and participate, the number and quality of research papers that several univer-sities collaborated and the rank of comprehensive strength of universities. With these data, wecould analyze the network of universities and get the final rank of influence of universities.
4.4 Tennis Player Network Analysis
Tennis is a highly professionalized sports game. Tennis players need to pay for their train-ing team, including salaries, travelling allowance, and etc. of the team members. Therefore, itis crucial for the professional tennis players to fully mine their commercial potentials. As theircommercial value is based on their influence, it is necessary for them to know their influences.In this section, we extend our model to the field to men’s professional tennis and try to analyzethe relative influence among the top 15 players.
Team # 24266 Page 13 of 17
4.4.1 Tennis Player Influence Metric
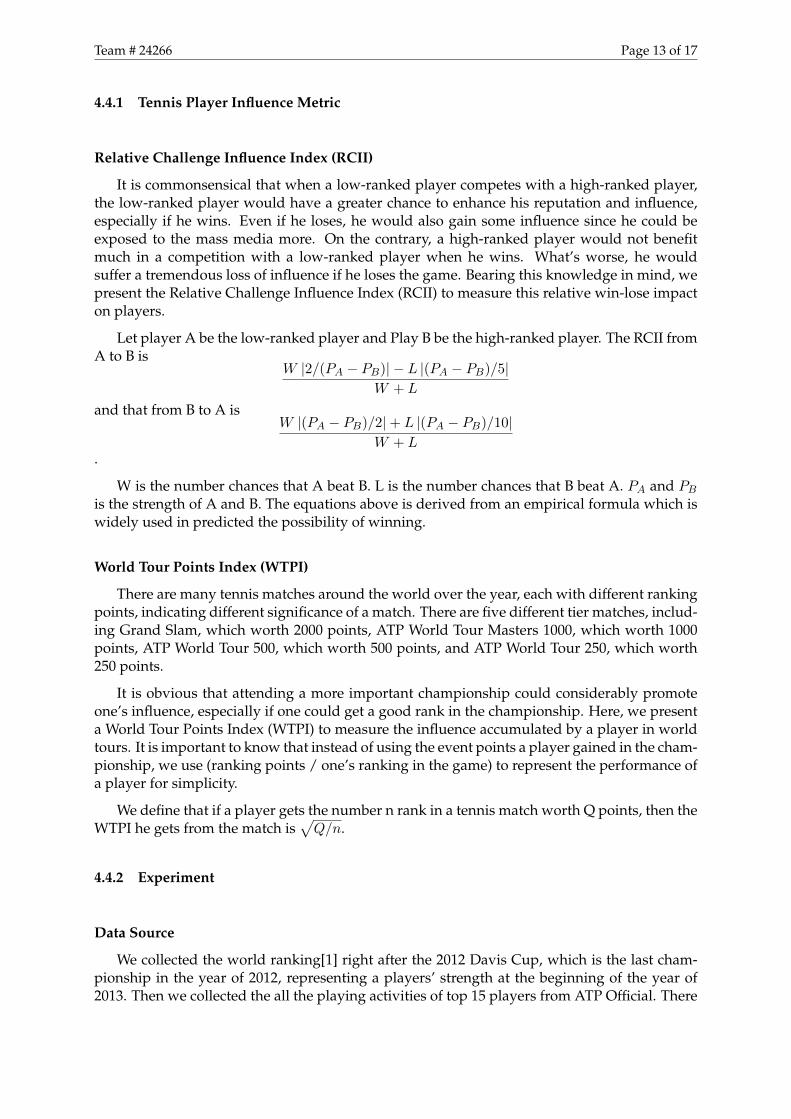
Relative Challenge Influence Index (RCII)
It is commonsensical that when a low-ranked player competes with a high-ranked player,the low-ranked player would have a greater chance to enhance his reputation and influence,especially if he wins. Even if he loses, he would also gain some influence since he could beexposed to the mass media more. On the contrary, a high-ranked player would not benefitmuch in a competition with a low-ranked player when he wins. What’s worse, he wouldsuffer a tremendous loss of influence if he loses the game. Bearing this knowledge in mind, wepresent the Relative Challenge Influence Index (RCII) to measure this relative win-lose impacton players.
Let player A be the low-ranked player and Play B be the high-ranked player. The RCII fromA to B is
W |2/(PA � PB)|� L |(PA � PB)/5|W + L
and that from B to A isW |(PA � PB)/2|+ L |(PA � PB)/10|
W + L.
W is the number chances that A beat B. L is the number chances that B beat A. PA and PB
is the strength of A and B. The equations above is derived from an empirical formula which iswidely used in predicted the possibility of winning.
World Tour Points Index (WTPI)
There are many tennis matches around the world over the year, each with different rankingpoints, indicating different significance of a match. There are five different tier matches, includ-ing Grand Slam, which worth 2000 points, ATP World Tour Masters 1000, which worth 1000points, ATP World Tour 500, which worth 500 points, and ATP World Tour 250, which worth250 points.
It is obvious that attending a more important championship could considerably promoteone’s influence, especially if one could get a good rank in the championship. Here, we presenta World Tour Points Index (WTPI) to measure the influence accumulated by a player in worldtours. It is important to know that instead of using the event points a player gained in the cham-pionship, we use (ranking points / one’s ranking in the game) to represent the performance ofa player for simplicity.
We define that if a player gets the number n rank in a tennis match worth Q points, then theWTPI he gets from the match is
pQ/n.
4.4.2 Experiment
Data Source
We collected the world ranking[1] right after the 2012 Davis Cup, which is the last cham-pionship in the year of 2012, representing a players’ strength at the beginning of the year of2013. Then we collected the all the playing activities of top 15 players from ATP Official. There
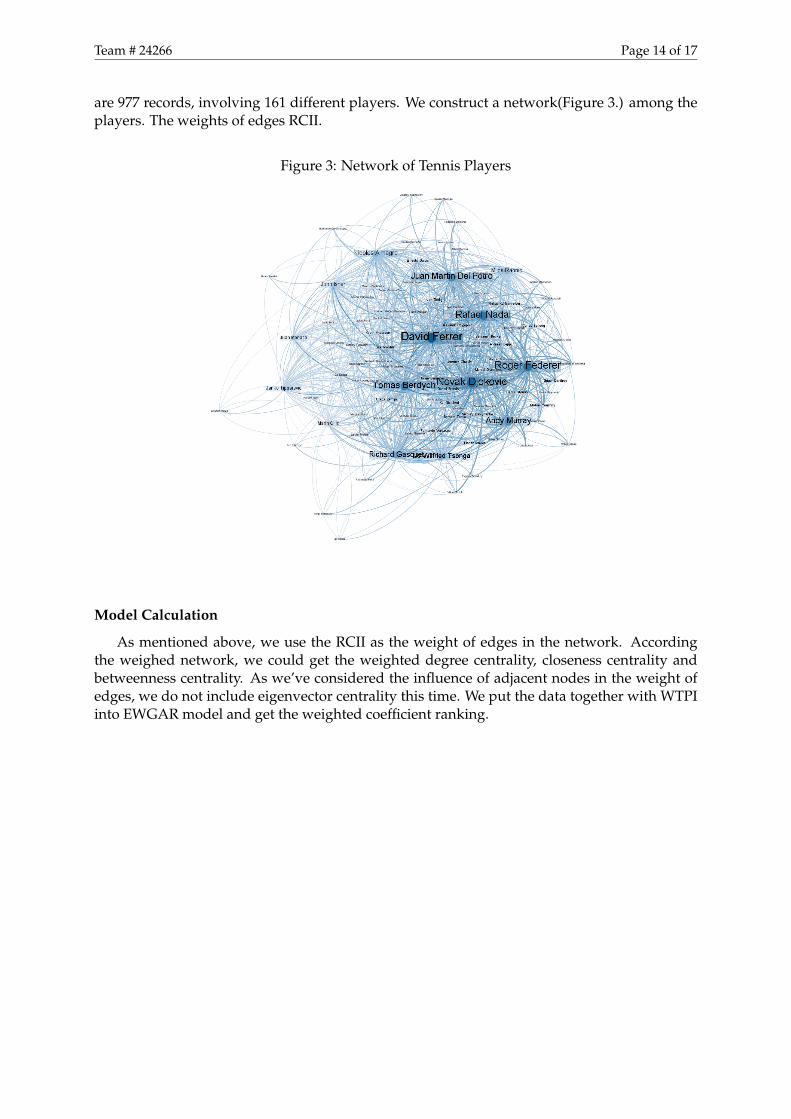
Team # 24266 Page 14 of 17
are 977 records, involving 161 different players. We construct a network(Figure 3.) among theplayers. The weights of edges RCII.
Figure 3: Network of Tennis Players
Model Calculation
As mentioned above, we use the RCII as the weight of edges in the network. Accordingthe weighed network, we could get the weighted degree centrality, closeness centrality andbetweenness centrality. As we’ve considered the influence of adjacent nodes in the weight ofedges, we do not include eigenvector centrality this time. We put the data together with WTPIinto EWGAR model and get the weighted coefficient ranking.
Team # 24266 Page 15 of 17
Table 9: Ranks of Tennis Playersname GRA GRA rank real rank
Rafael Nadal 0.840016376 1 1David Ferrer 0.673792761 2 3
We use SPSS to make a Spearman analysis between the ranking after 2013 Davis Cup andthe ranking predicated by our model, the Spearman’s rho Sig. is 0, which means our modelsuited the real-world condition accurately.
4.5 the Science, Understanding and Utility of Networks
With the information explosion of human society, the connections between people, eitherin scientific field or social relationship, is becoming increasingly complex. By studying theproperties and characteristics of networks, some hidden information could be dug out fromthe complex representations.
In our model, every member of any social groups, as long as they have the collaborationrelationship or citation relationship, has weighted influences to others. We could dig out the in-fluence measures which represent the impact of an individual or organization by analyzing theinformation of the network using the algorithm we proposed. After getting the measures, wecould easily find out the researchers or companies with marked impact and determine whomor which company to cooperate with. For example, when looking for co-authors, we can use anappropriate algorithm and measures to determine which researcher has the most remarkableimpact in our research field and he/she should be the one that we have the greatest enthu-siasm to cooperate with. Just take our model as an example. We developed a new influencemeasure-GRA, as stated before, which consider the Closeness Centrality, Betweenness Central-ity, PageRank and Degree of a network. These indexes of the network represent the efficiencyof spreading information, the potential of a point for control of communication, the impor-tance of its neighbors and the tendency to have more links to others respectively. We apply thegray relational analysis model to mix these indexes to get our final measure-GRA which couldaccurately determine the most remarkable researcher.
Team # 24266 Page 16 of 17
5 Sensitive Analysis
Considering that there might be some faults in our data and the list of members and linksin a network might be incomplete, our model should be robust enough to cope with suchproblems. Now we provide a reasonable scenario for test.
Dr. Who was a coeval mathematician with Paul Erdos, but he was a mysterious personand no one knows his real identity. He was idiosyncratic in cooperating with others. He onlycooperated with scientists whose Erdos Number is 1 and he only cooperated with 10 scientistsduring his life. He published 75 papers. The maximum citation per paper is 76. And his paperswere cited 450 times totally. All the 4 numbers (10, 75, 76, 450) are the average number of thoseof other scientists. Due to some reasons, we forget to take him into considerations. Now, weinclude Dr. Who into our analysis. The result we got is listed below:
Table 10: the Rank Before and After Inserting New DataBefore After
ALON, NOGA M. ALON, NOGA M.HARARY, FRANK* HARARY, FRANK*
GRAHAM, RONALD LEWIS GRAHAM, RONALD LEWISBOLLOBAS, BELA BOLLOBAS, BELA
SOS, VERA TURAN RODL, VOJTECHRODL, VOJTECH SHELAH, SAHARON
POMERANCE, CARL BERNARD SPENCER, JOEL H.LOVASZ, LASZLO FUREDI, ZOLTANSPENCER, JOEL H. SOS, VERA TURANFUREDI, ZOLTAN HENRIKSEN, MELVIN
PACH, JANOS PACH, JANOSHENRIKSEN, MELVIN CHUNG, FAN RONG KING (GRAHAM)
HAJNAL, ANDRAS SZEMEREDI, ENDRESTRAUS, ERNST GABOR* NESETRIL, JAROSLAV
CHUNG, FAN RONG KING (GRAHAM) POMERANCE, CARL BERNARDNESETRIL, JAROSLAV GILLMAN, LEONARDKLEITMAN, DANIEL J. FAUDREE, RALPH JASPER, JR.GILLMAN, LEONARD HAJNAL, ANDRAS
We use SPSS to do Spearman analysis to analyze the two result. The result-Correlation Sig.is 0.01-presents that our model is stable.
6 Strength and Weakness
6.1 Strength
• Our model takes all sorts of factors that may influence the impact measure of networkmembers in to consideration comprehensively.
• Our model could determine the influence measure of members in any networks as far asthe data of relationship is available.
6.2 Weakness
The influence measure of in a network can be affect by some other factors other than col-laboration relationship, such like the media impact and the influence of big events. Although
Team # 24266 Page 17 of 17
such factors could be represented as a parameter and then added to our model, we have notdone it yet. So our model cannot eliminate the influence of these impact factors.
References
[1] Official Men’s Tennis Rankings, http://www.atpworldtour.com/Rankings/Rankings-Home.aspx/
[2] MathSciNet, http://www.ams.org/mathscinet/
[3] Google Scholar, http://scholar.google.com/
[4] Yan, E., Ding, Y. (2009). “Applying centrality measures to impact analysis: A coauthorshipnetwork analysis. ” Journal of the American Society for Information Science and Technology,60(10), 2107-2118.
[5] BÃurner, K., Dall’Asta, L., Ke, W., Vespignani, A. (2005). Studying the emerging globalbrain: Analyzing and visualizing the impact of co-authorship teams. Complexity, 10(4),57-67.
[6] Liu, X., Bollen, J., Nelson, M. L., Van de Sompel, H. (2005). Co-authorship networks in thedigital library research community. Information processing management, 41(6), 1462-1480.
[7] Brin, S., Page, L. (1998). The anatomy of a large-scale hypertextual Web search engine.Computer networks and ISDN systems, 30(1), 107-117.
[8] Freeman, L. C. (1979). Centrality in social networks conceptual clarification. Social network-
s, 1(3), 215-239.
[9] Kuo, Y., Yang, T., Huang, G. W. (2008). The use of grey relational analysis in solving mul-tiple attribute decision-making problems. Computers Industrial Engineering, 55(1), 80-93.
[10] Deng, J. L. (1989). Introduction to grey system theory. The Journal of grey system, 1(1), 1-24.